
Wearable Spine Tracker vs. Video-Based Pose Estimation for Human Activity Recognition


Abstract
1. Introduction
- develop a recording protocol for selected ADLs,
- provide a synchronized ADL dataset for FlexTail and camera data,
- determine the optimal window size for time series classification (TSC),
- compare TSC classifiers for FlexTail and camera data,
- evaluate the feasibility of the FlexTail device for HAR and
- determine the system’s performance using scores.
2. Methodology
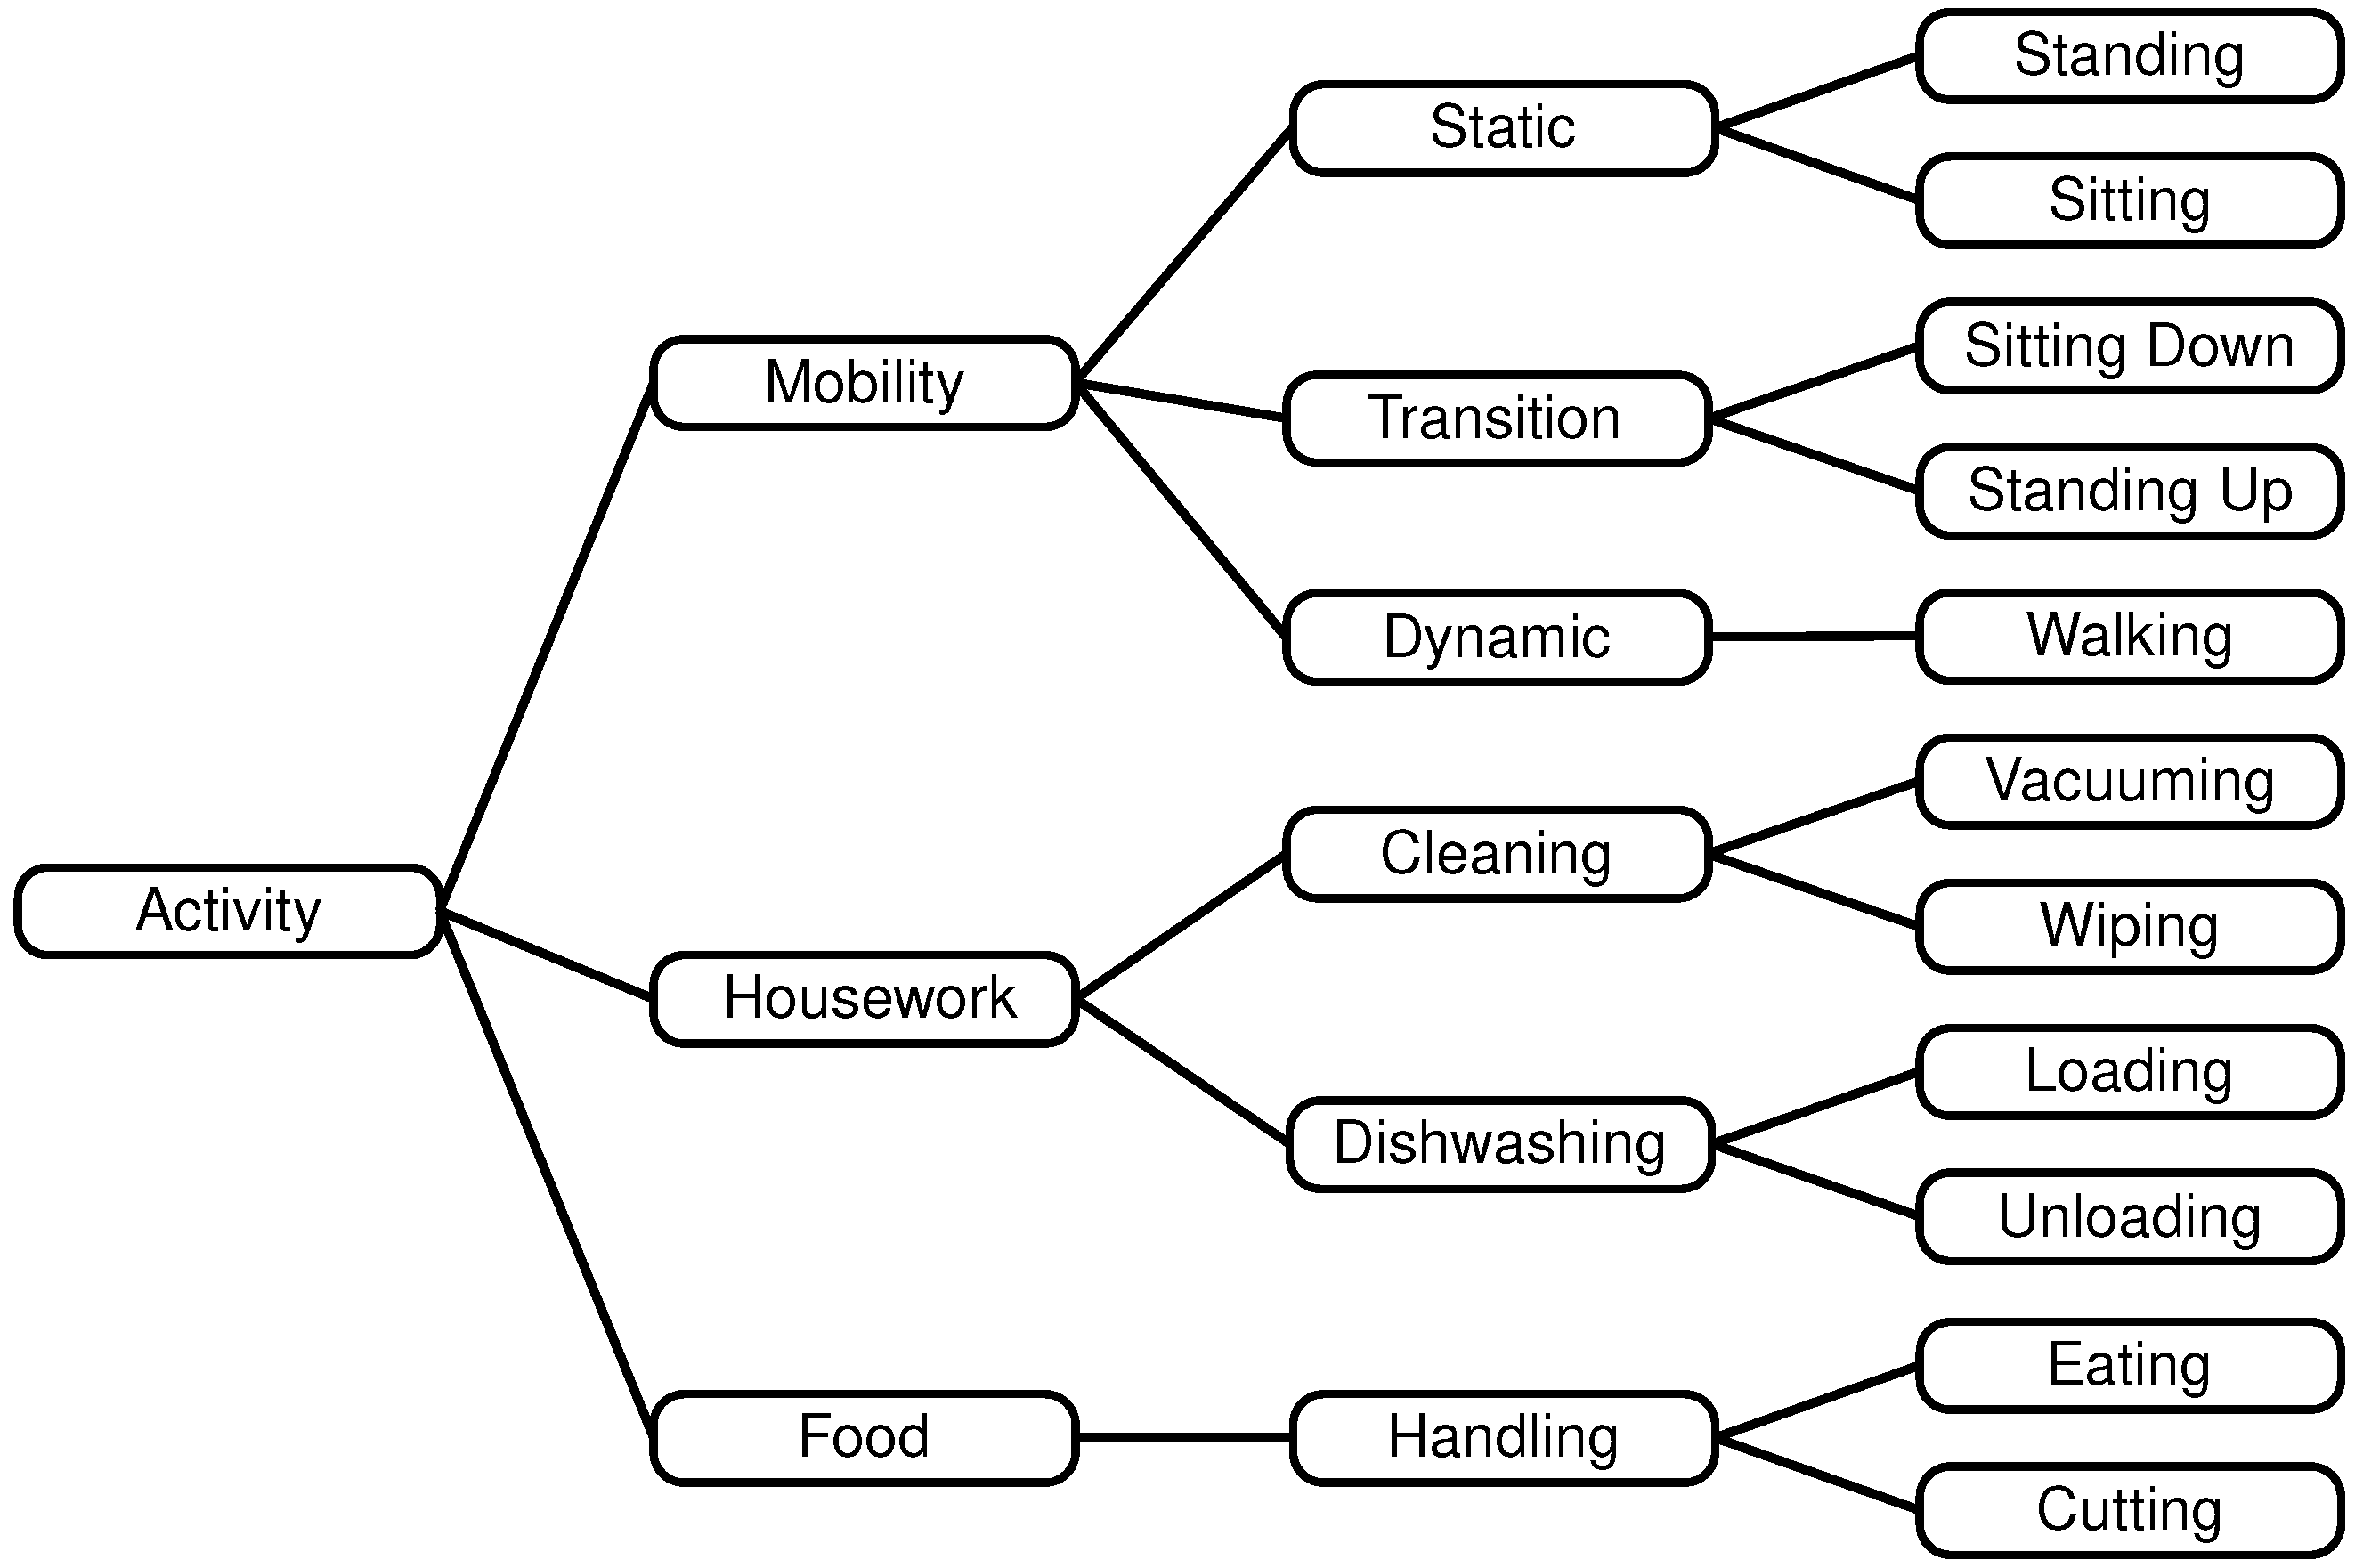
2.1. Activities
- Mobility (static, transition, dynamic),
- Housework (cleaning, handling dishwashing), and
- Food (cutting, eating)
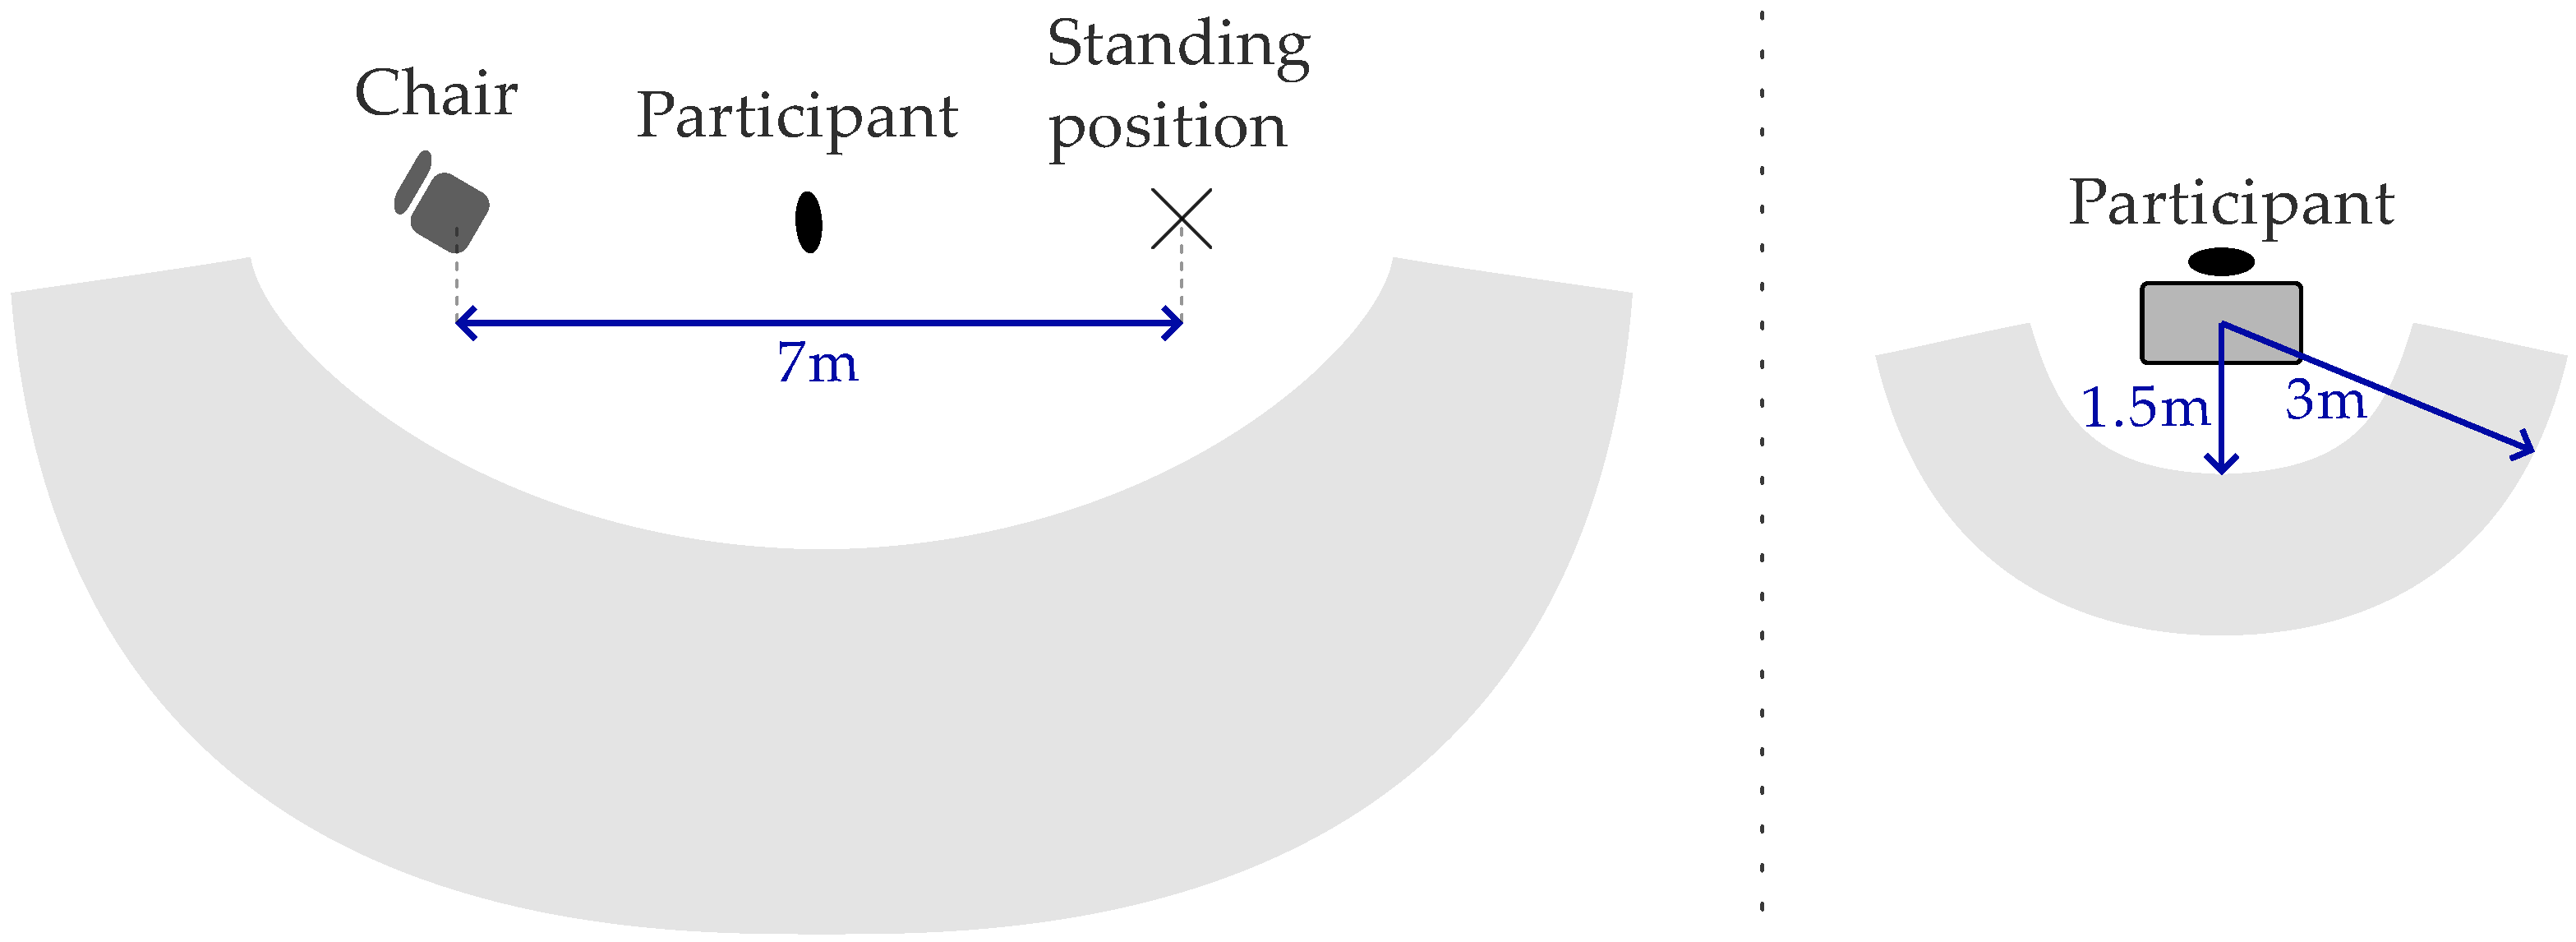
2.2. Protocol
2.3. Data Collection
2.3.1. Video
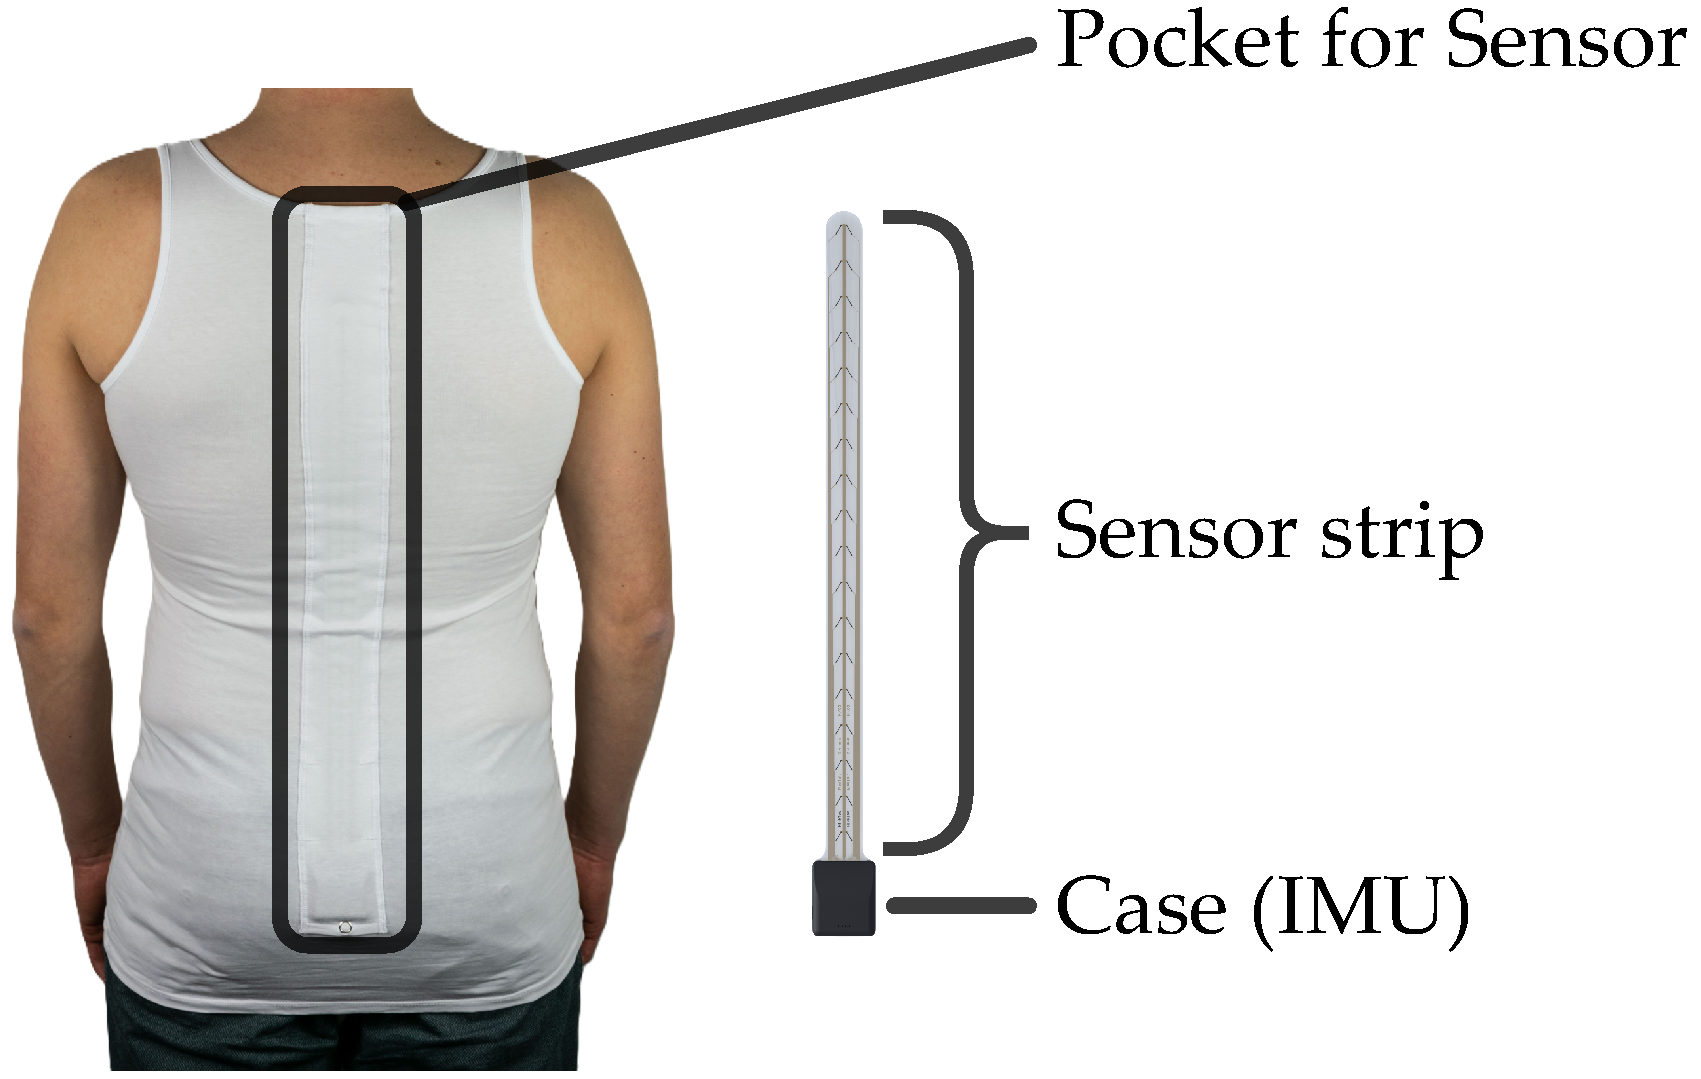
2.3.2. FlexTail
2.4. Data Processing
2.4.1. Labeling
2.4.2. Video
2.4.3. FlexTail
2.5. Classifier
2.6. Training
2.7. Activity Grouping
3. Results
3.1. Classifiers and Window Sizes
3.2. Confusion Matrices
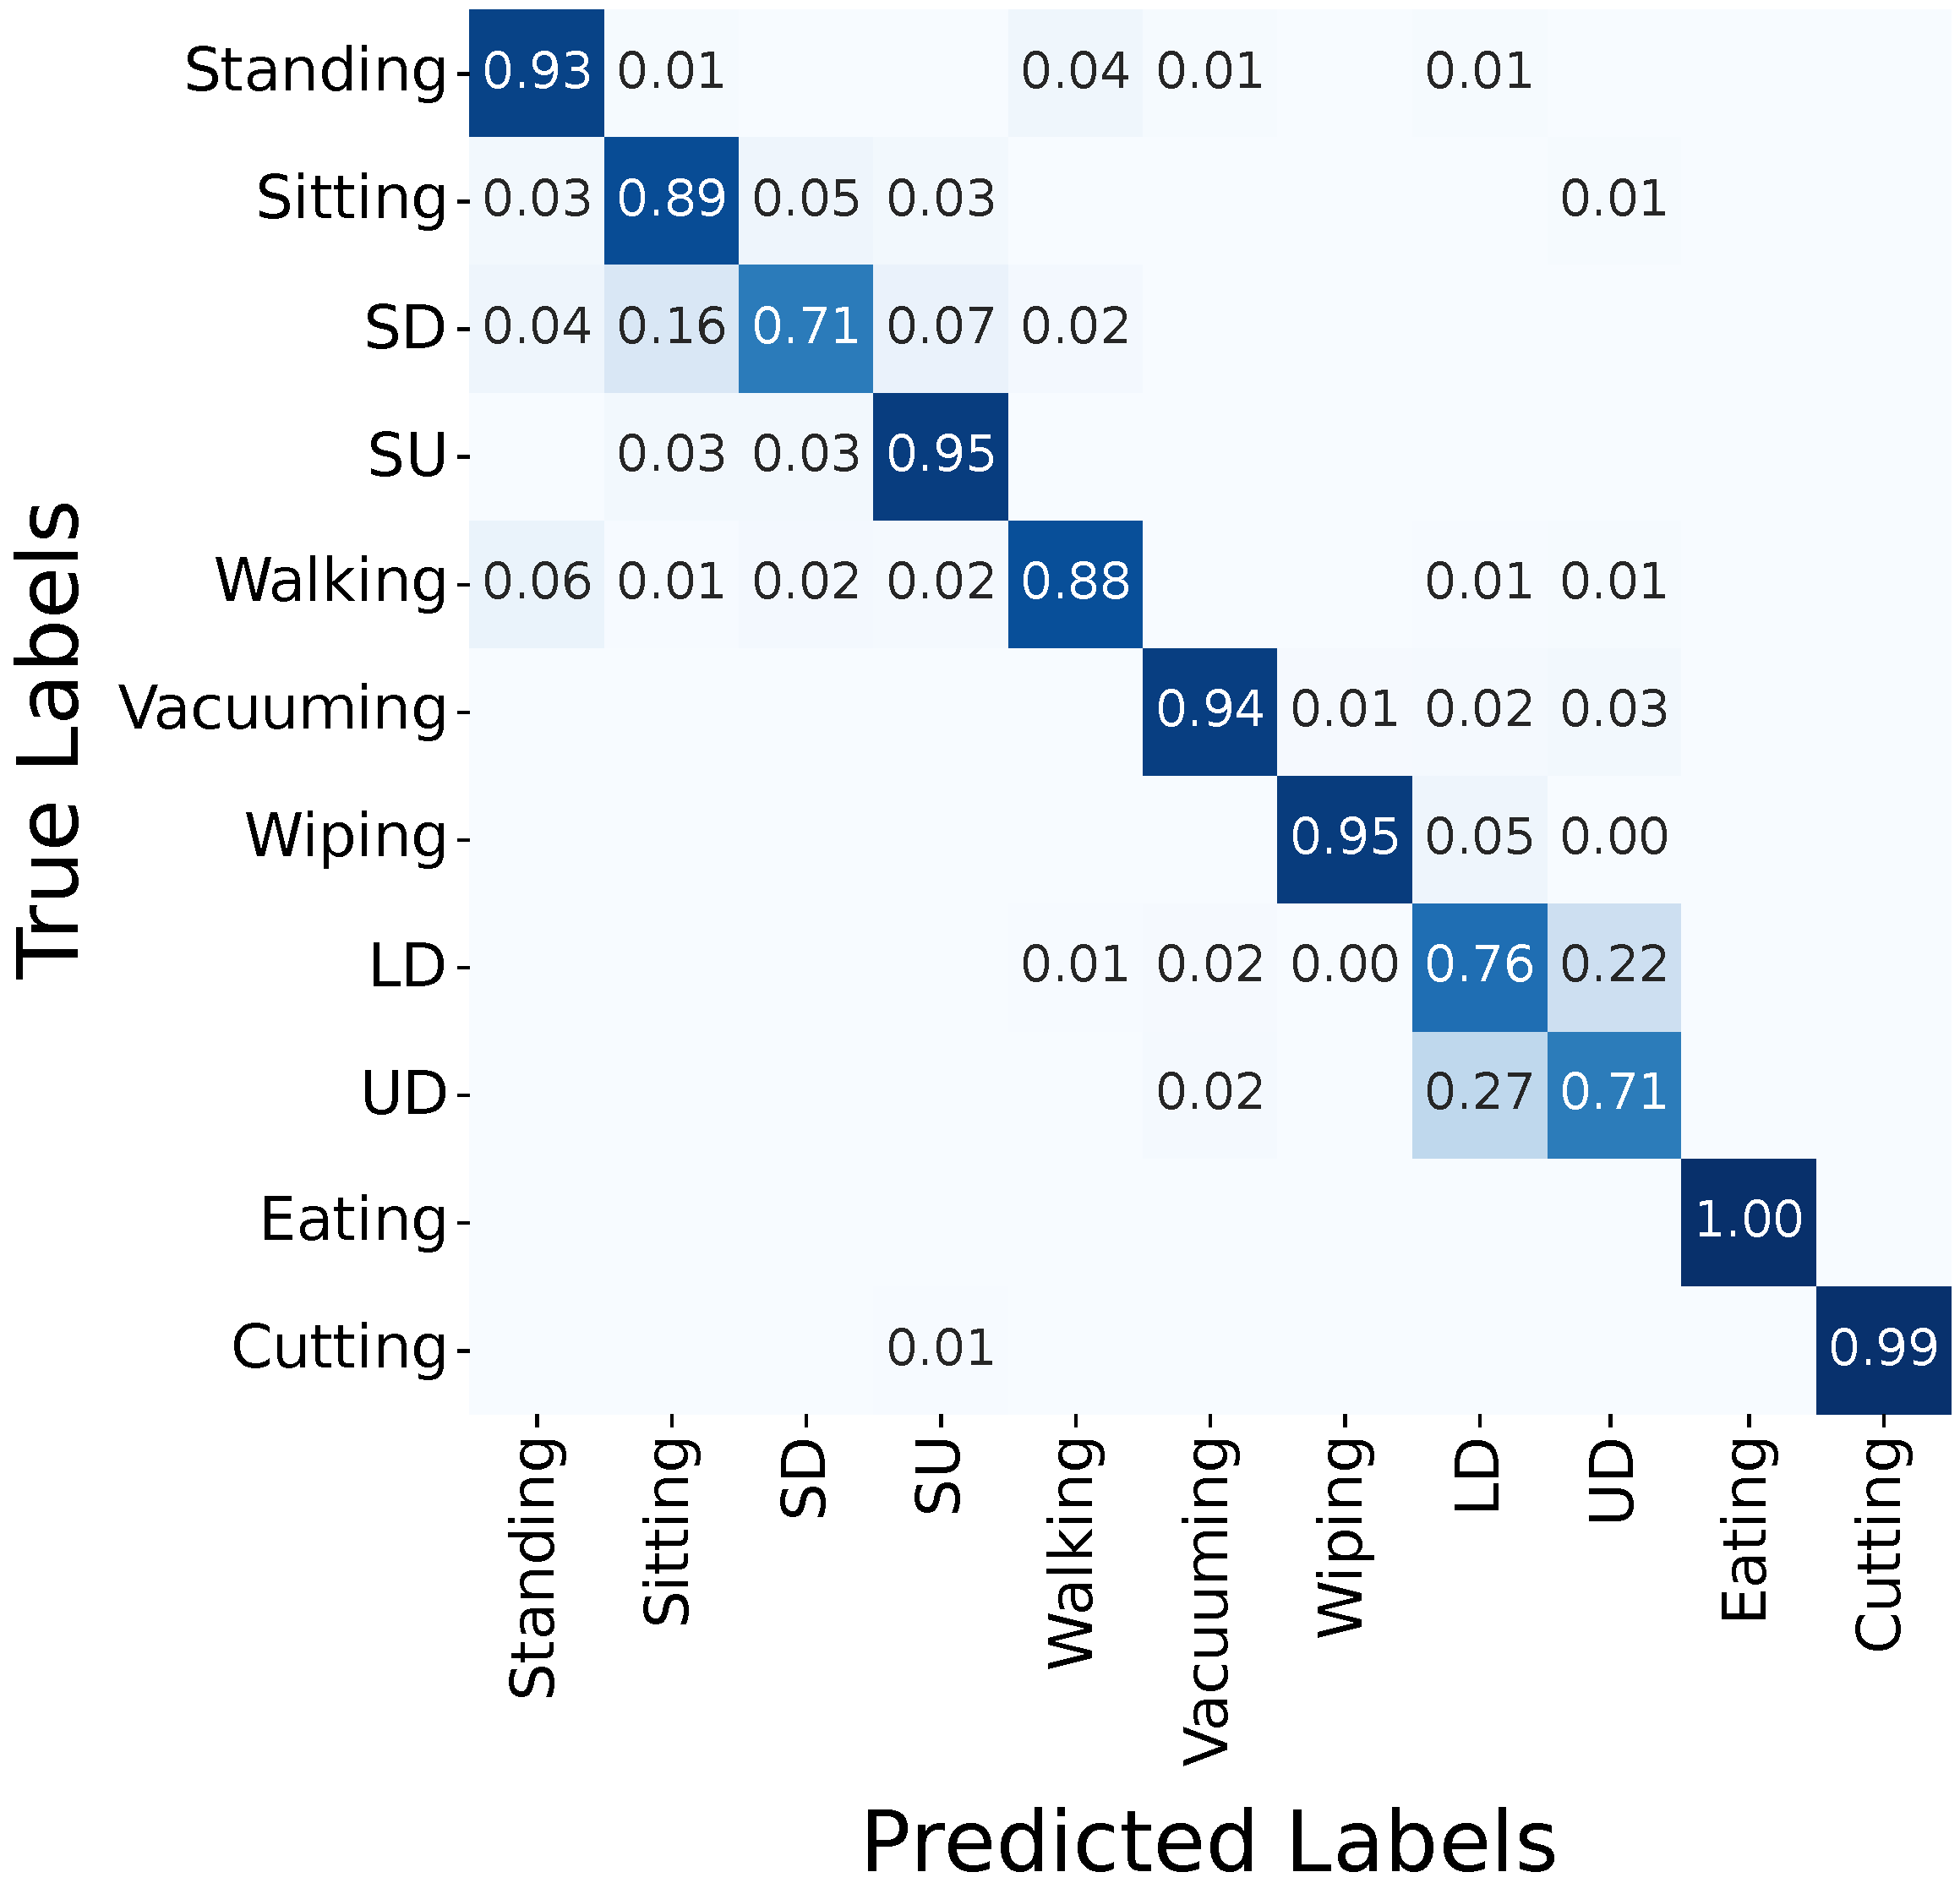
3.2.1. FlexTail
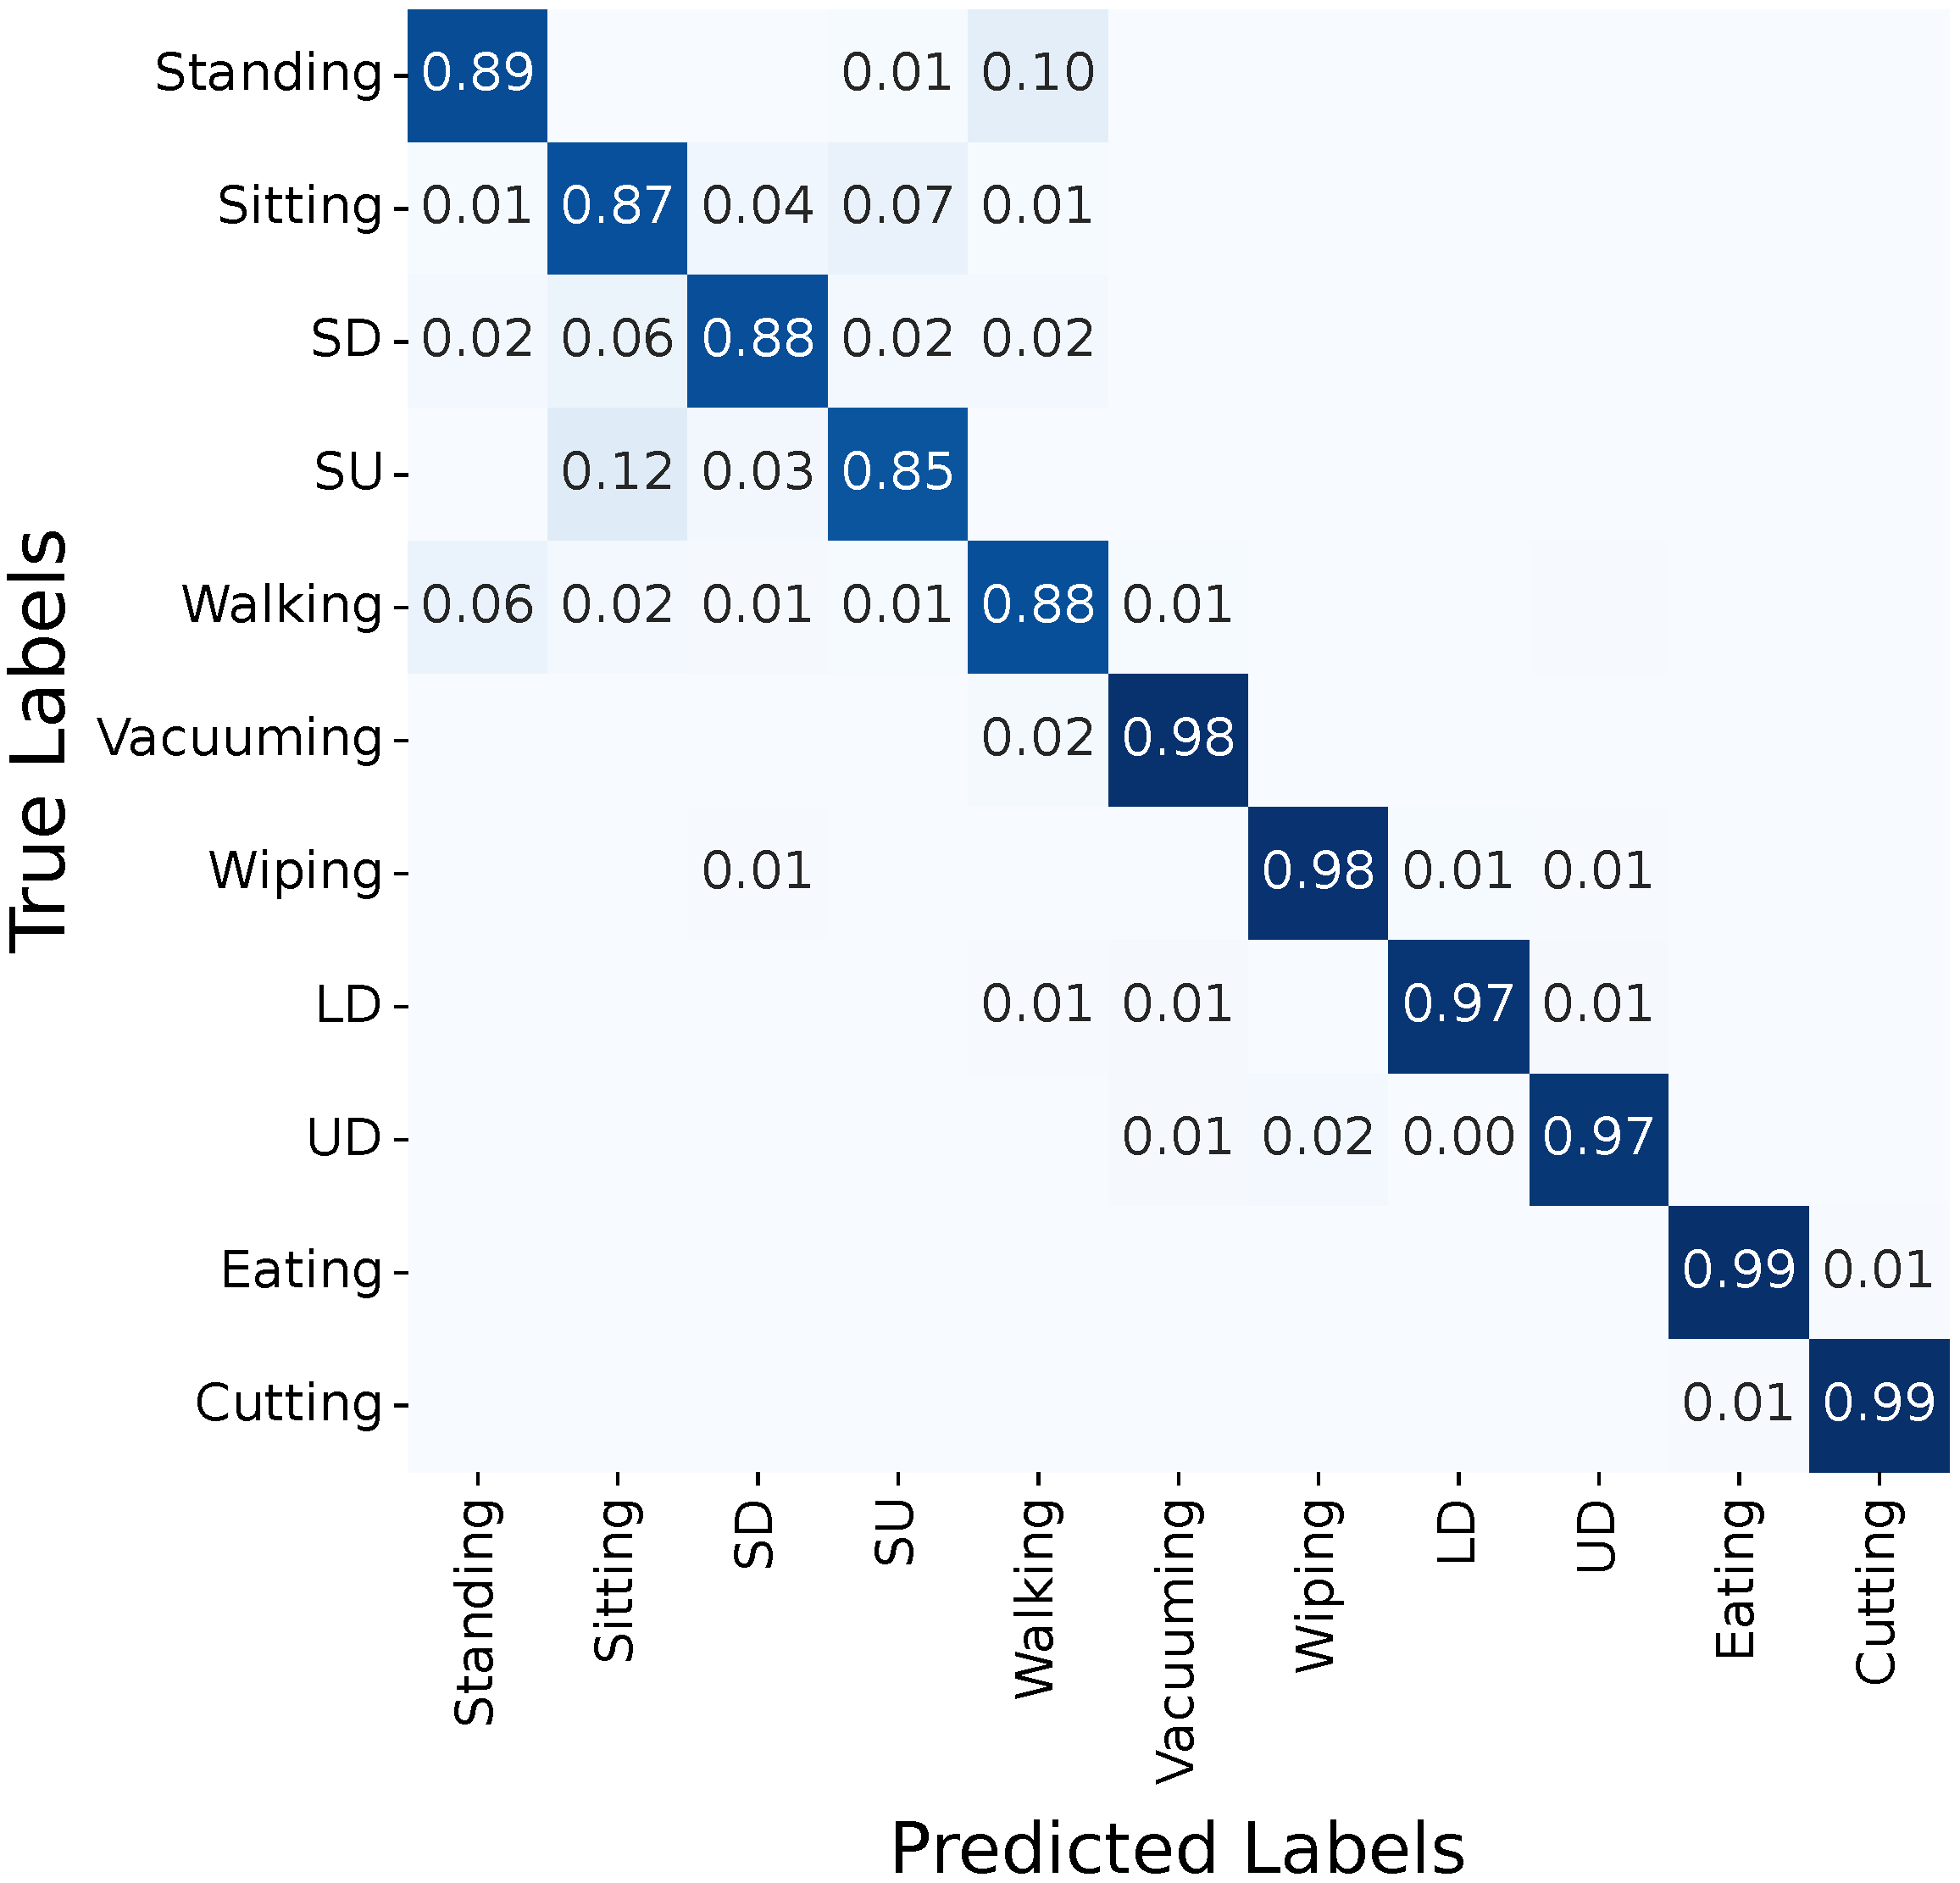
3.2.2. Video
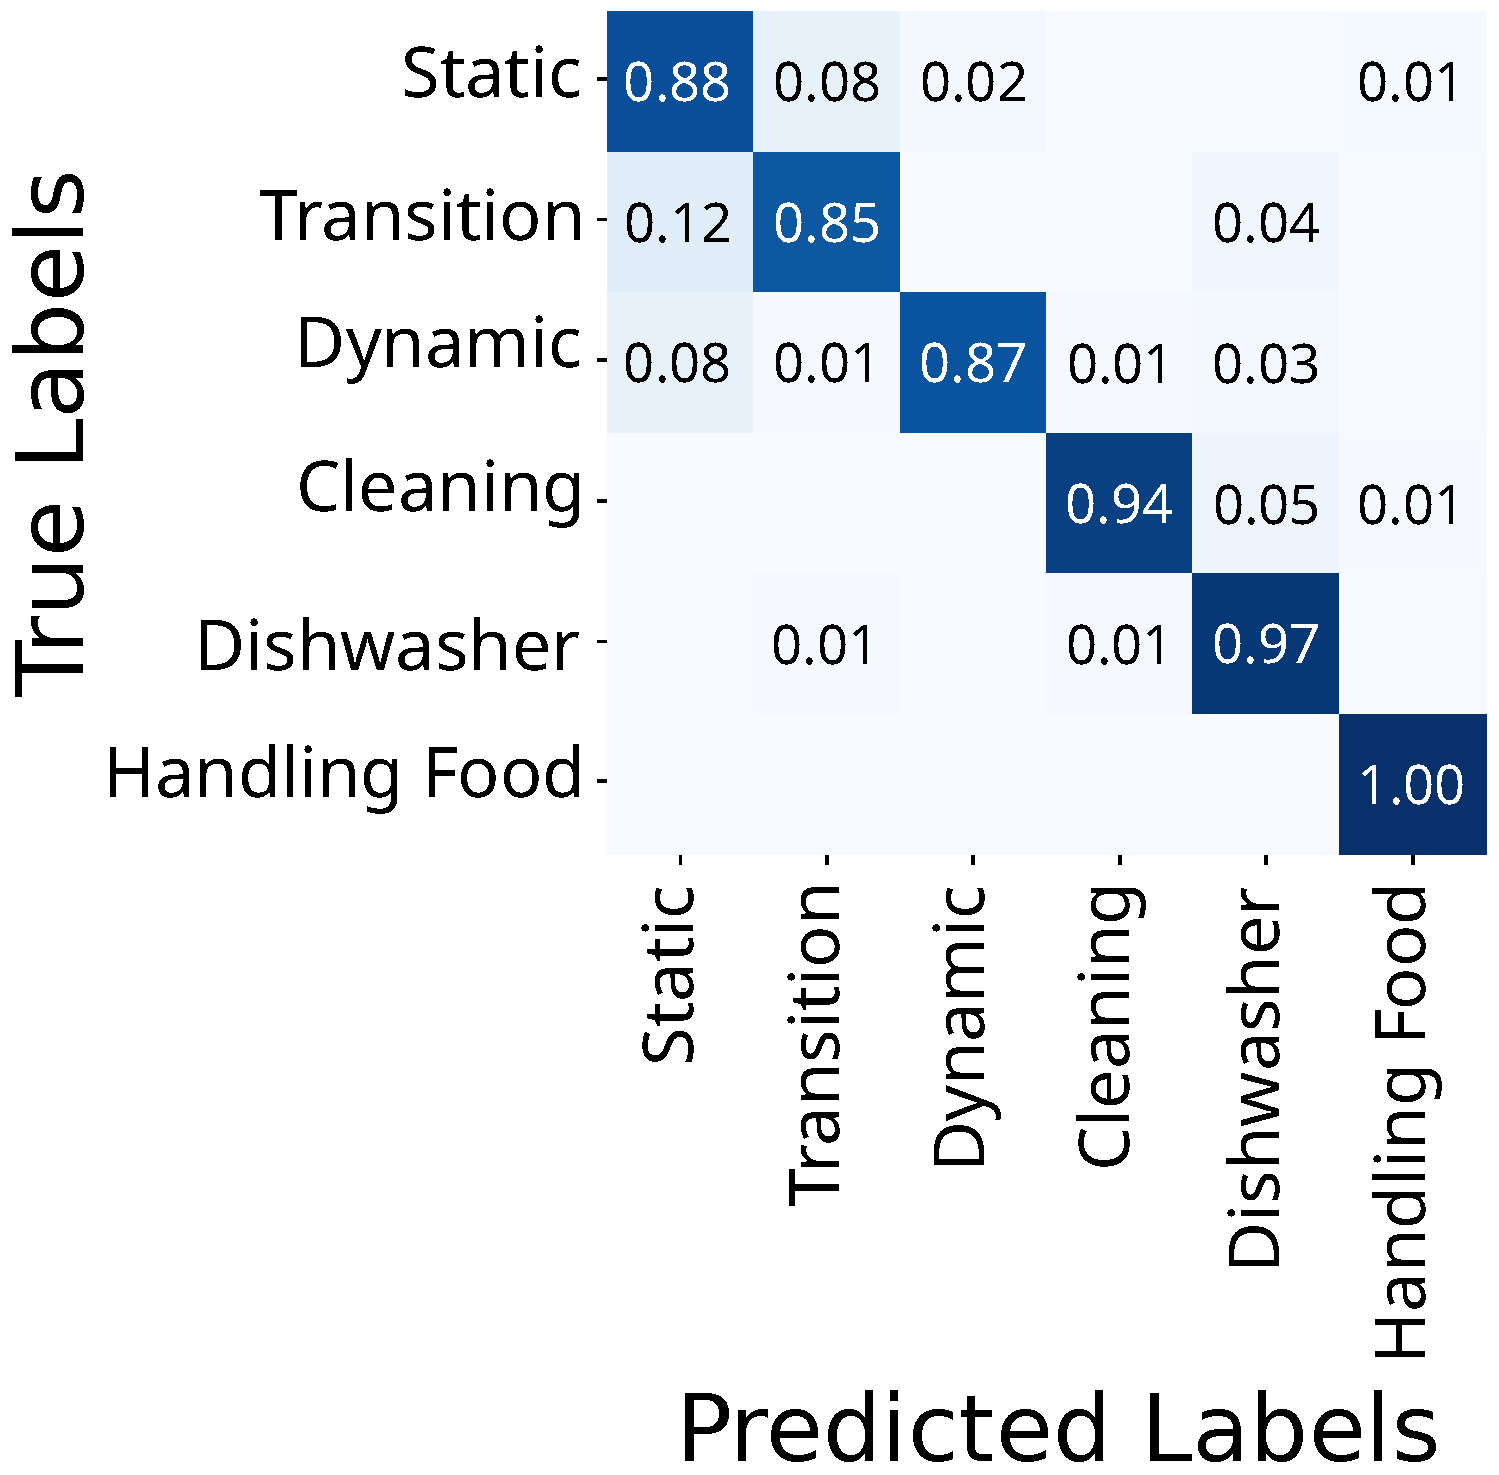
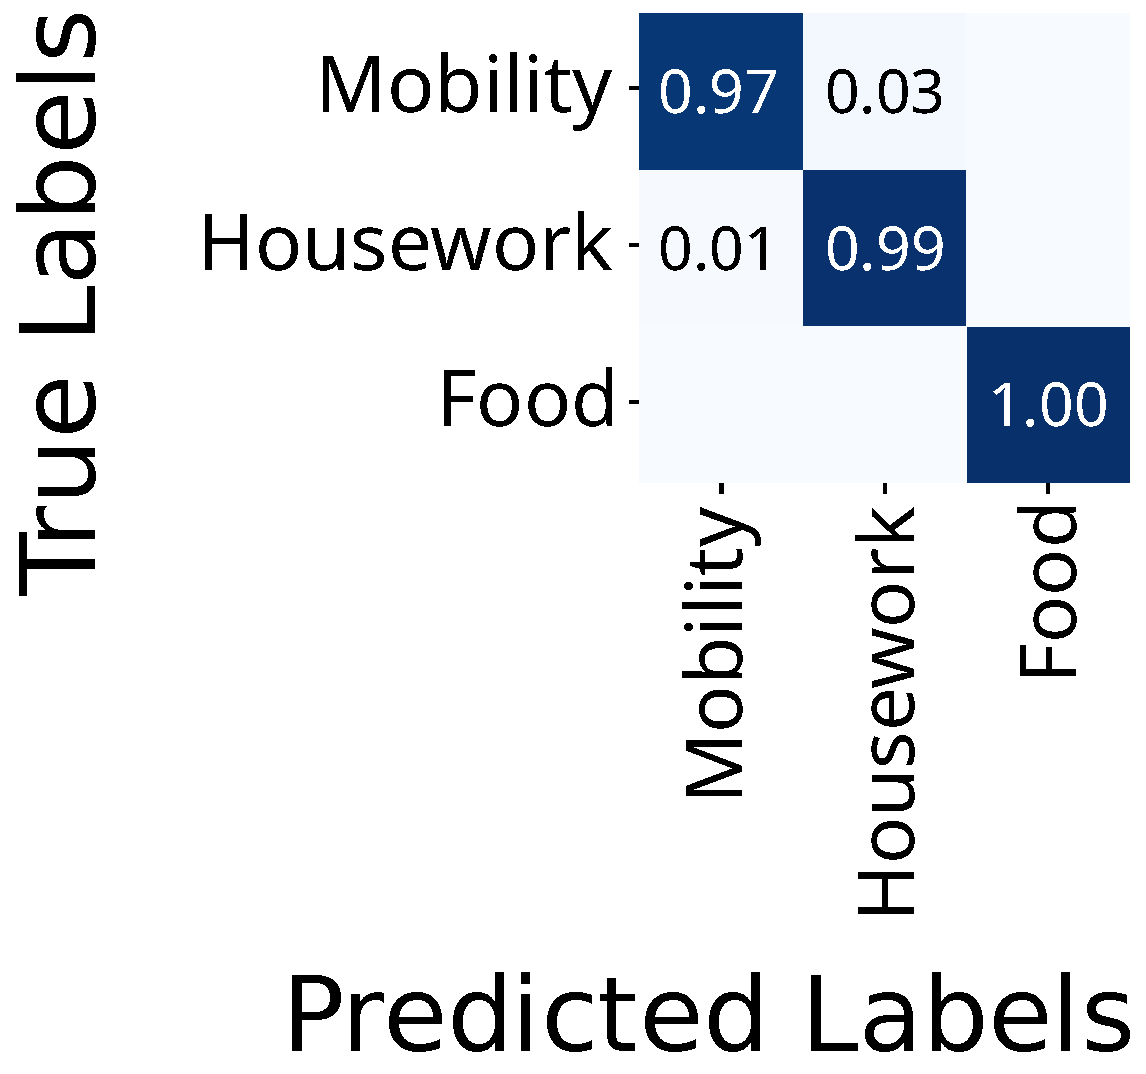
3.2.3. Activity Grouping
4. Discussion
5. Conclusions
- FlexTail (body-worn) and video-based (environment-integrated) HAR perform equally well.
- FlexTail captures subtle spinal movements and supports distinguishing between static and transition activities.
- Video-based HAR outperforms FlexTail on activities that involve arm and hand movements.
- The RDST classifier delivers optimal performance for FlexTail data, while the QUANT classifier is most effective for camera data.
- Hierarchical activity grouping does not improve classification performance.
- The 1 s window enables near real-time classification.
Author Contributions
Funding
Institutional Review Board Statement
Informed Consent Statement
Data Availability Statement
Conflicts of Interest
Abbreviations
| ADL | activities of daily living |
| BLE | Bluetooth Low Energy |
| CNN | convolutional neural network |
| HAR | human activity recognition |
| IMU | intertia measurement units |
| JSON | JavaScript object notation |
| LSTM | long short-term memory |
| RDST | random dilated shapelet transform |
| ROM | Range-of-Motion |
| SVM | support vector machine |
| TSC | time series classification |
| t-SNE | t-distributed stochastic neighbor embedding |
References
- Zhu, N.; Diethe, T.; Camplani, M.; Tao, L.; Burrows, A.; Twomey, N.; Kaleshi, D.; Mirmehdi, M.; Flach, P.; Craddock, I.J. Bridging eHealth and the Internet of Things: The SPHERE Project. IEEE Intell. Syst. 2015, 30, 39–46. [Google Scholar] [CrossRef]
- Khandelwal, I.; Stollenwerk, K.; Krüger, B.; Weber, A. Posture Classification Based on a Spine Shape Monitoring System. In Proceedings of the Computational Science and Its Applications—ICCSA 2019: 19th International Conference, Saint Petersburg, Russia, 1–4 July 2019; Proceedings, Part VI. Springer: Berlin/Heidelberg, Germany, 2019; pp. 494–509. [Google Scholar] [CrossRef]
- Natarajan, P.; Fonseka, R.D.; Maharaj, M.M.; Koinis, L.; Mobbs, R.J. Continuous data capture of gait and mobility metrics using wearable devices for postoperative monitoring in common elective orthopaedic procedures of the hip, knee, and spine: A scoping review. J. Orthop. Surg. Res. 2023, 18, 812. [Google Scholar] [CrossRef] [PubMed]
- Inoue, M.; Orita, S.; Inage, K.; Suzuki, M.; Fujimoto, K.; Shiga, Y.; Kanamoto, H.; Abe, K.; Kinoshita, H.; Norimoto, M.; et al. Objective evaluation of postoperative changes in real-life activity levels in the postoperative course of lumbar spinal surgery using wearable trackers. BMC Musculoskelet. Disord. 2020, 21, 72. [Google Scholar] [CrossRef] [PubMed]
- van der Veen, S.M.; Bordeleau, M.; Pidcoe, P.E.; France, C.R.; Thomas, J.S. Agreement Analysis between Vive and Vicon Systems to Monitor Lumbar Postural Changes. Sensors 2019, 19, 3632. [Google Scholar] [CrossRef]
- Maučec, M.S.; Donaj, G.; Maučec, M.S.; Donaj, G. Perspective Chapter: Recognition of Activities of Daily Living for Elderly People in the Era of Digital Health; IntechOpen: London, UK, 2024. [Google Scholar] [CrossRef]
- Kaseris, M.; Kostavelis, I.; Malassiotis, S. A Comprehensive Survey on Deep Learning Methods in Human Activity Recognition. Mach. Learn. Knowl. Extr. 2024, 6, 842–876. [Google Scholar] [CrossRef]
- Minh Dang, L.; Min, K.; Wang, H.; Jalil Piran, M.; Hee Lee, C.; Moon, H. Sensor-Based and Vision-Based Human Activity Recognition: A Comprehensive Survey. Pattern Recognit. 2020, 108, 107561. [Google Scholar] [CrossRef]
- Haghi, M.; Danyali, S.; Ayasseh, S.; Wang, J.; Aazami, R.; Deserno, T.M. Wearable Devices in Health Monitoring from the Environmental towards Multiple Domains: A Survey. Sensors 2021, 21, 2130. [Google Scholar] [CrossRef]
- Wang, J.; Spicher, N.; Warnecke, J.M.; Haghi, M.; Schwartze, J.; Deserno, T.M. Unobtrusive Health Monitoring in Private Spaces: The Smart Home. Sensors 2021, 21, 864. [Google Scholar] [CrossRef]
- Wang, J.; Warnecke, J.M.; Haghi, M.; Deserno, T.M. Unobtrusive Health Monitoring in Private Spaces: The Smart Vehicle. Sensors 2020, 20, 2442. [Google Scholar] [CrossRef]
- Marszalek, M.; Laptev, I.; Schmid, C. Actions in Context. In Proceedings of the 2009 IEEE Conference on Computer Vision and Pattern Recognition, Miami, FL, USA, 20–25 June 2009; pp. 2929–2936. [Google Scholar] [CrossRef]
- Tao, L.; Burghardt, T.; Hannuna, S.; Camplani, M.; Paiement, A.; Damen, D.; Mirmehdi, M.; Craddock, I. A Comparative Home Activity Monitoring Study Using Visual and Inertial Sensors. In Proceedings of the 2015 17th International Conference on E-health Networking, Application & Services (HealthCom), Boston, MA, USA, 14–17 October 2015; pp. 644–647. [Google Scholar] [CrossRef]
- Sen, A.; Das, A.; Pradhan, S.; Chakraborty, S. A Dataset for Multi-intensity Continuous Human Activity Recognition through Passive Sensing. arXiv 2024, arXiv:2407.21125. [Google Scholar] [CrossRef]
- Zhuravchak, A.; Kapshii, O.; Pournaras, E. Human Activity Recognition Based on Wi-Fi CSI Data—A Deep Neural Network Approach. Procedia Comput. Sci. 2022, 198, 59–66. [Google Scholar] [CrossRef]
- Atallah, L.; Lo, B.; King, R.; Yang, G.Z. Sensor Positioning for Activity Recognition Using Wearable Accelerometers. IEEE Trans. Biomed. Circuits Syst. 2011, 5, 320–329. [Google Scholar] [CrossRef] [PubMed]
- Piau, A.; Steinmeyer, Z.; Charlon, Y.; Courbet, L.; Rialle, V.; Lepage, B.; Campo, E.; Nourhashemi, F. A Smart Shoe Insole to Monitor Frail Older Adults’ Walking Speed: Results of Two Evaluation Phases Completed in a Living Lab and Through a 12-Week Pilot Study. JMIR mHealth uHealth 2021, 9, e15641. [Google Scholar] [CrossRef] [PubMed]
- Kaur, H.; Rani, V.; Kumar, M. Human Activity Recognition: A Comprehensive Review. Expert Syst. 2024, 41, e13680. [Google Scholar] [CrossRef]
- Haghi, M.; Ershadi, A.; Deserno, T.M. Recognizing Human Activity of Daily Living Using a Flexible Wearable for 3D Spine Pose Tracking. Sensors 2023, 23, 2066. [Google Scholar] [CrossRef]
- Marx, W.; Niemeyer, T.; Conta, A.; Hartmann, C.; Obid, P. Ergebnisse einer biomechanischen Pilotstudie zur Ermittlung des ROM vor und nach dorsaler Korrekturspondylodese mittels dreidimensionaler Echtzeit-Darstellung unter Verwendung von Dehnungs-Messstreifen. Die Wirbelsäule 2023, 7, 51–52. [Google Scholar] [CrossRef]
- Altini, M.; Amft, O.; Penders, J. Estimating Oxygen Uptake During Nonsteady-State Activities and Transitions Using Wearable Sensors. IEEE J. Biomed. Health Inform. 2016, 20, 469–475. [Google Scholar] [CrossRef]
- Reiss, A.; Stricker, D. Introducing a New Benchmarked Dataset for Activity Monitoring. In Proceedings of the 2012 16th International Symposium on Wearable Computers, Newcastle, UK, 18–22 June 2012; pp. 108–109. [Google Scholar] [CrossRef]
- Rezaei, A.; Stevens, M.C.; Argha, A.; Mascheroni, A.; Puiatti, A.; Lovell, N.H. An Unobtrusive Human Activity Recognition System Using Low Resolution Thermal Sensors, Machine and Deep Learning. IEEE Trans. Biomed. Eng. 2023, 70, 115–124. [Google Scholar] [CrossRef]
- Nishida, M.; Kitaoka, N.; Takeda, K. Development and Preliminary Analysis of Sensor Signal Database of Continuous Daily Living Activity over the Long Term. In Proceedings of the Signal and Information Processing Association Annual Summit and Conference (APSIPA), 2014 Asia-Pacific, Siem Reap, Cambodia, 9–12 December 2014; pp. 1–6. [Google Scholar] [CrossRef]
- Weiss, G. WISDM Smartphone and Smartwatch Activity and Biometrics Dataset; Fordham University: Bronx, NY, USA, 2019. [Google Scholar] [CrossRef]
- Shoaib, M.; Bosch, S.; Incel, O.; Scholten, H.; Havinga, P. Fusion of Smartphone Motion Sensors for Physical Activity Recognition. Sensors 2014, 14, 10146–10176. [Google Scholar] [CrossRef]
- Leotta, M.; Fasciglione, A.; Verri, A. Daily Living Activity Recognition Using Wearable Devices: A Features-Rich Dataset and a Novel Approach. In Proceedings of the Pattern Recognition—ICPR International Workshops and Challenges, Virtual, 10–15 January 2021; Del Bimbo, A., Cucchiara, R., Sclaroff, S., Farinella, G.M., Mei, T., Bertini, M., Escalante, H.J., Vezzani, R., Eds.; Springer: Cham, Switzerland, 2021; pp. 171–187. [Google Scholar] [CrossRef]
- Blunck, S.B. Heterogeneity Activity Recognition; UC Irvine Machine Learning Repository: Aarhus University: Aarhus, Denmark, 2015. [Google Scholar] [CrossRef]
- Murtagh, E.M.; Mair, J.L.; Aguiar, E.; Tudor-Locke, C.; Murphy, M.H. Outdoor Walking Speeds of Apparently Healthy Adults: A Systematic Review and Meta-analysis. Sports Med. 2021, 51, 125–141. [Google Scholar] [CrossRef]
- Cao, Z.; Hidalgo, G.; Simon, T.; Wei, S.E.; Sheikh, Y. OpenPose: Realtime Multi-Person 2D Pose Estimation Using Part Affinity Fields. arXiv 2019, arXiv:1812.08008. [Google Scholar] [CrossRef] [PubMed]
- Knap, P. Human Modelling and Pose Estimation Overview. arXiv 2024, arXiv:2406.19290. [Google Scholar]
- Faouzi, J. Time Series Classification: A Review of Algorithms and Implementations. In Time Series Analysis—Recent Advances, New Perspectives and Applications; IntechOpen: London, UK, 2024. [Google Scholar] [CrossRef]
- Middlehurst, M.; Schäfer, P.; Bagnall, A. Bake off Redux: A Review and Experimental Evaluation of Recent Time Series Classification Algorithms. Data Min. Knowl. Discov. 2024, 38, 1958–2031. [Google Scholar] [CrossRef]
- Middlehurst, M.; Ismail-Fawaz, A.; Guillaume, A.; Holder, C.; Rubio, D.G.; Bulatova, G.; Tsaprounis, L.; Mentel, L.; Walter, M.; Schäfer, P.; et al. Aeon: A Python Toolkit for Learning from Time Series. arXiv 2024, arXiv:2406.14231. [Google Scholar] [CrossRef]
- Pedregosa, F.; Varoquaux, G.; Gramfort, A.; Michel, V.; Thirion, B.; Grisel, O.; Blondel, M.; Prettenhofer, P.; Weiss, R.; Dubourg, V.; et al. Scikit-Learn: Machine Learning in Python. J. Mach. Learn. Res. 2011, 12, 2825–2830. [Google Scholar]


| Source | Sensor | Subjects | Duration | Activities |
|---|---|---|---|---|
| [19] | FlexTail | 30 | 300 * | Walking, Sitting, Standing, Running, Upstairs, Sitting Down, Standing Up, Laying on Side, Laying on Back, Bending Forward, Bending Backward, Bending Right, Bending Left |
| [12] | Video | - | 30 | Sitting, Running, Sitting Down, Standing Up, Answer Phone, Driving Car, Eat, Fight Person, Get Out of Car, Handshake, Hug Person, Kissing |
| [21] | IMU + Heart rate | 22 | 240 | Walking, Sitting, Standing, Running, Vacuuming, Sweeping, Cycling, Laying Down, Desk Work, Reading, Writing, PC Work, Stacking Groceries, Washing Dishes, Cleaning |
| [22] | IMU + Heart rate | 9 | 250 * | Walking, Sitting, Standing, Running, Upstairs, Downstairs, Cycling, Laying, Nordic Walk, Ironing, Vacuuming, Rope Jump, Undefined |
| [13] | IMU + Depth Camera | 5 | 65 * | Walking, Sitting, Standing, Vacuuming, Sitting Down, Standing Up, Sweeping, Wiping Table, Dusting, Cleaning Stain, Picking Up, Squatting, Stretching |
| [23] | Low Resolution Infrared Camera | 18 | 60 | Walking, Standing, Sitting, Sitting Down, Laying Down, Fall Forward, Falling Backward, Falling Laterally, Falling from Bed |
| [24] | IMU + Camera | 1 | 6780 * | Cycling, Teeth Brushing, Wiping Table, Preparing Food, Driving Car, Washing, Cleaning Bath, Cleaning Room, Drying Clothes, Bath, Shopping, Toilet, TV, Meal, Notebook, Reading, Office, Smartphone |
| [25] | IMU | 51 | 180 | Walking, Standing, Sitting, Running, Upstairs, Downstairs, Teeth Brushing, Eating (Soup, Chips, Pasta, Sandwich), Typing, Drinking from Cup, Kicking (Soccer Ball), Playing Catch with Tennis Ball, Dribbling (Basketball), Writing, Clapping, Folding Clothes |
| [26] | IMU | 10 | 200 | Walking, Standing, Sitting, Running, Upstairs, Downstairs, Cycling |
| [14] | Radar | 7 | 173 * | Walking, Sitting, Running, Vacuuming, Eating, Squats, Lunges, Jumping, Clapping, Changing-Clothes, Folding Clothes, Waving, Phone Typing, Phone Talking, Playing-Guitar, Combing-Hair, Brushing, Drinking, Laptop Typing |
| [15] | WiFi | 1 | 940 * | Walking, Standing, Sitting, Sitting Down, Standing Up, Laying, Absence |
| [16] | IMU | 11 | 120 | Walking, Running, Vacuuming, Cycling, Eating, Wiping Table, Laying Down, Preparing Food, Socializing, Reading, Getting Dressed, Sit to Stand, Laying Down to Stand |
| [27] | IMU | 8 | 120 | Walking, Upstairs, Downstairs, Vacuuming, Sweeping, Teeth Brushing, Eating, Walking Fast, Laptop, Keyboard, Writing, Handwashing, Face Washing, Dusting, Rubbing, Fast |
| [28] | IMU | 9 | 560 * | Walking, Sitting, Standing, Upstairs, Downstairs, Cycling, Undefined |
| Activity | Count |
|---|---|
| Walking | 12 |
| Sitting | 11 |
| Standing | 9 |
| Running | 8 |
| Upstairs | 6 |
| Cycling | 6 |
| Vacuuming | 6 |
| Downstairs | 5 |
| Sitting Down | 5 |
| Standing Up | 4 |
| Eating | 3 |
| Wiping Table | 3 |
| Laying Down | 3 |
| Sweeping | 3 |
| Teeth Brushing | 3 |
| Reading | 3 |
| Writing | 3 |
| Preparing Food | 2 |
| Driving Car | 2 |
| Laying | 2 |
| Dusting | 2 |
| Folding Clothes | 2 |
| Clapping | 2 |
| Window Size w [s] | ||||
|---|---|---|---|---|
| Classifier | 1 | 2 | 3 | 4 |
| FreshPRINCE | 0.84 | 0.84 | 0.82 | 0.85 |
| InceptionTime | 0.56 | 0.44 | 0.43 | 0.37 |
| MultiRocketHydra | 0.87 | 0.87 | 0.86 | 0.86 |
| QUANT | 0.86 | 0.86 | 0.82 | 0.85 |
| RDST | 0.90 | 0.88 | 0.88 | 0.91 |
| Window Size w [s] | ||||
|---|---|---|---|---|
| Classifier | 1 | 2 | 3 | 4 |
| FreshPRINCE | 0.87 | 0.87 | 0.87 | 0.85 |
| InceptionTime | 0.82 | 0.84 | 0.76 | 0.70 |
| MultiRocketHydra | 0.88 | 0.89 | 0.91 | 0.89 |
| QUANT | 0.90 | 0.91 | 0.93 | 0.90 |
| RDST | 0.86 | 0.88 | 0.91 | 0.90 |
| Source | Year | Model | BW/EI | No. Activities | Total | Standing | Sitting | Sitting Down | Standing Up | Walking | Vacuuming | Wiping | Loading | Unloading | Eating | Cutting |
|---|---|---|---|---|---|---|---|---|---|---|---|---|---|---|---|---|
| Ours | 2025 | RDST | BW | 11 | 0.88 | 0.93 | 0.89 | 0.71 | 0.95 | 0.88 | 0.94 | 0.95 | 0.76 | 0.71 | 1.00 | 0.99 |
| 2025 | QUANT | EI | 11 | 0.93 | 0.89 | 0.87 | 0.88 | 0.85 | 0.88 | 0.98 | 0.98 | 0.97 | 0.97 | 0.99 | 0.99 | |
| [19] | 2023 | CNN | BW | 12 | 0.94 | 0.97 | 0.87 | - | - | 0.91 | - | - | - | - | - | - |
| 2023 | LSTM | BW | 12 | 0.96 | 0.76 | 0.83 | - | - | 0.92 | - | - | - | - | - | - | |
| 2023 | CNN + LSTM | BW | 12 | 0.97 | 0.78 | 0.91 | - | - | 0.96 | - | - | - | - | - | - | |
| [12] | 2009 | SVM | EI | 12 | 0.32 | - | - | 0.32 | 0.35 | - | - | - | - | - | 0.29 | - |
| [21] | 2016 | SVM | BW | 6 | 0.94 | - | - | - | - | 0.99 | - | - | - | - | - | - |
| [13] | 2015 | SVM | BW | 13 | 0.57 | 0.80 | 0.63 | 0.35 | 0.44 | 0.77 | 0.62 | 0.66 | - | - | - | - |
| 2015 | SVM | EI | 13 | 0.72 | 0.77 | 0.77 | 0.84 | 0.86 | 0.86 | 0.75 | 0.67 | - | - | - | - | |
| 2015 | SVM | BW + EI | 13 | 0.75 | - | - | - | - | - | - | - | - | - | - | - | |
| [23] | 2023 | DL | EI | 5 | 0.97 | - | - | - | - | - | - | - | - | - | - | - |
| [24] | 2014 | GMM | EI + BW | 13 | 0.77 | - | - | - | - | - | - | - | - | - | - | - |
| [14] | 2024 | t-SNE + CNN | EI | 9 | 0.97 | - | - | - | - | - | - | - | - | - | - | - |
| [16] | 2011 | KNN | BW | 13 | - | - | - | - | - | - | - | - | - | - | - | - |
| [27] | 2021 | SVM | BW | 17 | 0.91 | - | - | - | - | 0.87 | 0.87 | - | - | - | 0.97 | - |
Disclaimer/Publisher’s Note: The statements, opinions and data contained in all publications are solely those of the individual author(s) and contributor(s) and not of MDPI and/or the editor(s). MDPI and/or the editor(s) disclaim responsibility for any injury to people or property resulting from any ideas, methods, instructions or products referred to in the content. |
© 2025 by the authors. Licensee MDPI, Basel, Switzerland. This article is an open access article distributed under the terms and conditions of the Creative Commons Attribution (CC BY) license (https://creativecommons.org/licenses/by/4.0/).
Share and Cite
Walkling, J.; Sander, L.; Masch, A.; Deserno, T.M. Wearable Spine Tracker vs. Video-Based Pose Estimation for Human Activity Recognition. Sensors 2025, 25, 3806. https://doi.org/10.3390/s25123806
Walkling J, Sander L, Masch A, Deserno TM. Wearable Spine Tracker vs. Video-Based Pose Estimation for Human Activity Recognition. Sensors. 2025; 25(12):3806. https://doi.org/10.3390/s25123806
Chicago/Turabian StyleWalkling, Jonas, Luca Sander, Arwed Masch, and Thomas M. Deserno. 2025. "Wearable Spine Tracker vs. Video-Based Pose Estimation for Human Activity Recognition" Sensors 25, no. 12: 3806. https://doi.org/10.3390/s25123806
APA StyleWalkling, J., Sander, L., Masch, A., & Deserno, T. M. (2025). Wearable Spine Tracker vs. Video-Based Pose Estimation for Human Activity Recognition. Sensors, 25(12), 3806. https://doi.org/10.3390/s25123806