

Edge Server Selection with Round-Robin-Based Task Processing in Multiserver Mobile Edge Computing

Abstract
1. Introduction
- Most studies in the literature assume one task per user and optimize the offloading process based on this. We, on the other hand, assume continuous and stochastic arrival of tasks, which is much more realistic.
- Again, most studies in the literature either allocate fixed and dedicated CPU cycles (frequencies) to each task or rely on the first-come-first-served (FCFS) queueing model. Our approach adopts round-robin process scheduling, which is both more realistic and resource-efficient. To the best of our knowledge, this is the first study considering round-robin scheduling in the context of MEC.
- We perform a comparative analysis of four distinct ES selection methods, evaluating their performance in terms of average task sojourn time. Among these methods, “nearest server” and “random selection” are straight-forward heuristics and serve as benchmarks. The other two, “least remaining CPU cycles” and “fewest active tasks”, can be interpreted as variants of the “join the shortest queue” policy, which typically provides load balancing in multiserver queueing systems.
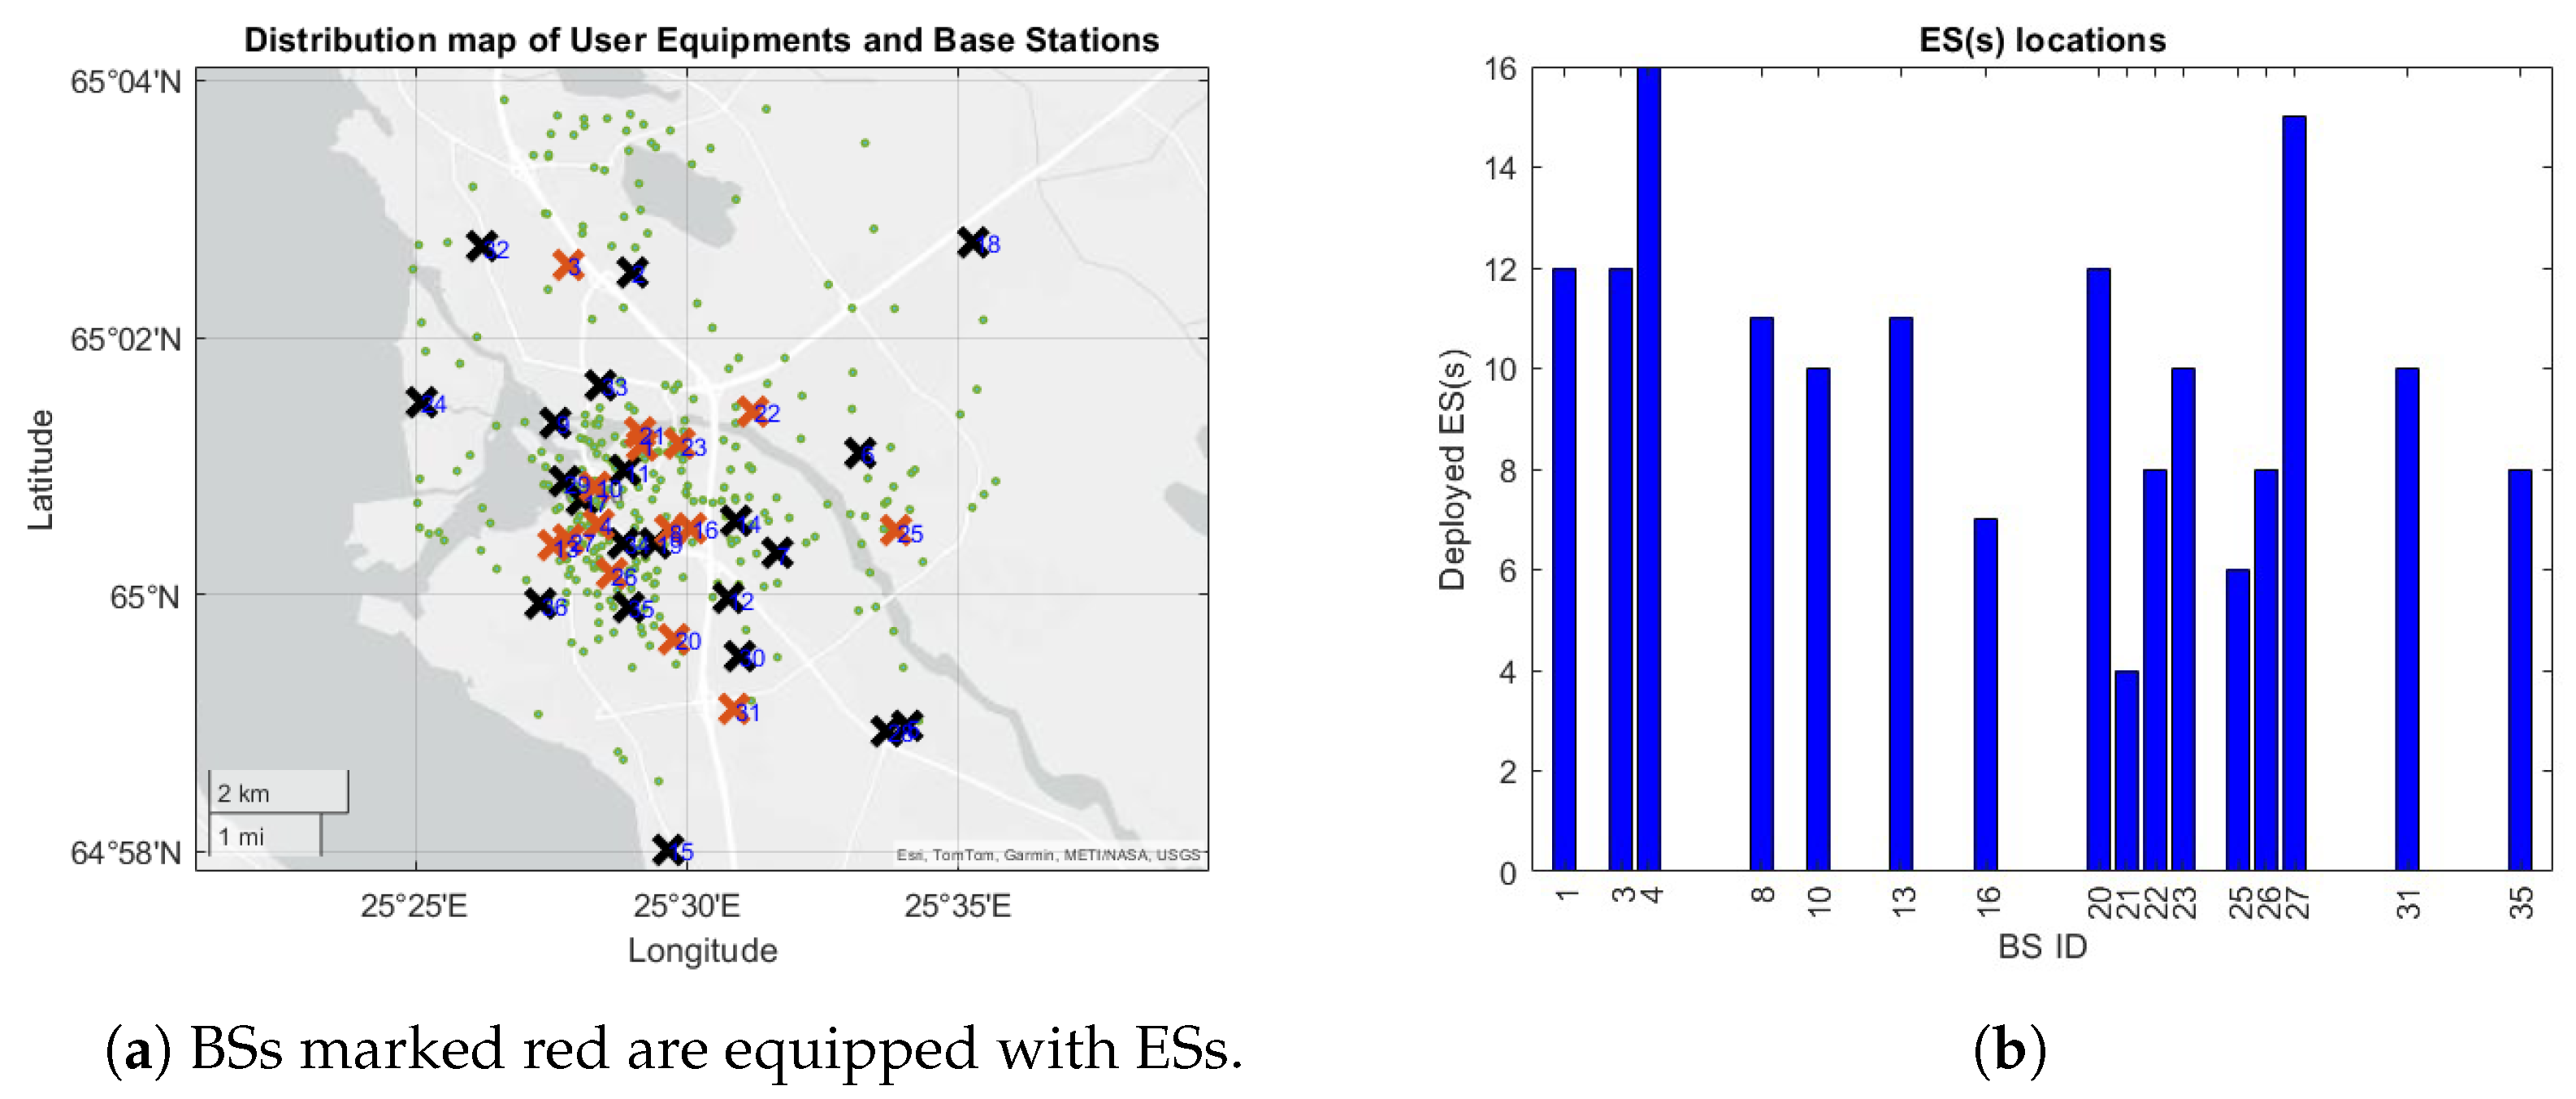
- The numerical results for performance comparison and assessment are based on a real-world dataset of the city of Oulu, Finland.
2. Related Works
- Some studies assume that users produce a single shot of a task, and an optimization problem is formulated based on this snapshot-like system frozen in time. Many of these optimization problems are intractable and an approximate solution via machine learning tools is proposed.
- Some studies attempt to extend this approach to dynamic time-dependent scenarios. Most of these assume discrete-time-slotted systems, where every time slot is treated as an optimization problem. Typically, these studies rely on Markov decision processes to obtain results.
- Most studies involving optimization problems consider the solution in terms of assigning CPU frequency slices to each task. Although suitable for the solutions of snapshot systems, this approach would lead to inefficiencies if tasks are allowed to be generated over time, particularly in a stochastic manner as the arrival process is typically ignored in the formulations.
- A limited number of studies consider stochastic task arrivals. Elementary queueing models are usually employed in these studies to model task delays. However, FCFS scheduling is typically assumed in such studies, which is not the typical application in real-life offloading scenarios.

| Publication | Tasks | Users | Edge Servers | Cloud Server | Mobility |
|---|---|---|---|---|---|
| [11] | Single | Multiple | Single | No | No |
| [22] | Single | Multiple | Single | Yes | No |
| [23] | Single | Multiple | Multiple | Yes | No |
| [24] | Multiple | Multiple | Single | Yes | No |
| [25] | Multiple | Multiple | Multiple | Yes | No |
| [26] | Single | Single | Single | No | No |
| [27] | Multiple | Multiple | Single | No | No |
| [28] | Single | Multiple | Single | No | No |
| [29] | Single | Multiple | Single | No | No |
| [30] | Single | Single | Multiple | No | No |
| [31] | Single | Single | Single | No | No |
| [32] | Single | Multiple | Single | No | No |
| [33] | Multiple | Single | Multiple | No | No |
| [34] | Single | Multiple | Multiple | No | No |
| [7] | Multiple | Multiple | Multiple | No | No |
| Our Work | Multiple | Multiple | Multiple | No | Yes |
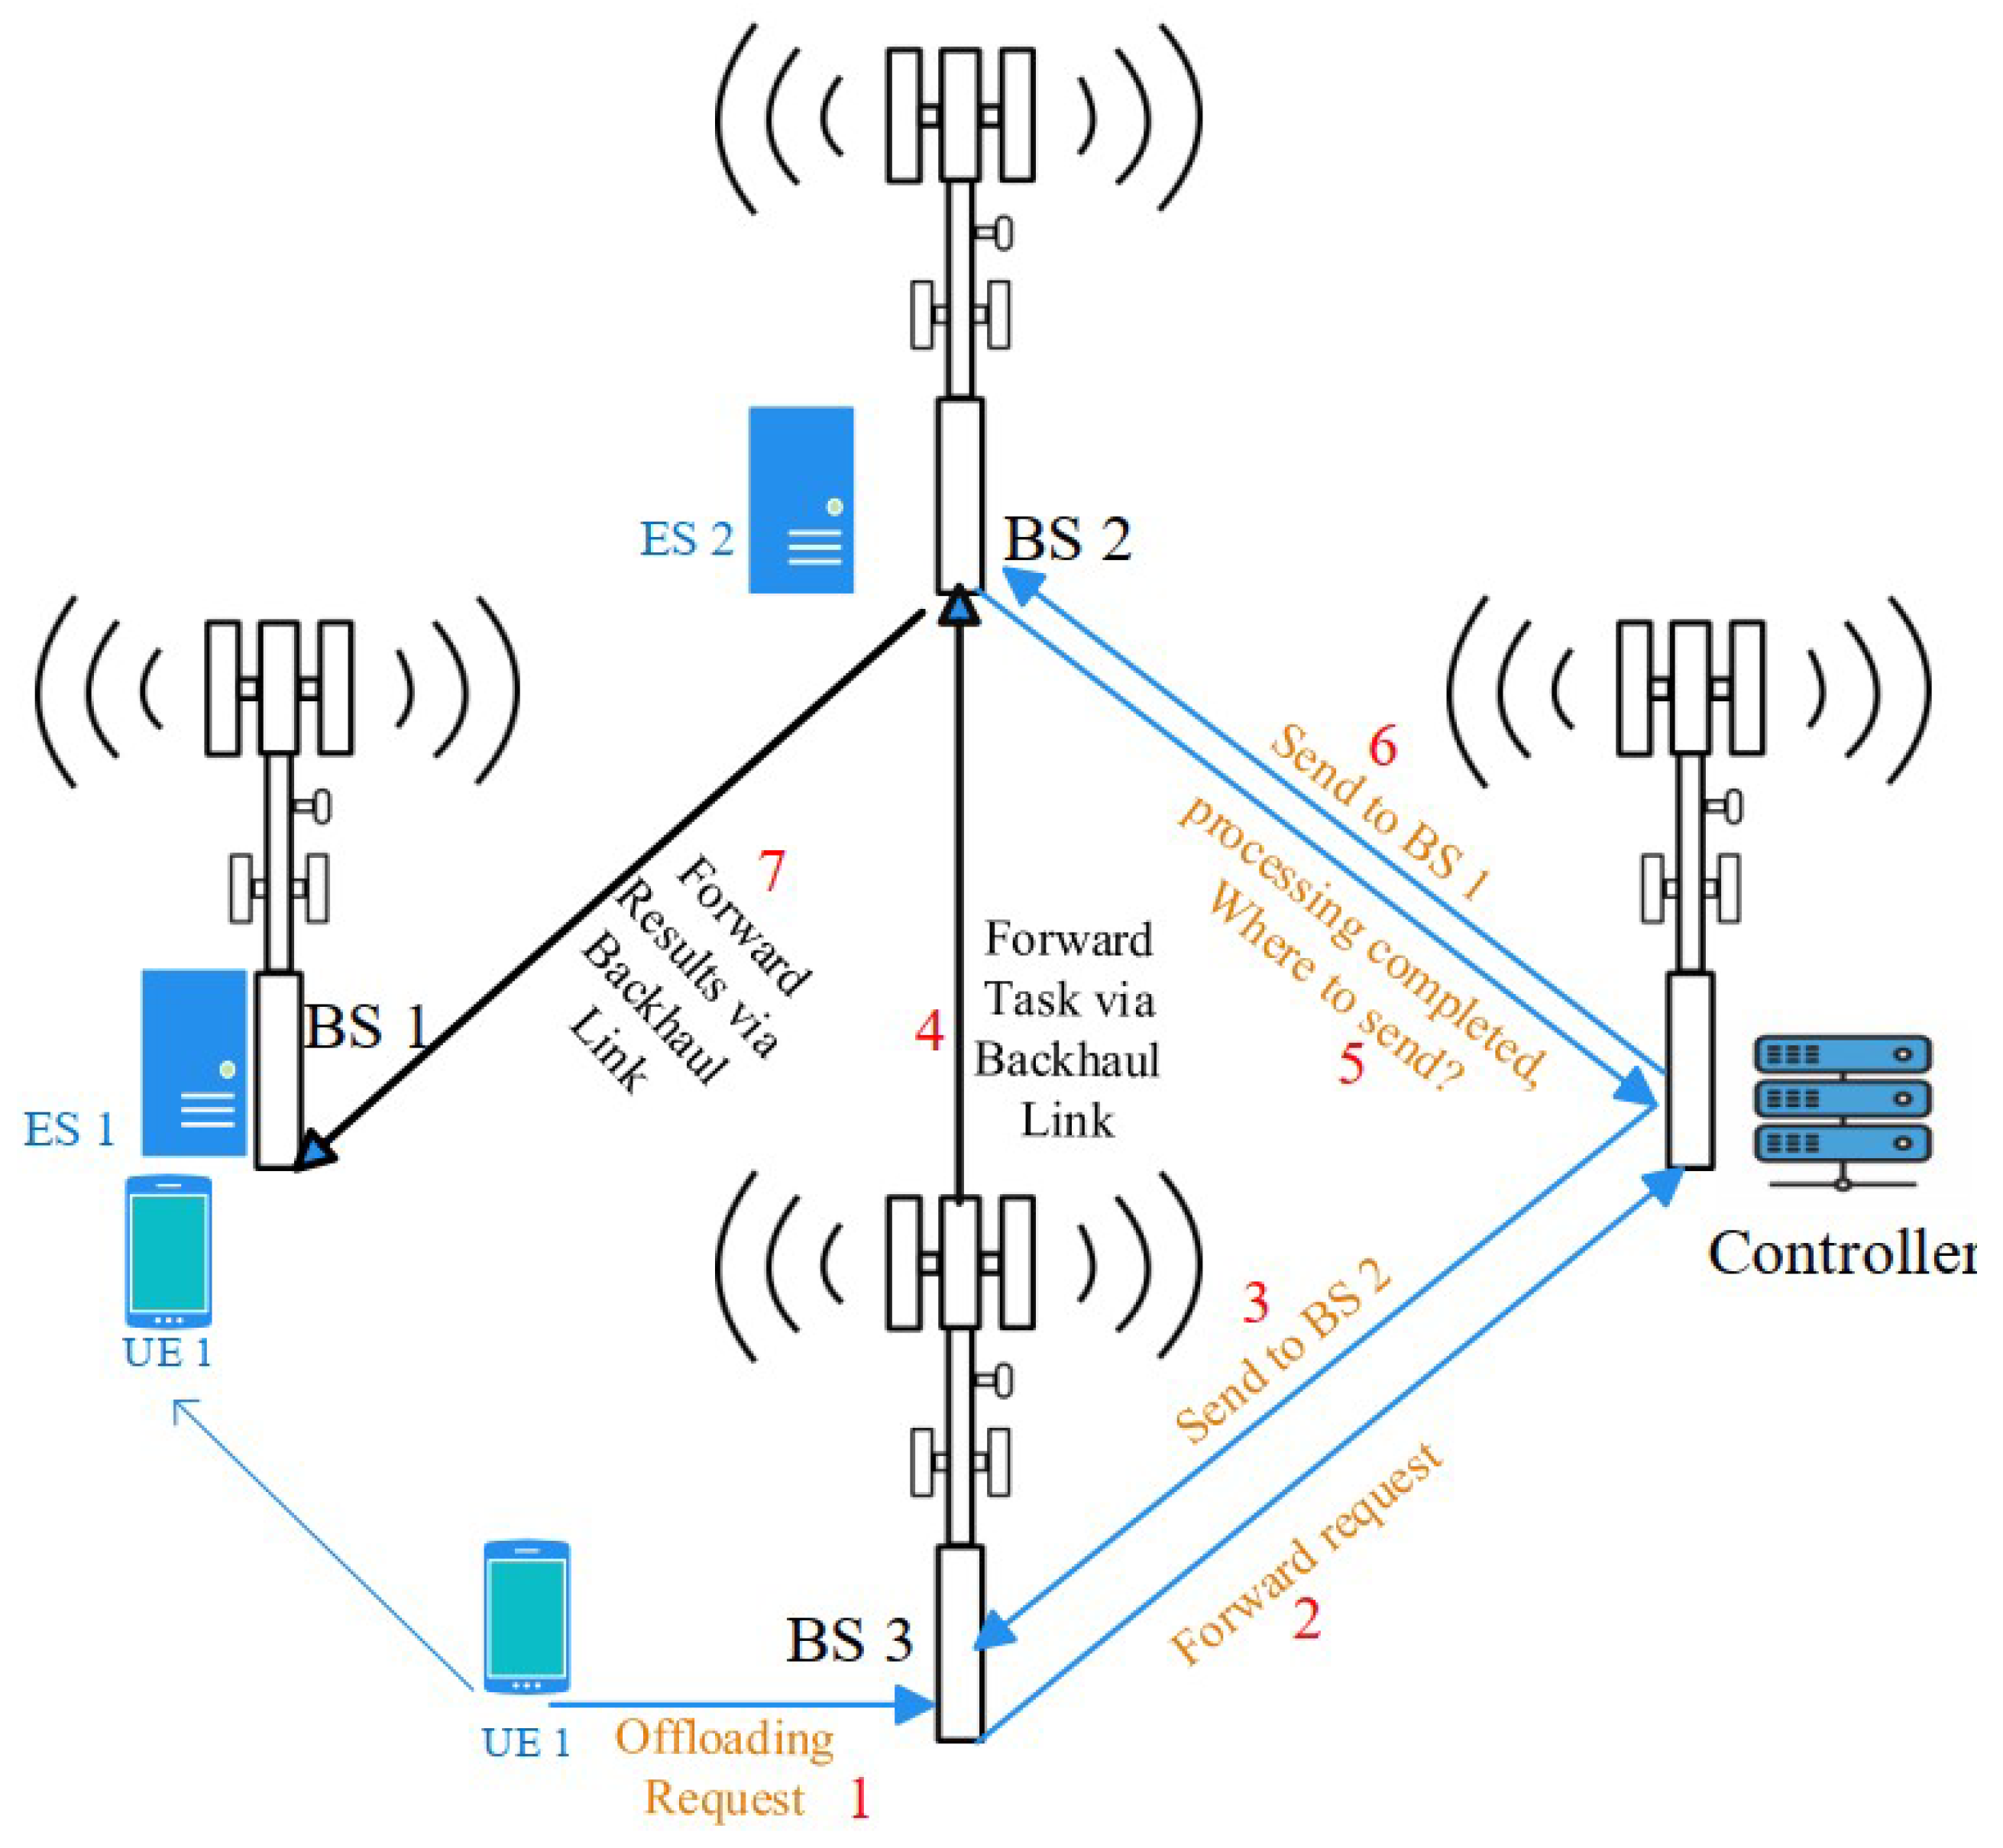
3. System Model
- the controller can monitor the states of the ESs (in terms of how loaded they are) through periodic updates using very small messages;
- the task characteristics can be communicated to the controller using very small messages, mostly over the backhaul;
- as will be explained in the upcoming subsections, the offloading decision is based on simple calculations and not heavy computation like any machine learning tools.
3.1. Task Characteristic Model
3.2. Mobility Model
3.3. Communication Model
3.4. Computation and Queueing Models
3.5. Offloading and Edge Server Selection Models
- : the transmission delay for sending the task data from the UE to its serving BS.
- : if the selected ES is not hosted on the serving BS, the transmission delay for migrating the task data from the serving BS to the BS hosting the ES.
- : the computation delay (including the queueing delay).
- : if the selected ES is not hosted on the serving BS (at the time of the completion of the task, which may be different than the initial serving BS), the transmission delay for sending the task result from the ES to the serving BS.
- : the transmission delay for sending the task result from the serving BS to the UE.
| Algorithm 1 Offloading decision and edge server selection algorithm. |
 |
| Algorithm 2 The data rate between the transmitter Tx and the receiver Rx. |
 |
| Algorithm 3 Edge server selection scheme. |
 |
3.5.1. Nearest Server (NS)
3.5.2. Least Remaining CPU Cycles (LRC)
3.5.3. Fewest Active Tasks (FAT)
3.5.4. Random Selection (RS)
3.5.5. Complexity of the ES Selection Schemes
- NS requires the controller to find the nearest server to a UE at the time of an arrival. This can be achieved in time, where N is the number of ESs, by building a k-d tree, which is a space-partitioning data structure.
- RS requires the selection of a server at random, and, hence, its complexity can be considered .
- LRC and FAT require the controller to keep track of the workload on each of the servers in terms of either CPU cycles or tasks. The controller can store this information in a suitable data structure, such as a min-heap, so that finding the least-loaded server takes time. Updating the loads as time progresses is also straight-forward as all servers consume equal amounts of workload within equal durations. Upon an arrival, after the offloading decision, the workload of one server might be updated (i.e., increased by the offloaded workload). Again, using a suitable data structure such as a Fibonacci heap with an “increase-key” operation taking time, this operation is also quite efficient.
3.6. System Model of the Benchmark
3.6.1. Task Characteristics
3.6.2. Mobility
3.6.3. Communication Model of the Benchmark
3.6.4. Computation and Queueing Models
3.6.5. Offloading and Edge Server Selection Models
4. Numerical Experimentation
4.1. Comparison with the Benchmark
4.2. Comparison of the ES Selection Methods
5. Discussion and Conclusions
- FAT and LRC consistently outperform all the other methods. This is not surprising as both methods are variants of the join-the-shortest-queue approach, known to perform well in multiserver scenarios. Moreover, we quantify the magnitude of the performance gain.
- The performance of FAT and LRC is not significantly different as long as there is not large variation in the task sizes.
- Given that the simulations were conducted in a realistic asymmetrical network setting, the results can be interpreted as representing a worst-case scenario for the NS scheme. NS could achieve more balanced loads and improved performance in a symmetrical topology. However, in an asymmetrical scenario, even random selection outperforms the NS method.
- In terms of task delay, round-robin scheduling performs much better compared to FCFS, which is preferred in analytical studies due to its simplicity and closed-form solutions. However, relying on FCFS formulations in order to formulate optimization problems can be misleading.
Author Contributions
Funding
Institutional Review Board Statement
Informed Consent Statement
Data Availability Statement
Conflicts of Interest
Abbreviations
| BS | Base station |
| ES | Edge server |
| FAT | Fewest active tasks |
| FCFS | First-come-first-served |
| LRC | Least remaining CPU cycles |
| MEC | Mobile edge computing |
| NS | Nearest server |
| PS | Processor sharing |
| RS | Random selection |
| RWP | Random waypoint |
| SNR | Signal-to-noise ratio |
| SP | Service provider |
| UE | User equipment |
References
- Geng, Y.; Yang, Y.; Cao, G. Energy-efficient computation offloading for multicore-based mobile devices. In Proceedings of the IEEE INFOCOM 2018—IEEE Conference on Computer Communications, Honolulu, HI, USA, 16–19 April 2018; pp. 46–54. [Google Scholar]
- Tan, T.; Cao, G. Deep learning video analytics on edge computing devices. In Proceedings of the 2021 18th Annual IEEE International Conference on Sensing, Communication, and Networking (SECON), Rome, Italy, 6–9 July 2021; pp. 1–9. [Google Scholar]
- Chen, M.H.; Dong, M.; Liang, B. Resource sharing of a computing access point for multi-user mobile cloud offloading with delay constraints. IEEE Trans. Mob. Comput. 2018, 17, 2868–2881. [Google Scholar] [CrossRef]
- Aljobory, K.; Yazici, M.A. Discrimination on offloading performance in two-class mobile edge computing systems. In Proceedings of the 2018 26th Signal Processing and Communications Applications Conference (SIU), Izmir, Turkey, 2–5 May 2018; pp. 1–4. [Google Scholar]
- Aliobory, K.; Yazici, M.A. An adaptive offloading decision scheme in two-class mobile edge computing systems. In Proceedings of the 2018 41st International Conference on Telecommunications and Signal Processing (TSP), Athens, Greece, 4–6 July 2018; pp. 1–5. [Google Scholar]
- Aljobory, K.; Yazici, M.A. A Comparative Study for Server Selection Schemes in Multiserver Mobile Edge Computing. In Proceedings of the 2024 9th International Conference on Fog and Mobile Edge Computing (FMEC), Malmö, Sweden, 2–5 September 2024; pp. 38–45. [Google Scholar]
- Song, H.; Gu, B.; Son, K.; Choi, W. Joint optimization of edge computing server deployment and user offloading associations in wireless edge network via a genetic algorithm. IEEE Trans. Netw. Sci. Eng. 2022, 9, 2535–2548. [Google Scholar] [CrossRef]
- Pham, Q.V.; Le, L.B.; Chung, S.H.; Hwang, W.J. Mobile edge computing with wireless backhaul: Joint task offloading and resource allocation. IEEE Access 2019, 7, 16444–16459. [Google Scholar] [CrossRef]
- Siddique, U.; Tabassum, H.; Hossain, E.; Kim, D.I. Wireless backhauling of 5G small cells: Challenges and solution approaches. IEEE Wirel. Commun. 2015, 22, 22–31. [Google Scholar] [CrossRef]
- Liu, J.; Mao, Y.; Zhang, J.; Letaief, K.B. Delay-optimal computation task scheduling for mobile-edge computing systems. In Proceedings of the 2016 IEEE International Symposium on Information Theory (ISIT), Barcelona, Spain, 10–15 July 2016; pp. 1451–1455. [Google Scholar]
- Chen, X.; Jiao, L.; Li, W.; Fu, X. Efficient multi-user computation offloading for mobile-edge cloud computing. IEEE/ACM Trans. Netw. 2015, 24, 2795–2808. [Google Scholar] [CrossRef]
- Zhang, K.; Mao, Y.; Leng, S.; Zhao, Q.; Li, L.; Peng, X.; Pan, L.; Maharjan, S.; Zhang, Y. Energy-efficient offloading for mobile edge computing in 5G heterogeneous networks. IEEE Access 2016, 4, 5896–5907. [Google Scholar] [CrossRef]
- Wu, Y.; Ni, K.; Zhang, C.; Qian, L.P.; Tsang, D.H. NOMA-assisted multi-access mobile edge computing: A joint optimization of computation offloading and time allocation. IEEE Trans. Veh. Technol. 2018, 67, 12244–12258. [Google Scholar] [CrossRef]
- Zhang, Y.W.; Zhang, W.M.; Peng, K.; Yan, D.C.; Wu, Q.l. A novel edge server selection method based on combined genetic algorithm and simulated annealing algorithm. Autom. Časopis Autom. Mjer. Elektron. Rčunarstvo Komun. 2021, 62, 32–43. [Google Scholar] [CrossRef]
- Dilanka, G.; Viranga, L.; Pamudith, R.; Gamage, T.D.; Ranaweera, P.; Balapuwaduge, I.A.; Liyanage, M. A novel server selection strategy for multi-access edge computing. In Proceedings of the 2021 IEEE International Conference on Advanced Networks and Telecommunications Systems (ANTS), Hyderabad, India, 13–16 December 2021; pp. 414–419. [Google Scholar]
- Liu, H.; Cao, G. Deep reinforcement learning-based server selection for mobile edge computing. IEEE Trans. Veh. Technol. 2021, 70, 13351–13363. [Google Scholar] [CrossRef]
- Goudarzi, M.; Palaniswami, M.; Buyya, R. A distributed deep reinforcement learning technique for application placement in edge and fog computing environments. IEEE Trans. Mob. Comput. 2021, 22, 2491–2505. [Google Scholar] [CrossRef]
- Wang, Z.; Goudarzi, M.; Gong, M.; Buyya, R. Deep reinforcement learning-based scheduling for optimizing system load and response time in edge and fog computing environments. Future Gener. Comput. Syst. 2024, 152, 55–69. [Google Scholar] [CrossRef]
- Zhang, X.; Li, Z.; Lai, C.; Zhang, J. Joint edge server placement and service placement in mobile-edge computing. IEEE Internet Things J. 2021, 9, 11261–11274. [Google Scholar] [CrossRef]
- Li, C.; Zhang, Q.; Huang, C.; Luo, Y. Optimal service selection and placement based on popularity and server load in multi-access edge computing. J. Netw. Syst. Manag. 2023, 31, 15. [Google Scholar] [CrossRef]
- Bhooanusas, N.; Sou, S.I. Measurement-based IoT Server Selection for Mobile Edge Computing. In Proceedings of the 2021 22nd Asia-Pacific Network Operations and Management Symposium (APNOMS), Tainan, Taiwan, 8–10 September 2021; pp. 17–20. [Google Scholar]
- Liu, F.; Huang, Z.; Wang, L. Energy-efficient collaborative task computation offloading in cloud-assisted edge computing for IoT sensors. Sensors 2019, 19, 1105. [Google Scholar] [CrossRef]
- Li, S.; Tao, Y.; Qin, X.; Liu, L.; Zhang, Z.; Zhang, P. Energy-aware mobile edge computation offloading for IoT over heterogenous networks. IEEE Access 2019, 7, 13092–13105. [Google Scholar] [CrossRef]
- Chen, M.H.; Liang, B.; Dong, M. Joint offloading and resource allocation for computation and communication in mobile cloud with computing access point. In Proceedings of the IEEE INFOCOM 2017-IEEE Conference on Computer Communications, Atlanta, GA, USA, 1–4 May 2017; pp. 1–9. [Google Scholar]
- Huang, L.; Feng, X.; Zhang, L.; Qian, L.; Wu, Y. Multi-server multi-user multi-task computation offloading for mobile edge computing networks. Sensors 2019, 19, 1446. [Google Scholar] [CrossRef]
- Munoz, O.; Pascual-Iserte, A.; Vidal, J. Optimization of radio and computational resources for energy efficiency in latency-constrained application offloading. IEEE Trans. Veh. Technol. 2014, 64, 4738–4755. [Google Scholar] [CrossRef]
- Huang, L.; Feng, X.; Feng, A.; Huang, Y.; Qian, L.P. Distributed deep learning-based offloading for mobile edge computing networks. Mob. Netw. Appl. 2022, 27, 1123–1130. [Google Scholar] [CrossRef]
- You, C.; Huang, K.; Chae, H.; Kim, B.H. Energy-efficient resource allocation for mobile-edge computation offloading. IEEE Trans. Wirel. Commun. 2016, 16, 1397–1411. [Google Scholar] [CrossRef]
- Bi, S.; Zhang, Y.J. Computation rate maximization for wireless powered mobile-edge computing with binary computation offloading. IEEE Trans. Wirel. Commun. 2018, 17, 4177–4190. [Google Scholar] [CrossRef]
- Wang, Y.; Sheng, M.; Wang, X.; Wang, L.; Li, J. Mobile-edge computing: Partial computation offloading using dynamic voltage scaling. IEEE Trans. Commun. 2016, 64, 4268–4282. [Google Scholar] [CrossRef]
- You, C.; Huang, K.; Chae, H. Energy Efficient Mobile Cloud Computing Powered by Wireless Energy Transfer. IEEE J. Sel. Areas Commun. 2016, 34, 1757–1771. [Google Scholar] [CrossRef]
- Huang, L.; Bi, S.; Zhang, Y.J.A. Deep reinforcement learning for online computation offloading in wireless powered mobile-edge computing networks. IEEE Trans. Mob. Comput. 2019, 19, 2581–2593. [Google Scholar] [CrossRef]
- Dinh, T.Q.; Tang, J.; La, Q.D.; Quek, T.Q. Offloading in mobile edge computing: Task allocation and computational frequency scaling. IEEE Trans. Commun. 2017, 65, 3571–3584. [Google Scholar]
- Dinh, T.Q.; La, Q.D.; Quek, T.Q.; Shin, H. Learning for computation offloading in mobile edge computing. IEEE Trans. Commun. 2018, 66, 6353–6367. [Google Scholar] [CrossRef]
- Ge, X.; Cheng, H.; Guizani, M.; Han, T. 5G wireless backhaul networks: Challenges and research advances. IEEE Netw. 2014, 28, 6–11. [Google Scholar] [CrossRef]
- Melendez, S.; McGarry, M.P. Computation offloading decisions for reducing completion time. In Proceedings of the 2017 14th IEEE Annual Consumer Communications & Networking Conference (CCNC), Las Vegas, NV, USA, 8–11 January 2017; pp. 160–164. [Google Scholar]
- 3rd Generation Partnership Project (3GPP). 5G; Study on Channel Model for Frequencies from 0.5 to 100 GHz; Technical Report; ETSI: Sophia Antipolis, France, 2020; 3GPP TR 38.901 version 16.1.0 Release 16. [Google Scholar]
- Kumar, K.; Lu, Y.H. Cloud computing for mobile users: Can offloading computation save energy? Computer 2010, 43, 51–56. [Google Scholar] [CrossRef]
- Tanenbaum, A.S.; Bos, H. Modern Operating Systems; Pearson Education, Inc.: London, UK, 2024. [Google Scholar]
- Parekh, A.K.; Gallager, R.G. A generalized processor sharing approach to flow control in integrated services networks: The single-node case. IEEE/ACM Trans. Netw. 1993, 1, 344–357. [Google Scholar] [CrossRef]
- Kobayashi, H.; Mark, B.L. System Modeling and Analysis: Foundations of System Performance Evaluation; Pearson Education: Noida, India, 2009. [Google Scholar]
- Tran, T.X.; Pompili, D. Joint task offloading and resource allocation for multi-server mobile-edge computing networks. IEEE Trans. Veh. Technol. 2018, 68, 856–868. [Google Scholar] [CrossRef]
- Fang, F.; Wang, K.; Ding, Z.; Leung, V.C. Energy-efficient resource allocation for NOMA-MEC networks with imperfect CSI. IEEE Trans. Commun. 2021, 69, 3436–3449. [Google Scholar] [CrossRef]
- Xue, J.; An, Y. Joint task offloading and resource allocation for multi-task multi-server NOMA-MEC networks. IEEE Access 2021, 9, 16152–16163. [Google Scholar] [CrossRef]
- Harchol-Balter, M. Performance Modeling and Design of Computer Systems: Queueing Theory in Action; Cambridge University Press: Cambridge, UK, 2013. [Google Scholar]
- City of Oulu. Materials on Oulu’s panOULU Internet Network from 2004–2013. Oulu City Data Portal. 2015. Available online: https://data.ouka.fi/data/en_GB/dataset/panoulu (accessed on 1 April 2025).
- Ho, T.M.; Nguyen, K.K. Joint server selection, cooperative offloading and handover in multi-access edge computing wireless network: A deep reinforcement learning approach. IEEE Trans. Mob. Comput. 2020, 21, 2421–2435. [Google Scholar] [CrossRef]


| Parameters | Values |
|---|---|
| Number of UE | 300 |
| Number of BSs | 36 |
| Number of BSs hosting ESs | 16 |
| Total number of ESs | 160 |
| Service rate of each server | tasks/s |
| Task arrival rate | tasks/s |
| Offload bandwidth | 100 MHz |
| Backhaul link bandwidth | 500 MHz |
| Noise spectral density | dBm/Hz |
| Task size | MB |
| Result size | MB |
| Required CPU cycles per bit | Exp() |
| User transmit power | 200 mW |
| BS transmit power | 1 W |
| Path-loss exponent (offload) | 3 |
| Path-loss exponent (migrate) | |
| 2 GHz | |
| 1 KHz |
| Parameters | Values |
|---|---|
| Number of UEs | 300 |
| Number of BSs | 36 |
| UE speed | Uniform m/s |
| RWP pause time | Uniform s |
| Task data size, Class 1 | Uniform KB |
| Required CPU cycles per bit, Class 1 | Uniform |
| Task data size, Class 2 | Uniform KB |
| Required CPU cycles per bit, Class 2 | Uniform |
| Result size | MB |
| (tasks/s per user) | |
| GHz | |
| 2 GHz | |
| 24 | |
| p | 2 |
| dBm | |
| dBm | |
| G | 20 dB |
| 30 GHz | |
| 25 m | |
| m | |
| dB | |
| Offload bandwidth | 100 MHz |
| Backhaul link bandwidth | 500 MHz |
Disclaimer/Publisher’s Note: The statements, opinions and data contained in all publications are solely those of the individual author(s) and contributor(s) and not of MDPI and/or the editor(s). MDPI and/or the editor(s) disclaim responsibility for any injury to people or property resulting from any ideas, methods, instructions or products referred to in the content. |
© 2025 by the authors. Licensee MDPI, Basel, Switzerland. This article is an open access article distributed under the terms and conditions of the Creative Commons Attribution (CC BY) license (https://creativecommons.org/licenses/by/4.0/).
Share and Cite
Aljobory, K.; Yazici, M.A. Edge Server Selection with Round-Robin-Based Task Processing in Multiserver Mobile Edge Computing. Sensors 2025, 25, 3443. https://doi.org/10.3390/s25113443
Aljobory K, Yazici MA. Edge Server Selection with Round-Robin-Based Task Processing in Multiserver Mobile Edge Computing. Sensors. 2025; 25(11):3443. https://doi.org/10.3390/s25113443
Chicago/Turabian StyleAljobory, Kahlan, and Mehmet Akif Yazici. 2025. "Edge Server Selection with Round-Robin-Based Task Processing in Multiserver Mobile Edge Computing" Sensors 25, no. 11: 3443. https://doi.org/10.3390/s25113443
APA StyleAljobory, K., & Yazici, M. A. (2025). Edge Server Selection with Round-Robin-Based Task Processing in Multiserver Mobile Edge Computing. Sensors, 25(11), 3443. https://doi.org/10.3390/s25113443