Article

Cavity Effects and Prediction in the Vibration of Large-Section Rectangular Coal Roadways Induced by Deep-Hole Bench Blasting in Open-Pit Mines

1
Institute of Blasting Technology, Liaoning Technical University, Fuxin 123000, China
2
School of Civil Engineering, Liaoning Technical University, Fuxin 123000, China
3
School of Mining, Liaoning Technical University, Fuxin 123000, China
*
Author to whom correspondence should be addressed.
Sensors 2025, 25(11), 3393; https://doi.org/10.3390/s25113393
Submission received: 27 April 2025 / Revised: 25 May 2025 / Accepted: 26 May 2025 / Published: 28 May 2025
(This article belongs to the Section Physical Sensors)

Abstract

:
The dynamic response law of the vibration cavity effect in the adjacent large-section rectangular coal roadways induced by deep-hole bench blasting vibrations was deeply revealed, and the prediction accuracy of the PPV in the coal roadway was improved. The vibration equations of the coal roadway were derived based on the stress wave propagation theory and the wave-front momentum conservation theorem. Based on coal roadway vibration monitoring data and numerical simulations, the cavity effect and vibration response characteristics of the coal roadway induced by deep-hole bench blasting under varying blast source distances and relative angle conditions were analyzed. A predictive model for PPV of rectangular coal roadway surrounding rock, incorporating the relative angle as one of the key influencing factors, was developed. The results showed that the presence of cavities and changes in the relative angle enhance the asymmetry of the dynamic response of blasting stress waves near the free surfaces of the surrounding rock on each side of the coal roadway, resulting in significant differences. Moreover, as the blasting distance decreases, the cavity effect tends to promote greater PPV differences on each side of the coal roadway. The prediction model exhibited improved accuracy by about 15.6% compared to the traditional Sadovski equation for the face-blasting side of the coal roadway. It demonstrates better adaptability and predictive capability. This research provides a theoretical basis for the dynamic response of adjacent large-section rectangular coal roadways and for preventing dynamic instability failures in open-pit mining.

1. Introduction

Open-pit bench blasting is widely employed in mining engineering due to its cost effectiveness and high efficiency. However, drilling and blasting inevitably generate harmful effects [1,2], and the effect of blast-induced vibration on the stability of buildings (structures) within a specific range is the most prominent [3,4]. In particular, when the open-pit mining areas are adjacent to underground mining zones, the effects of blast-induced vibration pose a severe threat to the stability and safety of adjacent underground large-section rectangular coal roadways, such as wall caving, crack development in the surrounding rock, roof collapse, etc. Therefore, the dynamic response of large-section rectangular coal roadway surrounding rock under the effect of blast-induced vibration should be investigated in open-pit mining, and an accurate model for predicting the peak particle velocity (PPV) of the surrounding rock should be established. It is of great engineering significance for preventing damage to large-section rectangular coal roadways caused by intense vibrations resulting from large-charge, deep-hole bench blasting in open-pit mines, as well as ensuring their structural stability.
The PPV is a primary metric for assessing the strength of blast-induced vibrations. It is a key parameter in blast vibration safety standards [5,6]. Therefore, it is often used as a control criterion for blast vibration.
In terms of open-pit blasting, Duvall and Fogelson [7] investigated the attenuation of blasting seismic waves and established seismic standards for various buildings. The USBM investigators Ambraseys and Hendron [8] advised the actual distance to be divided by the cube root of the charge weight. Bilgin et al. [9] proposed an equation by adding a burden parameter to classical PPV prediction models. Rai and Singh [10] proposed a PPV prediction equation considering an inelastic attenuation factor and analyzed its calculation results in comparison with other vibration prediction equations for the same dataset. The analysis shows that this prediction formula can be effectively used for calculating the safe charge per delay more precisely. Ak and Konuk [11] investigated the impacts of discontinuity frequency on the propagation of blast-induced vibration in bench blasting and established the relationship between the scaled distance and discontinuity frequency with the PPV. Y. Yan et al. [12] summarized the influential parameters on blast-induced ground vibrations and evaluated the free face, maximum charge per delay, distance from the blasting source to the monitored point, and geological conditions, confirming their influence in predicting the PPV. Khandelwal et al. [13] analyzed various blasting design parameters on predicting the PPV and proposed a new empirical equations based on dimensional analysis. It comprehensively reflected the influence of parameters such as the Young’s modulus of rock mass, powder factor, depth and hole diameter, spacing, burden, and charge length on the attenuation law of blast-induced vibration. W. M. Yan et al. [14] found that the influential parameters and empirical equations for predicting the PPV were uncertain and proposed using the Bayesian technique and Monte Carlo simulation to predict the PPV. This method could offer practicing engineers confidence intervals when the equation is used to estimate a blast-induced vibration. Based on the scaled distance concept used for inelastic attenuation factor, Simangunsong and Wahyudi [15] analyzed the effect of a bedding plane on the prediction of blast-induced ground vibration in open-pit coal mines. Based on the analysis results, the relationship between the incident angle, the number of coal layers, and the PPV was established. Yilmaz [16] proposed a new equation for predicting the PPV, for which the coefficient of determination of regression results was high, indicating the correlation between the scaled distance and the PPV with inelastic attenuation. Kumar et al. [17] proposed an empirical equation for predicting the PPV by considering the effects of rock mechanical and geological properties, like the unit weight, rock quality designation (RQD), geological strength index (GSI), and uniaxial compressive strength (UCS). Chen et al. [18] investigated the influence of the cylindrical charge length on blast-induced vibration based on elastic–plastic theory and provided a new equation for predicting the PPV considering the characteristics of cylindrical charge length. Murmu et al. [19] proposed two empirical equations, one considering the overburden and the other without it. Compared with the regression results of two empirical equations, the results showed that overburden did not significantly affect PPV. Yin et al. [20] investigated different rock masses on the attenuation characteristics of blast-induced vibration, The results indicated that the development degree of rock mass joints affected the attenuation rate of the PPV. It indicated that the more joints there are, the higher the attenuation rate of the PPV. A modified equation for predicting PPV was developed by considering the joint number in the rock mass. Deng et al. [21] derived the empirical equation for predicting PPV, which was modified for multi-hole blasting based on stress wave propagation theory. The proposed model could adequately reflect the propagation of PPV under multi-hole blasting.
In terms of underground blasting, Nan Jiang et al. [22] investigated the blast-induced vibration attenuation of the slope subjected to underground mining and analyzed the distribution characteristics of PPV. Meanwhile, a PPV prediction model suitable for open-pit mine slopes subjected to underground mining considering the mining depth and elevation was proposed. Nan Jiang et al. [23] investigated the impact of subway excavation on adjacent buried gas pipelines, and a mathematical model was established to describe the attenuation of the PPV with respect to the depth of tunnel blasting. Wang et al. [24], based on the diffraction and reflection amplification effects of blast-induced vibration around tunnels, calculated the possible minimum diffraction distance of blast-induced vibration around the rock tunnels and improved the scaled distance (SD) of the empirical equations to predict the PPV on adjacent tunnel sections. This equation efficiently enhanced the accuracy of predicting the PPV. W. Li et al. [25] compared several empirical equations for predicting the PPV of the adjacent tunnel surrounding rock based on the rock strength index (GSI). The improved equations could be adopted to predict the PPV for complex geological conditions.
In the field of machine learning and artificial intelligence, and with its rapid development [26,27], these methods are widely used in predicting blast-induced vibration and show excellent applicability.
Many research studies have been carried out on the effect of open-pit bench blasting and the corresponding influence of blast-induced vibration on the dynamic response of underground roadways. Litwiniszyn J [28] carried out a theoretical investigation into dynamic instability in underground roadways caused by blast-induced stress waves. It was found that a rarefaction stress wave and a jump-like change in the state of stress in the surrounding rock are generated when the surrounding rock reaches the instability condition. Within the interval of the jump-like change in stress, the skeleton of the surrounding rock is destroyed, and an outburst is initiated. Singh et al. [29,30] analyzed the dynamic response of blast-induced vibration on the top plate, pillar, and bottom plate of an adjacent roadway in open-pit blasting and determined the safety thresholds for the vibration of the underground roadway surrounding rocks. Duan et al. [31] evaluated the stability of open-pit bench blast seismic waves on the surrounding rocks and ancillary structures of underground roadways. However, the influence of the roadway cavity and the dynamics response of the relative position on the evolution of the surrounding rock and the accuracy of predicting the PPV have not been considered in previous studies.
Although the research on blast-induced vibration PPV control and prediction has been fully developed and applied, the influence of the differences in reflection and stacking effects of blasting stress waves on the coal roadway surrounding rock on each side (i.e., “the cavity effect”), as well as the relative position of the blasting-induced dynamic disturbance, on stress evolution and the accuracy of PPV prediction in large-section rectangular coal roadway surrounding rock has not yet been thoroughly investigated. Therefore, in this paper, the vibration response of roadway surrounding rock was carried out using stress wave propagation theory and conservation laws of wave-front momentum. Then, the dynamic response of the large-section rectangular coal roadway surrounding rock was analyzed under varying blast source distances and relative angle (i.e., θ , the relative angle between the position of the open-pit bench blasting with the underground coal roadway) conditions using finite element (FE) analysis. Finally, based on the analysis of the cavity effect in the vibration response of large-section coal roadway surrounding rock, a PPV prediction model incorporating the relative angle ( θ ) as one of the key influencing factors was developed, which aimed to significantly improve adaptability and prediction accuracy, providing a more precise tool for predicting the vibration response of the large-section coal roadway surrounding rock. This research provides the theory for the precise prevention of underground large-section coal roadway dynamic instability failures under vibrations due to open-pit bench blasting.

2. Vibrating Equations for the Adjacent Roadway in Open-Pit Bench Blasting

The open-pit bench blasting load enhances the dynamic response of the underground roadway surrounding rock, and the stress in the surrounding rock is redistributed under the action of blast-induced and surface reflection stress waves. When stress intensity is greater than the dynamic strength threshold of the rock mass, it promotes crack propagation and expansion in the surrounding rock, deteriorating the properties and reducing the bearing capacity of the surrounding rock, thereby inducing sudden instability in the surrounding rock. In open-pit bench blasting, underground roadways are mainly affected by blast-induced stress waves and reflected stress waves from the surface. As shown in Figure 1, after the blast-induced stress wave is reflected on the surface, it generates reflected P-waves and S-waves. Meanwhile, the incident wave generates reflected P-waves and S-waves on the free surface of the roadway surrounding rock.
The calculations were further simplified by adopting the following steps:
(1)
The cylindrical charge was simplified to spherical charge, while only P-waves with a constant excitation frequency were considered; this assumption was suitable for the preliminary approximate analysis, but it may ignore the different propagation characteristics of the cylindrical charge in the axial and radial directions.
(2)
The rock mass was assumed to be a homogeneous and isotropic linear elastomer.
(3)
The compressive stress was defined to be positive.
In the analysis, the case of blast-induced stress waves and surface-reflected stress waves acting on the free face of the roadway surrounding rock was considered a special case of stress wave propagation in joints [32], i.e., the rock on the other side of the joints was replaced by air (wave impedance is 0). This was based on the theory of stress wave propagation and the theorem of momentum conservation in front of the wave, combined with the time-domain recursive method [32,33,34], to carry out the derivation of vibrating equations for the surrounding rock of cavity roadway under the action of blasting stress waves and surface-reflected stress waves.

2.1. Interaction of the Blast Stress Wave with the Surface
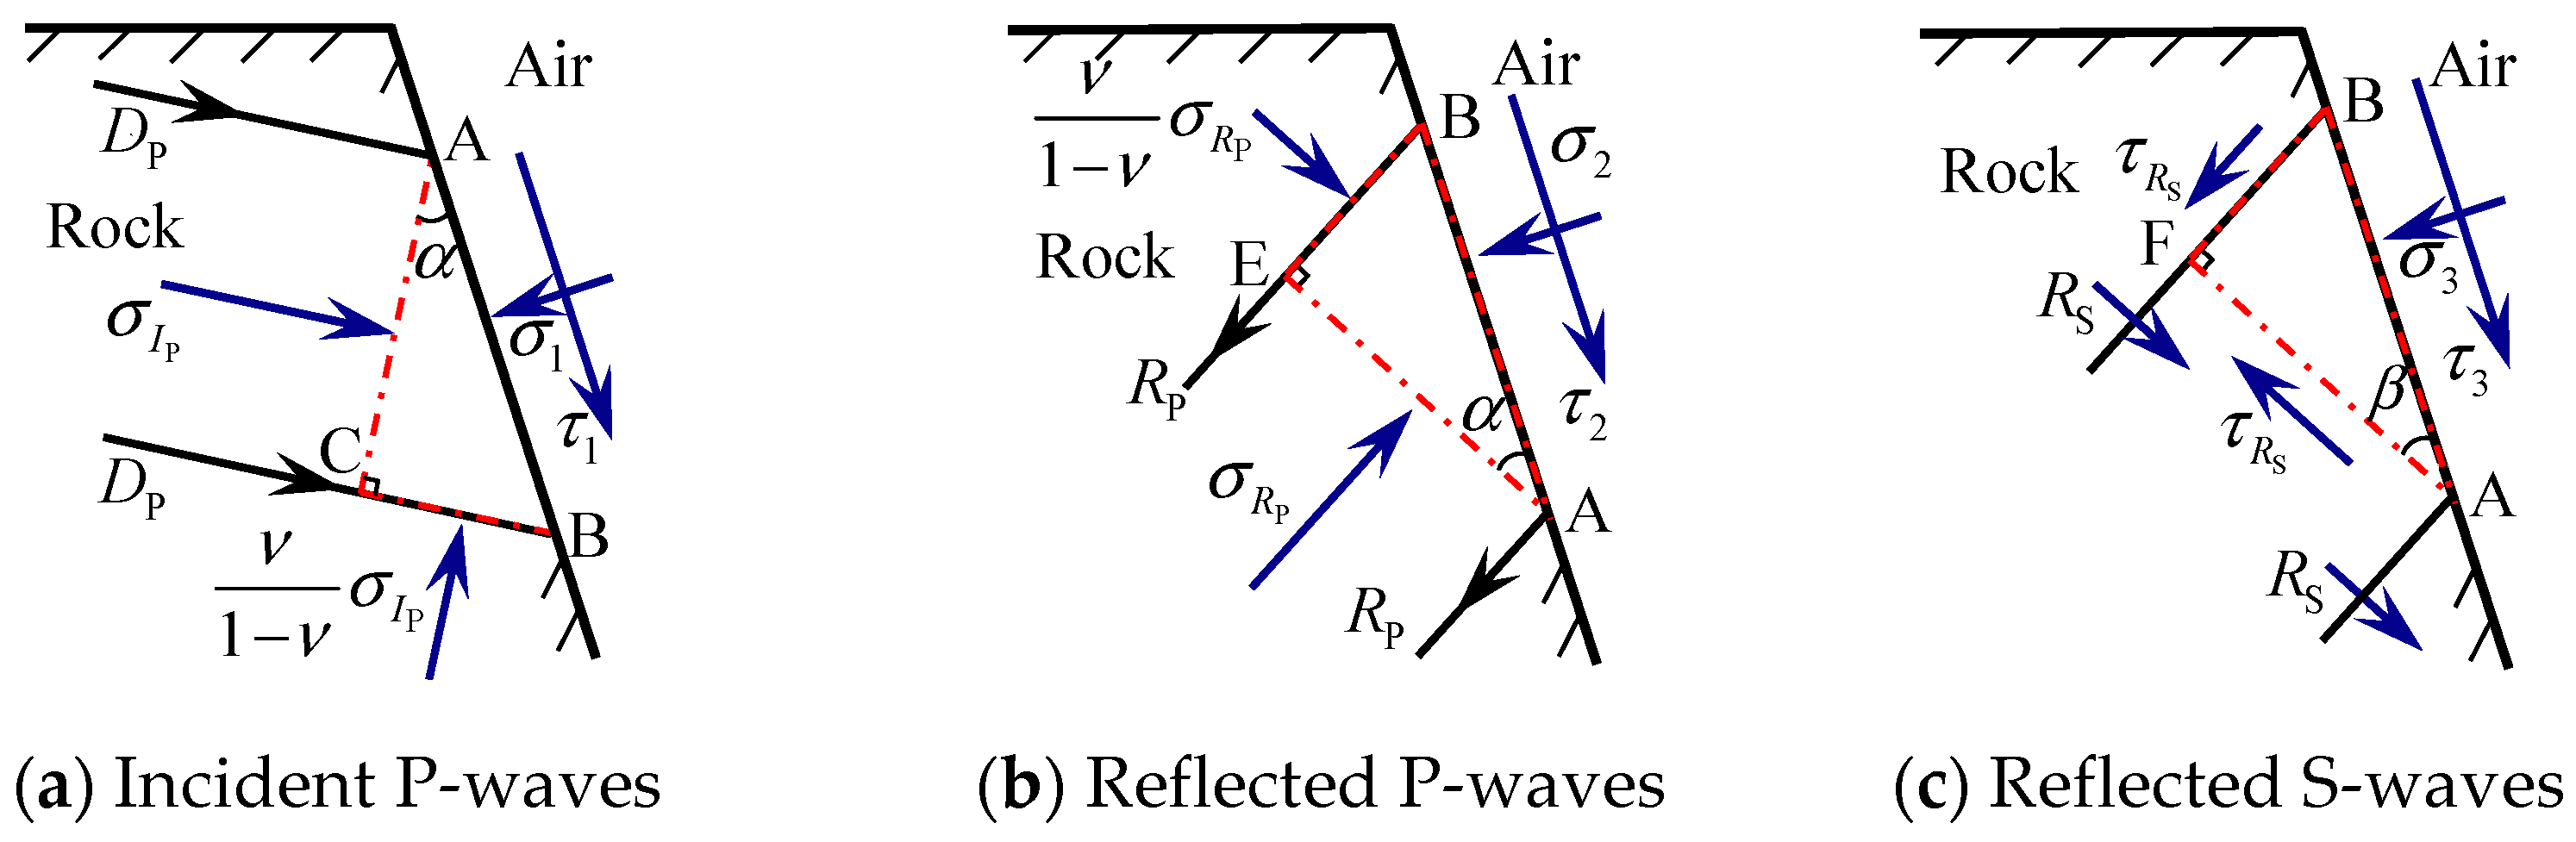
As illustrated in Figure 2a, when an incident P-wave propagates to a free face, a tiny element ABC consists of AB, AC, and BC, where AB is the free face of the surface, BC and AC are the wave beam and the wave front of the P-wave, respectively, and is α the angle of incidence. The tiny element of the reflected P-wave interacting with the rock is ABE, BE is the wave front of the reflected P-wave, and AE is the wave beam of the reflected P-wave. According to Snell’s law [32], the incidence and the reflection angles of the P-wave are equal, so the angle of the reflected P-wave is also α , as shown in Figure 2b. Similarly, the tiny element of the reflected S-wave interacting with the rock is ABF, and BF, AF, and β are the wave front, wave beam, and the angle of the reflected S-wave, respectively, as shown in Figure 2c.
Approximating the current model as a one-dimensional strain plane wave problem, assuming that the transverse dimension of the free surface is infinitely large, the plane wave can be regarded as a one-dimensional strain wave for analysis, and combined with one-dimensional strain elastic wave theory, the stress on the BC is determined to be equal to σ I P ν / ( 1 ν ) [33,35,36], where σ I P is the normal stress of the wave front of the incident P-wave, and ν denotes the Poisson’s ratio of the rock.
Without considering gravity, the stress for the tiny elements ABC of the surface is shown in Figure 2a, where σ 1 and τ 1 are the direct and shear stresses of the rock on the left side of the free face, respectively. From the force equilibrium condition of tiny elements, the stresses in the vertical direction and radial direction of the free surface AB on the element ABC must satisfy Equations (1) and (2) [34].
In the vertical direction of the free surface AB:
σ 1 σ I P cos 2 α ν 1 ν σ I P sin 2 α = 0
In the radial direction of the free surface AB:
τ 1 σ I P sin α cos α + ν 1 ν σ I P cos α sin α = 0
According to the Snell’s law [34]:
sin β sin α = c S c P = 1 2 ν 2 ( 1 ν )
where c P and c S are the velocities of the P-wave and S-wave in intact rock, respectively.
The expression for ν considering sin α and sin β can be obtained and substituted into Equations (1) and (2) and can be expressed as Equation (4).
σ 1 = σ I P cos 2 β ,     τ 1 = σ I P sin 2 β tan β cot α
Similarly, under the influence of reflected P-waves and reflected S-waves, the stresses σ i and τ i   ( i = 2 ~ 3 ) on the tiny elements ABE and ABF on the free face can be expressed as Equations (5) and (6).
σ 2 = σ R P cos 2 β , τ 2 = σ R P sin 2 β tan β cot α
σ 3 = τ R S sin 2 β , τ 3 = τ R S cos 2 β
Then, the total stress on the free face can be expressed as Equations (7) and (8).
σ = σ 1 + σ 2 + σ 3 = σ I P cos 2 β + σ R P cos 2 β τ R S sin 2 β
τ = τ 1 + τ 2 + τ 3 = σ I P sin 2 β tan β cot α σ R P sin 2 β tan β cot α τ R S cos 2 β
On the boundary of the free surface, the stresses satisfied the conditions of σ = 0 and τ = 0 . Based on Equations (7) and (8), the reflection stresses of the surface free boundary can be expressed as Equations (9)–(11).
σ R P τ R S = B 1 A σ I P
A = cos 2 β sin 2 β tan β cot α
B = cos 2 β sin 2 β sin 2 β tan β cot α cos 2 β

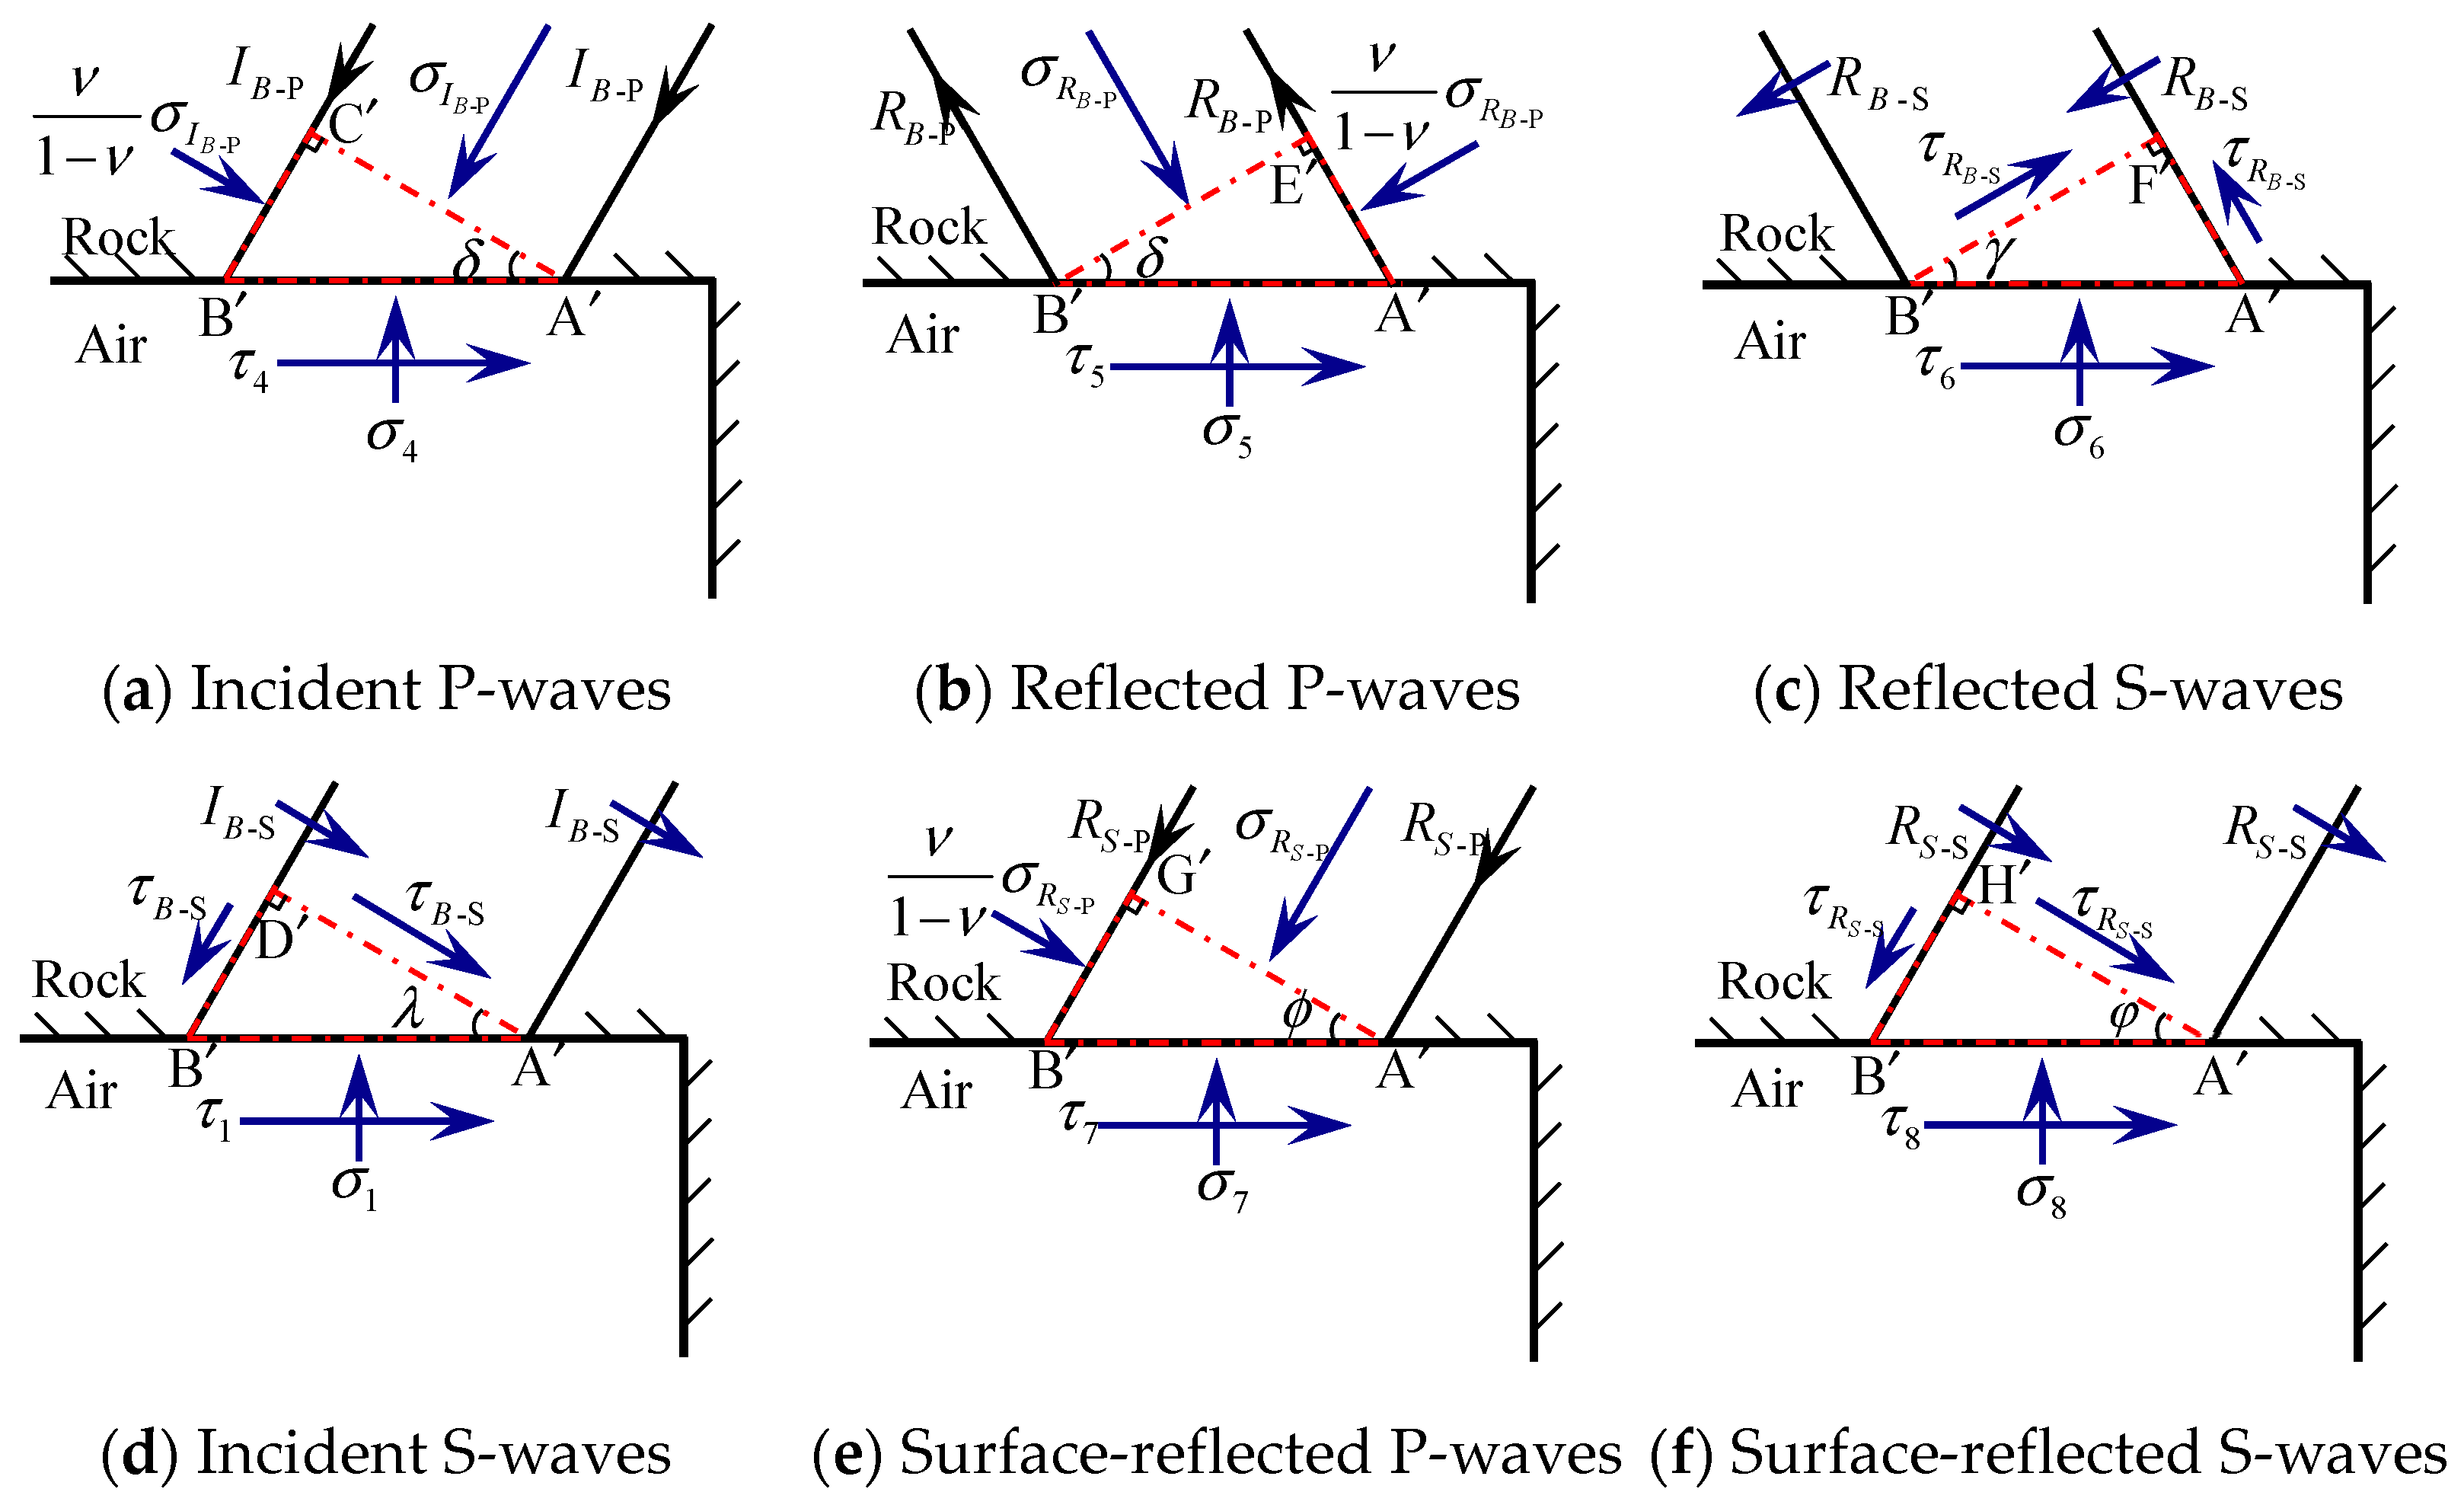
2.2. Interaction of Blasting Stress Wave and Surface-Reflected Wave with Roadway Surrounding Rock

Similar to stress waves interacting with the ground surface, the force state on tiny elements of the roadway surrounding rock acted by the incident P-wave and the surface-reflected wave is shown in Figure 3, respectively.
In Figure 3, σ I B - P and σ R B - P denote the normal stresses of the incident P-wave and reflected P-waves on their wave fronts under blasting stress, respectively; τ R B - S denotes the shear stresses of the reflected S-waves on the wave fronts under blasting stress. σ R S - P and τ R S - S denote the normal stress of P-waves and the shear stress of S-waves reflected from the surface, respectively. θ is the angle of incidence.
For the elements   A   B   C ,   A   B   E ,   A   B   F ,   A   B   G , and   A   B   H on the free face of the roadway surrounding rock in Figure 3, the stresses σ i and τ i   ( i = 4 ~ 8 ) can be expressed as Equations (12)–(16):
σ 4 = σ I B - P cos 2 γ ,     τ 4 = σ I B - P sin 2 γ tan γ cot δ
σ 5 = σ R B - P cos 2 γ , τ 5 = σ R B - P sin 2 γ tan γ cot δ
σ 6 = τ R B - S sin 2 γ , τ 6 = τ R B - S cos 2 γ
σ 7 = σ R S - P cos 2 φ ,     τ 7 = σ R S - P sin 2 φ tan φ cot ϕ
σ 8 = τ R S - S sin 2 φ , τ 8 = τ R S - S cos 2 φ
where δ is the angle of the incident P-wave by the blasting stress, which is equal to the angle of the reflected P-wave; γ is the angle of the reflected S-wave by the blasting stress; ϕ is the angle of incident P-waves reflected from the surface; and φ is the angle of S-waves reflected from the surface.
According to the law of conservation of momentum in the wave front, σ I B - P = z P v I B - P , σ R B - P = z P v R B - P , τ R B - S = z S v R B - S , σ R S - P = z P v R S - P , and τ R S - S = z S v R S - S , where v I B - P and v R B - P are the particle velocities of the incident and reflected P-waves of blasting stress, respectively; v R S - P is the particle velocity of the reflected P-waves of surface-reflected waves; and v R B - S and v R S - S are the particle velocities of the reflected S-waves of blasting stress waves and surface reflection waves, respectively. Hence, the correlation between the stresses on the free face of the roadway surrounding rock and the particle velocities was established. We define z P = ρ c P and z S = ρ c S , where ρ is the density of the intact rock; the meanings of c P and c S are the same as above.
According to the law of momentum conservation at the wave front, the time interval between the incident stress wave and the reflected stress wave is negligible. As a result, both the incident and reflected stress waves act simultaneously on the roadway surrounding rock. Thus, the sum of stresses at the units on the free face of the roadway surrounding rock can be expressed as Equations (17) and (18).
σ = σ 4 + σ 5 + σ 6 + σ 7 + σ 8 = z P v I B - P cos 2 γ + z P v R B - P cos 2 γ z S v R B - S sin 2 γ + z P v R S - P cos 2 φ z S v R S - S sin 2 φ
τ = τ 4 + τ 5 + τ 6 + τ 7 + τ 8 = z p v I B - P sin 2 γ tan γ cot δ z p v R B - P sin 2 γ tan γ cot δ z s v R B - S cos 2 γ     z p v R S - P sin 2 φ tan φ cot ϕ z s v R S - S cos 2 φ
On the free face of the roadway surrounding rock, the stresses still satisfy σ = 0 and τ = 0 . Equations (17) and (18) can be expressed in matrix form as Equation (19), whereas the individual matrices are given by Equations (20)–(22).
v R B - P v R B - S = D 1 C v I B - P D 1 E v R S - P v R S - S
C = z P cos 2 γ z P sin 2 γ tan γ cot δ
D = z P cos 2 γ z S sin 2 γ z P sin 2 γ tan γ cot δ z S cos 2 γ
E = z P cos 2 φ z S sin 2 φ z P sin 2 φ tan φ cot ϕ z S cos 2 φ
The normal components of the velocities on the free face of the roadway surrounding rock can be expressed as Equation (23).
v ¯ n = cos δ v B P cos δ v R B - P + sin γ v R B - S cos ϕ v R S - P + sin φ v R S - S
The tangential components of the velocities on the free face of the roadway surrounding rock can be expressed as Equation (24).
v ¯ τ = sin δ v B P + sin δ v R B - P + cos γ v R B - S + sin δ v R S - P + cos γ v R S - S
Equations (23) and (24) can be expressed in matrix form, as given in Equations (25)–(29).
v ¯ n ( t ) v ¯ τ ( t ) = A P v I B - P + B P v R B - P ( t ) v R B - S ( t ) + C P v R S - P ( t ) v R S - S ( t )
v ¯ n ( t ) v ¯ τ ( t ) = ( A P B P B P 1 A ) v I B - P ( t ) + C P v R S - P ( t ) v R S - S ( t )
A p = cos δ sin δ
B p = cos δ sin γ sin δ cos γ
C p = cos ϕ sin φ sin ϕ cos φ
Equation (26) can be expressed as the vibration equation on the roadway surrounding rock induced by open-pit bench blasting. It is concluded that the particle velocity on the roadway surrounding rock is related to the surrounding rock density, the wave velocity of P- and S-waves, and the angles of incidence and reflection. It confirmed that for the same geological conditions, rock density, wave velocity, and distance between the blasting area and the roadway, the incidence angle of the stress wave determines the characteristics of the dynamic response at different locations of the roadway surrounding rock, leading to disparities in the particle velocity at various locations of the roadway surrounding rock under the bench blasting.

3. Dynamic Response of the Roadway Surrounding Rock

In Section 2, the vibration equation of the roadway surrounding rock under the bench blasting was derived. However, it cannot reflect the influence of the relative angle ( θ ) and the cavity effect on the dynamic response of the roadway surrounding rock. Therefore, numerical simulation was applied to study the dynamic response of the surrounding rock on each side of the roadway in open-pit bench blasting.

3.1. Engineering Survey

The Shangwan underground coal mine and Wujiata open-pit coal mine are located in Ordos, China. The air-return roadway of the Shangwan underground coal mine was located adjacent to the Wujiata open-pit coal mine and parallel to the northern boundary of the coal mine. The relative position between the open-pit mine and the roadway is shown in Figure 4; the cross-section of the roadway was rectangular, with an effective width of 6000 mm and a height of 4000 mm, and was supported by bolt-shotcrete. Specifically, the roof of the roadway was supported by the combination of round steel anchor stock and anchor cables, while the sides of the roadway were supported by anchor stock. The thickness of the shotcrete applied to the roadway surrounding rock was 50 mm, with a strength grade of C20. The thickness of the concrete on the roadway floor was 300 mm, with a strength grade of C30. The parameters of the roadway cross-section and the support parameters are shown in Figure 5.

3.2. Establishment of Finite Element (FE) Model

Based on the actual working conditions of bench blasting in an open-pit coal mine adjacent to the underground roadway, the explicit dynamics analysis software Ansys/Ls-dyna (2022) was applied. The quasi-three-dimensional FE computational models were developed for open-pit bench blasting with distances of 30~120 m from the roadway and with relative angles of 0°, 42°, and 90°, respectively. The schematic of the models is shown in Figure 6. According to the actual blasting parameters, the borehole diameter was 200 mm, the row spacing was 5.0 m, the charge length was 6.0 m, and the charge was a decoupled structure. The FE computational model parameters are listed in Table 1.
In the numerical simulation, the rock mass above the coal seam was set as the same type, and multiple layers were utilized for bench blasting, with each bench having identical material parameters. Therefore, the reflection and transmission effects of the stress wave within the rock mass above the coal seam were not considered. To address the coupling between the anchor stock and the units of the roadway surrounding rock, it was assumed that the anchor stock was fully bonded with the roadway surrounding rock. The coupling parameters are set by using the keyword *CONSTRAINED_LAGRANGE-IN_SOLID. A non-reflecting boundary condition was set up at the bottom and the left side of the numerical model to prevent the stress reflection on the calculation results.
Gravitational acceleration was applied in the vertical direction, with fixed boundary conditions imposed at the bottom of the model. The Arbitrary Lagrangian Eulerian (ALE) algorithm was selected between the rock and the explosive to avoid the loss of computational accuracy due to Lagrangian grid distortion during large deformation analysis.

3.2.1. Explosive Model and State Equation

The explosive parameters were mainly set with reference to the actual blasting parameters. *MAT_HIGH_EXPLOSIVE_BURN was selected as the explosive material, and the *EOS_JWL state equation (Equation (30)) was used to describe the relationship between the relative volume V and the initial internal energy per elements volume E 0 under the explosion pressure [37].
P = A 1 ω R 1 V e R 1 V + B 1 ω R 2 V e R 2 V + ω E 0 V 0
where P is the explosive pressure, Pa; V 0 is the initial relative volume; R 1 , R 2 , and ω are the state constants of the equation; E 0 is the initial internal energy, J/m3; and A and B are the material constants.
The material parameters and equation of state parameters are listed in Table 2.

3.2.2. Coal and Rock Materials

The *MAT_JOHNSON_HOLMQUIST_CONCRETE material model considers the strain rate effect and damage evolution mechanism of brittle materials under explosion and shock loading. It is the most commonly used material model for rocks, concrete, and other materials [38,39]. The expression is defined as:
σ * = [ A ( 1 D ) + B p * N ] [ 1 + C ln ( ε ˙ * ) ] σ * = σ / f c ; p * = p / f c ; ε ˙ * = ε ˙ / ε ˙ 0 D = [ ( Δ ε p + Δ μ p ) / ( D 1 ( p * + T * ) D 2 ) ] ;   T * = T / f c
where σ * is the normalized equivalent stress; p * is the normalized pressure; ε ˙ * is the dimensionless strain rate; T * is the normalized maximum tensile hydrostatic pressure; σ is the actual equivalent stress; p is the pressure; f c is the quasi-static uniaxial compressive strength; ε ˙ is the actual strain rate; ε ˙ 0 is the reference strain rate; A is the cohesion parameter; B is the hydrostatic pressure parameter; N is the hydrostatic pressure index; C is the strain rate parameter; D is the damage variable, 0 D 1 ; D 1 and D 2 are the material damage constants; Δ ε P is the equivalent plastic strain increment; Δ μ P is equivalent plastic volume strain increment; and T is the material maximum tensile hydrostatic pressure.
In this research, this material model was used to simulate coal, rock [39], and anchored concrete [38]. The relevant parameters are presented in Table 3.

3.2.3. Anchor Stock Material

In blasting operation, the anchor material model should fully consider the strain rate effect of the material. The model *MAT-PLASTIC_KINEMATIC is a strain rate-dependent elastic–plastic material model with failure criteria; the relationship between the tensile strength of materials and strain rate, as well as the compressive yield strength and strain rate, was described using the Cowper Symonds model. The material parameters are shown in Table 4.
The parameters for the air materials and the stemming material in this paper are as given in [6].

3.3. Validation of the Numerical Model

The maximum quantity per delay, the distance between the blasting source and the measured point, blasting parameters, geological conditions, and additional factors influence the blast-induced ground vibration. According to safety regulations for blasting (GB6722-2014) [40], the empirical equation proposed by Sadovski was used to predict the peak particle velocity (PPV), as expressed in Equation (32).
PPV = K ( W 1 / 3 / R ) α
where PPV is the peak particle velocity, cm/s; W the maximum quantity per delay of emulsion explosive, kg; R the distance between the blasting source and the measured point, m; and K and α are the geological correlation coefficient.
To validate the accuracy and reliability of the model parameters, the results of on-site single-hole blasting and numerical simulation were compared. The velocity–time curves for both the experimental and simulated velocities are shown in Figure 7, while Figure 8 presents the test and simulated PPV fitted using Sadovski’s equation. The results confirm that the model parameters used in this paper can accurately simulate the stress distribution and vibration response of the surrounding rock in the roadway under the explosion.

4. Numerical Results

4.1. Analysis of the Cavity Effect on the Roadway Surrounding Rock

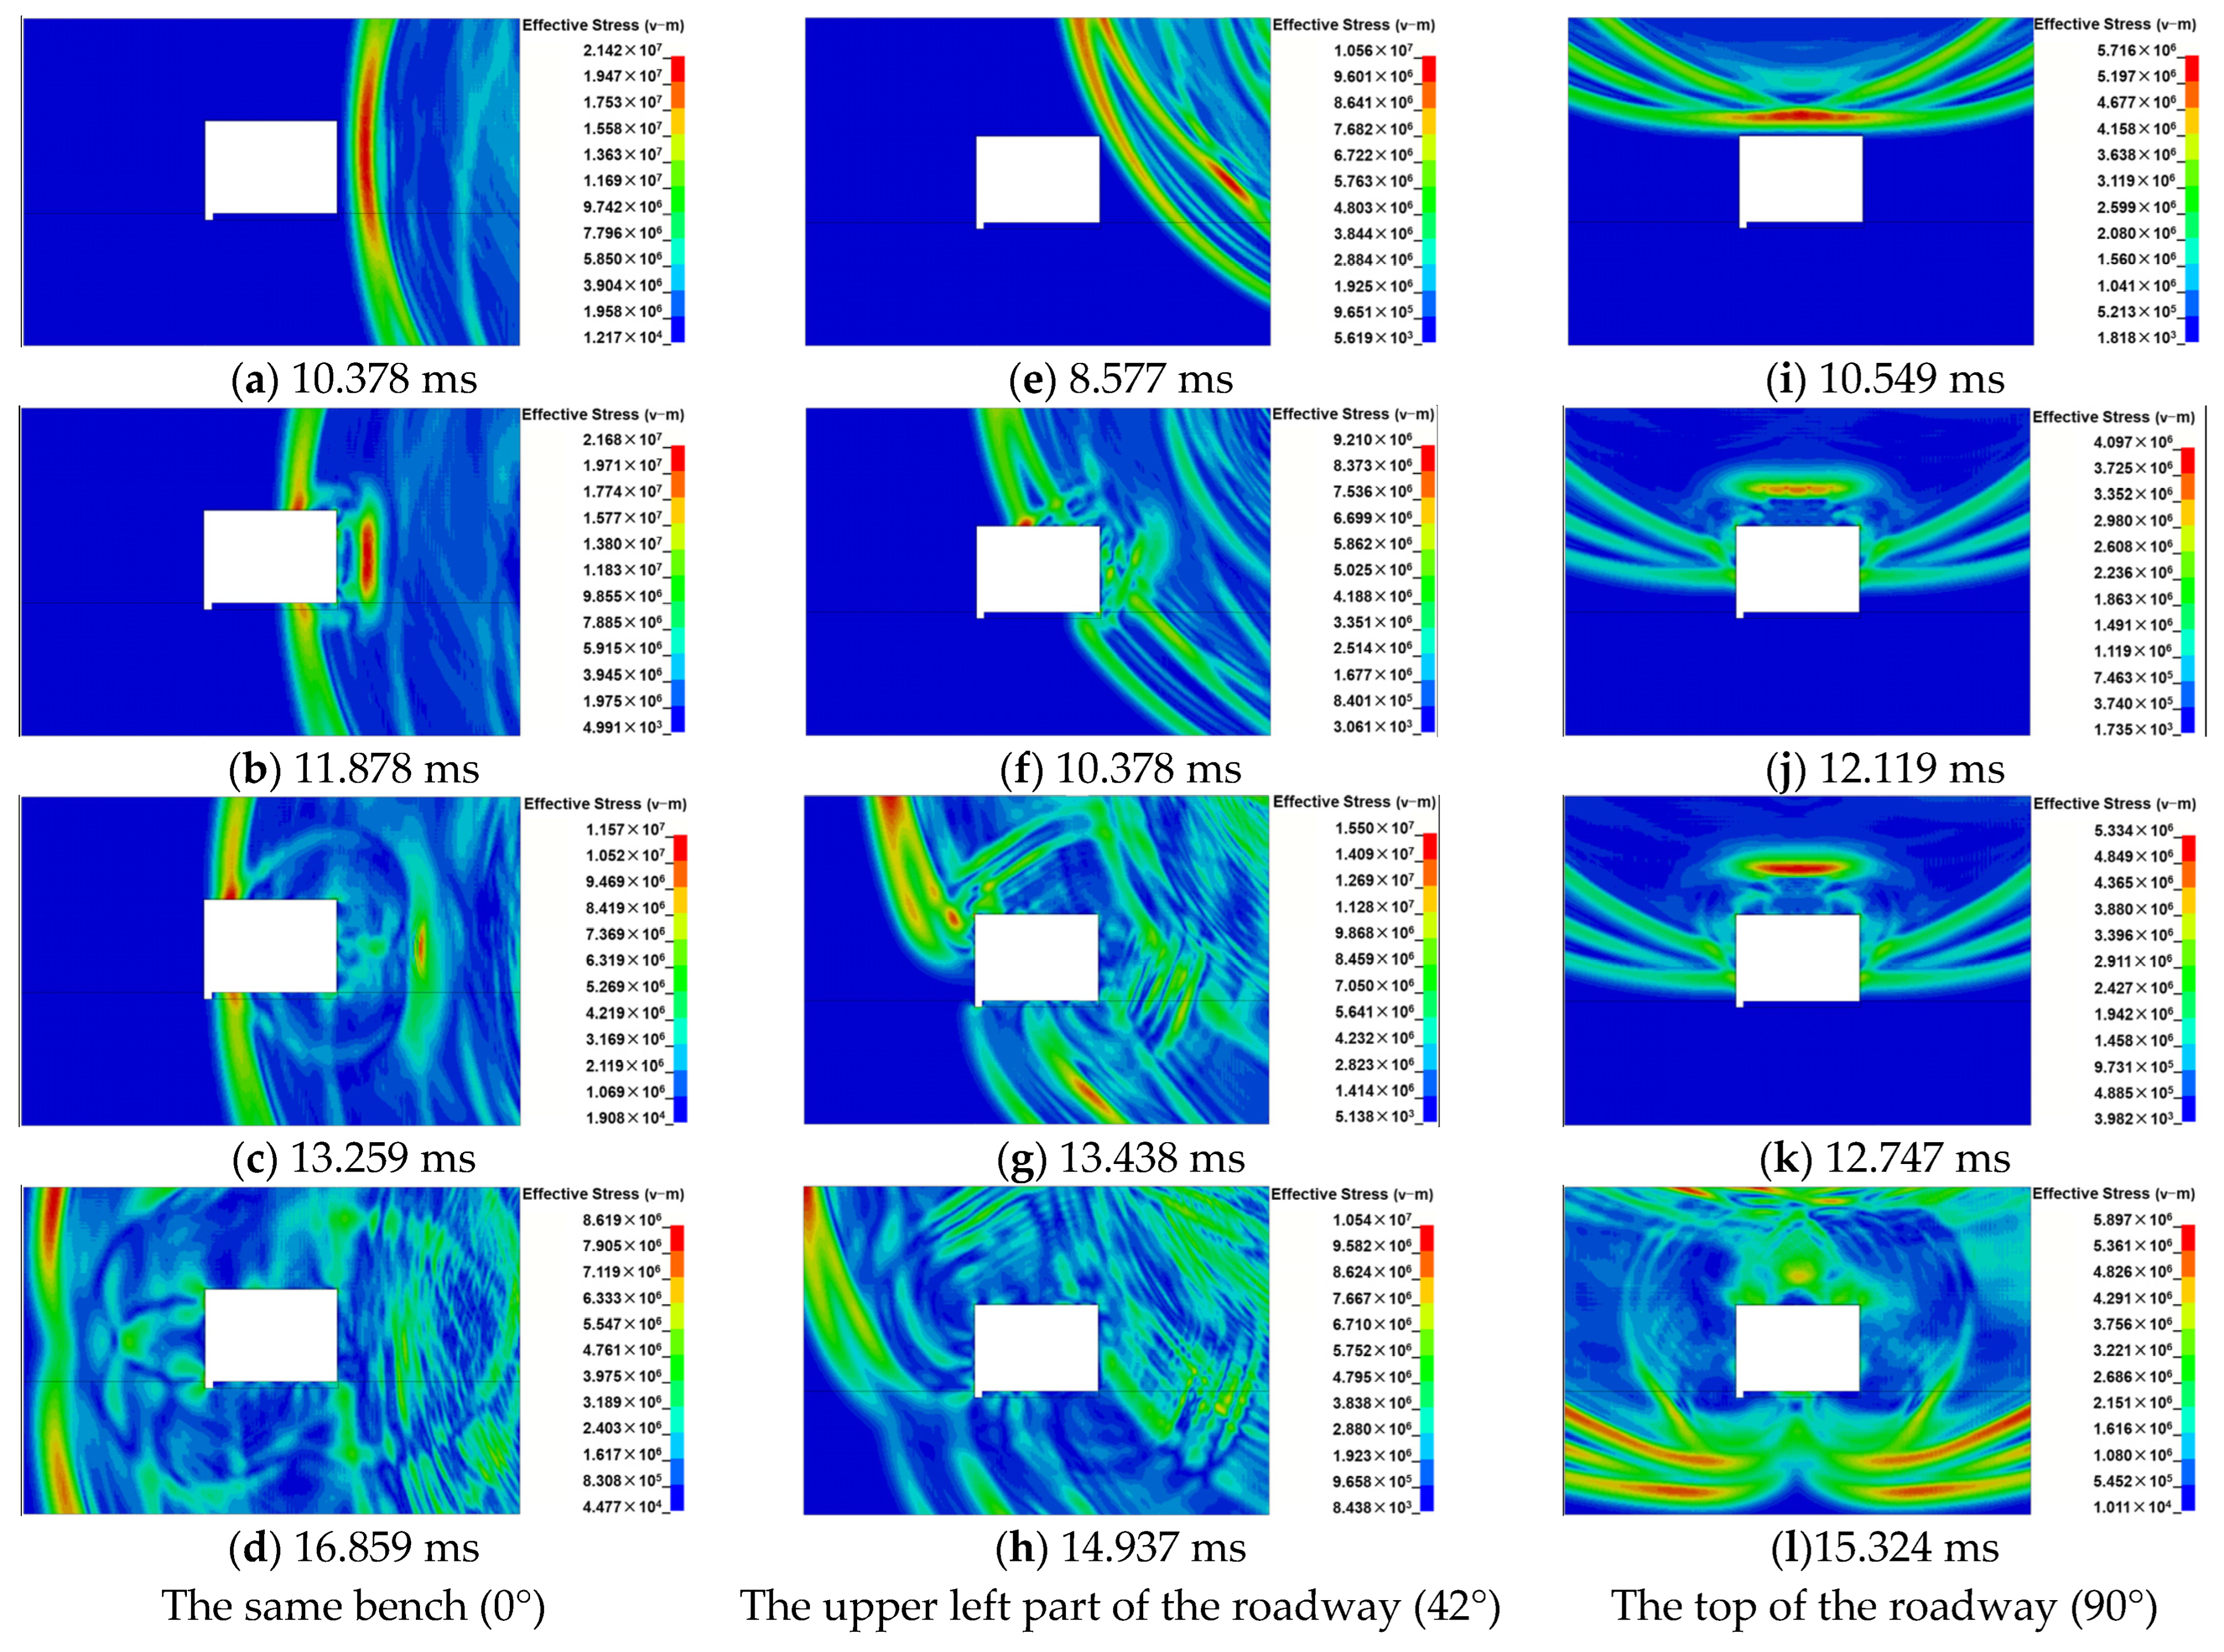
Numerical simulations of the dynamic disturbance on the roadway surrounding rock in open-pit bench blasting with different distances and bench heights were carried out. In order to investigate the influence of bench height on the cavity effect in open-pit bench blasting, the stress clouds of roadway surrounding rock in different blasting locations were produced and are shown in Figure 9.
In order to further analyze the stress wave propagation in the roadway surrounding rock, the blasting source at the right, upper left, and top of the roadway were simulated. The resulting stress maps are shown in Figure 9a–d, Figure 9e–h, and Figure 9i–l, respectively. It is concluded that the stress wave propagates to the free face of the roadway surrounding rock, and the stress wave is reflected at the free interface of the roadway due to the influence of the free face, with the unloading wave following the incident pressure loading wave and the surface-reflected stress wave to produce complex stress wave superposition action at the free interface of the roadway surrounding rock. Furthermore, the face-explosion side of the roadway surrounding rock is the main influence area under the repeated tensile and compressive effects of the stress wave. In the back-explosion side of the roadway, stress wave wave fronts move in opposite directions on both sides and converge in the middle of the back-explosion side. The stress wave effect was enhanced, but the dynamic response on the back blast side of the surrounding rock was smaller.
It is also deduced that the stress wave propagation direction is affected by the cavity roadway, and the stress wave propagates around the roadway to the undisturbed area. The disparity in the incidence angles of the stress wave wave front at each mass point of the roadway surrounding rock leads to the difference among the effects of the reflection and superposition stress waves at each mass point. Meanwhile, the effects cause different stress states at the mass points, indicating that the difference in stress state is related to the angle of the incident stress wave on the free face of the roadway surrounding rock. The difference in blast loading on each side of the rectangular roadway surrounding rock indicates the cavity effect of the roadway on the propagation of the blasting stress wave around the rectangular roadway.
It is seen in Figure 9 that when the location of the blasting source was changed from the same bench to the top of the roadway surrounding rock, the stress wave intensity reaching the roadway was reduced. Meanwhile, the relative angle of the stress wave wave front acting on the roadway was also changed. It led to a change in the reflected wave angle on the roadway surrounding rock and the regional location of the reflection and superposition effect of stress wave on the free face of the roadway rock, causing significant disparities in the stress distribution with the roadway surrounding rock under different levels of bench blasting. It is demonstrated that the relative angle ( θ ) is one of the critical factors affecting the stress evolution and dynamic damage of the roadway surrounding rock.

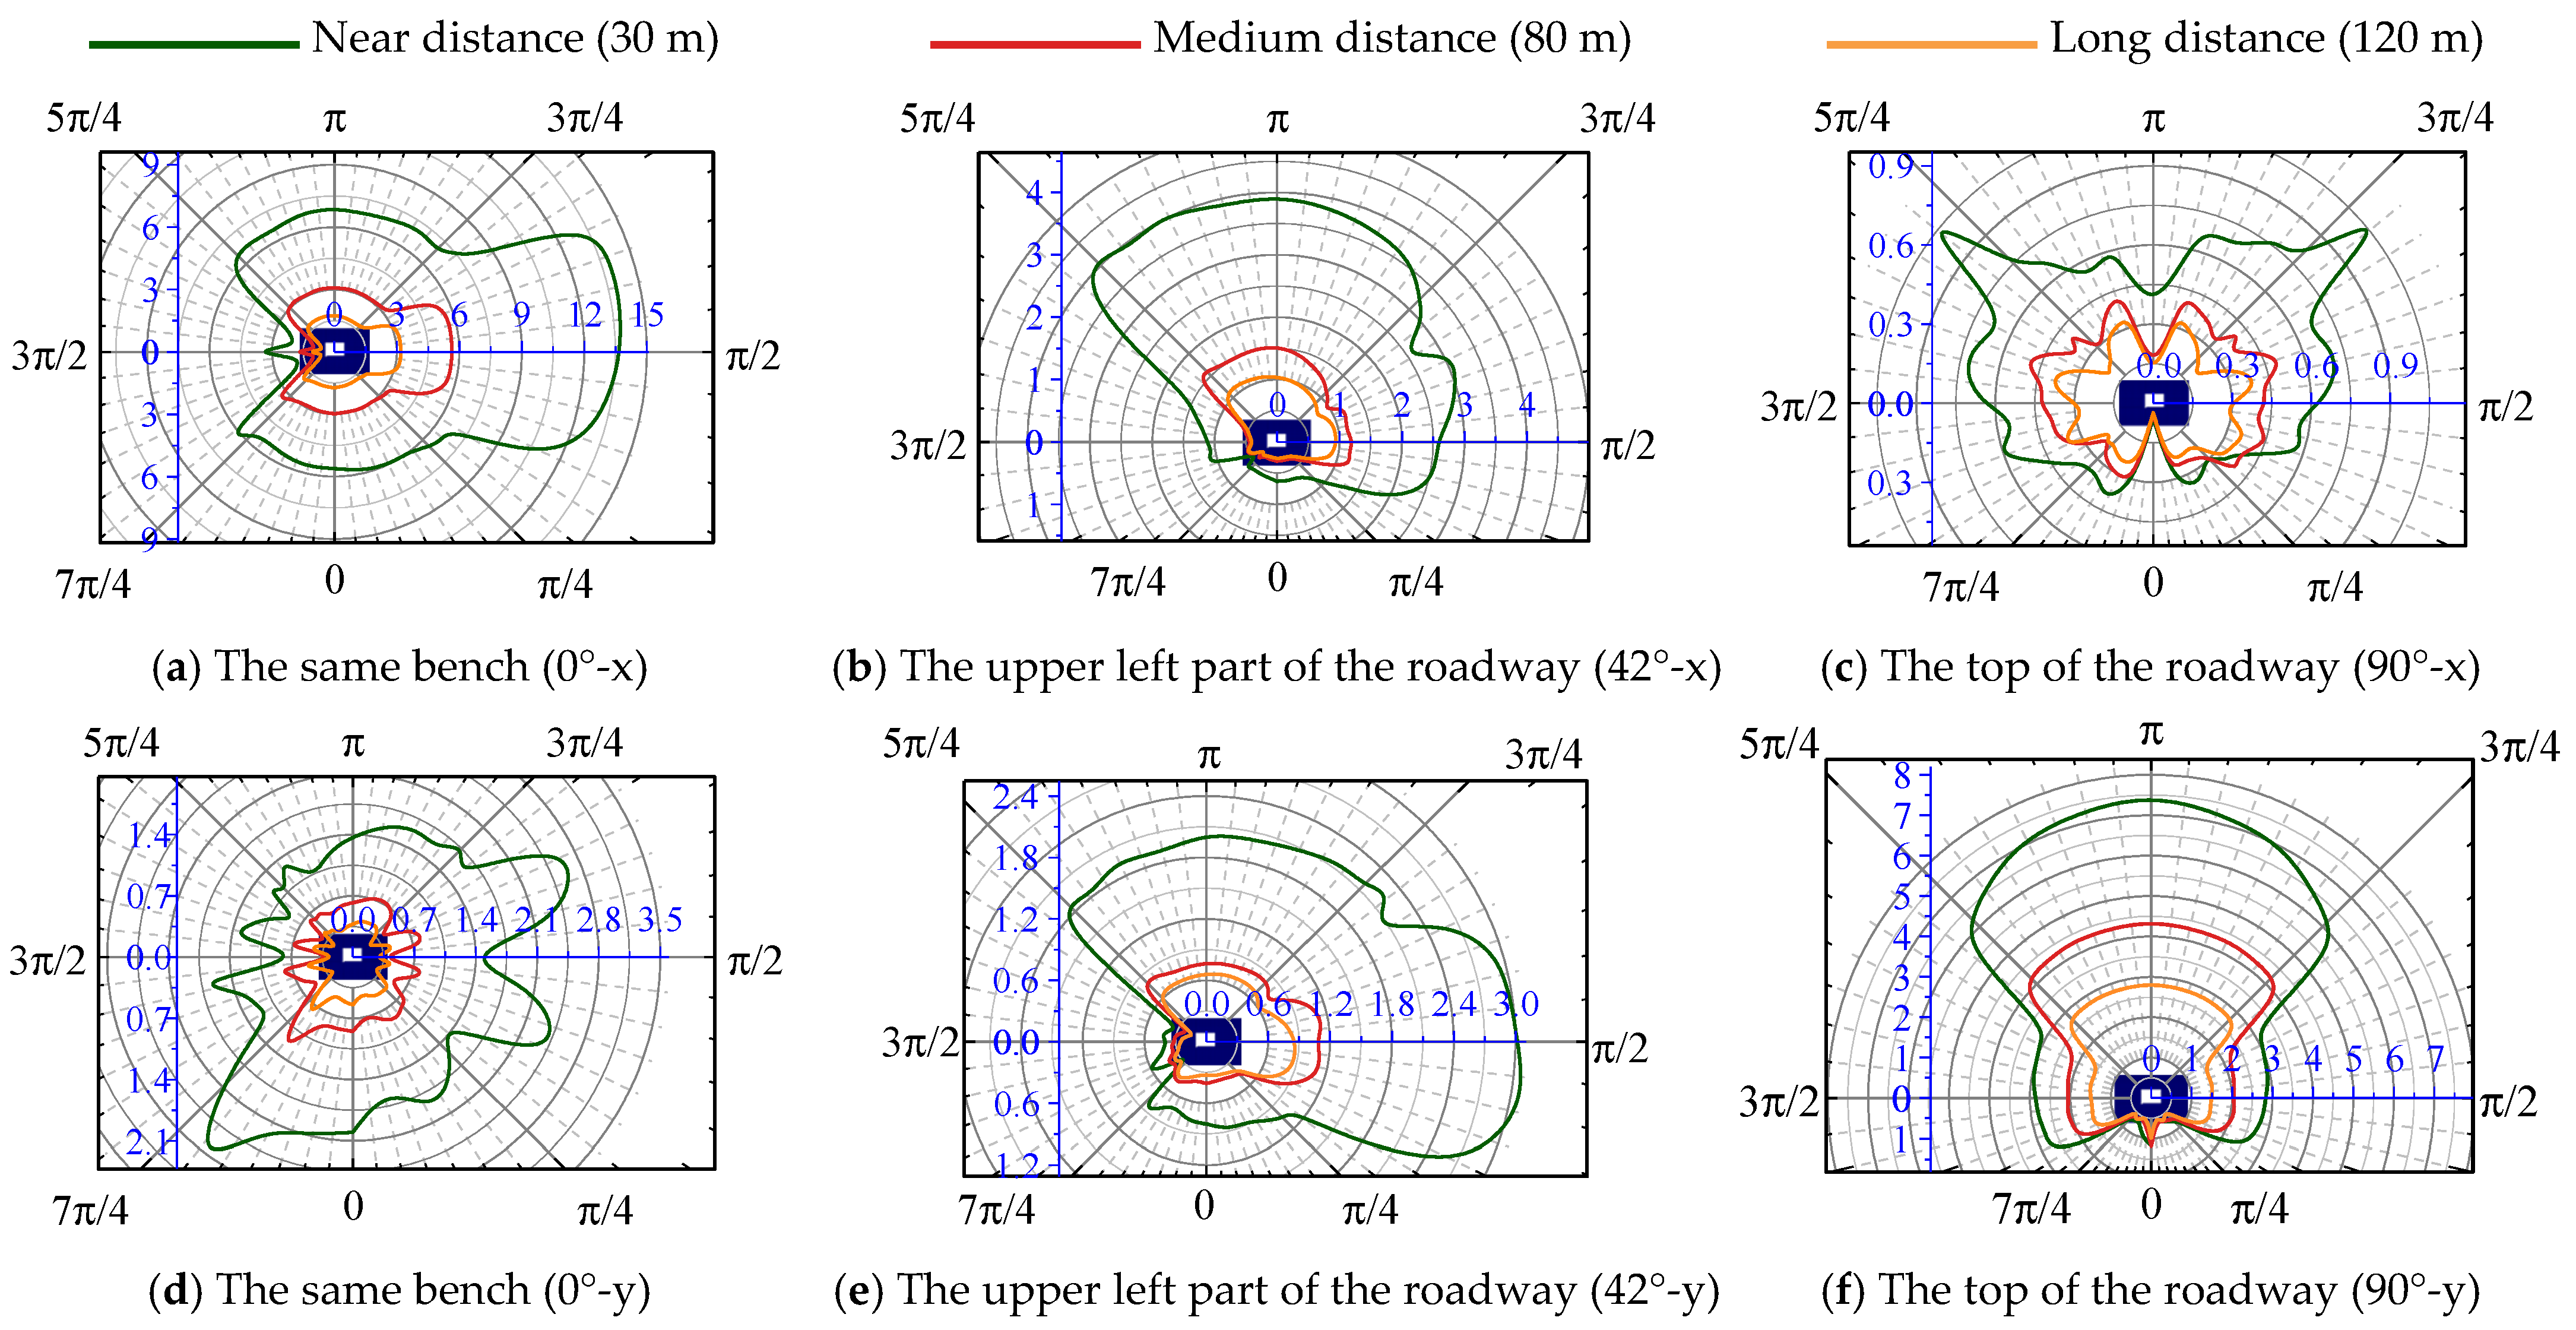
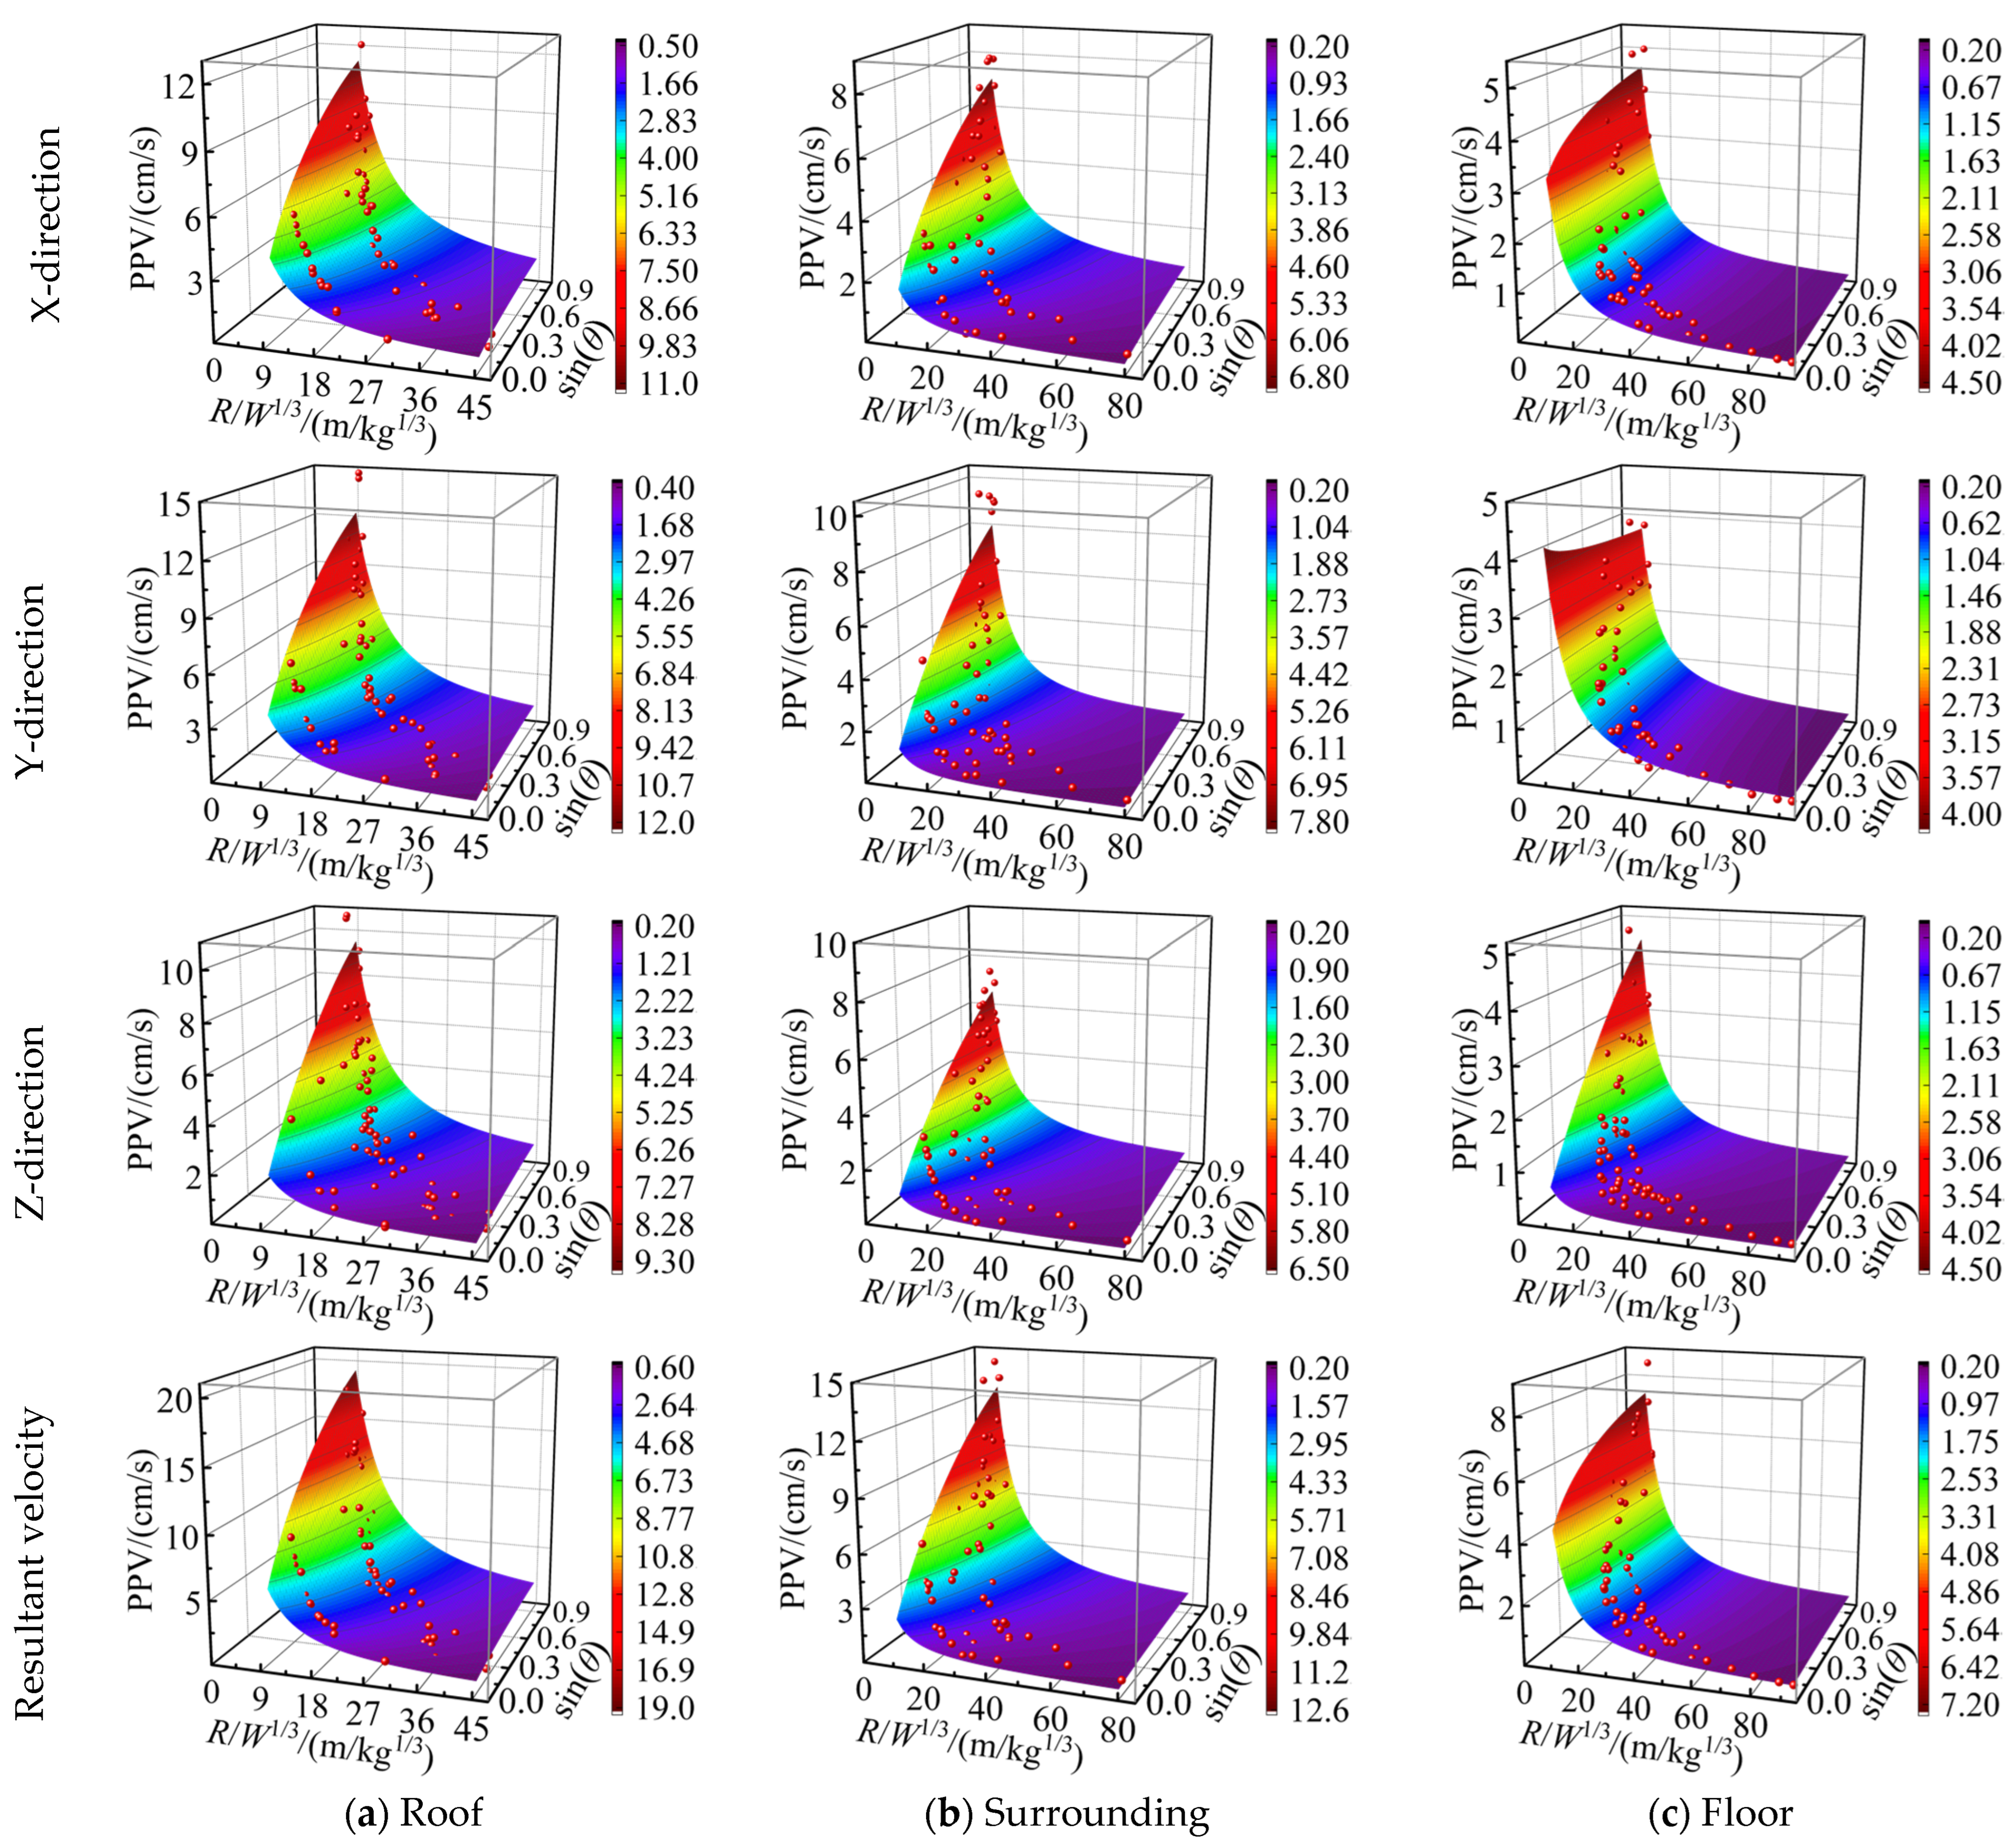
4.2. Particle Velocity Distribution on the Rectangular Roadway Surrounding Rock

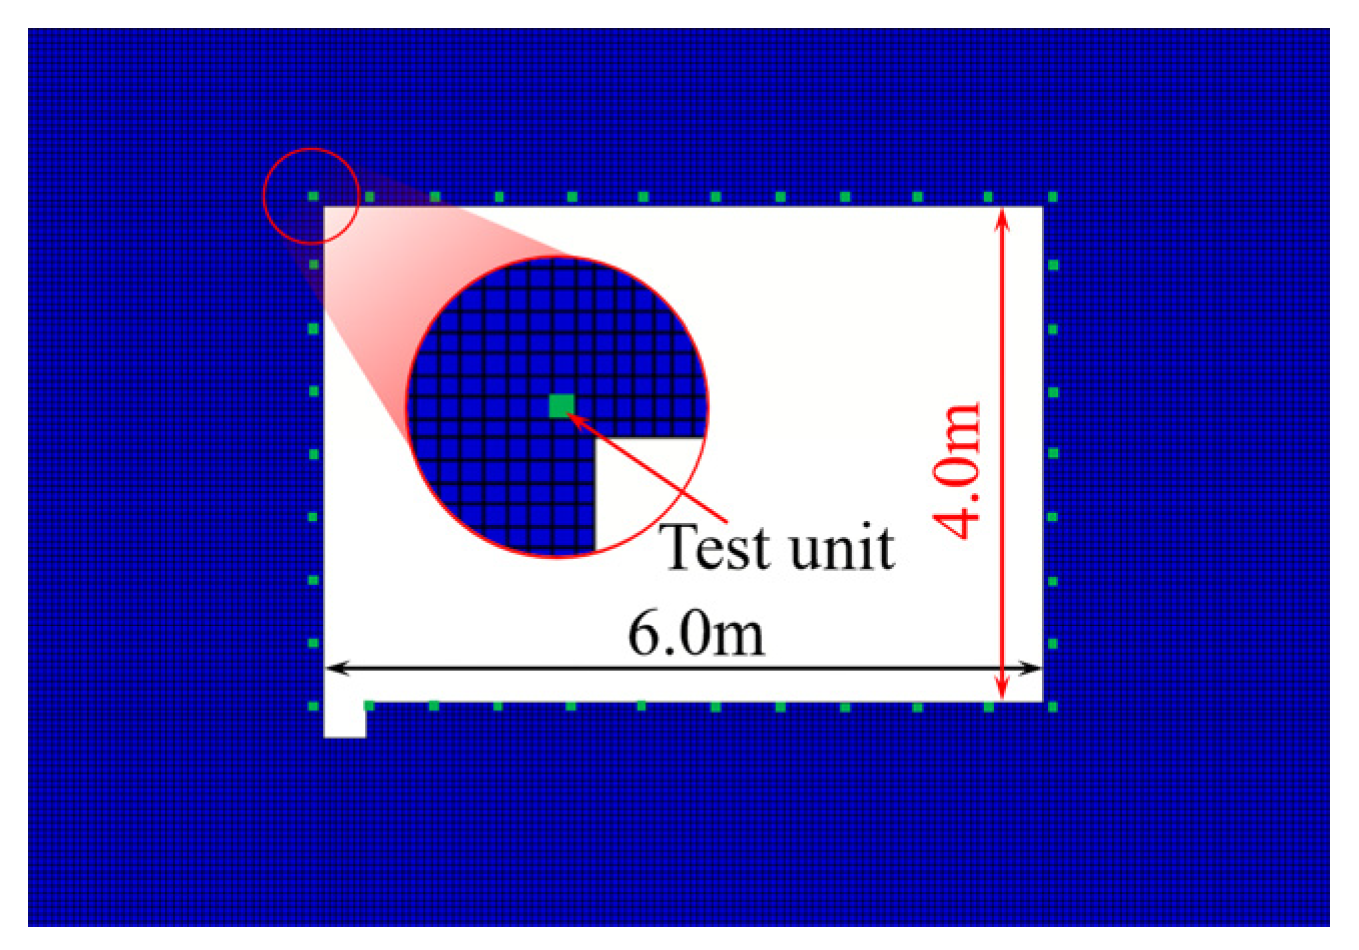
Equally spaced units along the contour of the roadway surrounding rock were selected to monitor the PPV. The selected units are shown in Figure 10. To investigate the radial and tangential vibration distribution law, different distances from the blasting source to the selected units and benches were selected. The variation curves of the surrounding rock’s PPV are presented in Figure 11.
Figure 11 shows that the PPV of the profile surface of the roadway surrounding rock is significantly different. The PPV of the face-explosion side affected by the explosion was the largest. Compared with the PPV of the face-explosion side, the PPV of the back-explosion side was significantly weak. However, the seismic wave converged in the middle area of the back-explosion side, and the vibration strength of the surrounding rock appeared to be a sudden leap.
Since σ I P = z P v I P , for the same rock properties, the particle velocity of the surrounding rock is proportional to the dynamic stress. By the effect of roadway cavity, roadway rock free surface, and blasting seismic wave propagation and attenuation, the relative angle of the stress wave incident on the free face of the roadway surrounding rock mass is different, leading to varying particle velocities of each mass point of the roadway surrounding rock caused by the incident, reflection, and superposition effects of the stress wave. The energy of the blasting stress wave is rapidly attenuated during propagation. Therefore, the PPV of the roadway surrounding rock on each side is significantly different. This reflects the significant correlation between the PPV of the roadway surrounding rock and the incident angle of the stress wave.
The comparison of the PPV of the roadway surrounding rock under different levels of bench blasting revealed that the blasting position at the same bench of the roadway had the greatest impact on the PPV of the roadway surrounding rock, followed by top blasting, whereas side blasting resulted in the smallest PPV of the surrounding rock.
As the stress wave propagated from the rock medium to the coal medium, an unloading effect occurred at the stratified interface of rock, leading to further attenuation of the stress wave wave front. Additionally, the unloading intensity of the reflected and transmitted waves was influenced by the incident angle of the stress wave at the stratified interface. Above all, it indicated that the change in relative angle (θ) led to different stress intensities acting directly on the surrounding rock of the roadway, resulting in disparities in the PPV of the roadway surrounding rock. It reflected that the relative angle (θ) was a critical factor governing the vibration intensity of the surrounding rock on each side of the roadway.

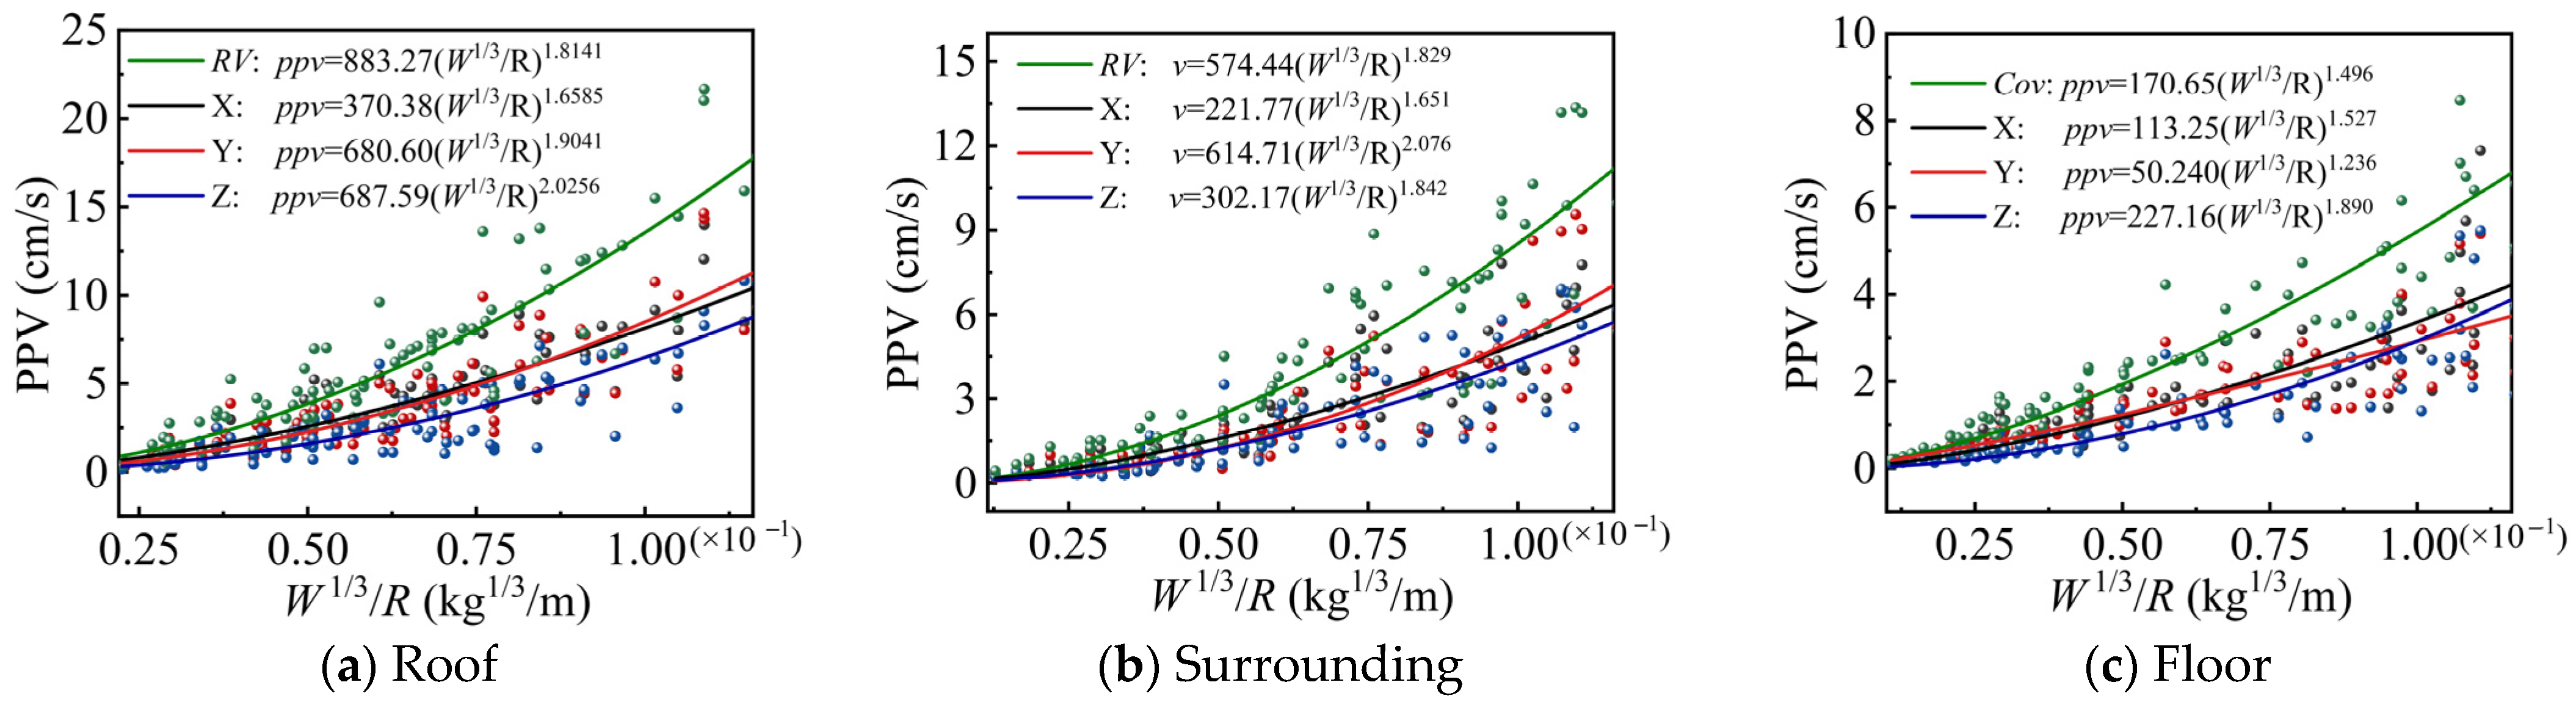
4.3. Influence of Distance on the Cavity Effect

Figure 12a shows the maximum ratio of the PPV between the face-explosion side and the back-explosion side of the roadway as 5.06 when the distance from the blasting source to the roadway was 120 m. When the distance from the blasting source to the roadway was gradually reduced to 36 m, the ratio of the PPV was progressively increased to 8.13, and the difference in the PPV of the roadway surrounding rock was relatively significant. As the distance decreases, the cavity effect promotes a considerable increase in the ratio of the PPV of the roadway surrounding rock on each side of the roadway. From Figure 12b,c, the same conclusion is obtained for the cavity effect under the bench blasting at different locations.
In summary, the cavity effect changes the stress wave propagation in the roadway surrounding rock. The change in the relative angle (θ) between the blasting source and the roadway promotes an angle change in the stress wave wave front acting on the roadway surrounding rock, causing the angle of the blasting stress wave incident on the free face of the roadway surrounding rock to be different and resulting in differences in the dynamic response of the roadway surrounding rock. With the decrease in the distance from the blasting source to the roadway surrounding rock, the difference in particle velocities of the surrounding rock on each side was more pronounced.
It is shown that the relative angle (θ) significantly influences the dynamic response and stress distribution in the surrounding rock on each side. The numerical results are consistent with the theoretical results. Therefore, considering θ as a major factor that affects the vibration of surrounding rock in open-pit blasting is imperative.

5. Prediction of PPV of Surrounding Rock

5.1. Monitored Point of PPV

The vibration velocity of the surrounding rock in the neighboring underground roadway caused by bench blasting operations in the Wujiata open-pit coal mine was monitored to predict the PPV of the surrounding rock. The monitoring site was in the air-return roadway of the Shangwan underground coal mine adjacent to the open-pit coal mine. The Wujiata open-pit coal mine is shown in Figure 13, while the relative locations of the blast test site and the monitoring site are depicted in Figure 14. Additionally, Figure 15 illustrates the vibration monitoring in the roadway surrounding rock of the Shangwan underground coal mine.
In open-pit bench blasting, the double-row or multi-row borehole was detonated hole by hole. The blasting parameters were as follows: borehole depth of 11.0 m, ultra-deep blasting of 1.0 m, borehole diameter of 200 mm, borehole spacing of 6.0 m, row spacing of 5.0 m, and stemming of 5.0 m. A mixed ammonium nitrate fuel oil (ANFO) explosive with a density of 1.1 g/cm3 and a detonation velocity of 3600 m/s was used.
CBSD-VM-M01 network vibrometers were employed to monitor the vibration velocity in the roadway surrounding rock. Combined with the distribution location of the open-pit bench blasting area, the PPVs in the X, Y, and Z orthogonal directions on the roof, sidewalls, and the floor on the surrounding rock of the neighboring coal roadway were monitored, respectively. Due to space limitations, only a typical set of measured vibration signals of the roadway surrounding rock is shown in Figure 16. The vibration monitoring results of the roadway surrounding rock are shown in Table 5.

5.2. Regression Analysis of Peak Particle Velocity

Theoretical analysis and numerical simulation confirmed that the relative position of open-pit bench blasting and the roadway is one of the critical factors influencing the stress evolution and distribution of the PPV on the roadway surrounding rock. The change in the relative angle between the bench blasting area and the roadway causes significant variation in stress reflection and superposition effects of the roadway surrounding rock and changes the main influence area of the roadway surrounding rock under the action of open-pit bench blasting vibration. Therefore, the relative angle (θ) was introduced into the traditional Sadovski equation to more accurately evaluate the impact of open-pit bench blasting vibrations on roadway surrounding rock stability, obtain the applicable prediction equation of PPV to the roadway surrounding rock, and improve the PPV prediction accuracy.

5.2.1. Developing Empirical Equation for Predicting PPV Considering the Relative Angle

The relative angle affects the vibration distribution trend in the roadway rock under open-pit bench blasting (θ). The main factors affecting the PPV of the roadway surrounding rock were considered, such as the maximum quantity per delay W, the charge radius r, the distance between the blasting source and the monitored point L, the vertical height from the blasting source to the roadway H, the horizontal distance between the blasting source and the roadway l, and the longitudinal wave velocity Cp. The mass [M], length [L], and time [T] were taken as the primary dimension variables; W, L, and Cp were independent variables; the PPV was the dependent variable; and similar standard equations were obtained via magnitude analysis, expressed as Equations (33) and (34).
π = ϕ ( π 1 , π 2 , π 3 )
P P V = C p ϕ ( H L , l L , r L )
According to the dimension analysis, π 1 × π 2 is obtained as π 12 = π 1 × π 2 = H l / L 2 . If the explosive type remains unchanged, a cubic power function relationship exists between the maximum quantity per delay and the charge radius [40], i.e., r W 3 .
Then, Equation (32) can be rewritten as Equation (35).
P P V = C p ϕ ( H l L 2 , W 3 L )
Since H and l are the vertical and horizontal components of the distance between the blasting source and the monitored point, respectively, L is the relation equation, and L = H 2 + l 2 exists. Thus, Equation (35) can be rewritten as Equation (36).
P P V = K sin ( θ ) 2 sin ( θ ) 4 β W 3 R α = K sin ( 2 θ ) 2 4 β W 3 R α

5.2.2. Validation of the Improved Empirical Equation

To validate the accuracy and applicability of the improved empirical equation for predicting the PPV of the roadway surrounding rock, vibration monitoring data from the roadway surrounding rock were utilized, as shown in Table 3. Equations (32) and (36) were employed for data curve fitting analysis using MATLAB (2021). The root mean square error ( R S M E ), coefficient of determination ( R 2 ), and modified coefficient of determination ( A - R 2 ) were obtained. The corresponding equations are expressed as Equations (37)–(39), respectively. The smaller the R S M E and R 2 , the closer the A - R 2 to 1, indicating that the independent variable can respond better to the dependent variable and the data points fit better.
R M S E = 1 n i = 1 n w i ( y i y i ) 2
R 2 = 1 i = 1 n w i ( y i y i ) 2 i = 1 n w i ( y i y ^ i ) 2
A - R 2 = 1 ( 1 R 2 ) ( n 1 ) n p 1
where w i is the data sample weight; y i is the original data; y i is the predicted data; y ^ i is the original data mean; n is the number of samples; and p is the number of features.
(1)
Fitting analysis of Sadovski equation
The monitoring data of the roadway surrounding rock was applied for curve fitting using Equation (32). The fitting curve of the PPV of the roadway surrounding rock was obtained and is shown in Figure 17. The results of the data fitting are presented in Table 6.
Figure 17 and Table 6 indicate that the fitted PPV values of the surrounding rock on each side of the roadway exhibit a clear nonlinear decreasing trend. The data of PPV were greatly dispersed, and the correlation coefficients R 2 and A - R 2 were relatively low, so the R S M E value was large in regression analysis. Therefore, it can be concluded that the Sadovski equation has certain limitations in accurately predicting the PPV of the surrounding rock on each side of the roadway.
(2)
Fitting analysis of the improved equation
The improved Equation (36) considering the relative angle (θ) was applied to the regression analysis. The fitting surface of the PPV on the roadway surrounding rock is shown in Figure 18, and the fitting results are listed in Table 7.
Figure 18 and Table 7 show that the PPV of the surrounding rock on each side of the roadway exhibits a nonlinear declining trend with the variation in the scale distance and the relative angle (θ). Meanwhile, the scatter of PPV data matches well with the fitted surface of the improved equation for predicting the PPV by considering the relative angle (θ), signifying the importance of the relative angle (θ) in predicting the PPV.
Compared with the regression analysis results of Sadovski’s empirical equation and the modified equation in Table 6 and Table 7, the modified equation for predicting the PPV of the roadway rock has smaller R M S E values in the regression analysis of the monitoring data of the roadway roof and the right side of the surrounding rock. The fitting values of the R 2 and A - R 2 parameters were considerably improved. The prediction results are found to be better than those predicted using the traditional Sadovski empirical equation, corroborating the effectiveness of the relative angle (θ) to improve the equation for predicting the PPV of the roadway surrounding rock. The numerical simulation results indicate that the relative angle (θ) of the open-pit bench blasting area and the roadway have little influence on the PPV of the roadway floor. Therefore, the error assessment parameters such as R M S E , R 2 , and A - R 2 reflect that the prediction accuracy has not improved. The results of the fitting analysis and the conclusions obtained from the numerical simulation are compatible and corroborated. To some extent, the accuracy and reliability of the improved Equation (36) for predicting the PPV of the roadway surrounding rock are verified.
The modified equation incorporating the relative angle (θ) for predicting the PPV of the roadway surrounding rock can effectively predict the PPV compared to the traditional Sadovski equation. However, under frequent open-pit bench blasting operations, it is suggested that vibration monitoring be strengthened, and Equation (36) must be improved for accurate prediction of PPV.

6. Conclusions

In this paper, the dynamic response and stability of the adjacent rectangular roadway in open-pit mining were investigated, and the blast-induced vibration of the adjacent rectangular roadway was measured. The vibration equations of the roadway were derived based on the stress wave propagation theory and the wave-front momentum conservation theorem. Numerical simulation was conducted to analyze the stress distribution and dynamic response of the roadway for varying distances and bench heights. The following conclusions were drawn from the results:
(1)
A mathematical model of underground roadway disturbed by open-pit bench blasting was established through theoretical analysis. The vibration equation of the rectangular roadway under the influence of blasting seismic waves and surface-reflected stress waves was developed using the theory of waveform propagation and conservation of wave-front momentum.
(2)
The numerical simulation results show that with the influence of the effect of the free face of the roadway surrounding rock, there is a significant difference in the degree of PPV response to the blasting power of each measurement point on the free face of the surrounding rock on each side of the roadway. The severity of this difference varies with the change in the relative angle (θ), which has the most pronounced effect on the face blast side of the surrounding rock.
(3)
The effect of the roadway cavity enhances the dynamic response on each side of the surrounding rock, contributing to the difference in the PPV of each side of the roadway as the distance from the blasting center to the monitoring point decreases. The difference in the dynamic response of the roadway is especially significant.
(4)
Based on Sadovski’s empirical equation, the modified equation for predicting the PPV was established considering the relative angle (θ). The R 2 obtained from the regression analysis confirms the better prediction accuracy of the modified equation. The improvement in prediction accuracy of the roadway PPV is related to the degree of dynamic response on the roadway with blasting load.

Author Contributions

Conceptualization, A.J., H.F. and Y.Y.; methodology, A.J., Y.Y. and R.B.; software, A.J.; validation, A.J., R.B. and S.B.; formal analysis, A.J., Y.Y. and S.B.; investigation, A.J.; resources, A.J., H.F. and R.B.; data curation, A.J., H.F. and S.B.; writing—original draft preparation, A.J., H.F. and Y.Y.; writing—review and editing, A.J., H.F., Y.Y., R.B. and S.B.; visualization, A.J. and S.B.; supervision, H.F. and Y.Y.; project administration, Y.Y.; funding acquisition, H.F. and Y.Y. All authors have read and agreed to the published version of the manuscript.

Funding

The study was supported by the National Natural Science Foundation of China (Grant No. 52208477) and Collaborative Innovation Center for Major Disasters Prevention and Restoration in Mines (Grant No. CXZX-2024-07), which are gratefully acknowledged.

Institutional Review Board Statement

Not applicable.

Informed Consent Statement

Not applicable.

Data Availability Statement

The data presented in this study are available on request from the corresponding author due to the data also being utilized in the preparation of a dissertation, making them unavailable for public disclosure.

Conflicts of Interest

The authors declare no conflicts of interest.

References

  1. Singh, P.K.; Roy, M.P.; Paswan, R.K.; Sarim, M.; Kumar, S.; Ranjan Jha, R. Rock Fragmentation Control in Opencast Blasting. J. Rock Mech. Geotech. Eng. 2016, 8, 225–237. [Google Scholar] [CrossRef]
  2. Zhou, J.; Koopialipoor, M.; Murlidhar, B.R.; Fatemi, S.A.; Tahir, M.M.; Jahed Armaghani, D.; Li, C. Use of Intelligent Methods to Design Effective Pattern Parameters of Mine Blasting to Minimize Flyrock Distance. Nat. Resour. Res. 2020, 29, 625–639. [Google Scholar] [CrossRef]
  3. Ren, Y.; Yang, X.; Li, C.; Lü, M.; Zhuang, J. Study on the Effect of Blasting Vibration on Rock Bolt and Shotcrete. J. Phys. Conf. Ser. 2022, 2160, 012077. [Google Scholar] [CrossRef]
  4. Zhang, Y.; Jiang, N.; Zhou, C.; Yao, Y.; Hu, Z. Mechanical Behaviors and Failure Mechanism of HDPE Corrugated Pipeline Subjected to Blasting Seismic Wave. Alex. Eng. J. 2023, 67, 597–607. [Google Scholar] [CrossRef]
  5. Lu, Y. Underground Blast Induced Ground Shock and Its Modelling Using Artificial Neural Network. Comput. Geotech. 2005, 32, 164–178. [Google Scholar] [CrossRef]
  6. Kan, J.; Dou, L.; Li, X.; Cao, J.; Bai, J.; Chai, Y. Study on Influencing Factors and Prediction of Peak Particle Velocity Induced by Roof Pre-Split Blasting in Underground. Undergr. Sp. 2022, 7, 1068–1085. [Google Scholar] [CrossRef]
  7. Duvall, W.I.; Fogelson, D.E. Review of Criteria for Estimating Damage to Residences from Blasting Vibrations; US Department of the Interior, Bureau of Mines: Washington, DC, USA, 1962; Volume 5968.
  8. Ambraseys, N.N.; Hendron, A.J. Dynamic behaviour of rock masses. In Rock Mechanics in Engineering Practice; Stagg, K.G., Zienkiewicz, O.C., Eds.; John Wiley & Sons: London, UK, 1968; pp. 203–207. [Google Scholar]
  9. Bilgin, A.; Esen, S.; Kilic, M. TKI Bell Lignite Plant Research for Solving Environmental Problems Caused by Blasting; Turkish Coal Enterprise: Ankara, Turkey, 1998.
  10. Rai, R.; Singh, T.N. A New Predictor for Ground Vibration Prediction and Its Comparison with Other Predictors. Indian J. Eng. Mater. Sci. 2004, 11, 178–184. [Google Scholar]
  11. Ak, H.; Konuk, A. The Effect of Discontinuity Frequency on Ground Vibrations Produced from Bench Blasting: A Case Study. Soil Dyn. Earthq. Eng. 2008, 28, 686–694. [Google Scholar] [CrossRef]
  12. Yan, Y.; Hou, X.; Fei, H. Review of Predicting the Blast-Induced Ground Vibrations to Reduce Impacts on Ambient Urban Communities. J. Clean. Prod. 2020, 260, 121135. [Google Scholar] [CrossRef]
  13. Khandelwal, M.; Saadat, M. A Dimensional Analysis Approach to Study Blast-Induced Ground Vibration. Rock Mech. Rock Eng. 2015, 48, 727–735. [Google Scholar] [CrossRef]
  14. Yan, W.M.; Tham, L.G.; Yuen, K.V. Reliability of Empirical Relation on the Attenuation of Blast-Induced Vibrations. Int. J. Rock Mech. Min. Sci. 2013, 59, 160–165. [Google Scholar] [CrossRef]
  15. Simangunsong, G.M.; Wahyudi, S. Effect of Bedding Plane on Prediction Blast-Induced Ground Vibration in Open Pit Coal Mines. Int. J. Rock Mech. Min. Sci. 2015, 79, 1–8. [Google Scholar] [CrossRef]
  16. Yilmaz, O. The Comparison of Most Widely Used Ground Vibration Predictor Equations and Suggestions for the New Attenuation Formulas. Environ. Earth Sci. 2016, 75, 269. [Google Scholar] [CrossRef]
  17. Kumar, R.; Choudhury, D.; Bhargava, K. Determination of Blast-Induced Ground Vibration Equations for Rocks Using Mechanical and Geological Properties. J. Rock Mech. Geotech. Eng. 2016, 8, 341–349. [Google Scholar] [CrossRef]
  18. Chen, S.; Wu, J.; Zhang, Z. Blasting Vibration Characteristics and PPV Calculation Formula Considering Cylindrical Charge Length. Environ. Earth Sci. 2017, 76, 674. [Google Scholar] [CrossRef]
  19. Murmu, S.; Maheshwari, P.; Verma, H.K. Empirical and Probabilistic Analysis of Blast-Induced Ground Vibrations. Int. J. Rock Mech. Min. Sci. 2018, 103, 267–274. [Google Scholar] [CrossRef]
  20. Yin, Z.Q.; Hu, Z.X.; Wei, Z.D.; Zhao, G.M.; Hai-Feng, M.; Zhang, Z.; Feng, R.M. Assessment of Blasting-Induced Ground Vibration in an Open-Pit Mine under Different Rock Properties. Adv. Civ. Eng. 2018, 2018, 4603687. [Google Scholar] [CrossRef]
  21. Deng, X.; Wang, J.; Wang, R.; Liu, Q. Influence of Blasting Vibrations Generated by Tunnel Construction on an Existing Road. Int. J. Civ. Eng. 2020, 18, 1381–1393. [Google Scholar] [CrossRef]
  22. Jiang, N.; Zhou, C.; Lu, S.; Zhang, Z. Propagation and Prediction of Blasting Vibration on Slope in an Open Pit during Underground Mining. Tunn. Undergr. Sp. Technol. 2017, 70, 409–421. [Google Scholar] [CrossRef]
  23. Jiang, N.; Gao, T.; Zhou, C.; Luo, X. Effect of Excavation Blasting Vibration on Adjacent Buried Gas Pipeline in a Metro Tunnel. Tunn. Undergr. Sp. Technol. 2018, 81, 590–601. [Google Scholar] [CrossRef]
  24. Wang, X.; Li, J.; Zhao, X.; Liang, Y. Propagation Characteristics and Prediction of Blast-Induced Vibration on Closely Spaced Rock Tunnels. Tunn. Undergr. Sp. Technol. 2022, 123, 104416. [Google Scholar] [CrossRef]
  25. Li, W.; Wang, X.; Chen, L.; Wang, C.; Liu, J. Empirical Prediction of Blast-Induced Vibration on Adjacent Tunnels. Front. Ecol. Evol. 2023, 11, 1212654. [Google Scholar] [CrossRef]
  26. Hasanipanah, M.; Naderi, R.; Kashir, J.; Noorani, S.A.; Zeynali Aaq Qaleh, A. Prediction of Blast-Produced Ground Vibration Using Particle Swarm Optimization. Eng. Comput. 2017, 33, 173–179. [Google Scholar] [CrossRef]
  27. Zhou, J.; Zhang, Y.; Qiu, Y. State-of-the-Art Review of Machine Learning and Optimization Algorithms Applications in Environmental Effects of Blasting. Artif. Intell. Rev. 2024, 57, 5. [Google Scholar] [CrossRef]
  28. Litwiniszyn, J. Model for the Initiation of Coal-Gas Outbursts. Int. J. Rock Mech. Min. Sci. Geomech. Abstr. 1985, 22, 39–46. [Google Scholar] [CrossRef]
  29. Singh, P.K. Blast Vibration Damage to Underground Coal Mines from Adjacent Open-Pit Blasting. Int. J. Rock Mech. Min. Sci. 2002, 39, 959–973. [Google Scholar] [CrossRef]
  30. Singh, P.K.; Roy, M.P.; Paswan, R.K.; Dubey, R.K.; Drebenstedt, C. Blast Vibration Effects in an Underground Mine Caused by Open-Pit Mining. Int. J. Rock Mech. Min. Sci. 2015, 80, 79–88. [Google Scholar] [CrossRef]
  31. Duan, B.; Xia, H.; Yang, X. Impacts of Bench Blasting Vibration on the Stability of the Surrounding Rock Masses of Roadways. Tunn. Undergr. Sp. Technol. 2018, 71, 605–622. [Google Scholar] [CrossRef]
  32. Li, J.; Ma, G. Analysis of Blast Wave Interaction with a Rock Joint. Rock Mech. Rock Eng. 2010, 43, 777–787. [Google Scholar] [CrossRef]
  33. Li, J.C.; Li, H.B.; Ma, G.W.; Zhao, J. A Time-Domain Recursive Method to Analyse Transient Wave Propagation across Rock Joints. Geophys. J. Int. 2012, 188, 631–644. [Google Scholar] [CrossRef]
  34. Li, J.C.; Li, H.B.; Ma, G.W.; Zhou, Y.X. Assessment of Underground Tunnel Stability to Adjacent Tunnel Explosion. Tunn. Undergr. Sp. Technol. 2013, 35, 227–234. [Google Scholar] [CrossRef]
  35. Wang, L. Foundation of Stress Waves, 3rd ed.; National Defense Industry Press: Beijing, China, 2023; ISBN 7118129151. [Google Scholar]
  36. Meyers, M.A. Dynamic Behavior of Materials; John Wiley & Sons: Hoboken, NJ, USA, 1994. [Google Scholar]
  37. Himanshu, V.K.; Mishra, A.K.; Roy, M.P.; Vishwakarma, A.K.; Singh, P.K. Numerical Simulation Based Approach for Assessment of Blast Induced Deformation Pattern in Slot Raise Excavation. Int. J. Rock Mech. Min. Sci. 2021, 144, 104816. [Google Scholar] [CrossRef]
  38. Holmquist, T.J.; Johnson, G.R. A Computational Constitutive Model for Glass Subjected to Large Strains, High Strain Rates and High Pressures. J. Appl. Mech. 2011, 78, 51003. [Google Scholar] [CrossRef]
  39. Xu, Y.; Zhang, Z.; Li, C.; Ge, J. Numerical Simulation on Dynamic Compression Properties of Sandstone under Axial Static Preload. Front. Mater. 2023, 10, 1338348. [Google Scholar] [CrossRef]
  40. AQSIQ; SAC. Safety Regulations for Blasting Vol GB6722-2014; China Water Power Press: Beijing, China, 2014. [Google Scholar]
Figure 1. Reflection of the blast-induced stress wave on the free face of the roadway surrounding rock.
Sensors 25 03393 g001
Figure 2. The incidence and reflection of stress waves from a tiny element on the free face.
Sensors 25 03393 g002
Figure 3. Incidence and reflection of stress waves from tiny elements on the surrounding rock of the roadway.
Sensors 25 03393 g003
Figure 4. Relative position between open-pit cast coal mine and roadway.
Sensors 25 03393 g004
Figure 5. Roadway section and support parameters.
Sensors 25 03393 g005
Figure 6. FE computational modeling of bench blasting (example figure, 30 m).
Sensors 25 03393 g006
Figure 7. Errors between predicted and actual PPV values.
Sensors 25 03393 g007
Figure 8. Numerical model validation.
Sensors 25 03393 g008
Figure 9. Stress wave propagation in roadway surrounding rock.
Sensors 25 03393 g009
Figure 10. Test unit distribution of particle velocity of roadway enclosure rock.
Sensors 25 03393 g010
Figure 11. Changing the law of the PPV of roadway surrounding rock under the effect of different bench blasting.
Sensors 25 03393 g011
Figure 12. Ratio of the PPV between the face-explosion side and the back-explosion side of the roadway.
Sensors 25 03393 g012
Figure 13. Open-pit coal mine site.
Sensors 25 03393 g013
Figure 14. Location of monitored points of the roadway (localized).
Sensors 25 03393 g014
Figure 15. Schematic diagram of on-site installation of roadway surrounding rock vibration monitoring instruments.
Sensors 25 03393 g015
Figure 16. Time-dependent curve of particle velocity.
Sensors 25 03393 g016
Figure 17. Curve fitted using Sadovski equation.
Sensors 25 03393 g017
Figure 18. Fitted surface introducing the relative angle (θ) improved the Sadovski equation.
Sensors 25 03393 g018
Table 1. Parameters of FE computational model in bench blasting.
Model NumberModel DimensionDistanceRelative AngleBlast Hole ParameterTotal Number of Benches
L (m)H (m)l (m)θ (°)Φ (m)b (m)h (m)
B-120m-0201.010812000.204.06.09
B-120m-42204.0139120420.204.06.012
B-120m-90117.015090900.204.06.013
B-80m-0151.0858000.204.06.07
B-80m-42151.010880420.204.06.09
B-80m-90106.012060900.204.06.011
B-30m-0101.0673000.204.06.06
B-30m-42126.06730420.204.06.06
B-30m-9087.09030900.204.06.08
Table 2. Explosive material parameters and *EOS_JWL parameters.
RODPCJBETAKGSIGYABR1R2ωE0V0
(kg/m3)(m/s)(GPa) (Pa)(GPa)(GPa) (J/m3)
102036005.15000049.461.893.90771.1180.332.668 × 1091
Table 3. Parameters of coal, rock, and anchored concrete.
ParametersCoalConcreteSandstoneParametersCoalConcreteSandstone
ρ (kg/m3)124826602010PC (MPa)6.21016.008.267
G (GPa)1.13514.864.576UC0.00270.0010.00342
A 0.600.790.61PL (GPa)0.80.80.8
B 1.7691.61.92UL0.0690.10.069
C 0.001860.0070.00108D10.040.040.04
N 0.75150.610.80D21.01.01.0
f c (MPa)18.6348.024.8K1 (GPa)438543
T (MPa)1.6442.51K2 (GPa)−257−171−257
EFMIN0.010.010.01K3 (GPa)596208596
Table 4. Parameters of anchor stock material.
RO (kg/m3)E (GPa)PRSIGY (MPa)Etan (MPa)C (s−1)P
78002090.334521003005
Table 5. Blasting parameters and roadway surrounding rock vibration monitoring results (partial).
GroupRoofSurroundingFloor
θR/W1/3PPV/(cm/s)θR/W1/3PPV/(cm/s)θR/W1/3PPV/(cm/s)
(°)(m/kg1/3)XYZ(°)(m/kg1/3)XYZ/(°)(m/kg1/3)XYZ
110.1415.972.681.771.119.1317.620.990.880.798.2328.270.830.880.36
29.8616.342.521.851.128.7219.741.220.520.707.1233.410.820.620.34
37.3819.691.622.281.406.7021.560.811.040.595.9039.380.450.500.26
49.1317.622.561.560.705.5025.490.740.710.525.5043.220.400.390.27
57.3819.691.521.890.704.0241.320.500.390.477.2761.400.270.310.23
65.4829.140.720.840.445.4529.080.360.370.286.9070.180.170.220.19
75.4829.140.740.830.344.8632.630.480.480.249.0255.110.220.260.13
814.6316.084.954.732.337.2761.400.460.290.395.8178.390.180.130.13
914.0715.464.564.462.025.8178.390.330.190.225.4087.020.120.120.12
1013.3811.904.114.531.3711.4314.182.831.971.415.0192.020.110.130.11
1112.4812.883.812.261.2314.1210.902.112.012.1114.1434.301.280.620.82
1212.4812.882.842.881.4014.0710.462.631.991.2510.5522.621.391.600.74
1311.2414.173.192.041.6613.6011.761.801.851.9110.3122.611.231.681.03
1411.3714.222.942.561.0413.3811.902.001.931.4413.8334.251.110.880.52
1512.3723.820.910.780.4510.1415.972.081.691.2410.1723.471.181.350.42
1612.4835.950.430.680.3713.4745.550.711.000.3913.6536.460.800.710.36
1712.1335.900.490.550.2312.2525.820.420.810.5013.9333.241.110.880.41
1813.2244.470.230.250.1813.4254.360.720.410.2514.3537.880.910.600.48
1915.099.545.425.793.6310.6529.220.470.490.3210.9829.190.790.880.70
2016.2833.911.721.891.0515.099.543.024.072.5312.5225.671.090.780.43
2115.6934.911.101.270.9918.7016.942.521.481.8310.4329.140.720.830.64
2217.9123.801.250.850.9817.7734.970.761.150.6011.1741.470.690.630.45
2316.1133.881.341.060.4916.4732.951.210.660.6412.2127.430.530.640.47
2416.4732.951.220.390.4515.6934.910.920.730.3710.0447.920.520.480.26
2515.8934.411.000.690.4919.6023.070.781.100.8111.0031.210.420.480.35
2615.0338.160.540.300.3019.0234.930.870.710.5513.4742.040.490.390.36
2719.0834.790.400.330.2615.6637.780.610.560.2810.8045.050.510.270.40
2819.0843.720.340.300.3515.0338.160.630.300.2913.4254.360.310.240.21
2921.4125.932.963.871.9220.3916.651.932.112.4718.7016.941.871.320.97
3024.0112.974.023.621.5522.8427.091.091.011.2719.2218.161.441.750.98
Note: The X, Y, and Z directions represent the horizontal radial, horizontal tangential, and vertical directions, respectively.
Table 6. Parameter fitting results of Sadovski equation.
Fitted ParametersRoofSurroundingFloor
XYZRVXYZRVXYZRV
k370.38680.60687.59883.27221.77614.71302.17574.44113.2550.240227.16170.65
n1.65841.90412.02561.81411.65132.07581.84151.82901.52721.23631.88991.4960
RMSE1.27011.51321.26212.04631.04061.24721.04241.64210.75341.29650.72951.0165
R20.78550.74690.71000.80050.74440.71200.70770.78570.73520.73140.71830.8009
A-R20.78300.74390.70670.79820.74090.70800.70370.78280.73140.72790.71460.7982
Table 7. Parameter fitting results of the improved equation.
Fitted ParametersRoofSurroundingFloor
XYZRVXYZRVXYZRV
k295.91524.31420.07664.19139.60335.34184.96339.9499.17452.168177.92138.65
α1.34081.53391.47631.43421.17561.45661.27041.28701.39981.2841.39881.3023
β0.23550.27650.36820.27600.28720.37770.37830.32270.0780.02250.43560.1162
RMSE0.94571.17630.88811.34180.80400.97890.74031.15110.75050.63110.69550.9916
R20.88110.84710.85580.91420.84740.82250.85200.89830.73720.73170.75760.8056
A-R20.87830.84850.85250.91220.84320.81760.84790.89540.73020.72460.75120.8004
Disclaimer/Publisher’s Note: The statements, opinions and data contained in all publications are solely those of the individual author(s) and contributor(s) and not of MDPI and/or the editor(s). MDPI and/or the editor(s) disclaim responsibility for any injury to people or property resulting from any ideas, methods, instructions or products referred to in the content.

