1. Introduction
The severe problem of population aging sharply raises the incidence of Alzheimer’s disease (AD), which seriously threatens the healthy life of elderly people and greatly increases the burden on families worldwide [
1,
2,
3]. AD, as a systemic degenerative disease with insidious onset, is characterized by progressive cognitive decline that can lead to forms of dementia, with a predominance of more than 60% [
4,
5,
6]. The most used diagnostic methods for AD in clinical settings include mental state examination, detection of biomarkers in cerebrospinal fluid (CSF) or plasma and positron emission tomography (PET) imaging or computed tomography (CT) [
7,
8,
9]. However, these technologies are not only time-consuming but also require skilled technicians and specific equipment. Therefore, most study of early identification for AD patients focuses on the precise diagnosis of related biomarkers [
10,
11,
12]. Due to the easy collection, minimal invasiveness and low cost, diagnosis of AD blood biomarkers is preferred and most effective. Aβ-42 is the core biomarker of AD, with strong association with pathological progression, and its levels can be used to differentiate between AD individuals and healthy controls in early clinical stages [
13,
14,
15,
16,
17]. However, the serum Aβ-42 concentration of early AD patients is relatively low, and traditional methods for Aβ-42 detection in clinics such as ELISA, mass spectrometry and immunofluorescence do not reach the high requirements of sensitivity, specificity and accuracy [
18,
19,
20]. Therefore, developing accurate and convenient diagnostic techniques for AD blood markers that can precisely identify and then develop treatment plans in a timely manner has significant research value in AD study.
Liquid gate field-effect transistor biosensor, as a promising technology for tracing analytes due to its advantages of label-free, easy operation and low reagent consumption, has been widely used for the detection of biomolecules such as proteins, viruses, nucleic acids, cells, etc. Its sensing mechanism works by utilizing the high recognition ability of biomolecules (such as enzymes, antibodies, DNA, cells, etc.) which modifies on the sensing surface, then specific binding target substances (such biomarkers, molecular, ions) combined with rapid signal transduction technology to achieve real-time, sensitive detection [
21,
22,
23]. Graphene is a type of single atomic layer sensing material with the features of high carrier mobility, making it ultra-susceptive to surrounding electrostatic variation, and can output a high sensitivity electric signal. Its advantages of good biocompatibility and easy surface modifiability also make graphene widely applied in bio-detection [
24,
25,
26]. Therefore, the graphene field-effect transistor (G-FET) biosensor has attracted increasing research attention. Compared with ELISA and immunofluorescence methods, the G-FET biosensor has high specificity, ultra-sensitivity and easy portability and integration, which makes it widely applied in medical health, food safety, environmental monitoring and agriculture assay, with significant application prospects in medical diagnosis. However, its application in biomarker detection in complicated biofluid samples is still limited by its unsatisfactory sensitivity and insufficient anti-fouling ability [
27,
28].
Recent advancements in structural DNA nanotechnology provide an effective way to generate various nanoscale DNA structures with different features and specific functions [
29,
30,
31]. Just like DNA frameworks, especially tetrahedral DNA nanostructure (TDN), the rigid and three-dimensional tetrahedral frameworks result in improved orderliness of probe arrangement and enhanced DNA hybridization efficiency on a biosensing interface by controlling the dimensions of rigid structures [
32,
33,
34]. In DNA aptamers, a sequence of oligonucleotide (DNA or RNA) fragments is obtained from nucleic acid molecular libraries using in vitro screening techniques, Systematic Evolution of Ligands by Exponential Enrichment (SELEX), that have high specificity, affinity and chemical stability [
35,
36]. As the probe molecule, it can be easy prepared, modified and labeled through chemical synthesis, which exhibits great potential in biofluid detection combined with the structural DNA nanotechnology [
37,
38,
39,
40]. Here, we develop a G-FET sensor modified with a tetrahedral DNA framework for Aβ-42 detection in serum. The introduction of a TDN-based aptamer improves the binding affinity and makes G-FET sensors achieve a limit of detection (LoD) down to 5 × 10
−18 mol L
−1 for Aβ-42 detection in serum. The sensor exhibits high accuracy within less than 5 min detection time when testing mouse supernatant samples that suffered from Alzheimer’s disease. Owing to its ultra-sensitivity and high accuracy features, the sensor not only provides a convenient and precise technology for monitoring the Aβ-42 levels of Alzheimer’s disease patients but also shows great value in point-of-care diagnosis of other diseases.
2. Methods
2.1. Graphene Growth
The single-layer graphene sheets were grown via the chemical vapor deposition (CVD) method as the reported literature listed [
41]. Firstly, the 25 μm thick and suitable size Cu foils were placed into the tube furnace (GSL 1200X, Hefei Kejing Materials Technology Co., Ltd., Hefei, China) and heated to 1000 °C with 150 sccm flow of Ar (99.0%) for 30 min. Then, the Cu foils were annealed at 1000 °C with a mixture flow of 10 sccm H
2 (99.999%) and 150 sccm flow of Ar for another 60 min. Then, at 1000 °C, with the atmosphere of 150 sccm Ar, 7 sccm H
2 and 15 sccm CH
4 (99.999%) (as the carbon source), they were grown for 15 min. Finally, the CH
4 flow was cut off, and the Cu foils were immediately cooled down to room temperature; then, they were taken out and placed in a dry environment for later use. At last, the graphene film was transferred to a SiO
2/Si substrate via electrochemical bubbling method when it was needed.
2.2. G-FET Device Fabrication
The G-FET electrode was fabricated via a thermally assisted bilayer lift-off process based on semiconductor IC processing technology. Firstly, spin-coat two layers of resist (sacrificial layer LOR 3A and photoresist S1813) on the SiO2/Si wafer sequentially in order to allow for photoresist reflow, then heat-treat on a hot plate at 170 °C for 5 min and 115 °C for 1 min, respectively. Then, using ultraviolet lithography (Microwriter ML3, Durham Magneto Optics Ltd., Cambridge, UK), photoetch the electrode graphic pattern as designed before. Then, we deposited a 5/45 nm Cr/Au on devices via the thermal evaporator (Angstrom Engineering); the photoresist of the place where not photoetched was wiped off by the remover PG stripper solution, and the existing of sacrificial layer LOR 3A layer can tremendously improve the efficiency of lift-off process. Then, the graphene film was transferred onto the device by using a poly(methyl methacrylate) (PMMA) as the carrier layer, and the PMMA was subsequently removed by acetone. Finally, the graphene sensing region (W × L: 30 × 150 μm2) was patterned via standard photolithography and etching techniques where graphene on the redundant area was cleared through the oxygen plasma, then washed by the acetone, developing solution and DI water.
2.3. TDN Synthesis
The 17bp-5T TDN was synthesized by four single-stranded DNA (ssDNA) through the self-assembly method, and it included three parts: an aptamer sequence which can identify the target molecule, a 5T base as the spacer as the pendant connector and a tetrahedral structure with six double-stranded DNA (ds-DNA) edges. Each vertex of the tetrahedron was modified with an amino group, which makes the TDN link to the graphene surface through chemical bond. All the purified oligonucleotide sequences were purchased from Sangon Biotechnology Inc. (Shanghai, China). Firstly, the DNA power was centrifuged in the tubes at 10,000 rpm at 4 °C for 3 min, then dissolved by suitable volume ultrapure water (18.2 MΩ, Milli-Q system). Then, the concentration of ssDNA stock solutions was tested on the basis of absorbance at 260 nm using UV–visible spectroscopy (Lambda750, Perkin-Elmer, Waltham, MA, USA), then calibrated through the Beer–Lambert law:
A =
εbc [
42], which makes all the molar quantities at a final concentration (1 μM). Finally, four single-strand DNA for assemblage of the TDN were mixed in 1 × TM buffer at 95 °C for 10 min, cooled to 4 °C immediately using a thermal cycler (SimpliAmp, Thermo Fisher Scientific, Waltham, MA, USA) and stored in 1 × TM buffer at 4 °C for later use.
2.4. TDN Functionalization
The TDN probes were immobilized onto the sensing surface by using a chemical linker: 1-pyrenebutanoic acid succinimidyl ester (PASE, Sigma Aldrich, Buchs, Switzerland). The detailed immobilization process follows: firstly, the devices were immersed into acetone solution which contained 5 mM PASE for 12 h at room temperature; then, the devices were washed by acetone, ethanol and DI water three times in turn and dried with nitrogen in the air ambient. Then, a clean and suitable-sized polydimethylsiloxane (PDMS) well was placed onto the sensing area as a container that can hold the target solution; then, the TDN probes were immobilized on the graphene sensing surface, and 50 μL 1 × TM buffer with 200 nM TDN probes was added in the PDMS well and incubated for 12 h at room temperature; after that, the well was rinsed with 1 × TM buffer three times, then added into 80 μL blank buffer and sealed by a piece of glass or wafer and stored at 4 °C in dark for later use.
2.5. TDN Characterization
Raman spectrometer (LabRam HR Evolution, Horiba Jobin Yvon, Edison, NJ, USA, 532 nm Ar ion laser) was employed to characterize the graphene before and after PASE modification. The XPS measurements were conducted with a Thermo Fisher Scientific, Waltham, MA, USA, K-Alpha instrument with an Al X-ray source (hν = 1486.6 eV). Then, the sensing surface morphology of the G-FET device after immobilized TDN probes were tested in fluids (1 × TM) by AFM (Fastscan, Bruke, Billerica, MA, USA) operated in ScanAsyst mode using an ultra-sharp tip (Fluid+, Bruke, Billerica, MA, USA) with a 2~3 nm radius. All measured devices were rinsed by ultrapure water and dried by nitrogen before testing. As for the TDN, we used 10% PAGE electrophoresis in 1× TAE buffer (12.5 mM Mg2+, pH ~ 7.0) at 100 V for 3 h, then stained in Sybr safe (Thermo Fisher, Waltham, MA, USA) for 30 min, followed by imaging under UV exposure (Gel-doc XR+, Bio-rad, Hercules, CA, USA). As for the confocal fluorescence microscopy measurement, the Cy3-conjugated oligonucleotide strand (A17-5T-Cy3) was introduced to synthesize a fluorescence Cy3-17bp-5T TDN; the control experiment used no fluorescence TDN probes. Then, the devices which immobilized with Cy3-17bp-5T or no fluorescence TDN were put on the confocal microscopy to observe the fluorescence intensity, and the fluorescence was imaged by the confocal fluorescence microscope (C2+, Nikon) in 1 × TM buffer.
2.6. Preparation of the Test Samples
The pure Aβ-42 powder (1 g) was purchased from Sigma-Aldrich company (St. Louis, MO, USA). Firstly, the initial liquor with a concentration of 1 mM was prepared. Then, the 1 mM initial liquor was serially diluted in PBS or serum to concentrations of 5 × 10⁻¹⁰, 5 × 10⁻¹¹, 5 × 10⁻¹², 5 × 10⁻¹³, 5 × 10⁻¹⁴, 5 × 10⁻¹⁵, 5 × 10⁻¹⁶, 5 × 10⁻¹⁷, 5 × 10⁻¹⁸ and 5 × 10⁻¹⁹ mol L−1 to store for later use. All the diluted samples were centrifuged at 3000 rpm for 1 min to make sure the target was fully dissolved before testing, which can facilitate specific capture by the TDN G-FET sensor. Then, we removed the blank medium in the PDMS well, adding the different concentration target solution immediately. Then, we incubated for 15 min and recorded the changes in electrical signals. The supernatant serum samples were collected from the feeding mice whole blood by centrifuging at 3000 rpm for 5 min, then detected by the TDN G-FET sensor that we developed.
2.7. Device Measurement
The source-drain electrodes were wire-bonded by Al wires. When we measured the transfer curve of the G-FET devices, 100 μL buffer solution was added into the PDMS well, and an Ag/AgCl reference electrode was inserted into the solution as the liquid gate electrode. The electrical characterization was carried out at room temperature using a semiconductor analyzer (Keysight, Santa Rosa, CA, USA, B1500A). Each sample of different concentration was measured at an interval of 15 min which guaranteed that the target insulin was bonded to the TDN probes. To add testing solutions, 50% volume solution was taken out from the PDMS well and replaced by the same volume of pre-mixed samples. Because the Vds was stabilized (50 mV), Ids versus Vlg curves were obtained by sweeping Vlg in a certain range, and the Dirac point was obtained at a Vlg where Ids reaches its minimum. Once the probes were bonded to the target insulin, a doping effect was exerted to the graphene surface, inducing a Dirac point shift compared to the previous result through measuring the transfer curves. As for the real-time Ids − t measurement, the target insulin solution concentration change can induce an Ids decrease or increase compared to the previous concentration.
2.8. Animal Model and Preparation of Supernatant Samples
All animal experimental protocols were carried out according to the guidelines approved by the Animal Care and Use Committee of the Shenzhen Institute of Advanced Technology Chinese Academy of Sciences. First, mice (4- to 5-month-old male or female 5 × FAD mice) were maintained in a sterile environment with light, humidity and temperature control. After feeding for several months, we picked six mice in good condition. Then, we took blood from their eyes and added an appropriate amount of anticoagulant, followed by stewing for 2–3 h and placing in a high-speed centrifuge at 12,000 rpm/min for centrifugation 5 min. After that, the supernatant serum samples were taken out and stored for later testing.
2.9. Limit of Detection (LoD) and Relative Standard Deviation (RSD) Calculation
The LoD calculation follows the following formula:
where
σ is the standard deviation of testing noise, and
S is the sensitivity acquired as follows:
where
c’ is the tested concentration;
I’
ds is the current response corresponding to
c’; and
Ids0 is the current response corresponding to negative control.
where
SD is the standard deviation, and
is the average of calculated values.
3. Results and Discussion
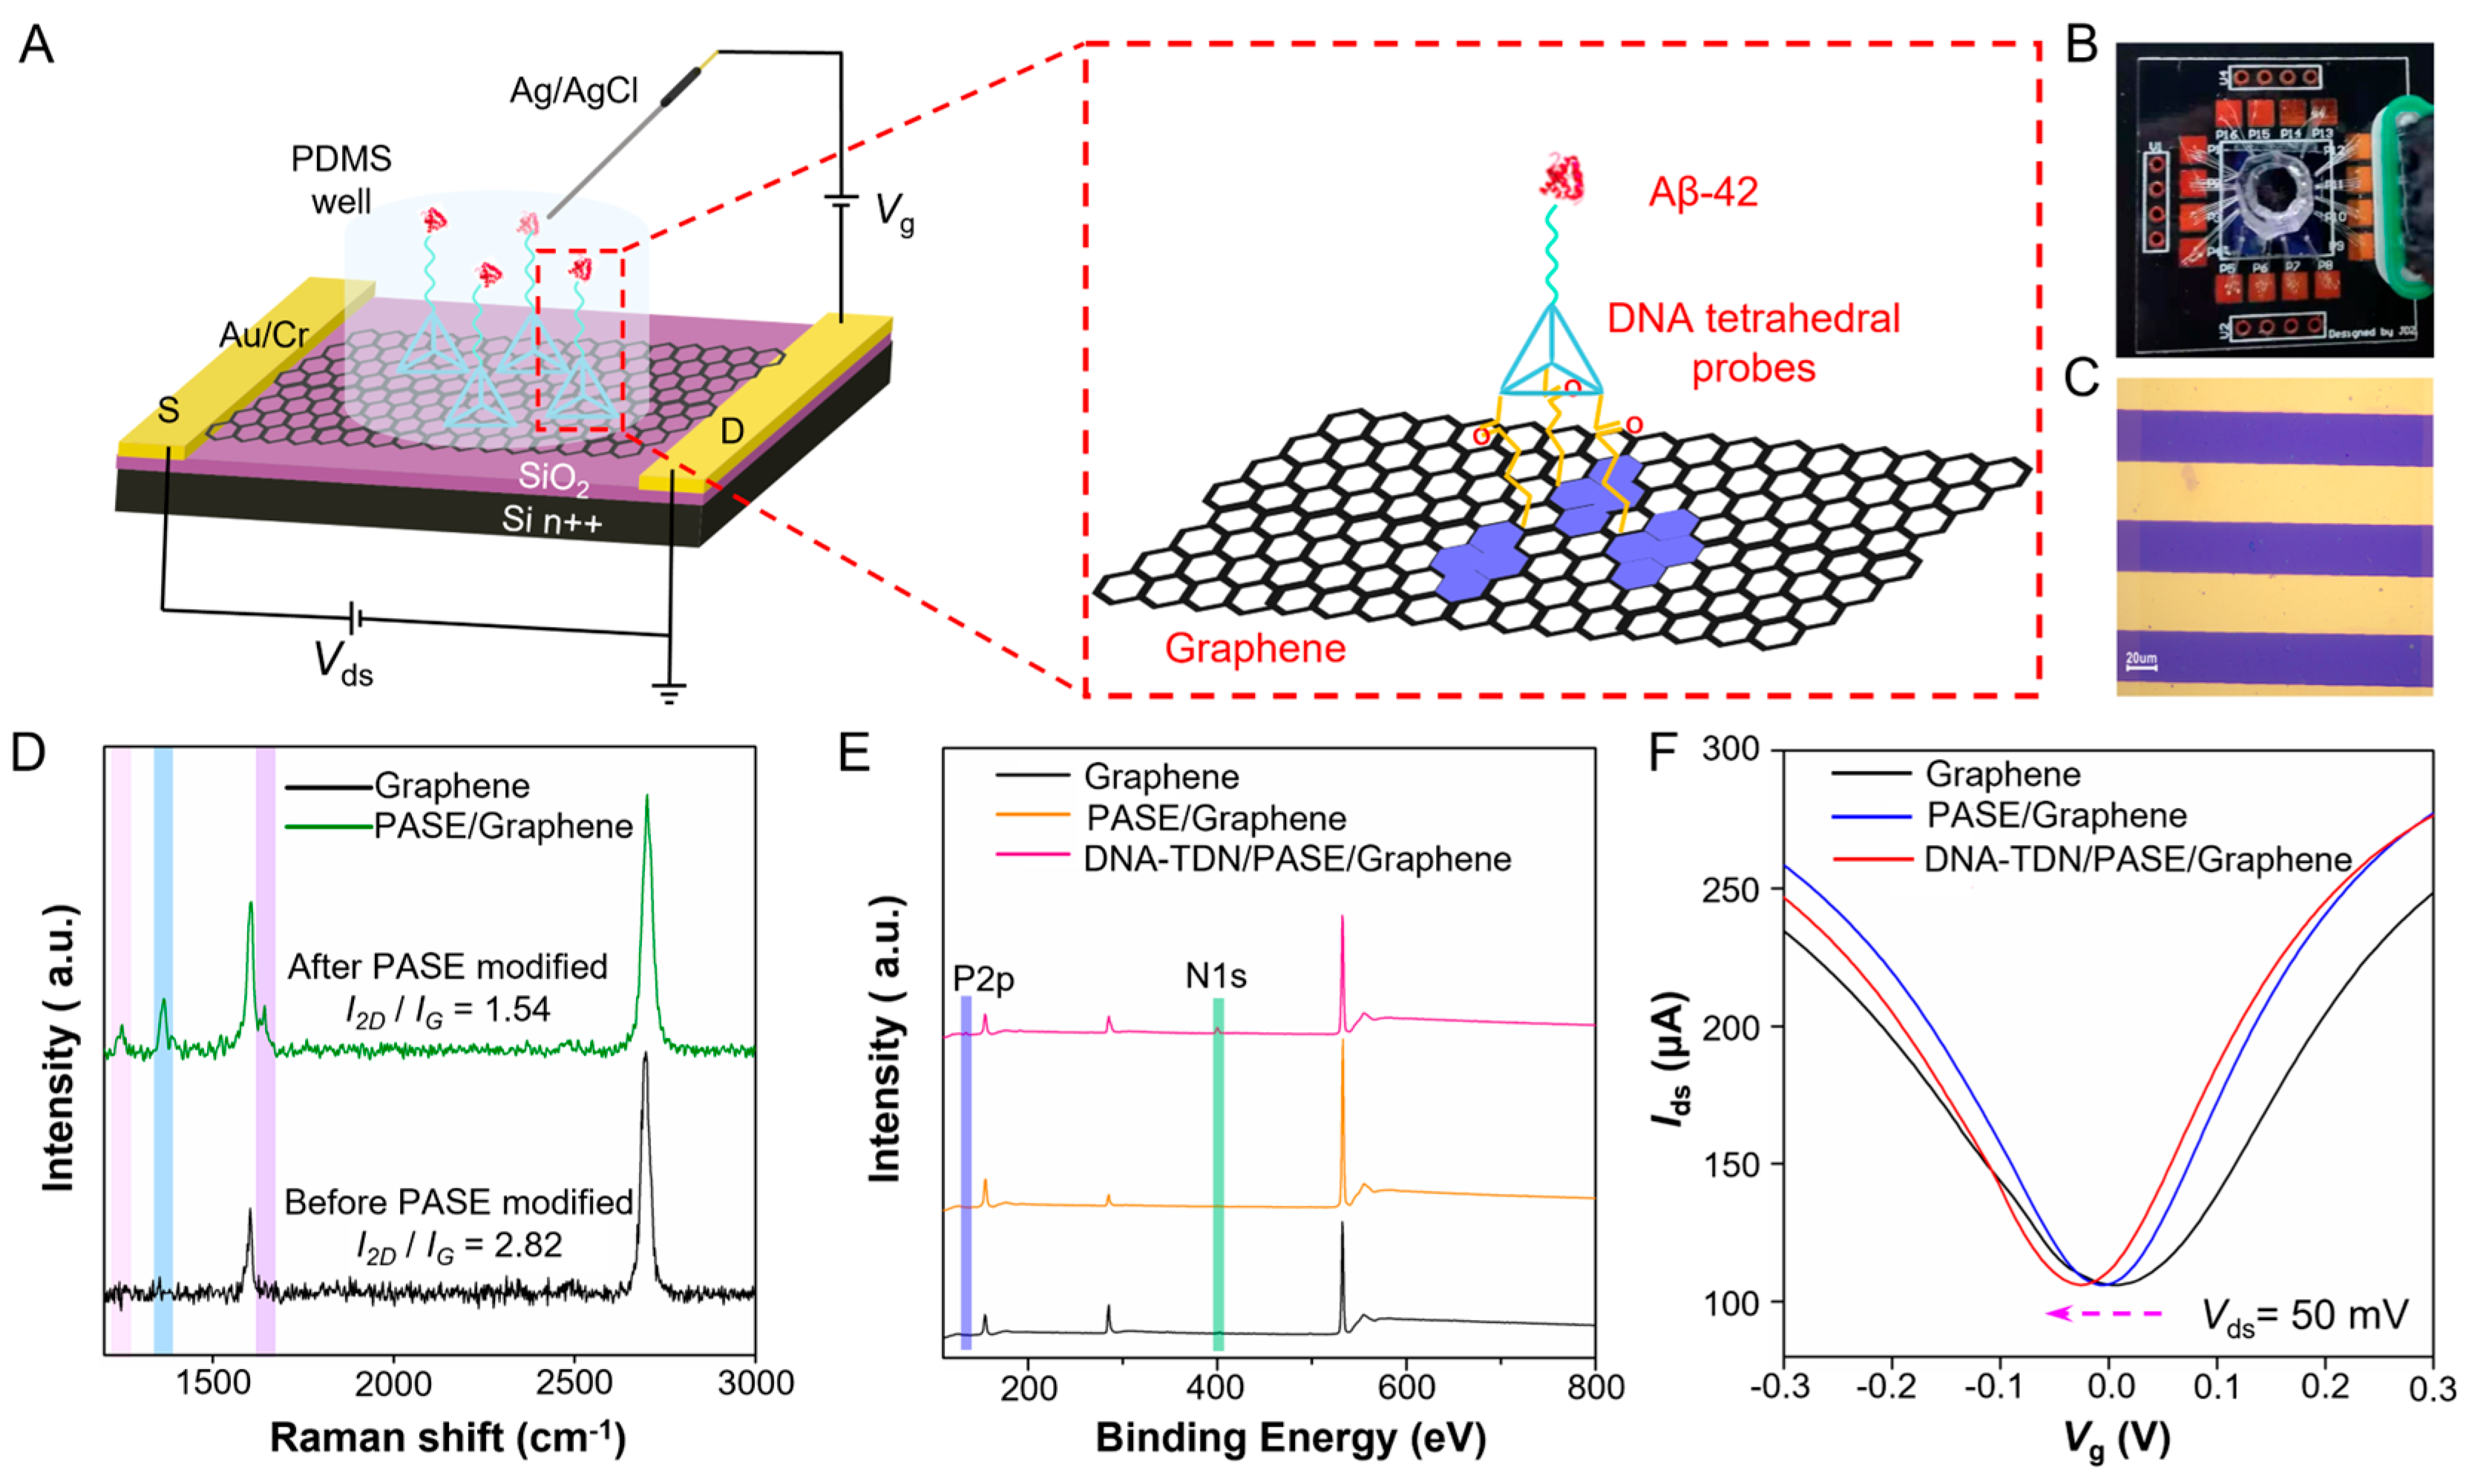
The workflow of the TDN G-FET sensor for Aβ-42 detection is illustrated in
Figure 1A. It is composed of a liquid-gated G-FET with a polydimethylsiloxane (PDMS) chamber on the graphene channel (
Figure 1B) with tetrahedral DNA probes on the sensing interface (enlarged diagram). Each worked sensing area (
Figure 1C) is 30 × 120 μm
2 (
W ×
L). The designed DNA nanostructure is an Aβ-42 specific aptamer grafted on a tetrahedron with the edge length of 17 base pair (~5.3 nm of theoretical length) and a 5T space (
Figure S2A). All the DNA sequences (5′-3′) are listed in
Table S1 (
Supporting Information). The synthesized DNA tetrahedron nanostructures are analyzed by 10% polyacrylamide gel electrophoresis; most of the lanes only have a major band, and the yield is calculated as ~90% (
Figure S2B), which can confirm successful synthesis of the DNA tetrahedron. The 1-pyrenebutanoic acid succinimidyl ester (PASE) is a molecule linker that can help DNA tetrahedral probes immobilizing onto the sensing surface of the G-FET device (
Figure S3). Here, the Aβ-42 specific aptamer is targeted to Aβ-42 peptide, as a monomer that can be polymerized to an oligomer, which is a conformation-specific spatial structure produced by enzymatic hydrolysis. The spatial structure of Aβ oligomer is very different from the Aβ monomer and has a strong association with pathological progression. The Raman spectrum (
Figure 1D) test shows that the graphene was single-layer with high quality before being modified and remains homogeneous after PASE modification through the π−π interaction. The mapping image of graphene after PASE modification (
Figure S1A,B) also reveals that the graphene is homogeneous. The fast scan atomic force microscopy (AFM) test in fluid reveals that TDN probes anchored on graphene surface successfully with an orderly manner (
Figure S4A), and the surface roughness observably increases after anchorage. Confocal fluorescence microscopy measurement results (
Figure S4B) also indicate that the Cy3-17bp-5T TDN successfully immobilized on the sensing surface. The X-ray photoelectron spectroscopy (XPS) test result shows that the N1s peak and P2p peak (
Figure 1E and
Figure S5A,B) appeared, which furtherly verified that the PASE and TDN probes were modified on the graphene sensing surface successfully. Furthermore, the transfer curve measurement (
Figure 1F) of the device indicated that the
VDirac (the liquid-gate voltage
Vlg when the drain-source current
Ids reaches its minimum) gave rise to a negative offset after PASE modification, due to the n-doping effect to graphene induced by the π−π interaction, and a more negative shift occurred after TDN probe immobilization. All the above characterizations concluded that the high-performance sensing surface of G-FET has been successfully constructed.
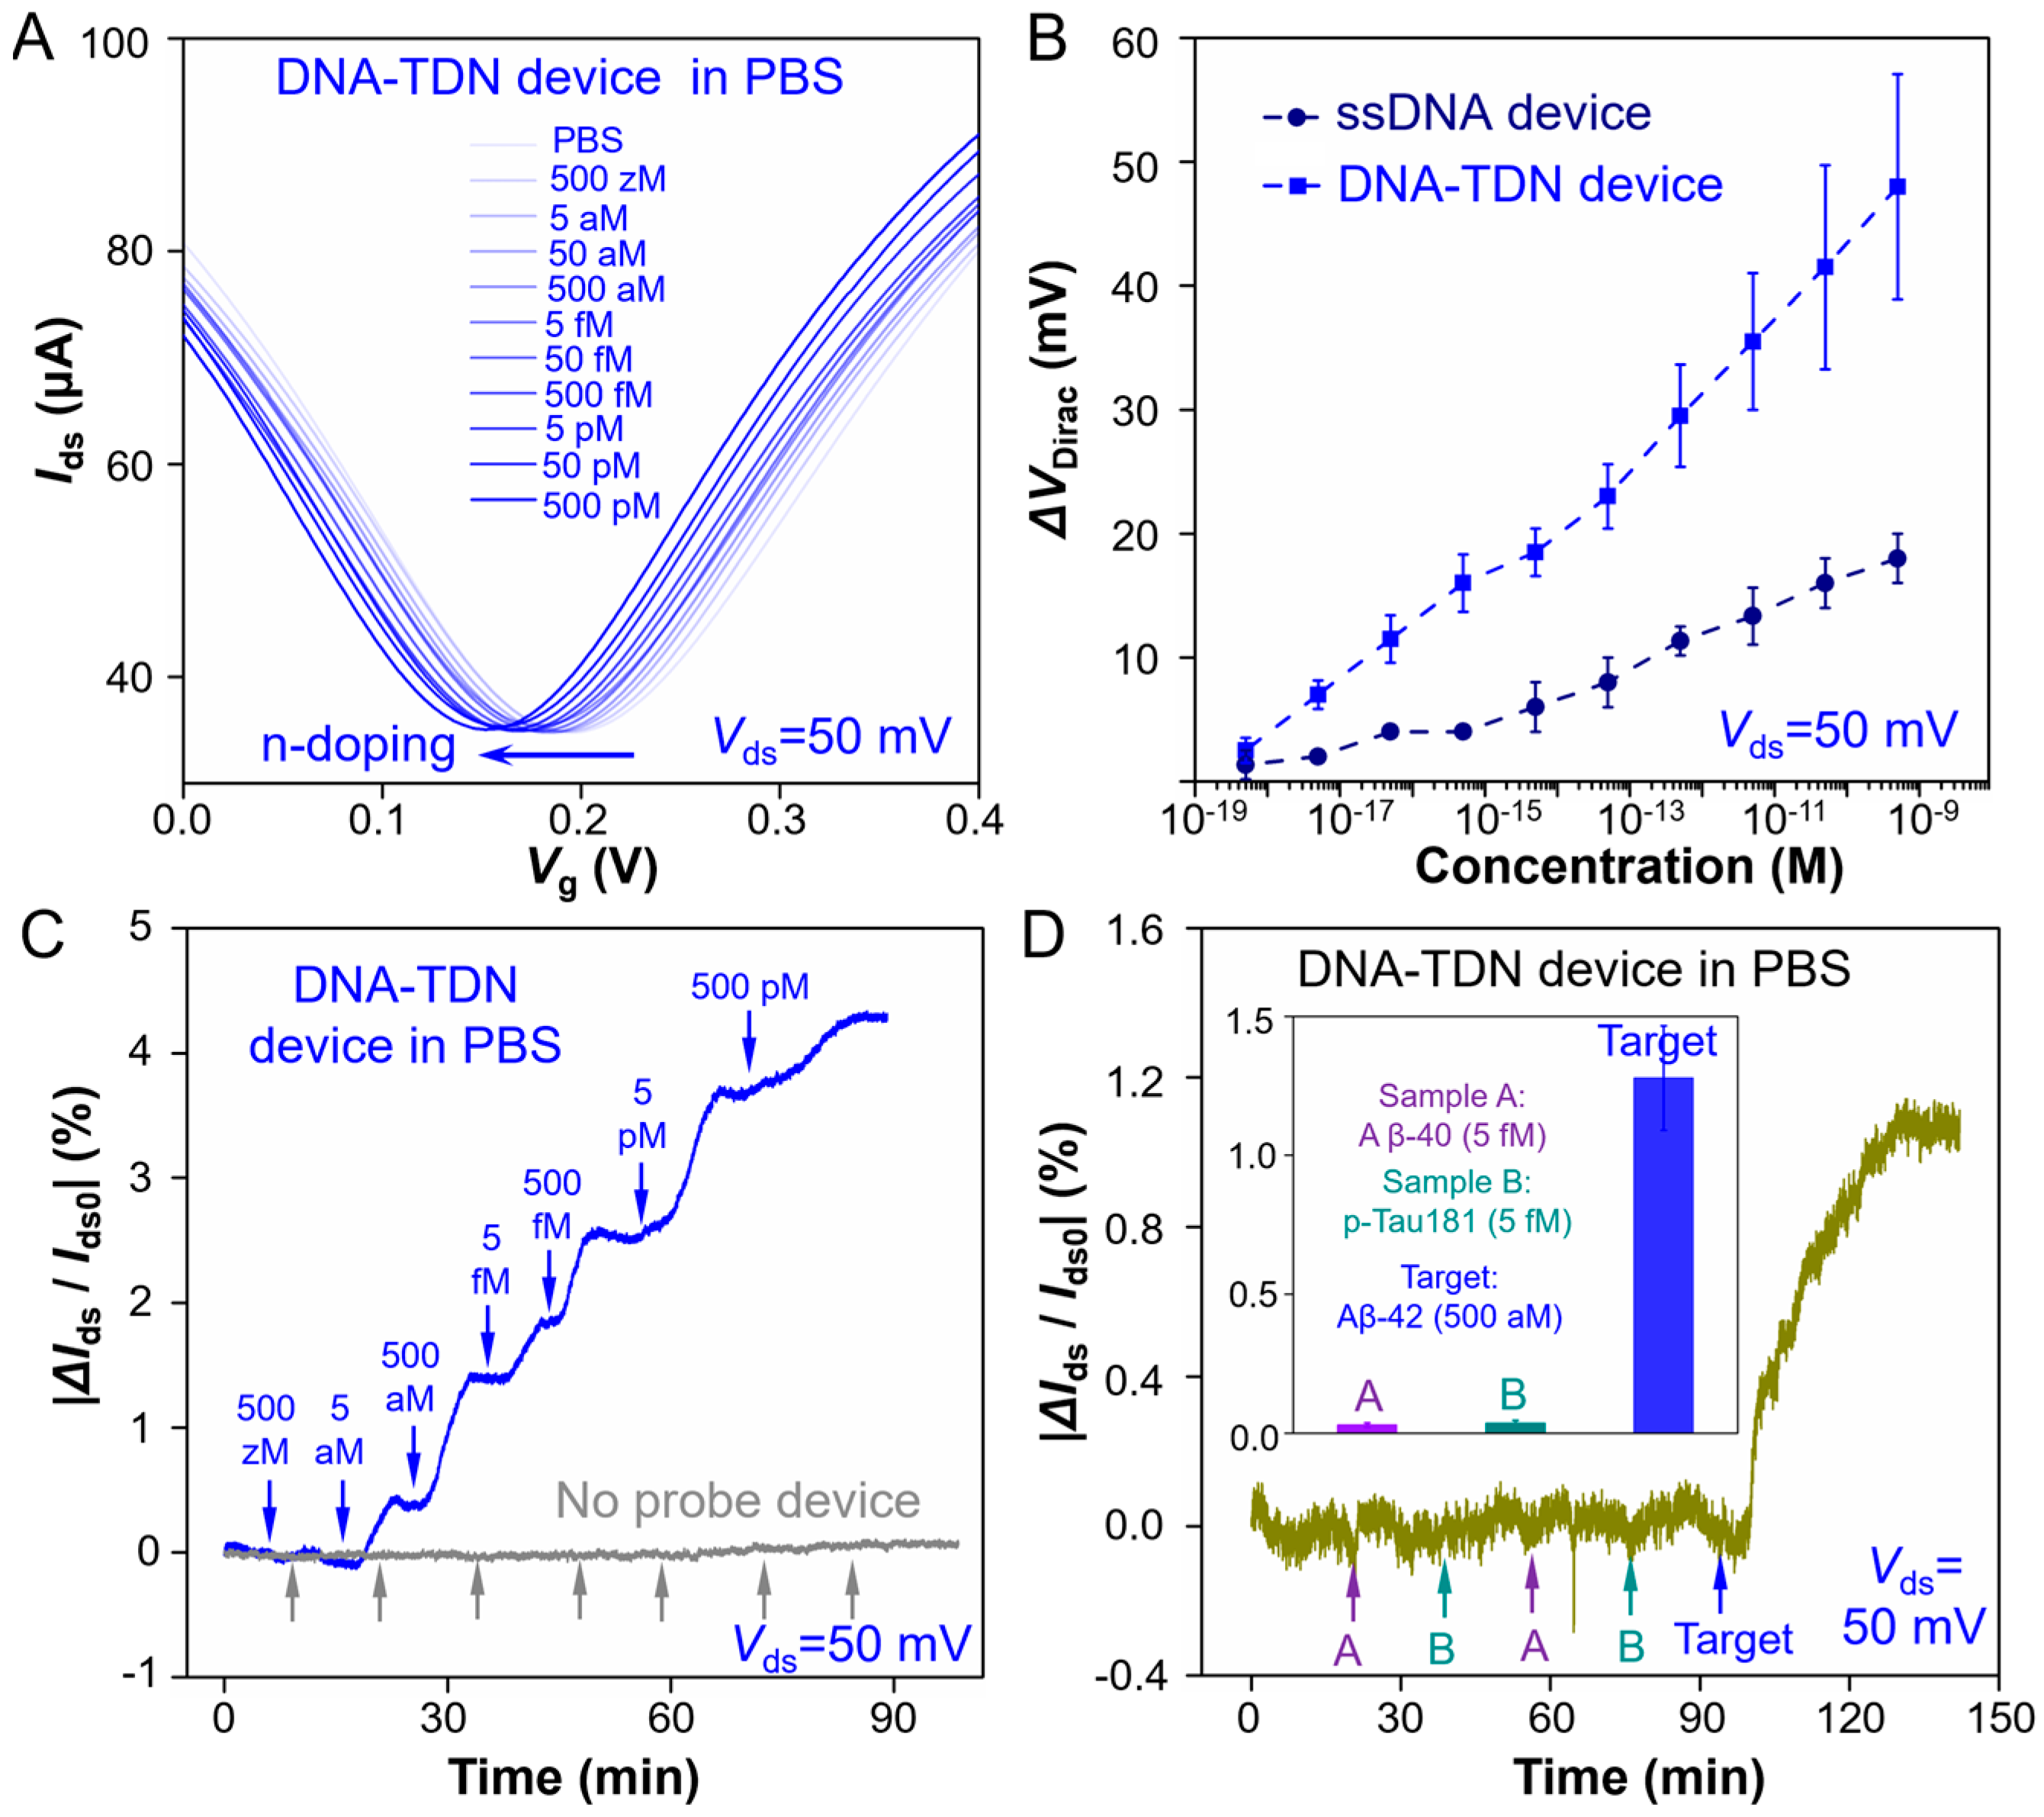
The TDN G-FET sensor for Aβ-42 measuring capabilities is first checked in 1 × PBS buffer. We test the transfer curve (
Ids −
Vlg) of the G-FET device and record the
VDirac shift when adding different Aβ-42 solution concentrations to the PDMS chamber. Here,
Ids means the output real-time drain-source current,
Vlg means the liquid-gate voltage of the G-FET device and
VDirac represents the
Vlg when
Ids reaches its minimum. As shown in
Figure 2A, when the Aβ-42 solution concentration increases, more Aβ-42 was binding to the aptamer probes, making the measured
VDirac left shift at a variable rate within physiologically relevant Aβ-42 levels. It is because that binding of Aβ-42 to the aptamer could generate n-type doping to graphene and then induce a significant
VDirac shift of the G-FET device. The aptamers we choose in this study were targeted to the Aβ-42 specific aptameric receptor. When the target Aβ-42 solution concentration increases from 500 zM (5 × 10
−19 mol L
−1) to 500 pM (5 × 10
−10 mol L
−1), the
VDirac shows a continues negative shift and totally shifts about 50 mV when adding to 500 pM Aβ-42 solutions. The TDN G-FET shows a significant electrical response signal and excellent measuring capabilities to the target Aβ-42. Compared to the electrical response signal of the ssDNA aptamer immobilized G-FET sensor (
Figure S6A), the response of the TDN G-FET shows more greater response signal and better linear relationship (
Figure 2B).
Then, the real-time electrical responses (
Ids −
t) of the TDN G-FET sensor to Aβ-42 solution are tested (
Figure 2C) at different concentrations from 500 zM to 500 pM. Remarkable electrical response signals (|∆
Ids/
Ids0|) are detected within 5 min even when target Aβ-42 solution concentration is 5 aM (5 × 10
−18 mol L
−1). Here, we define the response values |∆
Ids/
Ids0| = |(
Ids −
Ids0) /
Ids0|, where
Ids is the real-time drain-source current, and Ids0 is the initial current. As for the sensor without immobilized probes, no obvious response signals (
Figure 2C) are observed even when 500 pM (5 × 10
−10 mol L
−1) solution is added (gray line). Then, the |∆
Ids/
Ids0| responses of the ssDNA immobilized G-FET device to Aβ-42 solution are also measured under the same conditions, and the |∆
Ids/
Ids0| response values are recorded in
Figure S6B. Compared to the ssDNA aptamer sensors, the |∆
Ids/
Ids0| response of the TDN G-FET (
Figure 2D) sensor is larger, and the response time (<5 min) is also much shorter than that of the ssDNA sensor (~15 min). In addition, from the |∆
Ids/
Ids0| response values of the TDN and ssDNA immobilized G-FET sensors, we calculated that the theoretical LoD of the TDN G-FET sensor reaches 5 aM. It benefited from the high binding affinity and favorable anti-fouling capability of the TDN, which enables more efficient binding to target Aβ-42, then presented a larger |∆
Ids/
Ids0| response value and shorter response time in Ids − t measurement, as well as a larger
VDirac offset in
Ids −
Vlg measurement. Moreover, the ssDNA probes immobilized on the graphene sensing surface will largely produce mutual entanglement and adsorption on graphene, which will reduce the number of effective probes and significantly decrease the electrical response signals.
Then, we measured the
Ids −
t response values by adding other two non-targeted samples with concentrations of 5 fM (5 × 10
−15 mol L
−1) in PBS, including Aβ-40 (sample A) and p-Tau 181 (sample B) proteins. The |∆
Ids/
Ids0| response values of non-targeted samples (inset figure in
Figure 2D) are negligible compared to that of the target Aβ-42 sample even when the added concentration is 500 aM (5 × 10
−16 mol L
−1). Thus, we conclude that the TDN modified G-FET sensor not only exhibits excellent detection performance of ultra-sensitivity and short response time but also shows high specificity.
It is well known that bio-detection includes a bio-recognition and signal transduction process [
33,
34,
37,
38,
39,
40]. The binding affinity between DNA probe and target is the crucial factor in the bio-recognition process. The signal transduction process could be amplified through the G-FET device and reflected on the electrical measurement, which mainly reveals in the
VDirac offset of transfer curve test and the current change of real-time measurement. The binding process can induce charge accumulation on graphene surface, then cause a doping effect to graphene, and the monolayer graphene with high mobility enables efficient and sensitive signal transduction process, which is the fundamental reason for the TDN G-FET sensor achieving such an excellent detection performance.
Here, we calculate the binding affinity by using normalized response of ∆
VDirac/∆
VDirac,max; the correlation between ∆
VDirac/∆
VDirac,max and target analyte concentration is described by the Hill–Langmuir model:
where ∆
VDirac,max is the maximum ∆
VDirac, denoted as ∆
VDirac,max =
VDirac,max −
VDirac,0 (
VDirac,0 and
VDirac,max refer to the offset of adding the zero and maximum concentration target analyte solution, respectively);
A is the saturation response coefficient of the sensing system; and
n is the Hill coefficient corresponding to the binding cooperativity. Thus, the pseudo
KD of the TDN G-FET sensor is 1~3 × 10
−18 mol L
−1 and could be calculated from the fitted
Ids −
Vlg responses curve, which is five orders of magnitude lower than that of the ssDNA aptamer G-FET sensor. The results reveal that the TDN G-FET sensor has a larger offset of ∆
VDirac than that of ssDNA sensors. The TDN enables a higher binding affinity and shorter bio-recognition time compared to the ssDNA probes. In addition, unlike ssDNA probes, the existence of a tetrahedral structure can effectively prevent the probe DNA intertwining with each other and avoid the non-specific bio-molecule adsorption on the graphene surface. Thus, the special structure of the TDN combined with efficient signal transduction of the G-FET gives rise to ultra-sensitive detection of analyte.
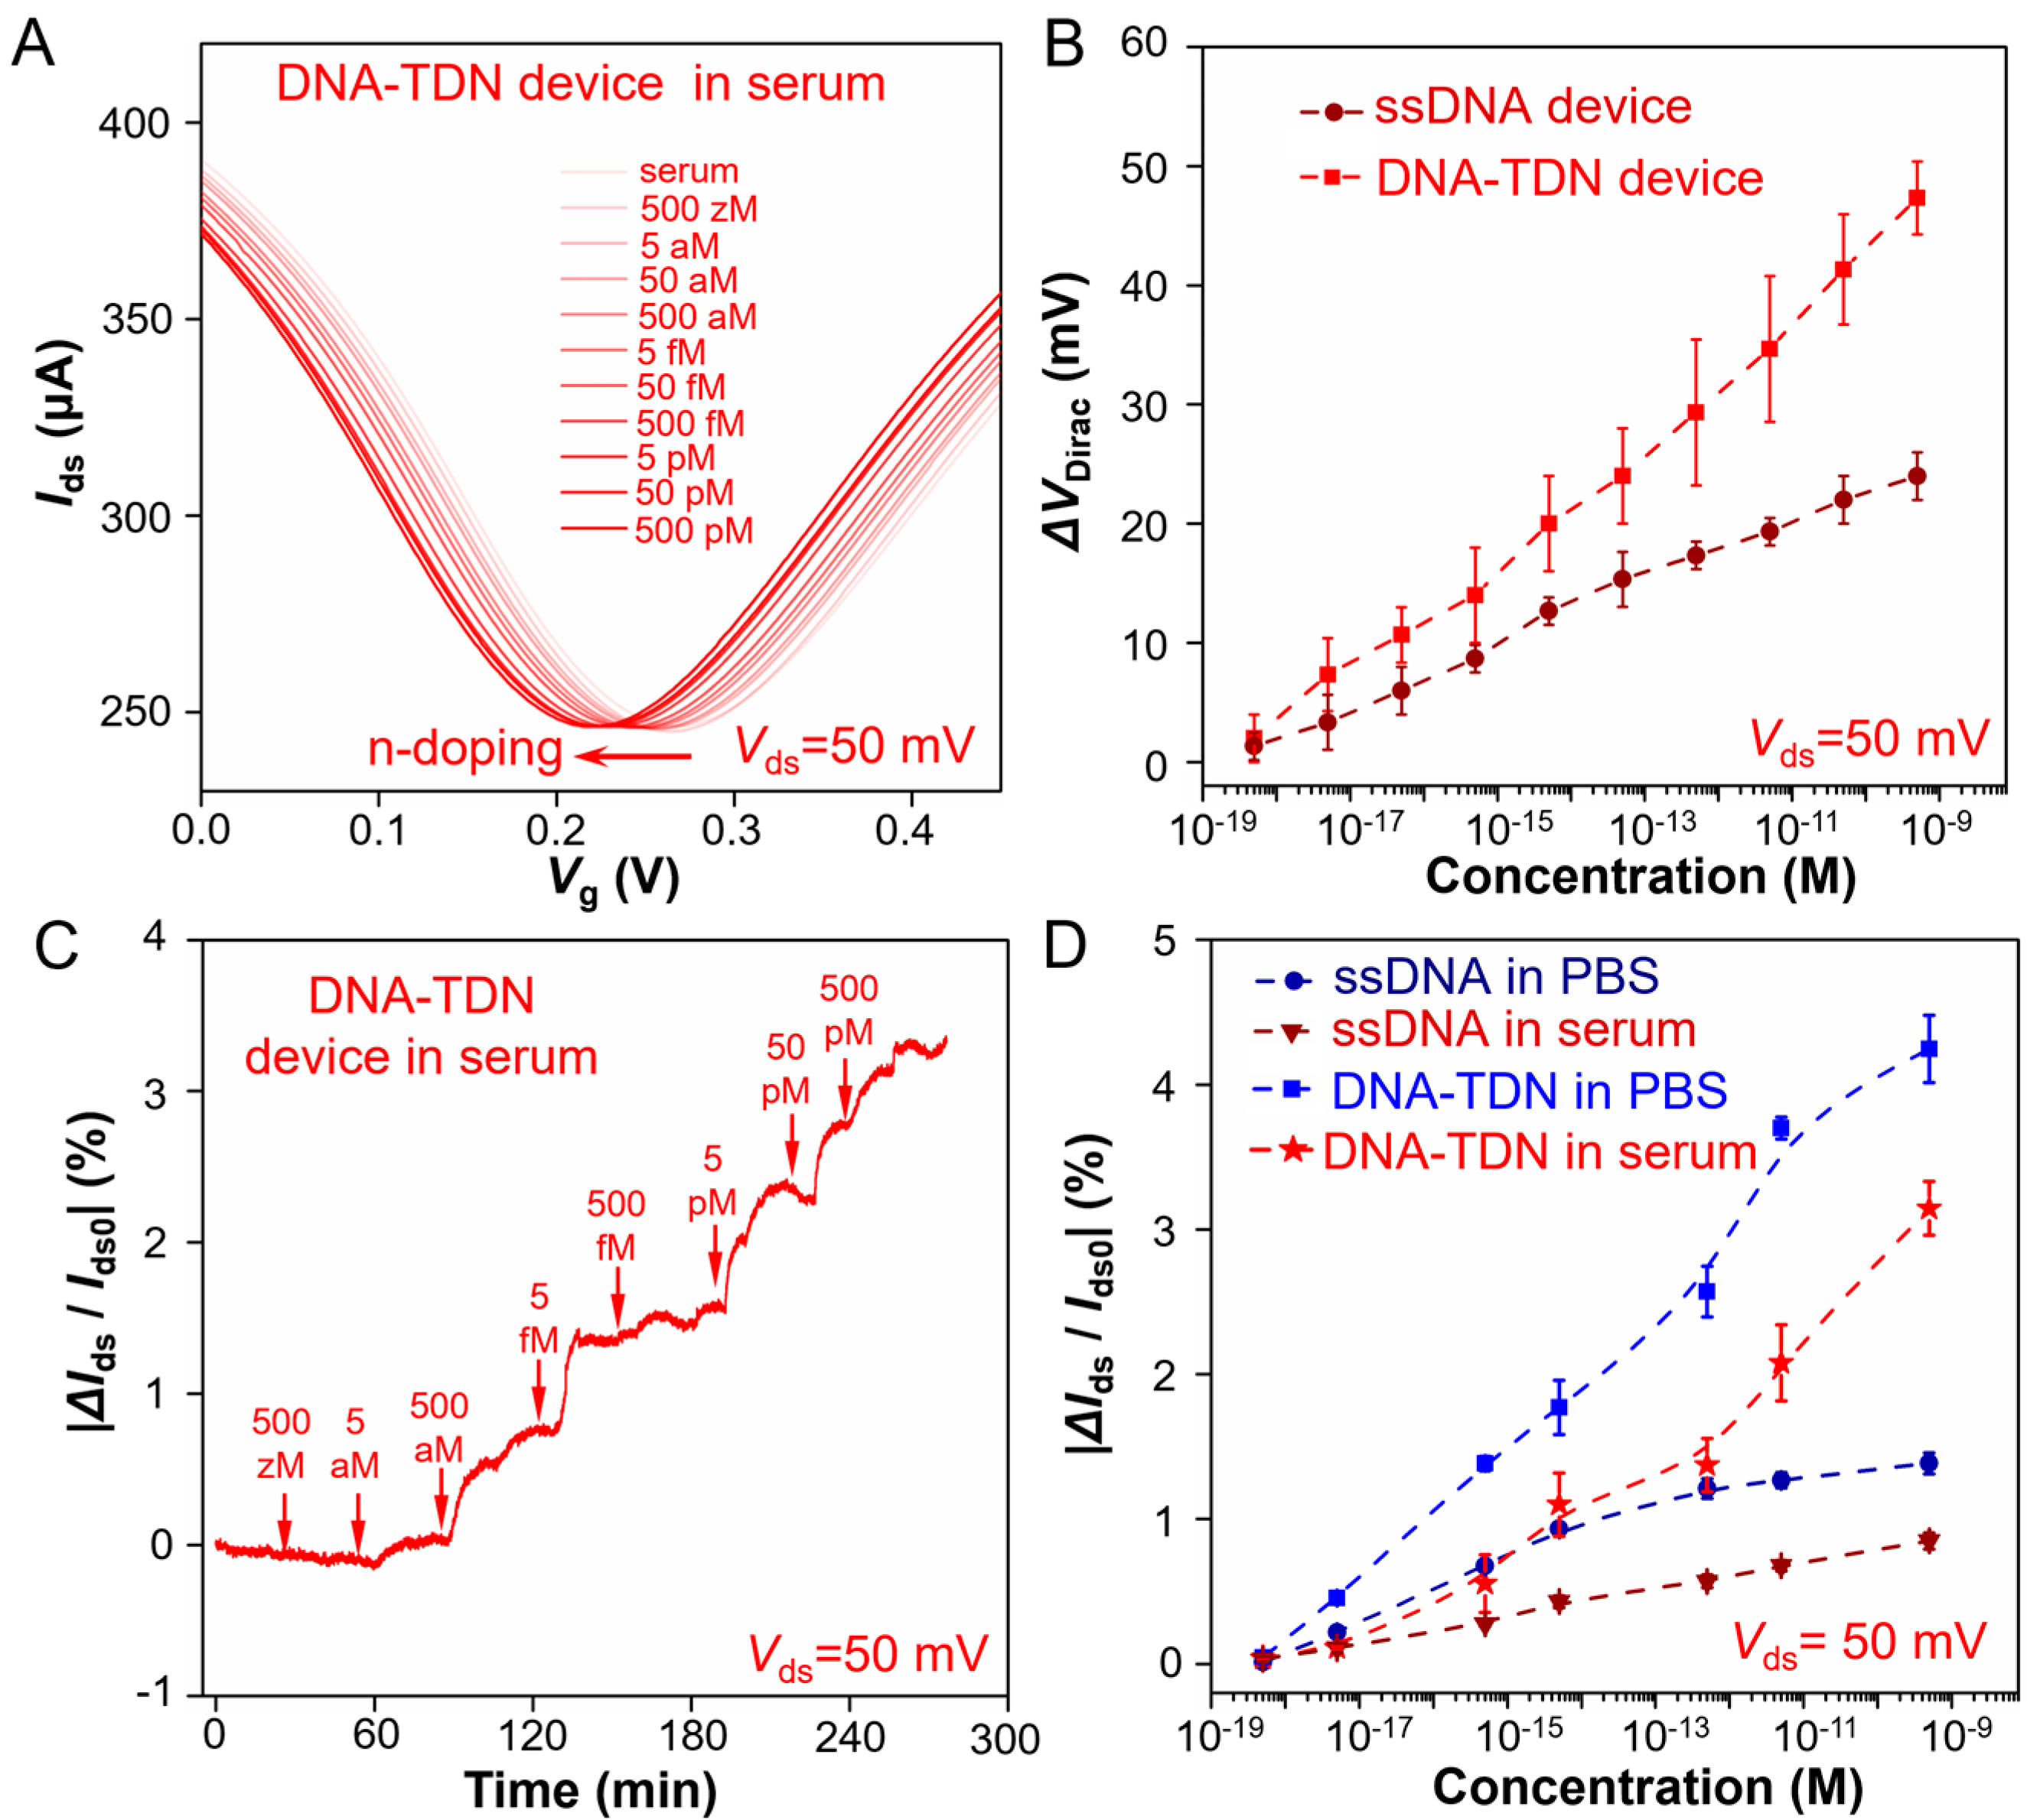
The ultraprecise analysis capability of trace analytes in complicated biofluids is of great significance for biological research. Thus, the TDN G-FET sensor for Aβ-42 detection performance in full serum is also evaluated. We first test the transfer curve (
Ids −
Vlg) of the G-FET device and record the
VDirac shift when adding different Aβ-42 solution concentrations.
Figure 3A shows that with the Aβ-42 solution concentration increased, the
VDirac of the TDN G-FET device occurs with a continues left shift, which is larger than that of the ssDNA immobilized device (
Figure S7A). The statistical
VDirac shifts of all Aβ-42 concentration in
Figure 3B are collected by three parallel experiments that were in the same condition. The real-time electrical responses (
Ids −
t) of the TDN G-FET sensor to Aβ-42 solutions is measured (
Figure 3C) at different concentrations, and the |∆
Ids/
Ids0| responses (
Ids −
t) of the ssDNA G-FET sensor to all concentration (
Figure S7B) are recorded. From the statistics |∆
Ids/
Ids0| response values of all Aβ-42 concentrations (
Figure 3D) through three parallel experiments, it is revealed that the TDN G-FET sensor has ultraprecise and sensitive detection capability for Aβ-42 in full serum. To further confirm the interfering molecules in the serum, such as proteins, lipid or DNA, which cannot disturb the function of this biosensor, we conducted the relevant selectivity experiments that test the transfer curve of this G-FET sensor and observed the shift of the
VDirac point when adding serum and random DNA sequences that dissolved in serum. The results are shown in
Figure S8. These testing results demonstrate that the serum proteins, lipid or DNA cannot disturb the function of this biosensor, and it validates that the sensor has excellent detection performance and reliability in serum. This is beneficial for at-home monitoring for the Aβ-42 level at any time, which is crucial for patients who suffer from Alzheimer’s disease.
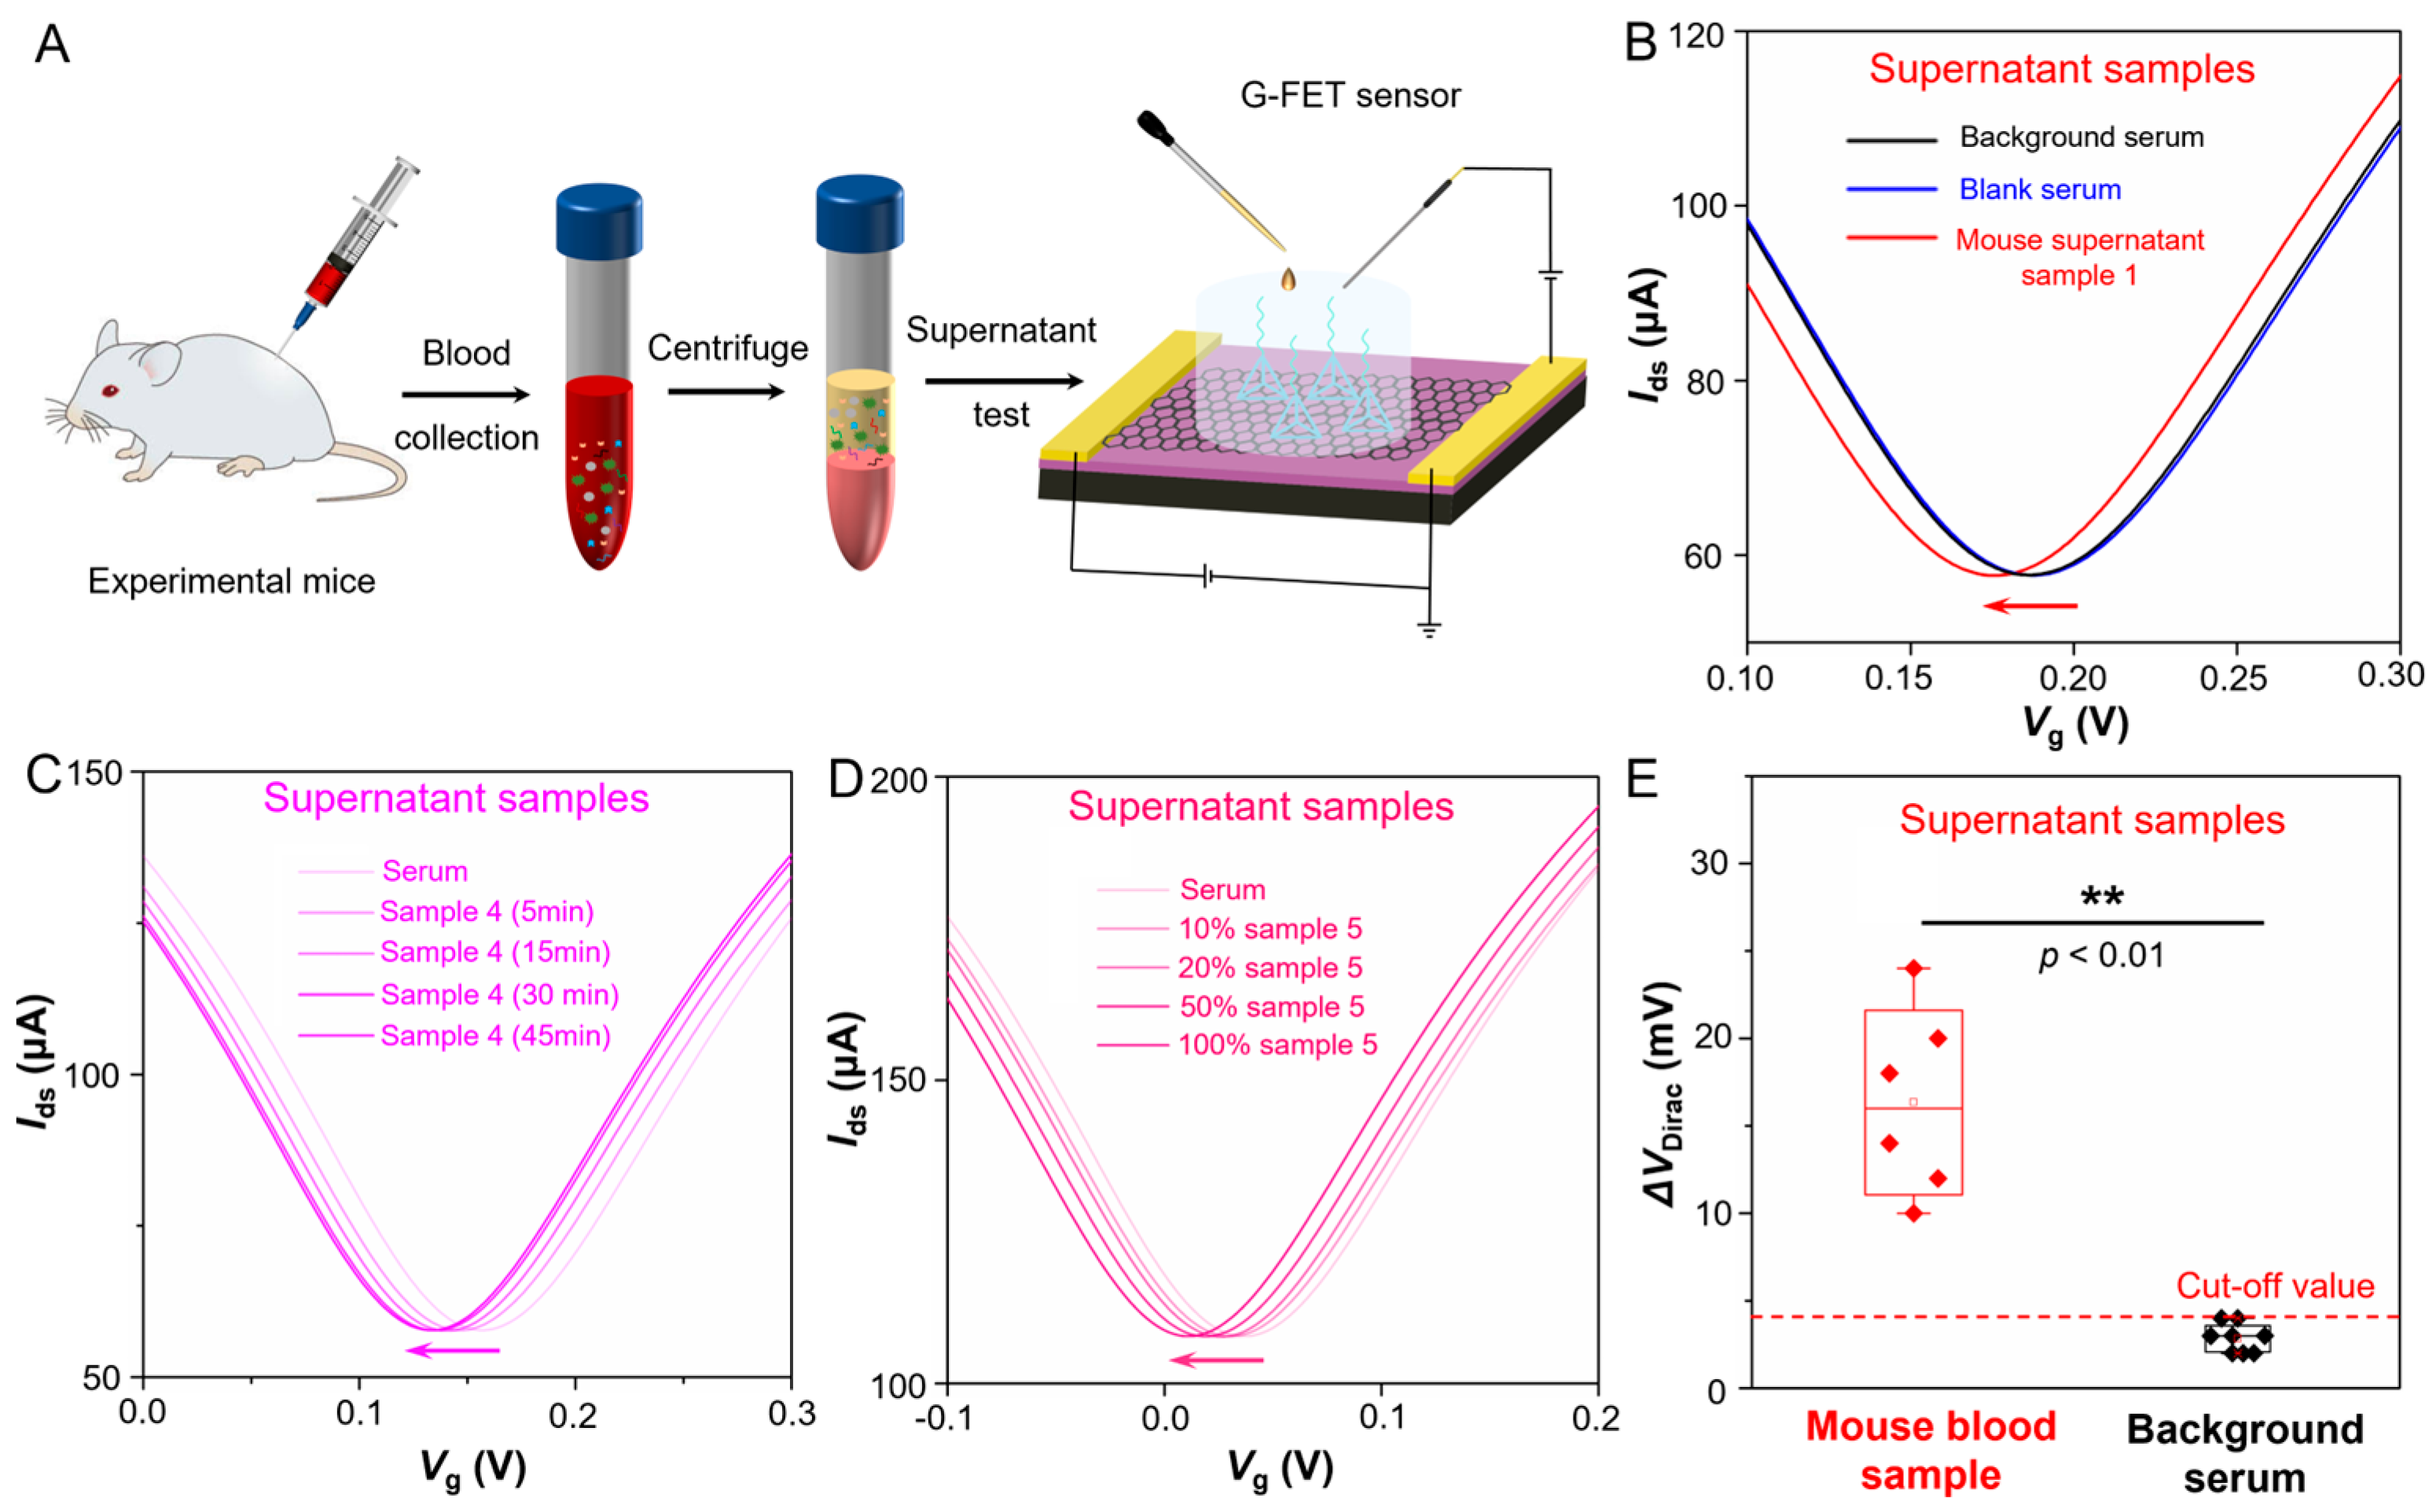
Furthermore, we tested six supernatant samples (Sample 1~6) collected from the blood serum of laboratory-cultured mice which suffering from Alzheimer’s disease. The schematic diagram of TDN G-FET sensor for Aβ-42 testing of supernatant samples is shown in
Figure 4A. The real-time |∆
VDirac| response of the G-FET sensor upon adding blank serum and supernatant sample 1 is shown in
Figure 4B; the |∆
VDirac| response result reveals that unlike adding the blank serum, once adding supernatant sample 1, the ∆
VDirac of this sensor occurs with a large left shift. Due to the TDN probes immobilized on the sensing surface binding to the target Aβ-42 in supernatant, then induces a n-doping to the graphene and makes the ∆
VDirac left shifting. Then we test the |∆
VDirac| response of G-FET sensor upon adding supernatant sample 4 with different reaction time (5 min, 15 min, 30 min and 45 min), the result (
Figure 4C) shows that even though with 5 min reaction time, the TDN probes also can exactly and rapidly binding to the target Aβ-42 in the complex serum environment and induce a noticeable shifted. This sensor exhibits a less than 5 min response time in the supernatant samples owing to the TDN probes immobilized onto the sensing surface sequenced and orderly. After that, we test the |∆
VDirac| response of G-FET sensor when adding supernatant sample 5 with several concentration gradients which diluted in ten times, five times, two times and entire concentration, the result (
Figure 4D) shows that even though the supernatant sample that diluted in ten times, the ∆
VDirac occurs a remarkable negative shift with 5 min, which reveals this G-FET sensor achieves a sensitive and precise detecting capability to insulin in supernatant serum samples. Then, all six supernatant samples are tested by the G-FET sensors (
Figure S9A–E) and the statistical |∆
VDirac| responses of supernatant samples and blank serum samples are recorded in
Figure 4E and
Table S2. The above test shows this TDN G-FET sensor can rapidly and sensitively detect the Aβ-42 in the blood serum supernatant, it can accurately distinguish between blank serum samples and blood serum supernatant samples that containing Aβ-42, which exhibits excellent detection performance and great application potential in home monitoring of Alzheimer’s disease.


