


Exploring the Effectiveness of Road Maintenance Interventions on IRI Value Using Crowdsourced Connected Vehicle Data

 ,
,  ,
,  ,
, 
Abstract
1. Introduction
1.1. Pavement Management System (PMS)
1.2. International Roughness Index
1.3. Road Roughness Calculation Using Connected Vehicles
2. Methods
Data Description
3. Results
3.1. Normality of Data
3.2. Multiple Linear Regression
3.2.1. ANOVA
3.2.2. Coefficients
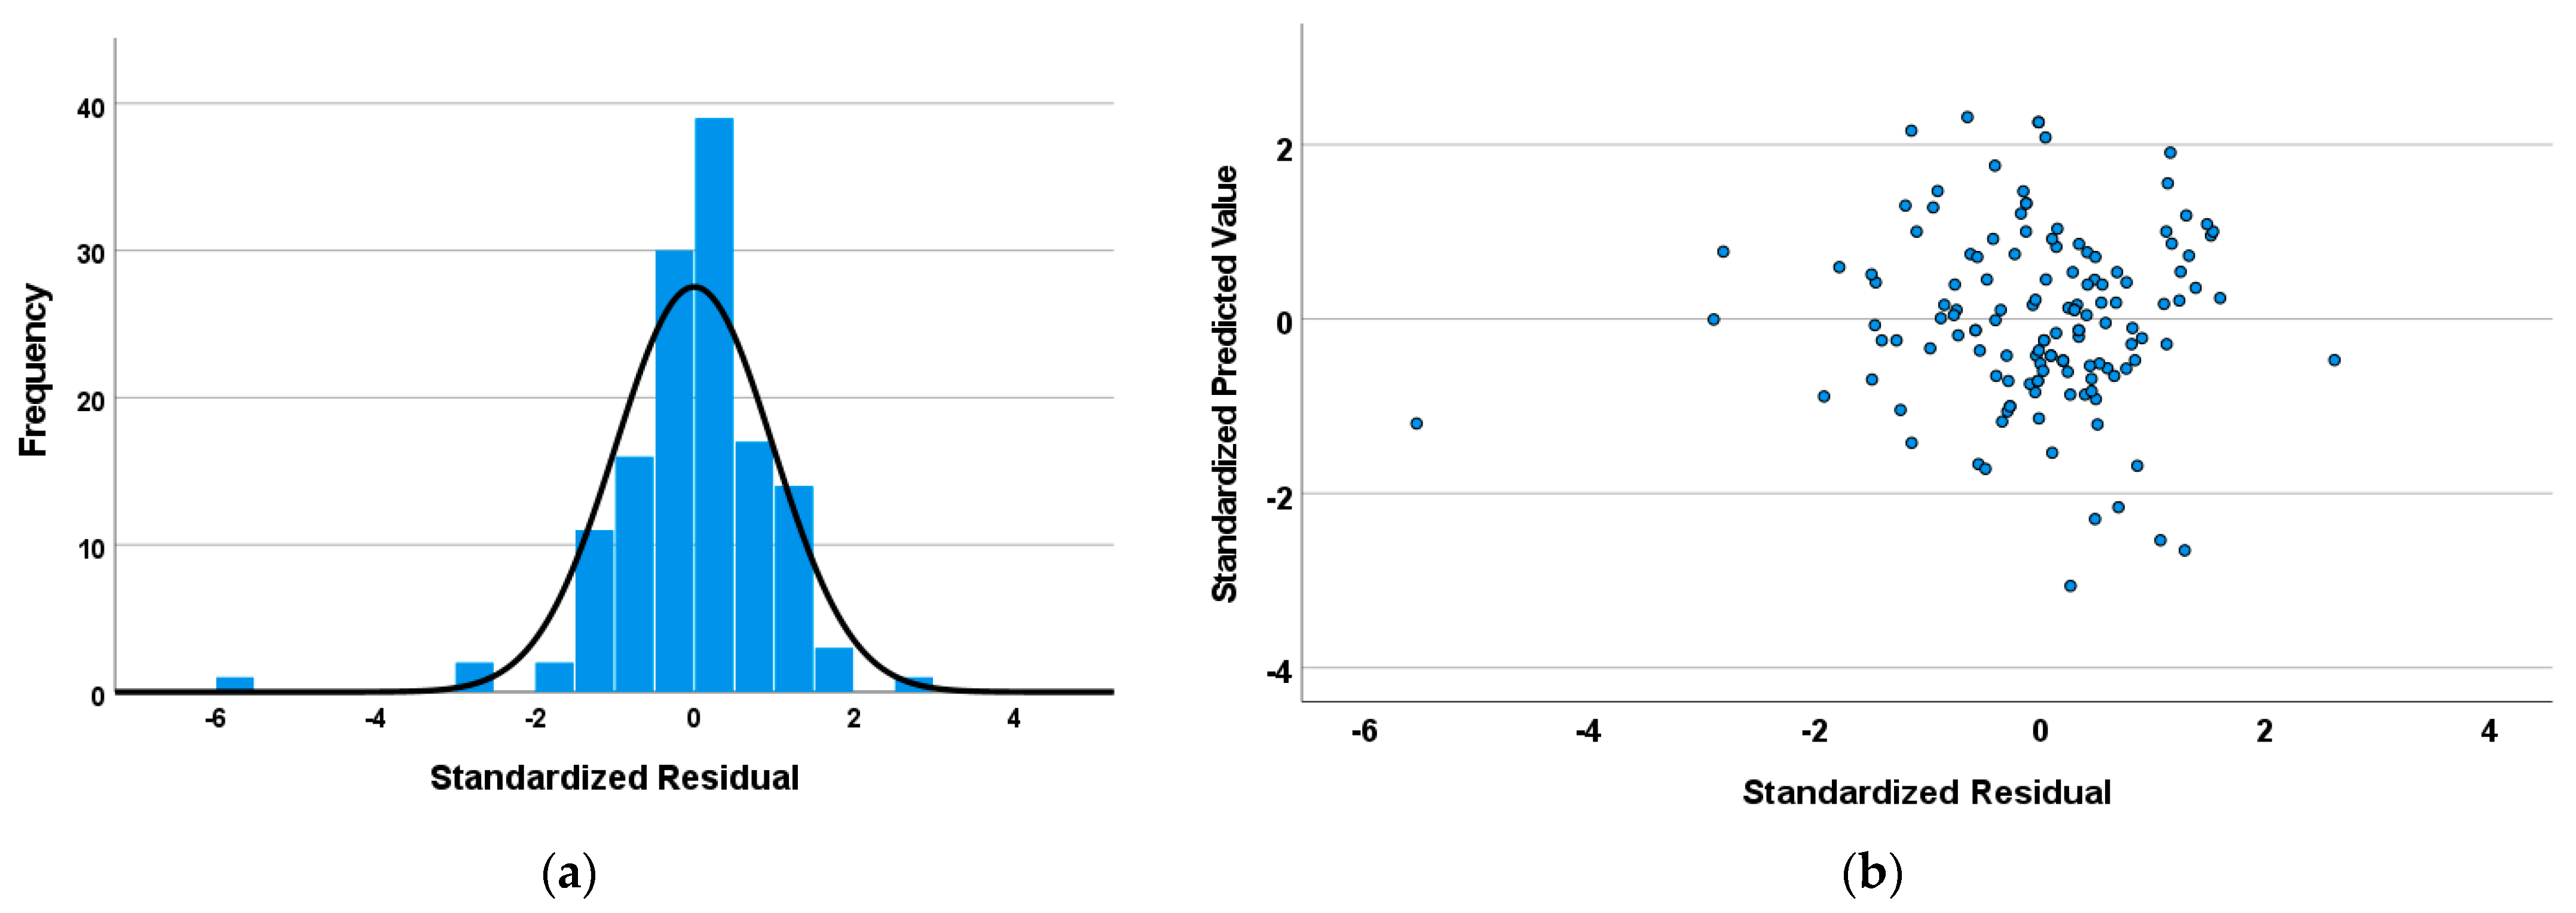
3.2.3. Residual Analysis
4. Discussion and Conclusions
Author Contributions
Funding
Institutional Review Board Statement
Informed Consent Statement
Data Availability Statement
Acknowledgments
Conflicts of Interest
Abbreviations
| IRI | International Roughness Index |
| MLR | Multiple Linear Relation |
| PMS | Pavement Management System |
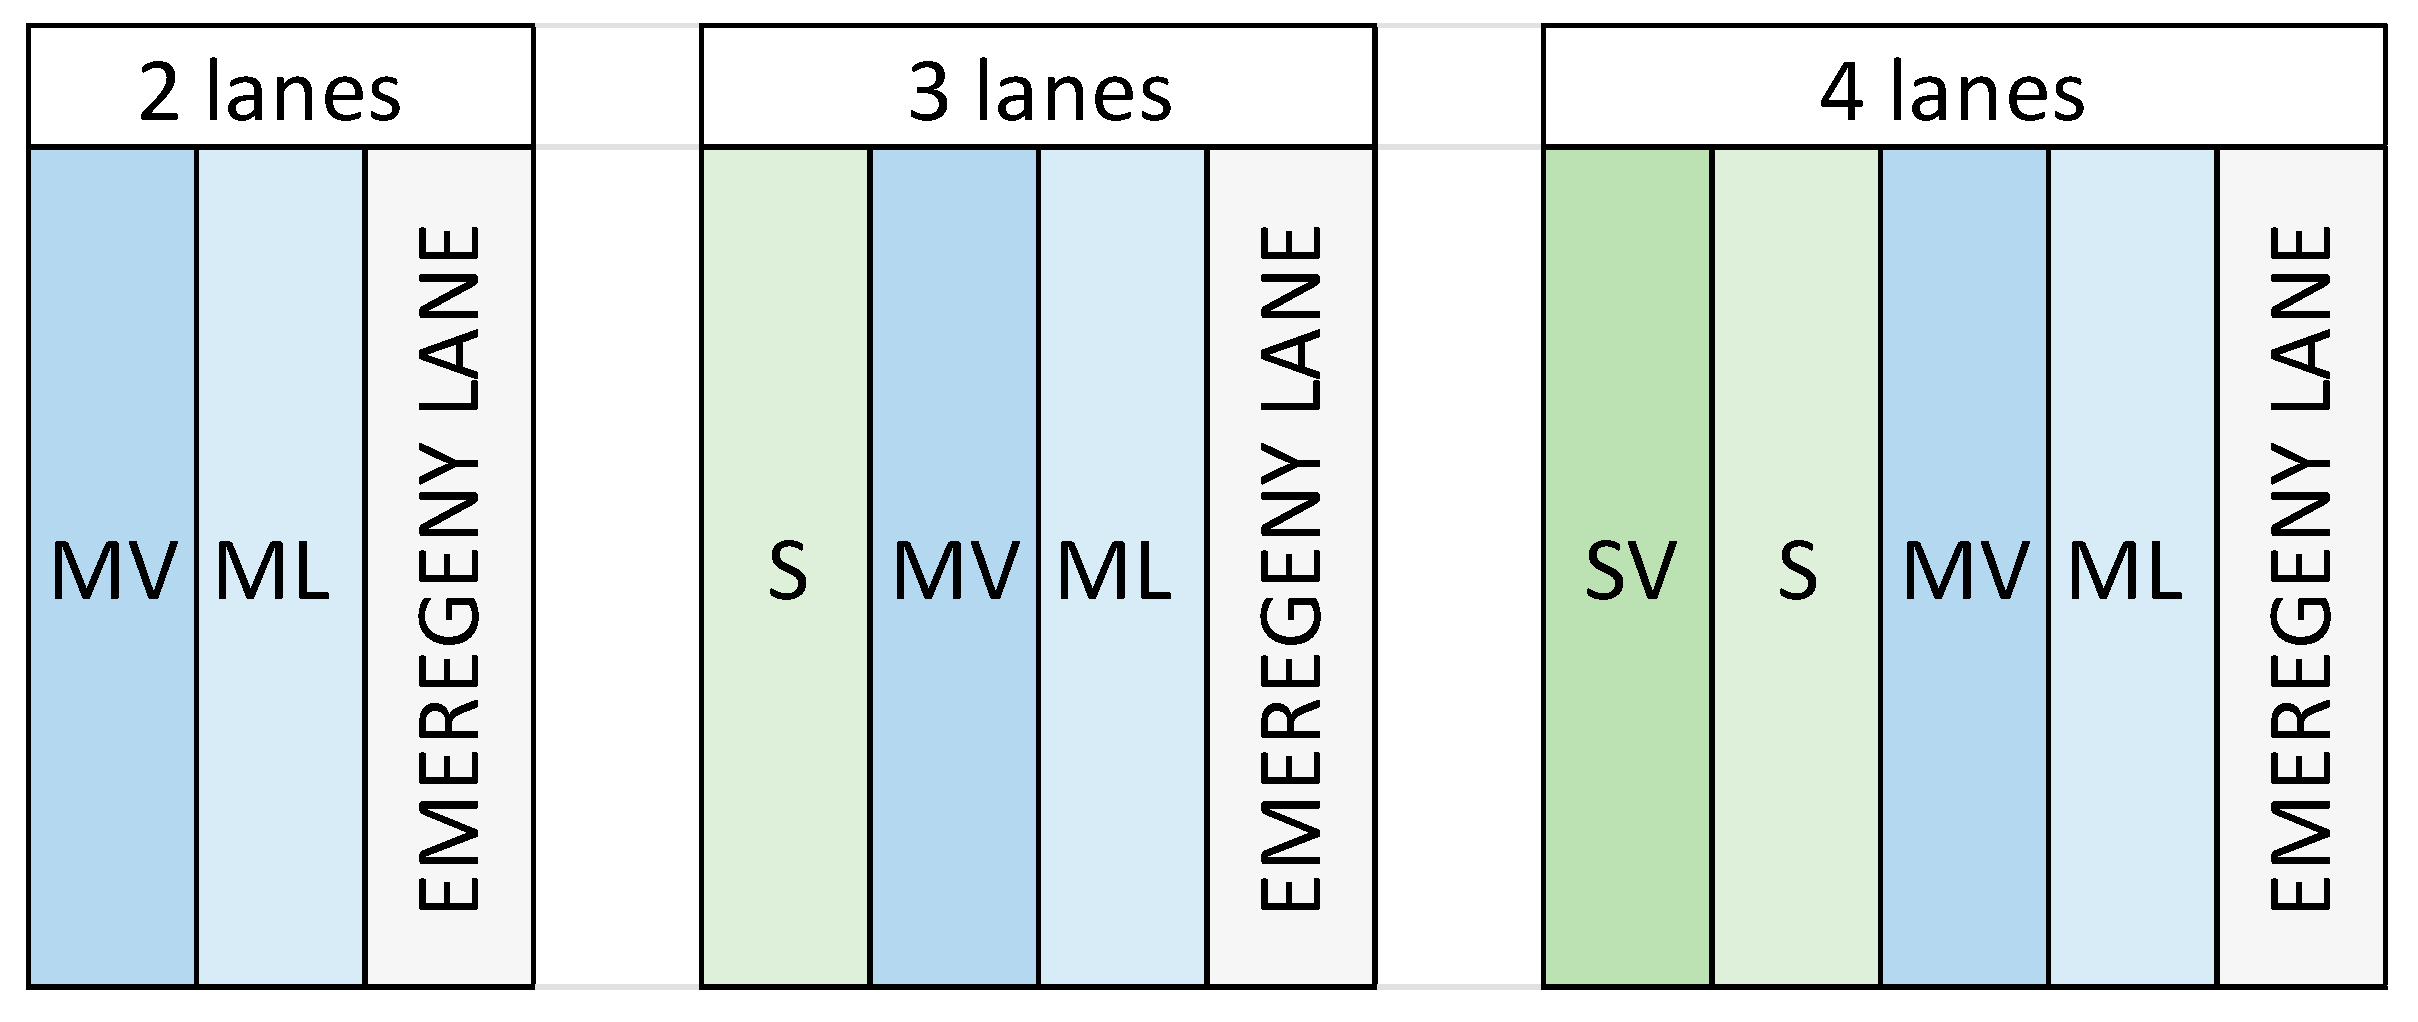
| ML | Shoulder lane (Marcia Lenta) |
| MV | Middle lane (Marcia Veloce) |
| S | Shoulder median lane (Sorpasso) |
| SV | Fast overtaking lane (Sorpasso veloce) |
References
- Burningham, S.; Stankevich, N. Why Road Maintenance Is Important and How to Get It Done; World Bank: Washington, DC, USA, 2005. [Google Scholar]
- Sharif, F.; Tauqir, A. The Effects of Infrastructure Development and Carbon Emissions on Economic Growth. Environ. Sci. Pollut. Res. 2021, 28, 36259–36273. [Google Scholar] [CrossRef] [PubMed]
- Gopalakrishnan, K. Deep Learning in Data-Driven Pavement Image Analysis and Automated Distress Detection: A Review. Data 2018, 3, 28. [Google Scholar] [CrossRef]
- Radović, N.; Jokanović, I.; Matić, B.; Šešlija, M. A Measurement of Roughness as Indicator of Road Network Condition—Case Study Serbia. Teh. Vjesn. 2016, 23, 881–884. [Google Scholar] [CrossRef]
- Hudson, W.R. Public Infrastructure Asset Management, 2nd ed.; McGraw-Hill’s AccessEngineering; McGraw-Hill: New York, NY, USA, 2013; ISBN 978-0-07-182011-0. [Google Scholar]
- Chin, A.; Olsen, M.J. Evaluation of Technologies for Road Profile Capture, Analysis, and Evaluation. J. Surv. Eng. 2015, 141, 04014011. [Google Scholar] [CrossRef]
- Kartika Novianti, P.; Setyawan, A.; Pramesti, F.P. Evaluation of Road Functional Performance Using Pavement Condition Index (PCI) and International Roughness Index (IRI) Methods Using Hawkeye (Case Study: Demak Ring Road, Central Java Province). IOP Conf. Ser. Earth Environ. Sci. 2024, 1381, 012035. [Google Scholar] [CrossRef]
- Marcelino, P.; Lurdes Antunes, M.D.; Fortunato, E. Comprehensive Performance Indicators for Road Pavement Condition Assessment. Struct. Infrastruct. Eng. 2018, 14, 1433–1445. [Google Scholar] [CrossRef]
- Dennis, E.P.; Hong, Q.; Wallace, R.; Tansil, W.; Smith, M. Pavement Condition Monitoring with Crowdsourced Connected Vehicle Data. Transp. Res. Rec. J. Transp. Res. Board 2014, 2460, 31–38. [Google Scholar] [CrossRef]
- Gu, Y.; Khojastehpour, M.; Jia, X.; Han, L.D. Estimating Pavement Condition by Leveraging Crowdsourced Data. Remote Sens. 2024, 16, 2237. [Google Scholar] [CrossRef]
- Jan, M.; Khattak, K.S.; Khan, Z.H.; Gulliver, T.A.; Altamimi, A.B. Crowdsensing for Road Pavement Condition Monitoring: Trends, Limitations, and Opportunities. IEEE Access 2023, 11, 133143–133159. [Google Scholar] [CrossRef]
- Levenberg, E.; Skar, A.; Pour, S.M.; Kindler, E.; Pettinari, M.; Bajic, M.; Alstrøm, T.S.; Schlotz, U. Live Road Condition Assessment with Internal Vehicle Sensors. Transp. Res. Rec. J. Transp. Res. Board 2021, 2675, 1442–1452. [Google Scholar] [CrossRef]
- American Association of State Highway and Transportation Officials. AASHTO Guide for Design of Pavement Structures; AASHTO: Washington, DC, USA, 1993; ISBN 978-1-56051-055-0. [Google Scholar]
- Flora, W.; Ong, G.P.; Sinha, K. Development of a Structural Index as an Integral Part of the Overall Pavement Quality in the INDOT PMS; FHWA/IN/JTRP-2010/11; Purdue University: West Lafayette, IN, USA, 2010; 3062. [Google Scholar]
- Lamptey, G.; Ahmad, M.; Labi, S. Life Cycle Cost Analysis for INDOT Pavement Design Procedures; FHWA/IN/JTRP-2004/28; Purdue University: West Lafayette, IN, USA, 2005; 2712. [Google Scholar]
- Wang, Z.; Pyle, T. Implementing a Pavement Management System: The Caltrans Experience. Int. J. Transp. Sci. Technol. 2019, 8, 251–262. [Google Scholar] [CrossRef]
- Khattak, M.J.; Baladi, G.Y.; Zhang, Z.; Ismail, S. Review of Louisiana’s Pavement Management System: Phase I. Transp. Res. Rec. J. Transp. Res. Board 2008, 2084, 18–27. [Google Scholar] [CrossRef]
- Mendez Larrain, M.M.; Ali, S.A.; Hobson, K.; Zaman, M. Calibration of Effective Structural Number and Tensile Strain Models Using Traffic Speed Deflectometer (TSD) Data for Enhanced Project-Level Assessment on Flexible and Composite Pavements. Sustainability 2023, 15, 14848. [Google Scholar] [CrossRef]
- Peraka, N.S.P.; Biligiri, K.P. Pavement Asset Management Systems and Technologies: A Review. Autom. Constr. 2020, 119, 103336. [Google Scholar] [CrossRef]
- Kulkarni, R.B.; Miller, R.W. Pavement Management Systems: Past, Present, and Future. Transp. Res. Rec. J. Transp. Res. Board 2003, 1853, 65–71. [Google Scholar] [CrossRef]
- Pawar, P.R.; Mathew, A.T.; Saraf, M.R. IRI (International Roughness Index): An Indicator of Vehicle Response. Mater. Today Proc. 2018, 5, 11738–11750. [Google Scholar] [CrossRef]
- Sayers, M.W.; Gillespie, T.D.; Queiroz, C.A.V. The International Road Roughness Experiment: Establishing Correlation and a Calibration Standard for Measurements; World Bank Technical Paper; World Bank: Washington, DC, USA, 1986; ISBN 978-0-8213-0589-8. [Google Scholar]
- ASTM E1926-08; Standard Practice for Computing International Roughness Index of Roads from Longitu dinal Profile Measurements. ASTM International: West Conshohocken, PA, USA, 2021.
- Abdelaziz, N.; Abd El-Hakim, R.T.; El-Badawy, S.M.; Afify, H.A. International Roughness Index Prediction Model for Flexible Pavements. Int. J. Pavement Eng. 2020, 21, 88–99. [Google Scholar] [CrossRef]
- Tamagusko, T.; Ferreira, A. Machine Learning for Prediction of the International Roughness Index on Flexible Pavements: A Review, Challenges, and Future Directions. Infrastructures 2023, 8, 170. [Google Scholar] [CrossRef]
- Tehrani, S.S.; Falls, L.C.; Mesher, D. Road Users’ Perception of Roughness and the Corresponding IRI Threshold Values. Can. J. Civ. Eng. 2015, 42, 233–240. [Google Scholar] [CrossRef]
- Llopis-Castelló, D.; Camacho-Torregrosa, F.J.; Romeral-Pérez, F.; Tomás-Martínez, P. Estimation of Pavement Condition Based on Data from Connected and Autonomous Vehicles. Infrastructures 2024, 9, 188. [Google Scholar] [CrossRef]
- Mahlberg, J.A.; Li, H.; Zachrisson, B.; Leslie, D.K.; Bullock, D.M. Pavement Quality Evaluation Using Connected Vehicle Data. Sensors 2022, 22, 9109. [Google Scholar] [CrossRef]
- Mahlberg, J.A.; Li, H.; Zachrisson, B.; Mathew, J.K.; Bullock, D.M. Applications of Using Connected Vehicle Data for Pavement Quality Analysis. Front. Future Transp. 2024, 4, 1239744. [Google Scholar] [CrossRef]
- Du, Y.; Liu, C.; Wu, D.; Li, S. Application of Vehicle Mounted Accelerometers to Measure Pavement Roughness. Int. J. Distrib. Sens. Netw. 2016, 12, 8413146. [Google Scholar] [CrossRef]
- Liu, C.; Wu, D.; Li, Y.; Du, Y. Large-Scale Pavement Roughness Measurements with Vehicle Crowdsourced Data Using Semi-Supervised Learning. Transp. Res. Part C Emerg. Technol. 2021, 125, 103048. [Google Scholar] [CrossRef]
- Sandamal, R.M.K.; Pasindu, H.R. Applicability of Smartphone-Based Roughness Data for Rural Road Pavement Condition Evaluation. Int. J. Pavement Eng. 2022, 23, 663–672. [Google Scholar] [CrossRef]
- Austin, P.C.; Laupacis, A. A Tutorial on Methods to Estimating Clinically and Policy-Meaningful Measures of Treatment Effects in Prospective Observational Studies: A Review. Int. J. Biostat. 2011, 7, 6. [Google Scholar] [CrossRef]
- Schmidt, A.F.; Groenwold, R.H.H.; Knol, M.J.; Hoes, A.W.; Nielen, M.; Roes, K.C.B.; De Boer, A.; Klungel, O.H. Exploring Interaction Effects in Small Samples Increases Rates of False-Positive and False-Negative Findings: Results from a Systematic Review and Simulation Study. J. Clin. Epidemiol. 2014, 67, 821–829. [Google Scholar] [CrossRef]
- Abed, M.S. Development of Regression Models for Predicting Pavement Condition Index from the International Roughness Index. J. Eng. 2020, 26, 81–94. [Google Scholar] [CrossRef]
- Kim, S.-H.; Kim, N. Development of Performance Prediction Models in Flexible Pavement Using Regression Analysis Method. KSCE J. Civ. Eng. 2006, 10, 91–96. [Google Scholar] [CrossRef]
- Saeed, F.; Rahman, M.; Mahmood, M. Multiple Linear Regression Models for Predicting Surface Damage Due to Repeated Dynamic Loading on Submerged Asphalt Pavement. In Proceedings of the 9th International Conference on Maintenance and Rehabilitation of Pavements—Mairepav9, Zurich, Switzerland, 1–3 July 2020; Raab, C., Ed.; Lecture Notes in Civil Engineering; Springer International Publishing: Cham, Switzerland, 2020; Volume 76, pp. 975–985. ISBN 978-3-030-48678-5. [Google Scholar]
- Pilz, J. (Ed.) Interfacing Geostatistics and GIS; Springer: Berlin/Heidelberg, Germany, 2009; ISBN 978-3-540-33235-0. [Google Scholar]
- Nalin, A.; Vignali, V.; Lantieri, C.; Cappellari, D.; Zamengo, B.; Simone, A. Assessing Veracity of Big Data: An in-Depth Evaluation Process from the Comparison of Mobile Phone Traces and Groundtruth Data in Traffic Monitoring. J. Transp. Geogr. 2024, 118, 103930. [Google Scholar] [CrossRef]
- Bland, M. An Introduction to Medical Statistics, 4th ed.; Oxford Medical Publications; Oxford University Press: Oxford, UK, 2015; ISBN 978-0-19-958992-0. [Google Scholar]
- Arkkelin, D. Using SPSS to Understand Research and Data Analysis; Valparaiso University: Valparaiso, IN, USA, 2014. [Google Scholar]
- Mishra, P.; Pandey, C.M.; Singh, U.; Gupta, A.; Sahu, C.; Keshri, A. Descriptive Statistics and Normality Tests for Statistical Data. Ann. Card. Anaesth. 2019, 22, 67–72. [Google Scholar] [CrossRef] [PubMed]
- Chicco, D.; Warrens, M.J.; Jurman, G. The Coefficient of Determination R-Squared Is More Informative than SMAPE, MAE, MAPE, MSE and RMSE in Regression Analysis Evaluation. PeerJ Comput. Sci. 2021, 7, e623. [Google Scholar] [CrossRef] [PubMed]
- Durbin, J.; Watson, G.S. Testing for Serial Correlation in Least Squares Regression: I. Biometrika 1950, 37, 409–428. [Google Scholar] [CrossRef] [PubMed]
- O’brien, R.M. A Caution Regarding Rules of Thumb for Variance Inflation Factors. Qual. Quant. 2007, 41, 673–690. [Google Scholar] [CrossRef]
- Akinwande, M.O.; Dikko, H.G.; Samson, A. Variance Inflation Factor: As a Condition for the Inclusion of Suppressor Variable(s) in Regression Analysis. Open J. Stat. 2015, 5, 754–767. [Google Scholar] [CrossRef]
- Suleiman, A.A.; Abdullahi, U.A.; Ahmad, U.A. An Analysis of Residuals in Multiple Regressions. Int. J. Adv. Technol. Eng. Sci. 2015, 3, 2348–7550. [Google Scholar]
- Wang, B.; Zhou, Z.; Wang, H.; Tu, X.M.; Feng, C. The P-Value and Model Specification in Statistics. Gen. Psych. 2019, 32, e100081. [Google Scholar] [CrossRef]
- McKean, J.W.; Sheather, S.J. Statistics, Nonparametric. In Encyclopedia of Physical Science and Technology; Elsevier: New York, NY, USA, 2003; pp. 891–914. ISBN 978-0-12-227410-7. [Google Scholar]
- Chuang, T.-Y.; Perng, N.-H.; Han, J.-Y. Pavement Performance Monitoring and Anomaly Recognition Based on Crowdsourcing Spatiotemporal Data. Autom. Constr. 2019, 106, 102882. [Google Scholar] [CrossRef]
- France-Mensah, J.; O’Brien, W.J. Budget Allocation Models for Pavement Maintenance and Rehabilitation: Comparative Case Study. J. Manag. Eng. 2018, 34, 05018002. [Google Scholar] [CrossRef]
- Gao, L.; Zhang, Z. Management of Pavement Maintenance, Rehabilitation, and Reconstruction through Network Partition. Transp. Res. Rec. J. Transp. Res. Board 2013, 2366, 59–63. [Google Scholar] [CrossRef]
- Issa, A.; Samaneh, H.; Ghanim, M. Predicting Pavement Condition Index Using Artificial Neural Networks Approach. Ain Shams Eng. J. 2022, 13, 101490. [Google Scholar] [CrossRef]
- Abohassan, A.; El-Basyouny, K.; Kwon, T.J. Exploring the Associations between Winter Maintenance Operations, Weather Variables, Surface Condition, and Road Safety: A Path Analysis Approach. Accid. Anal. Prev. 2021, 163, 106448. [Google Scholar] [CrossRef] [PubMed]
- Qiao, Y.; Dawson, A.R.; Parry, T.; Flintsch, G.W. Evaluating the Effects of Climate Change on Road Maintenance Intervention Strategies and Life-Cycle Costs. Transp. Res. Part D Transp. Environ. 2015, 41, 492–503. [Google Scholar] [CrossRef]
- Al-Suleiman, T.I.; Sinha, K.C.; Riverson, J.D. Effects of Pavement Age and Traffic on Maintenance Effectiveness. J. Transp. Eng. 1991, 117, 644–659. [Google Scholar] [CrossRef]

| Condition | IRI (m/km) |
|---|---|
| Good | <1.5 |
| Fair | 1.5–2.7 |
| Poor | >2.7 |
| Condition | IRI (m/km) |
|---|---|
| Good | <1.5 |
| Fair | 1.5–1.9 |
| Poor | >1.9 |
| Fundamental Parameters | Unit of Measure (UoM) | Parameter Description |
|---|---|---|
| Ltot | n | Total number of lanes in the maintained section |
| DUMMY_ML | floating 0–1 | If maintenance occurred in the shoulder lane (Marcia Lenta) |
| DUMMY_MV | floating 0–1 | If maintenance occurred in the middle lane (Marcia Veloce) |
| DUMMY_S | floating 0–1 | If maintenance occurred in the shoulder median lane (Sorpasso) |
| IRImed_pre | m/km or mm/m | Average daily IRI value for each maintained section 50 days before the maintenance event |
| IRImed_post | m/km or mm/m | Average daily IRI value for each maintained section 50 days after the maintenance event |
| Derived Parameters | Parameter Description |
|---|---|
| Lmtd/Ltot | Ratio between the total number of lanes maintained (Lmtd) and the total number of lanes (Ltot) |
| A | Product between ln(IRImed_pre) and n_lines_tot |
| C | Product between ln(IRImed_post) and n_lines_tot |
| Kolmogorov–Smirnov a | |||
|---|---|---|---|
| Statistic | Dof | Sign. | |
| A | 0.071 | 136 | 0.091 |
| C | 0.064 | 136 | 0.200 * |
| Role | Variable | Description |
|---|---|---|
| Dependent variable | C | Product between ln(IRImed_post) and n_lines_tot |
| Predictors | A | Product between ln(IRImed_pre) and n_lines_tot |
| Lmtd/Ltot | Ratio between the total number of lanes maintained and the total number of lanes | |
| DUMMY_ML | If maintenance occurred in the shoulder lane (Marcia Lenta) | |
| DUMMY_MV | If maintenance occurred in the middle lane (Marcia Veloce) | |
| DUMMY_S | If maintenance occurred in the shoulder median lane (Sorpasso) |
| Model Recap b | ||||
|---|---|---|---|---|
| R | R2 | R2 Adjusted | Std. Error | Durbin-Watson |
| 0.883 a | 0.780 | 0.773 | 0.106 | 1.722 |
| ANOVA | ||||
|---|---|---|---|---|
| Sum of Squares | Mean Square | F | Sign. | |
| Regression | 5.182 | 1.295 | 115.788 | <0.001 |
| Residual | 1.466 | 0.011 | ||
| Total | 6.647 | |||
| Non-Standardized Coefficients | Standardized Coefficients | 95% Confidence Interval for B | Collinearity | ||||||
|---|---|---|---|---|---|---|---|---|---|
| B | Std. Error | Beta | t | Sign. | Lower Bound | Upper Bound | Tolerance | VIF | |
| Constant | 0.441 | 0.083 | 5.281 | <0.001 | 0.276 | 0.606 | |||
| A = ln(IRImed_pre) × Ltot | 0.823 | 0.043 | 0.802 | 19.281 | <0.001 | 0.738 | 0.907 | 0.972 | 1.029 |
| Lmtd/Ltot | −0.853 | 0.136 | −0.306 | −6.258 | <0.001 | −1.122 | −0.583 | 0.702 | 1.425 |
| DUMMY_MV | −0.086 | 0.023 | −0.160 | −3.737 | <0.001 | −0.132 | −0.041 | 0.921 | 1086 |
| DUMMY_S | −0.065 | 0.033 | −0.094 | −1.945 | 0.054 | −0.131 | −0.001 | 0.716 | 1.139 |
| Minimum | Maximum | Average | Standard Deviation | |
|---|---|---|---|---|
| Predicted value | 0.942 | 1.997 | 1.542 | 0.195 |
| Residual | −0.587 | 0.276 | 0.000 | 0.105 |
| Predicted value std. | −3.051 | 2.314 | 0.000 | 1.000 |
| Standard residual | −5.491 | 2.581 | 0.000 | 0.977 |
Disclaimer/Publisher’s Note: The statements, opinions and data contained in all publications are solely those of the individual author(s) and contributor(s) and not of MDPI and/or the editor(s). MDPI and/or the editor(s) disclaim responsibility for any injury to people or property resulting from any ideas, methods, instructions or products referred to in the content. |
© 2025 by the authors. Licensee MDPI, Basel, Switzerland. This article is an open access article distributed under the terms and conditions of the Creative Commons Attribution (CC BY) license (https://creativecommons.org/licenses/by/4.0/).
Share and Cite
Ceriani, R.; Vignali, V.; Chiola, D.; Pazzini, M.; Pettinari, M.; Lantieri, C. Exploring the Effectiveness of Road Maintenance Interventions on IRI Value Using Crowdsourced Connected Vehicle Data. Sensors 2025, 25, 3091. https://doi.org/10.3390/s25103091
Ceriani R, Vignali V, Chiola D, Pazzini M, Pettinari M, Lantieri C. Exploring the Effectiveness of Road Maintenance Interventions on IRI Value Using Crowdsourced Connected Vehicle Data. Sensors. 2025; 25(10):3091. https://doi.org/10.3390/s25103091
Chicago/Turabian StyleCeriani, Riccardo, Valeria Vignali, Davide Chiola, Margherita Pazzini, Matteo Pettinari, and Claudio Lantieri. 2025. "Exploring the Effectiveness of Road Maintenance Interventions on IRI Value Using Crowdsourced Connected Vehicle Data" Sensors 25, no. 10: 3091. https://doi.org/10.3390/s25103091
APA StyleCeriani, R., Vignali, V., Chiola, D., Pazzini, M., Pettinari, M., & Lantieri, C. (2025). Exploring the Effectiveness of Road Maintenance Interventions on IRI Value Using Crowdsourced Connected Vehicle Data. Sensors, 25(10), 3091. https://doi.org/10.3390/s25103091