


A Preliminary Study for Ultraviolet Optical Methyl Salicylate Monitoring in Agriculture

 ,
,  , ,
, ,  and
and
Abstract
1. Introduction
2. Materials and Methods
2.1. Reagents
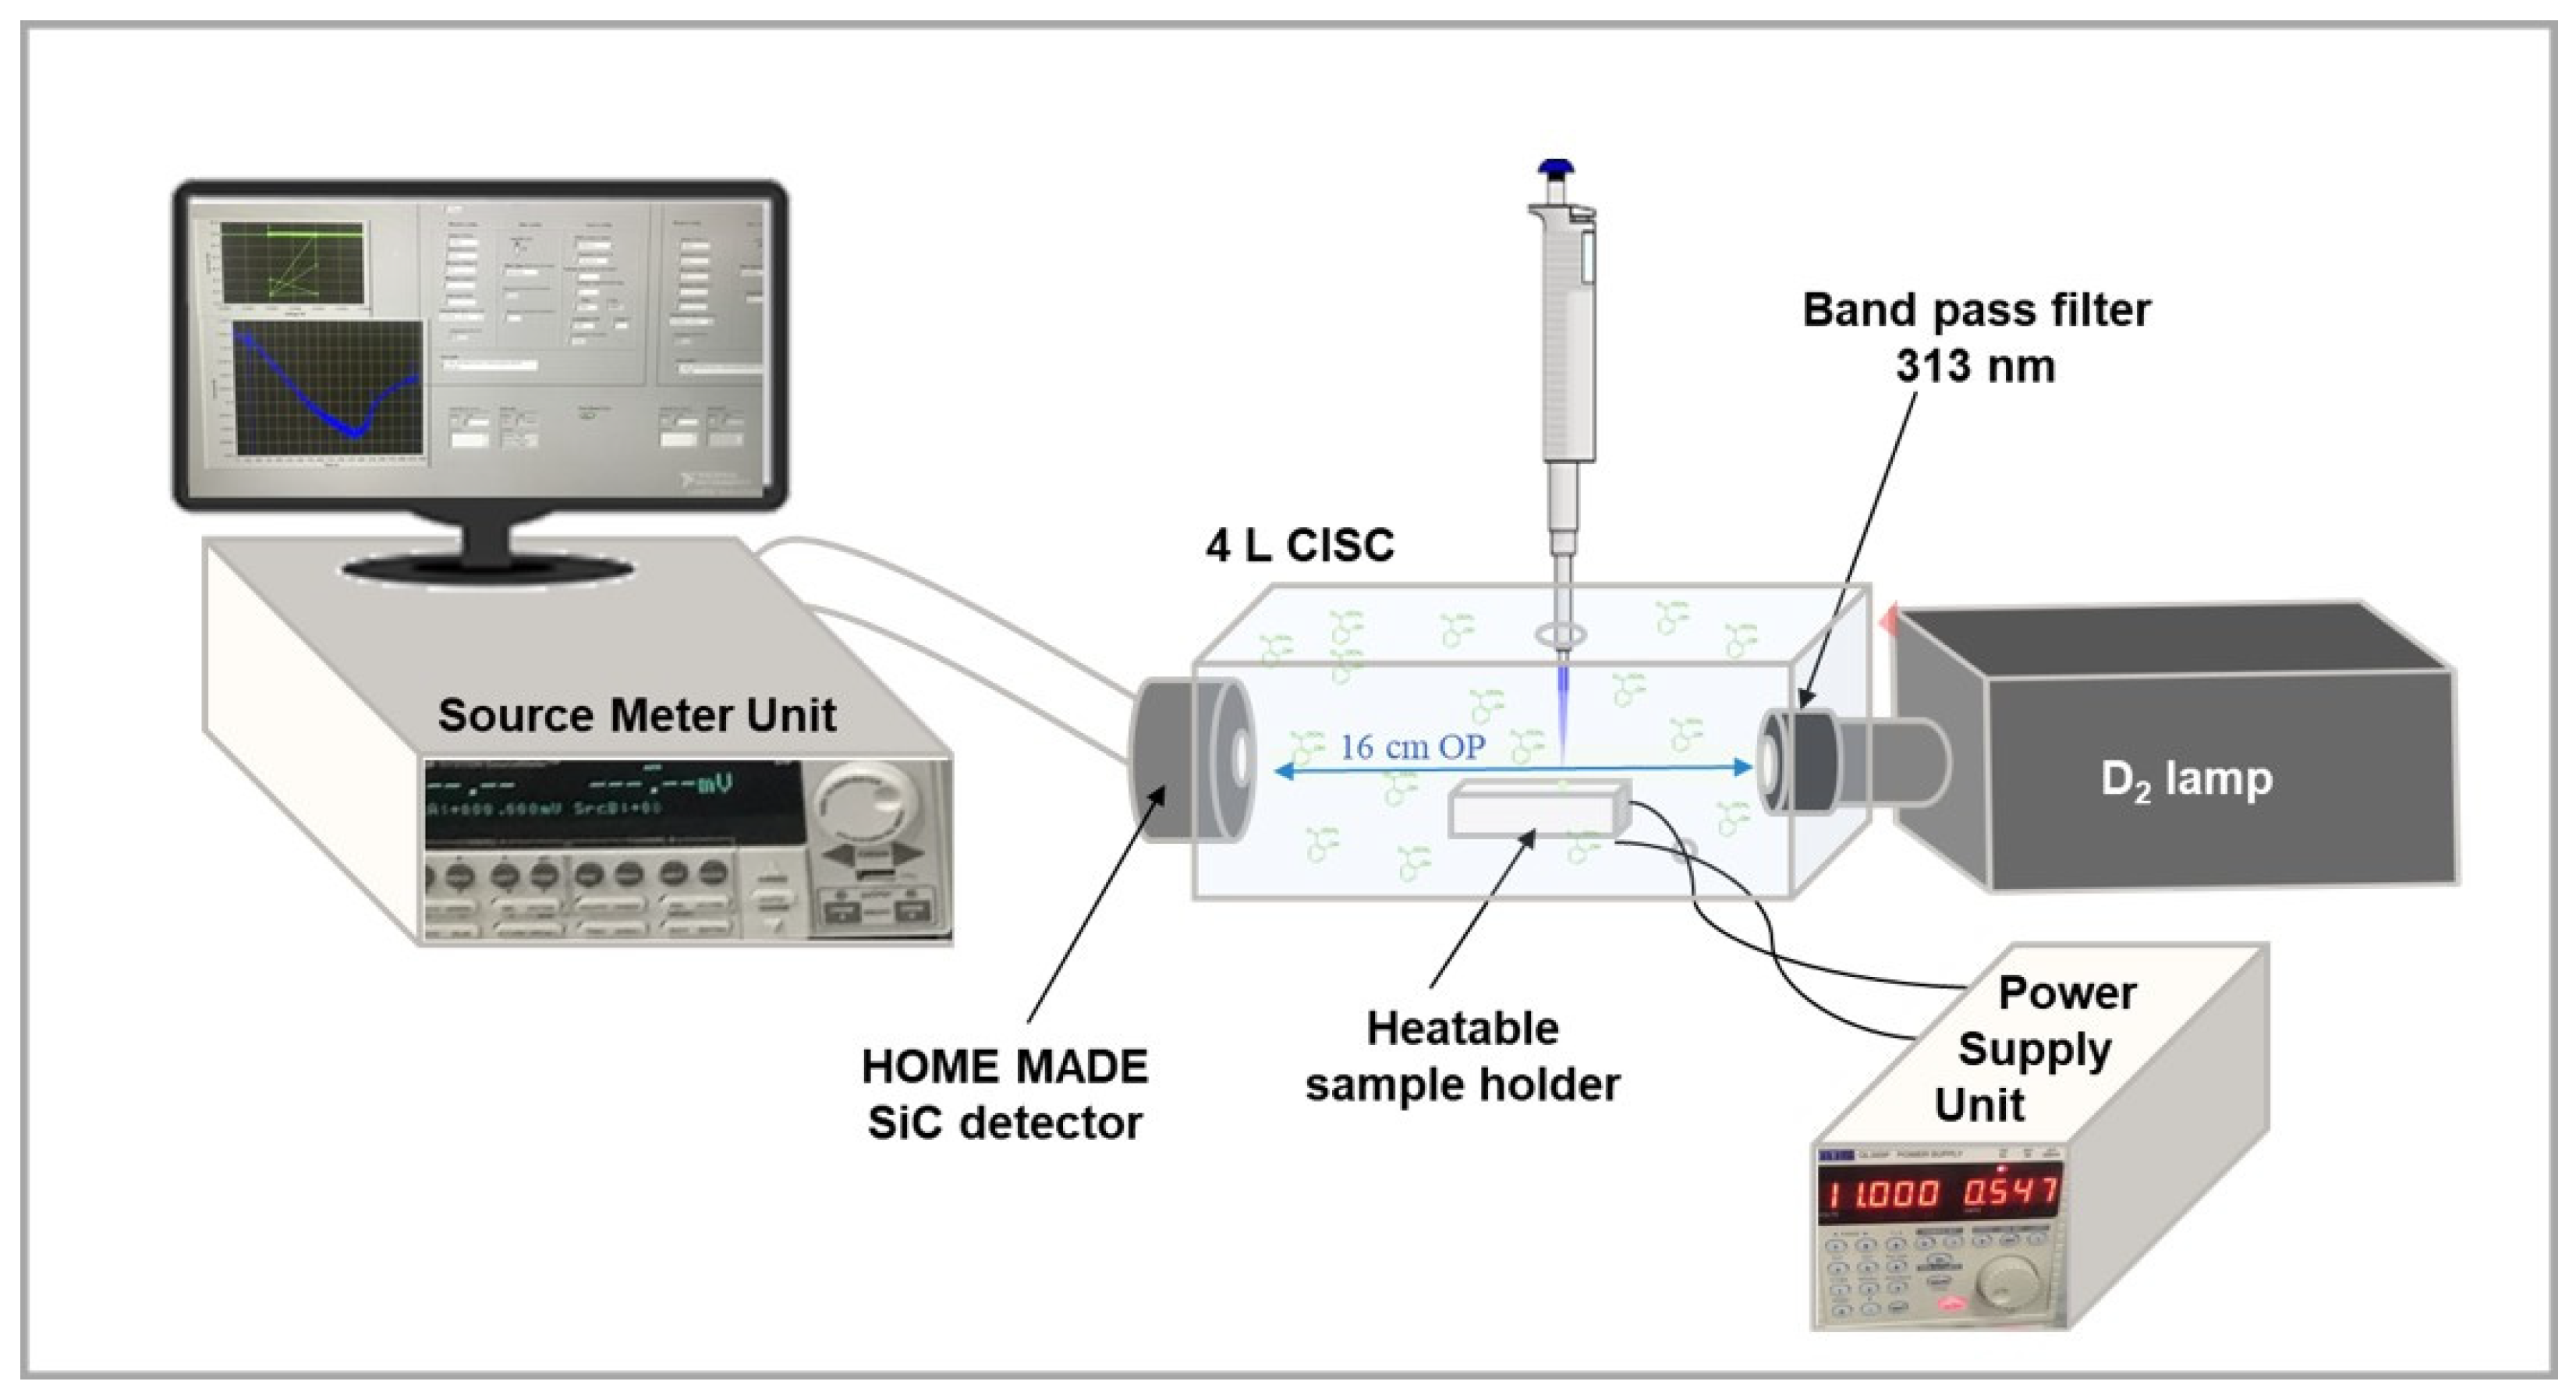
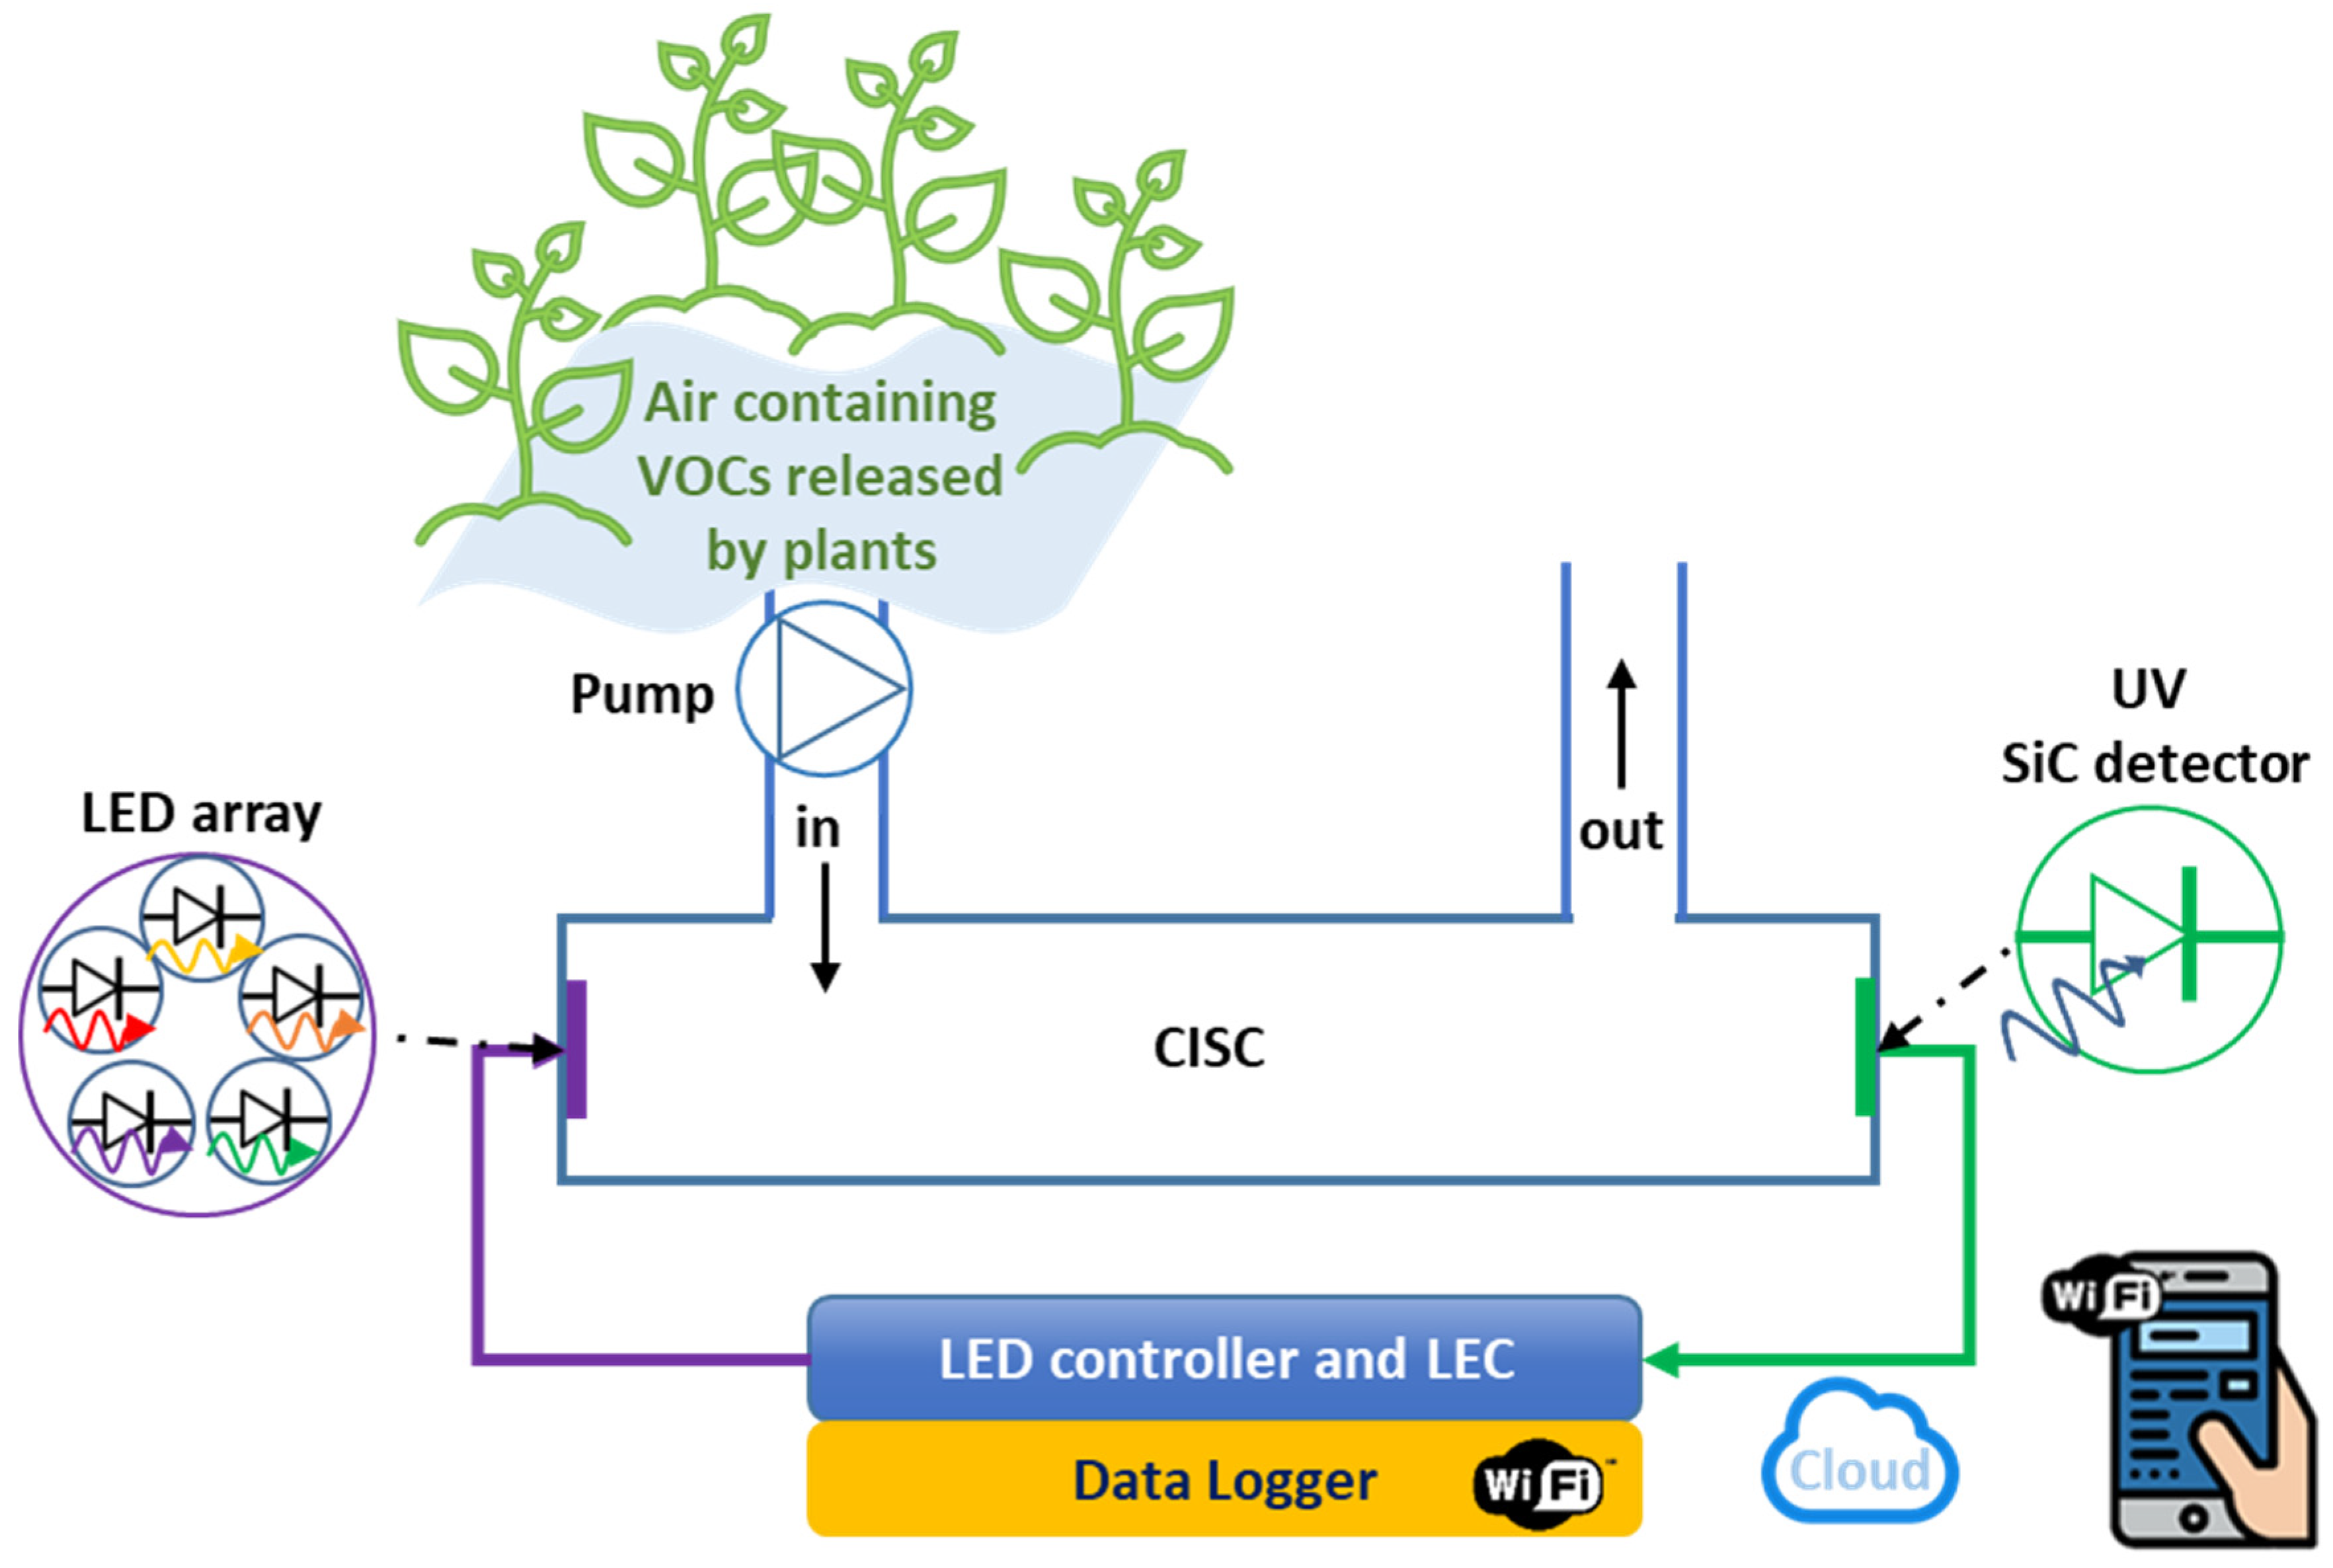
2.2. Experimental Lab System Setup
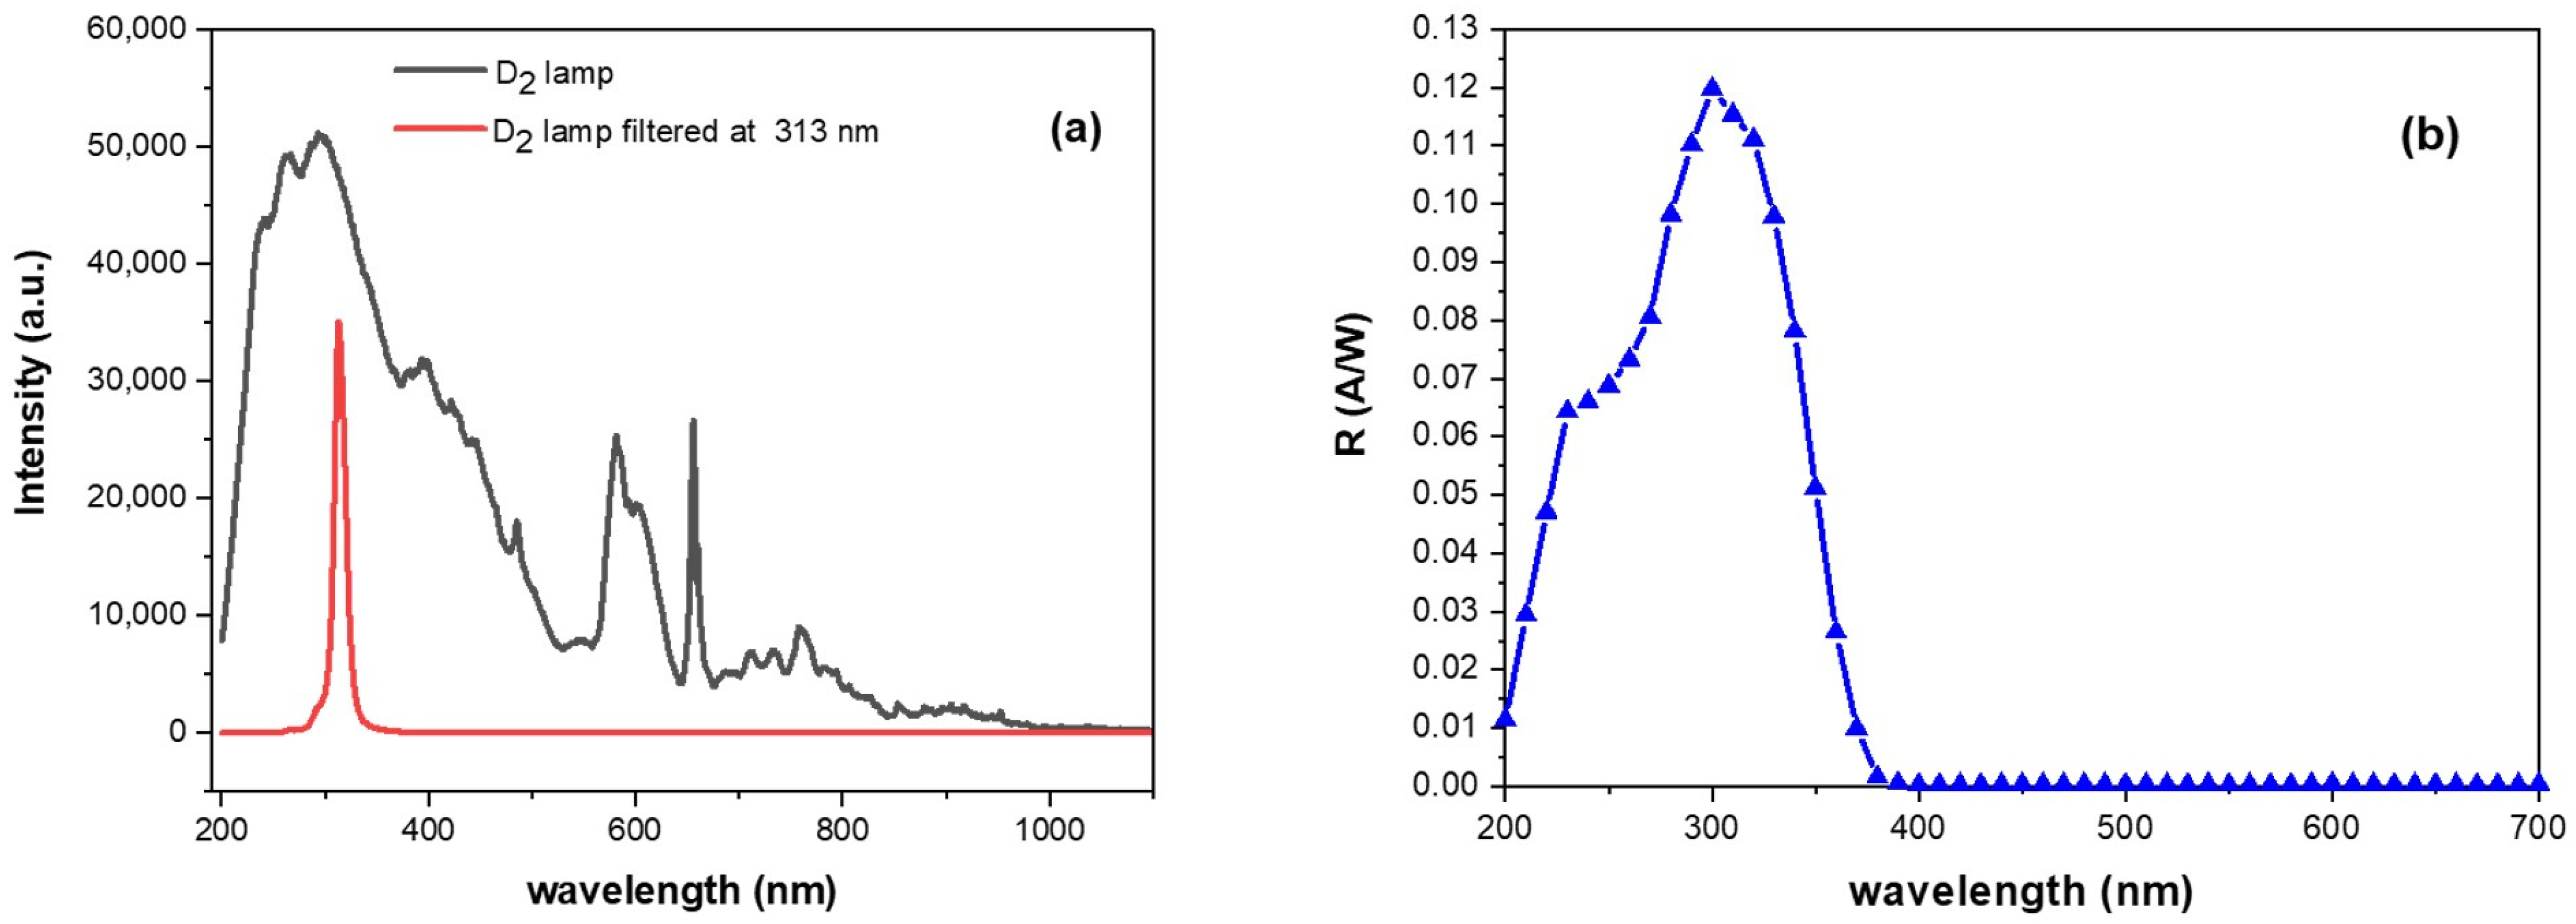
2.3. Adopted Source and SiC Detector: Electro-Optical Parameters and Properties
2.4. Procedure and Photo-Current Measurement Conditions
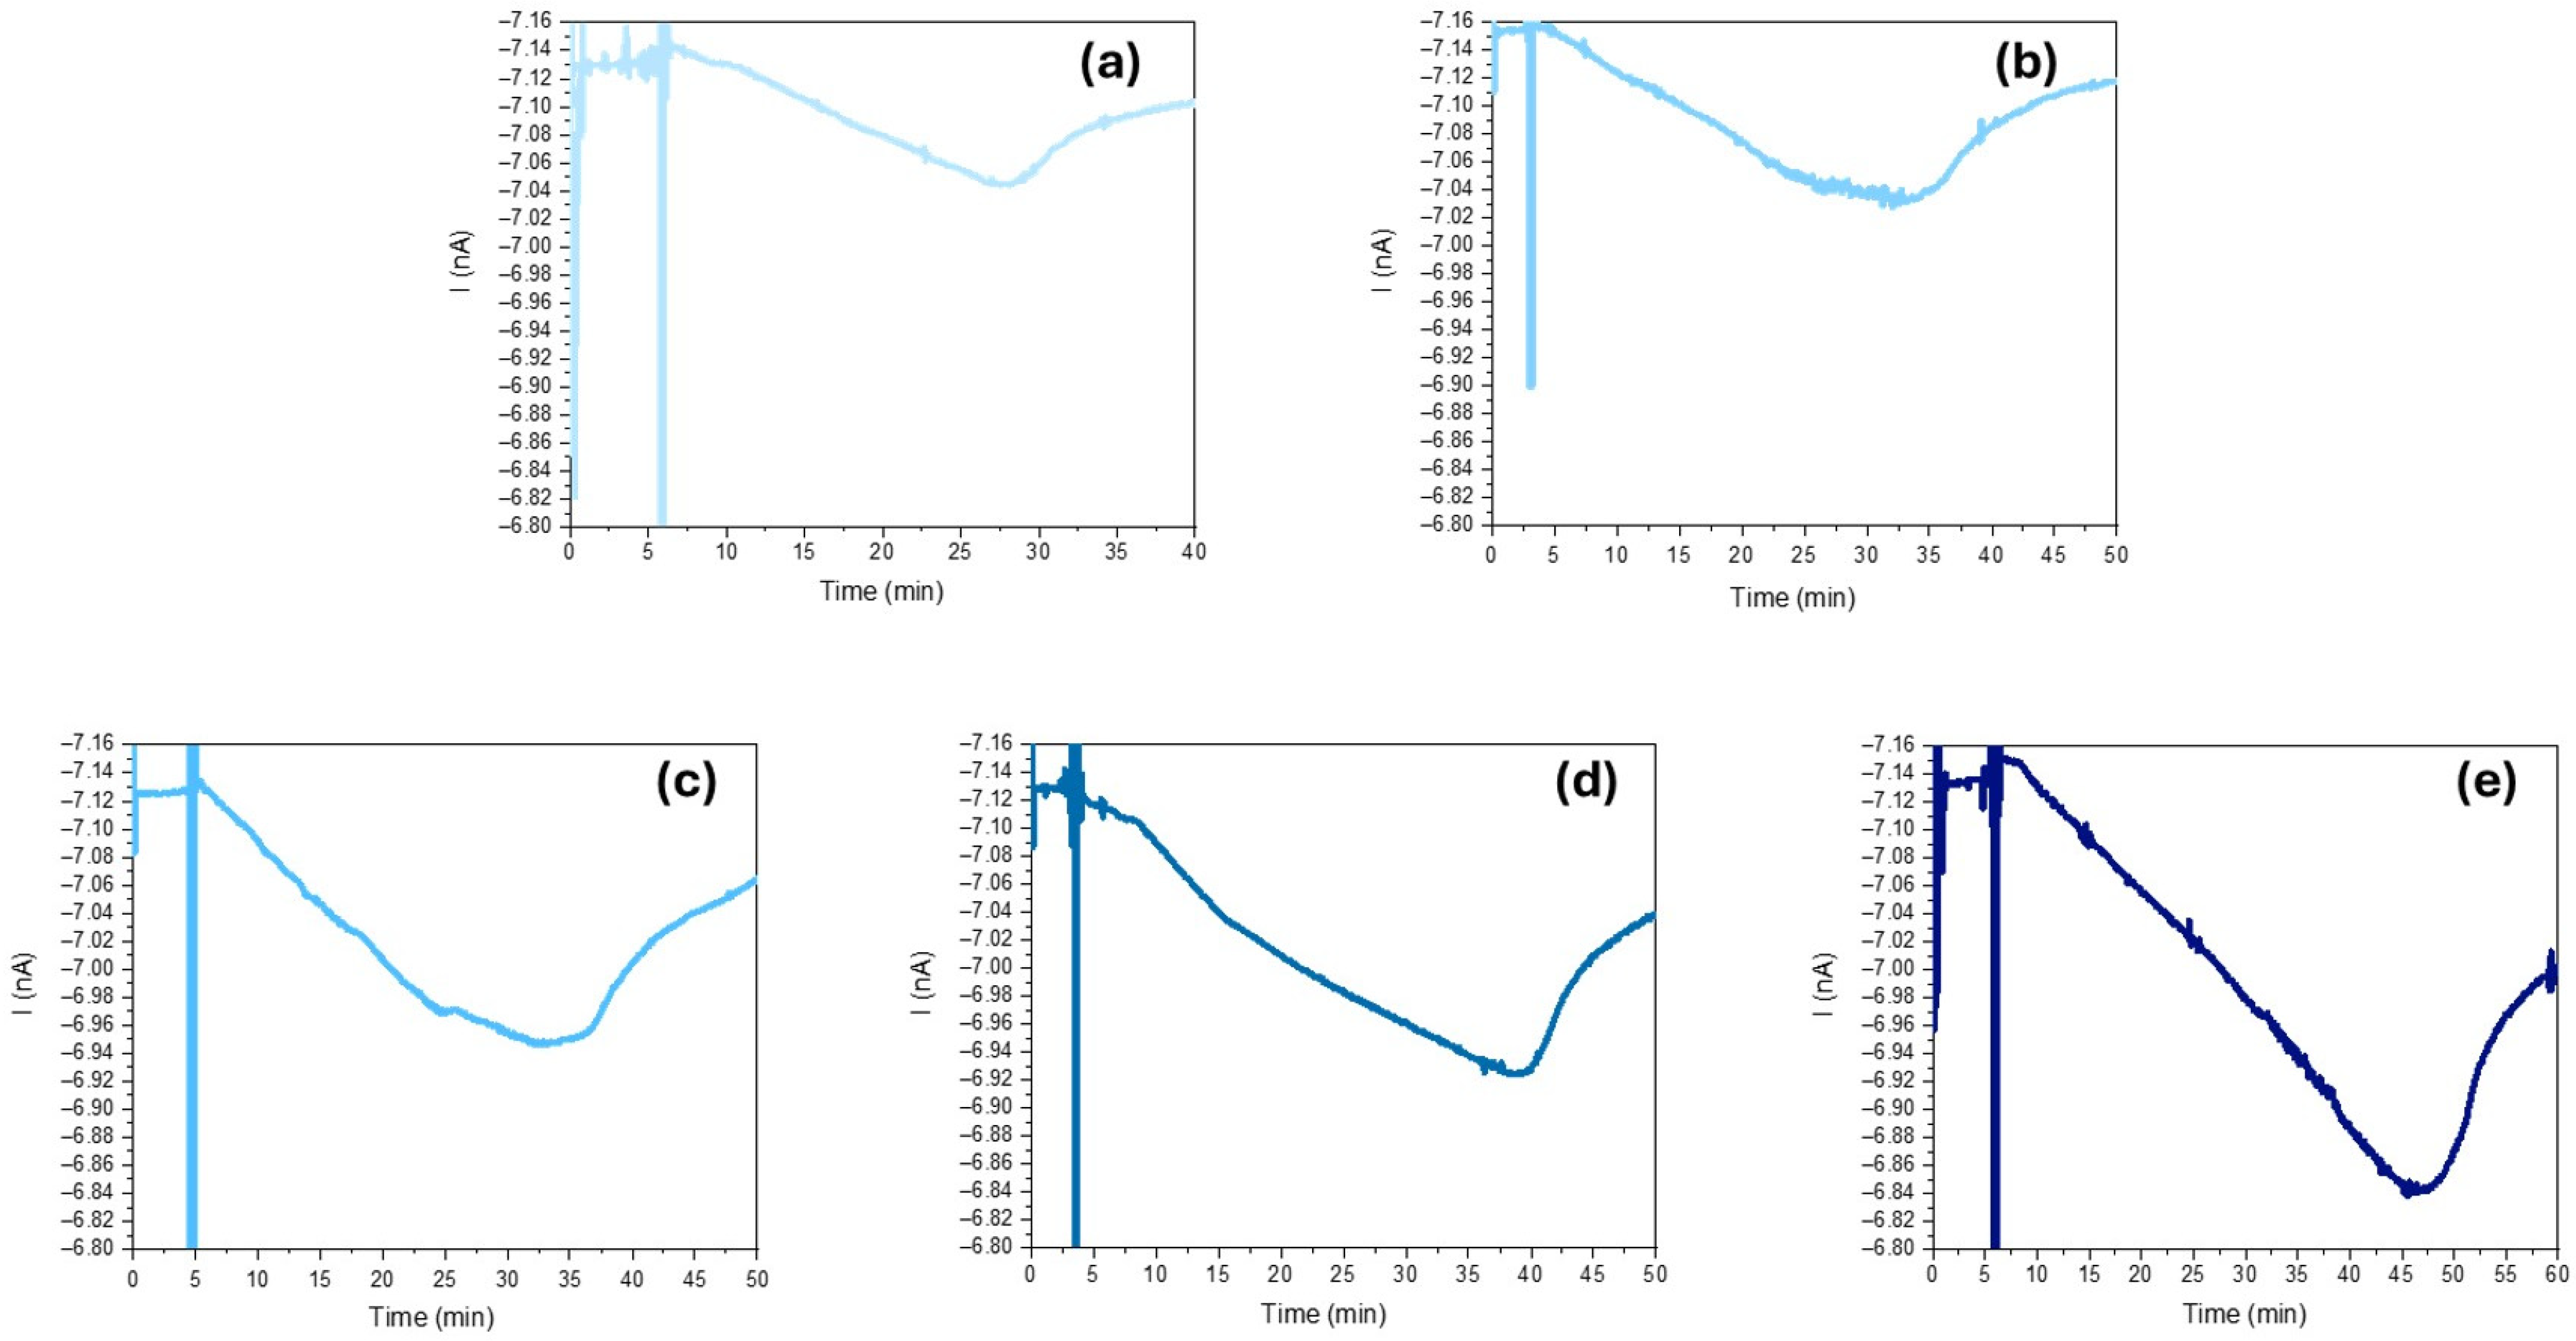
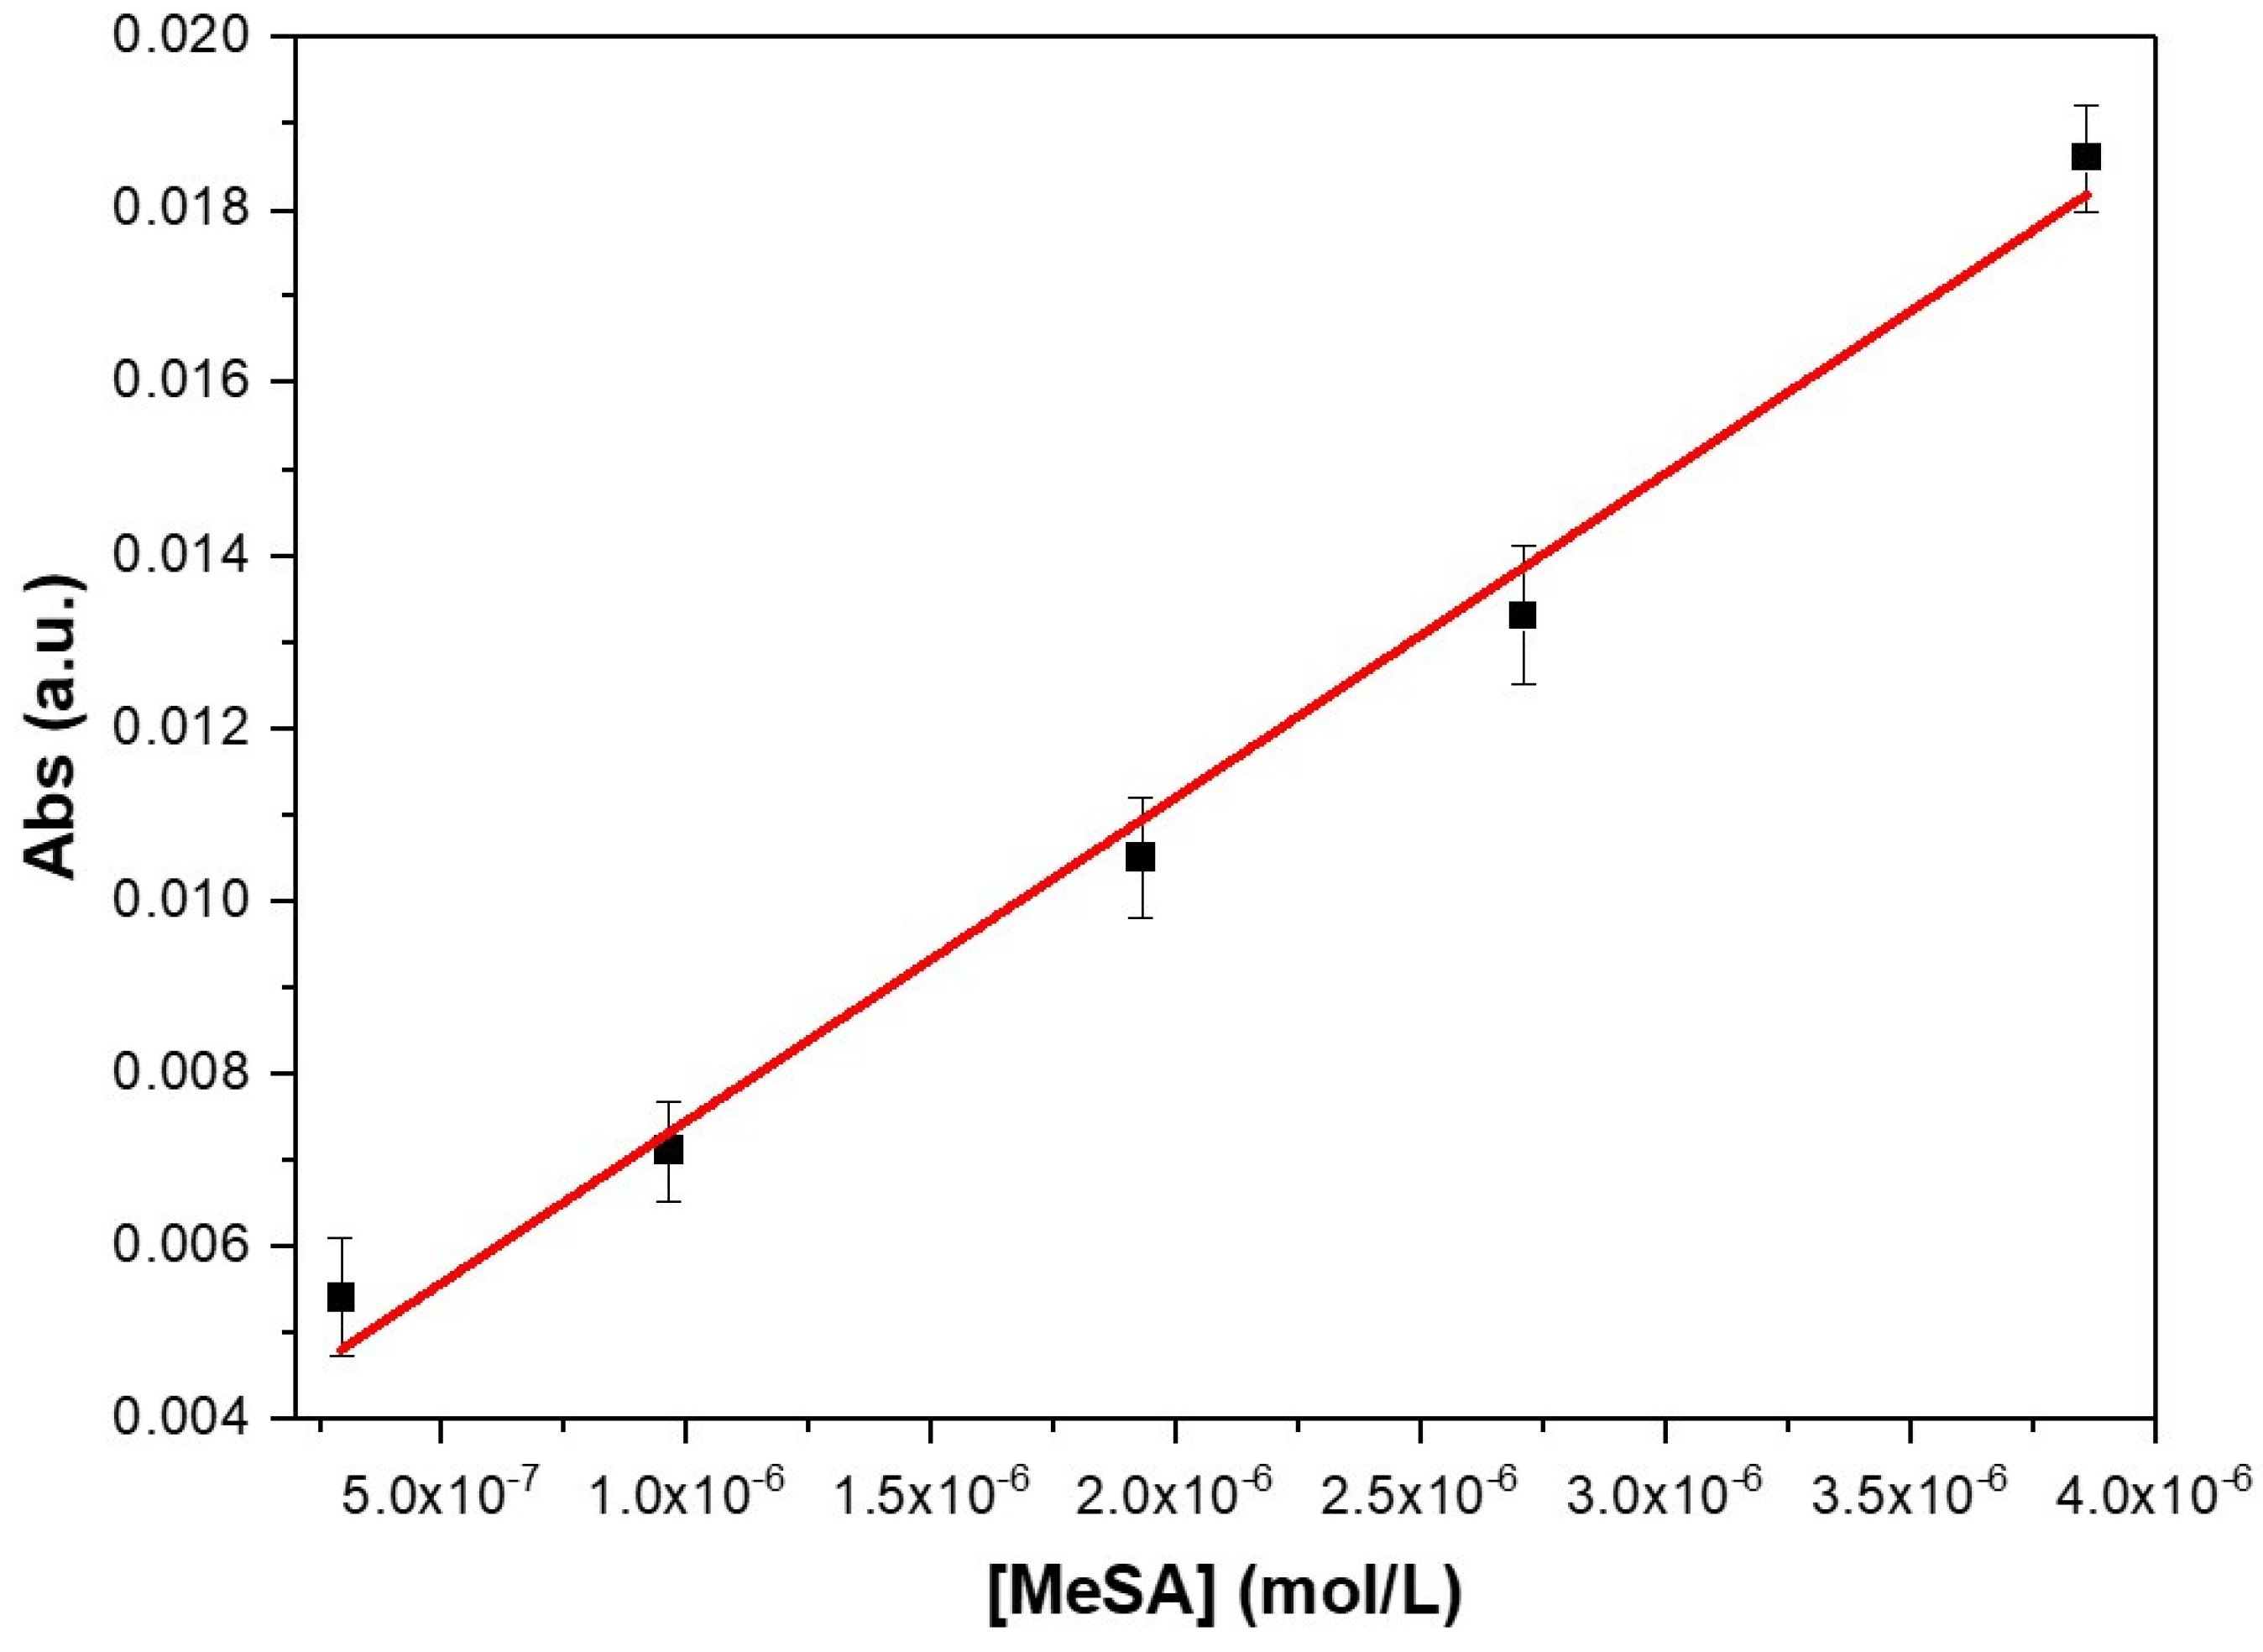
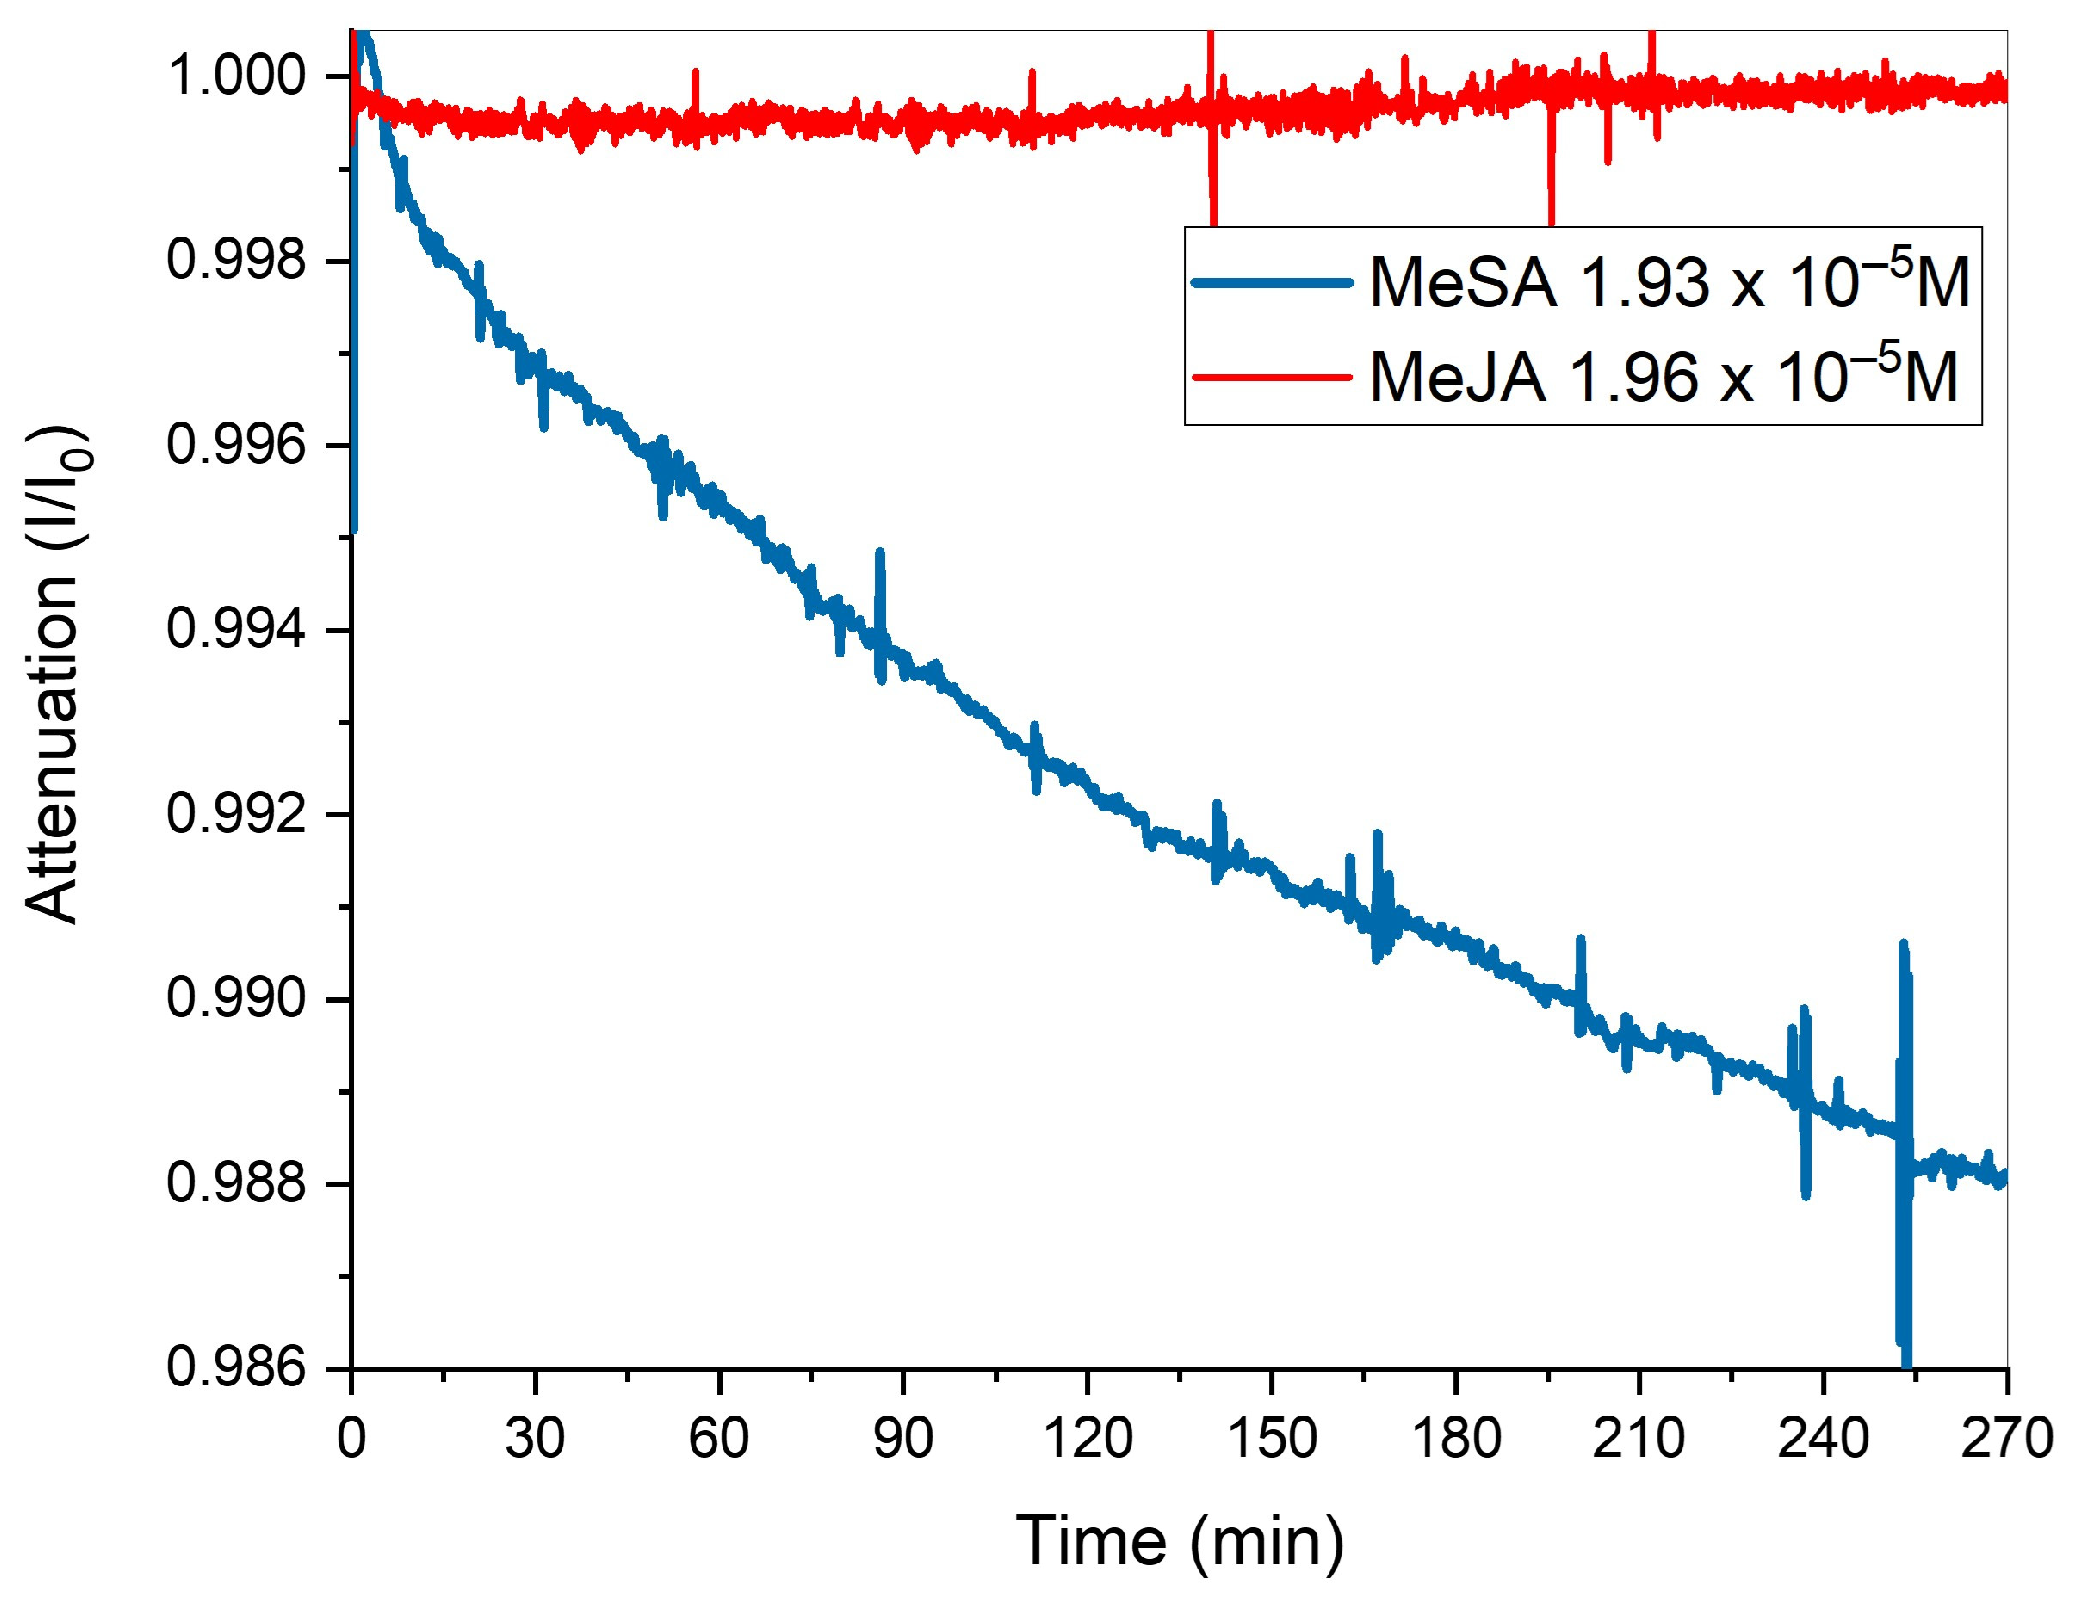
3. Results and Discussion
4. Conclusions
Author Contributions
Funding
Institutional Review Board Statement
Informed Consent Statement
Data Availability Statement
Conflicts of Interest
Abbreviations
| A | Optical Signal Attenuation (I/I0) |
| Abs | Absorbance |
| CISC | Chemically Interactive System Chamber |
| FWHM | Full Width at Half Maximum |
| GC | Gas Chromatography |
| GCE | Glassy Carbon Electrode |
| GLV | Green Leaf Volatile |
| HPLC | High-Performance Liquid Chromatography |
| I | Minimum Value light-Photocurrent Intensity |
| I0 | Full-Light Photocurrent Intensity |
| LCR | Inductor Capacitor Resistor |
| LED | Light Emitting Diode |
| MeJA | Methyl Jasmonate |
| MeSA | Methyl Salicylate |
| MS | Mass Spectrometry |
| MW | Molecular Weight |
| MWCNTs | Multiwalled Carbon Nanotubes |
| NPs | Nanoparticles |
| QCM | Quartz Crystal Microbalance |
| rGO-PDADMAC | Reduced Graphene Oxide/Poly (Diallyldimethyl Ammonium Chloride) |
| RT | Room Temperature |
| SAR | Systemic Acquired Resistance |
| SMU | Source Meter Unit |
| SPME | Solid-Phase Microextraction |
| TMW | Tobacco Mosaic Virus |
| UV | Ultraviolet |
| UV-Vis | Ultraviolet–Visible |
| VOC | Volatile Organic Compound |
| ΔI | Current Variation (I0 − I) |
References
- Dicke, M.; Baldwin, I.T. The evolutionary context for herbivore-induced plant volatiles: Beyond the ‘cry for help’. Trends Plant Sci. 2010, 15, 167–175. [Google Scholar] [CrossRef]
- Dicke, M.; van Loon, J.J.A.; Soler, R. Chemical complexity of volatiles from plants induced by multiple attack. Nat. Chem. Biol. 2009, 5, 317–324. [Google Scholar] [CrossRef] [PubMed]
- Loreto, F.; Schnitzler, J.P. Abiotic stresses and induced BVOCs. Trends Plant Sci. 2010, 15, 154–166. [Google Scholar] [CrossRef]
- Loreto, F.; Barta, C.; Brilli, F.; Nogues, I. On the induction of volatile organic compound emissions by plants as consequence of wounding or fluctuations of light and temperature. Plant Cell Environ. 2006, 29, 1820–1828. [Google Scholar] [CrossRef]
- Baldwin, I.T.; Halitschke, R.; Paschold, A.; Von Dahl, C.C.; Preston, C.A. Volatile Signaling in Plant-Plant Interactions: Talking Trees in the Genomics Era. Science 2006, 311, 812–815. [Google Scholar] [CrossRef]
- Gondor, O.K.; Pál, M.; Janda, T.; Szalai, G. The role of methyl salicylate in plant growth under stress conditions. J. Plant Physiol. 2022, 277, 153809. [Google Scholar] [CrossRef] [PubMed]
- Shulaev, V.; Silverman, P.; Raskin, I. Airborne signalling by methyl salicylate in plant pathogen resistance. Nature 1997, 385, 718–721. [Google Scholar] [CrossRef]
- Deng, C.; Zhang, X.; Zhu, W.; Qian, J. Gas chromatography-mass spectrometry with solid-phase microextraction method for determination of methyl salicylate and other volatile compounds in leaves of Lycopersicon esculentum. Anal. Bioanal. Chem. 2004, 378, 518–522. [Google Scholar] [CrossRef]
- Deng, C.; Zhang, X.; Zhu, W.; Qian, J. Investigation of Tomato Plant Defence Response to Tobacco Mosaic Virus by Determination of Methyl Salicylate with SPME-Capillary GC-MS. Chromatographia 2004, 59, 263–268. [Google Scholar] [CrossRef]
- Singewar, K.; Fladung, M.; Robischon, M. Methyl salicylate as a signaling compound that contributes to forest ecosystem stability. Trees 2021, 35, 1755–1769. [Google Scholar] [CrossRef]
- Ashrafi, A.M.; Bytešníková, Z.; Cané, C.; Richtera, L.; Vallejos, S. New trends in methyl salicylate sensing and their implications in agriculture. Biosens. Bioelectron. 2023, 223, 115008. [Google Scholar] [CrossRef] [PubMed]
- Tholl, D.; Hossain, O.; Weinhold, A.; Rose, U.S.R.; Wei, Q. Trends and applications in plant volatile sampling and analysis. Plant J. 2021, 106, 314–325. [Google Scholar] [CrossRef] [PubMed]
- Barreira, L.M.F.; Parshintsev, J.; Karkkainen, N.; Hartonen, K.; Jussila, M.; Kajos, M.; Kulmala, M.; Riekkola, M.-L. Field measurements of biogenic volatile organic compounds in the atmosphere by dynamic solid-phase microextraction and portable gas chromatography-mass spectrometry. Atmos. Environ. 2015, 115, 214–222. [Google Scholar] [CrossRef]
- Cheung, W.H.K.; Pasamontes, A.; Peirano, D.J.; Zhao, W.X.; Grafton-Cardwell, E.E.; Kapaun, T.; Yokomi, R.K.; Simmons, J.; Doll, M.; Fiehn, O.; et al. Volatile organic compound (VOC) profiling of Citrus tristeza virus infection in sweet orange citrus varietals using thermal desorption gas chromatography time of flight mass spectrometry (TD-GC/TOF-MS). Metabolomics 2015, 11, 1514–1525. [Google Scholar] [CrossRef]
- Cai, X.-M.; Xu, X.-X.; Bian, L.; Luo, Z.-X.; Chen, Z.-M. Measurement of volatile plant compounds in field ambient air by thermal desorption-gas chromatography-mass spectrometry. Anal. Bioanal. Chem. 2015, 407, 9105–9114. [Google Scholar] [CrossRef]
- Park, J.; Thomasson, J.A.; Gale, C.C.; Sword, G.A.; Lee, K.-M.; Herrman, T.J.; Suh, C.P.-C. Adsorbent-SERS Technique for Determination of Plant VOCs from Live Cotton Plants and Dried Teas. ACS Omega 2020, 5, 2779–2790. [Google Scholar] [CrossRef]
- Shahariz, M.; Adzib, M.; Ilham, Z. Simultaneous analytical determination of methyl salicylate and thymol in selected Malaysian traditional medicines. AIMS Med. Sci. 2020, 7, 43–56. [Google Scholar] [CrossRef]
- Parker, D.; Martinez, C.; Stanley, C.; Simmons, J.; McIntyre, I.M. The Analysis of Methyl Salicylate and Salicylic Acid from Chinese Herbal Medicine Ingestion Get access Arrow. J. Anal. Toxicol. 2004, 28, 214–216. [Google Scholar] [CrossRef]
- Park, J.; Thomasson, J.A.; Lee, K.-M.; Suh, C.P.-C.; Perezc, J.L.; Herrmanb, T.J. VOCs determination by adsorbent-Raman system in food and botanicals. Anal. Methods 2020, 12, 1595–1605. [Google Scholar] [CrossRef]
- Barreira, L.M.F.; Duporté, G.; Rönkkö, T.; Parshintsev, J.; Hartonen, K.; Hyrsky, L.; Heikkinen, E.; Jussila, M.; Kulmala, M.; Riekkola, M.L. Field measurements of biogenic volatile organic compounds in the atmosphere using solid-phase microextraction Arrow. Atmos. Meas. Tech. 2018, 11, 881–893. [Google Scholar] [CrossRef]
- Zhu, F.; Xu, J.; Ke, Y.; Huang, S.; Zeng, F.; Luan, T.; Ouyang, G. Applications of in vivo and in vitro solid-phase microextraction techniques in plant analysis: A review. Anal. Chim. Acta 2013, 10, 1–14. [Google Scholar] [CrossRef] [PubMed]
- Fang, Y.; Bullock, H.; Lee, S.A.; Sekar, N.; Eiteman, M.A.; Whitman, W.B.; Ramasamy, R.P. Detection of methyl salicylate using bi-enzyme electrochemical sensor consisting salicylate hydroxylase and tyrosinase. Biosens. Bioelectron. 2016, 15, 603–610. [Google Scholar] [CrossRef] [PubMed]
- Fang, Y.; Umasankar, Y.; Ramasamy, R.P. A novel bi-enzyme electrochemical biosensor for selective and sensitive determination of methyl salicylate. Biosens. Bioelectron. 2016, 15, 39–45. [Google Scholar] [CrossRef] [PubMed]
- Fang, Y.; Zhou, Y.; Ramasamy, R.P. Communication-Direct Detection of Methyl Salicylate Using Tri-Enzyme Based Electrochemical Sensor. J. Electrochem. Soc. 2018, 165, B358–B360. [Google Scholar] [CrossRef]
- Umasankara, Y.; Ramasamy, R.P. Highly sensitive electrochemical detection of methyl salicylate using electroactive gold nanoparticles. Analyst 2013, 138, 6623–6631. [Google Scholar] [CrossRef]
- Kanagasabapathy, M.; Umasankar, Y.; Bapu, G.N.K.R. Numerical modeling on anodic chronopotentiometric transients for the electrochemical sensing of methyl salicylate. Anal. Bioanal. Electrochem. 2014, 6, 745–762. [Google Scholar]
- Kanagasabapathy, M.; Bapu, G.N.K.R.; Umasankar, Y.; Gnanamuthu, R.M. Methyl salicylate detection via electrochemical transients using nano spinel Co3O4 films. J. Electroanal. Chem. 2015, 754, 57–64. [Google Scholar] [CrossRef]
- Sharma, P.; Tudu, B.; Bhuyan, L.P.; Tamuly, P.; Bhattacharyya, N.; Bandyopadhyay, R. Detection of methyl salicylate in black tea using a quartz crystal microbalance sensor. IEEE Sens. J. 2016, 16, 5160–5166. [Google Scholar] [CrossRef]
- Adams, J.D.; Emam, S.; Sun, N.; Ma, Y.; Wang, Q.; Shashidhar, R.; Sun, N.-X. A Molecularly Imprinted Polymer-Graphene Sensor Antenna Hybrid for Ultra Sensitive Chemical Detection. IEEE Sens. J. 2019, 19, 6571–6577. [Google Scholar] [CrossRef]
- Bhattacharyya, N.; Dutta, D.; Ghosh, S.; Mandal, S.; Narjinary, M.; Sen, A.; Bandyopadhyay, R. SnO2 based tea aroma sensors for Electronic Nose. In Proceedings of the 14th International Meeting on Chemical Sensors-IMCS 2012, Nuremberg, Germany, 20–23 May 2012; pp. 1289–1292. [Google Scholar]
- Kakoty, P.; Bhuyan, M. Study of Ag Doped SnO2 Film and Its Response Towards Aromatic Compounds Present in Tea. In Proceedings of the IEEE Electron Device Kolkata Conference (EDKCON), Kolkata, India, 24–25 November 2018; pp. 1–5. [Google Scholar]
- Li, B.; Zhou, Q.; Peng, S.; Liao, Y. Recent Advances of SnO2-Based Sensors for Detecting Volatile Organic Compounds. Front. Chem. 2020, 8, 321. [Google Scholar] [CrossRef]
- Jung, H.; Park, J. Real-time detection of methyl salicylate vapor using reduced graphene oxide and poly (diallyldimethylammonium chloride) complex. Chem. Phys. Lett. 2022, 793, 139446. [Google Scholar] [CrossRef]
- Mlsna, T.E.; Cemalovic, S.; Warburton, M.; Hobson, S.T.; Mlsna, D.A.; Patel, S.V. Chemicapacitive microsensors for chemical warfare agent and toxic industrial chemical detection. Aims Scope. Sens. Actuators B Chem. 2006, 116, 192–201. [Google Scholar] [CrossRef]
- Nagraj, N.; Slocik, J.M.; Phillips, D.M.; Kelley-Loughnane, N.; Naik, R.R.; Potyrailo, R.A. Selective sensing of vapors of similar dielectric constants using peptide-capped gold nanoparticles on individual multivariable transducers. Analyst 2013, 138, 4334–4339. [Google Scholar] [CrossRef]
- Zhu, C.; Li, X.; Wang, X.; Su, H.; Ma, C.; Guo, X.; Xie, C.; Zeng, D. Ultrasensitive methyl salicylate gas sensing determined by Pd-doped SnO2. Front. Mater. Sci. 2022, 16, 220625. [Google Scholar] [CrossRef]
- Yang, B.; To, D.T.H.; Sobolak, D.; Mendoza, E.R.; Myung, N.V. High performance methyl salicylate gas sensor based on noble metal (Au, Pt) decorated WO3 nanofibers. Sens. Actuators B Chem. 2024, 413, 135741. [Google Scholar] [CrossRef]
- Li, Y.; Li, Q.; Wang, Y.; Oh, J.; Jin, S.; Park, Y.; Zhou, T.; Zhao, B.; Ruan, W.; Jung, Y.M. A reagent-assisted method in SERS detection of methyl salicylate. Spectrochim. Acta Part A Mol. Biomol. Spectrosc. 2018, 15, 172–175. [Google Scholar] [CrossRef] [PubMed]
- Park, J.; Thomasson, J.A.; Fernando, S.; Lee, K.-M.; Herrman, T.J. Complexes Formed by Hydrophobic Interaction between Ag-Nanospheres and Adsorbents for the Detection of Methyl Salicylate VOC. Nanomaterials 2019, 9, 1621. [Google Scholar] [CrossRef]
- Zhang, X.; Liu, Z.; Zhong, X.; Liu, J.; Xiao, X.; Jiang, C. Rapid and sensitive detection of 4-ethylbenzaldehyde by a plasmonic nose. J. Phys. D: Appl. Phys. 2021, 54, 255306. [Google Scholar]
- Li, Z.; Paul, R.; Tis, T.B.; Saville, A.C.; Hansel, J.C.; Yu, T.; Ristaino, J.B.; Wei, Q. Non-invasive plant disease diagnostics enabled by smartphone-based fingerprinting of leaf volatiles. Nat. Plants 2019, 5, 856–866. [Google Scholar] [CrossRef]
- Pavey, K.D.; FitzGerald, N.J.; Nielsen, D.J. Making light work: A miniaturised, real-time optical sensor network for the detection of CWA simulant methyl salicylate. Anal. Methods 2012, 4, 2224. [Google Scholar] [CrossRef]
- Rosser, K.; Pavey, K.; FitzGerald, N.; Fatiaki, A.; Neumann, D.; Carr, D.; Hanlon, B.; Chahl, J. Autonomous Chemical Vapour Detection by Micro UAV. Remote Sens. 2015, 7, 16865–16882. [Google Scholar] [CrossRef]
- Shi, J.; Jiang, Y.; Duan, Z.; Li, J.; Yuan, Z.; Tai, H. Designing an optical gas chamber with stepped structure for non-dispersive infrared methane gas sensor. Sens. Actuators A Phys. 2024, 367, 1–5. [Google Scholar] [CrossRef]
- Khan, S.; Newport, D.; Le Calvé, S. Gas Detection Using Portable Deep-UV Absorption Spectrophotometry: A Review. Sensors 2019, 19, 5210. [Google Scholar] [CrossRef]
- Mazzillo, M.; Condorelli, G.; Castagna, M.E.; Catania, G.; Sciuto, A.; Roccaforte, F.; Raineri, V. Highly Efficient Low Reverse Biased 4H-SiC Schottky Photodiodes for UV-Light Detection. IEEE Photonics Technol. Lett. 2009, 21, 1782–1784. [Google Scholar] [CrossRef]
- Sciuto, A.; Meli, A.; Calcagno, L.; Di Franco, S.; Mazzillo, M.; Franzò, G.; Albergo, S.; Tricomi, A.; Longo, D.; Giudice, G.; et al. Large-Area SiC-UV Photodiode for Spectroscopy Portable System. IEEE Sens. J. 2019, 19, 2931–2936. [Google Scholar] [CrossRef]
- Giudice, G.; Sciuto, A.; Meli, A.; D’Arrigo, G.; Longo, D. SO2 Monitoring With Solid State-Based UV Spectroscopy Compact Apparatus. IEEE Sens. J. 2019, 19, 7089–7094. [Google Scholar] [CrossRef]
- Longo, D.; Giudice, G.; D’Arrigo, G.; Sciuto, A. Portable Spectroscopy System for Environmental Monitoring: An SO2 Case Study. IEEE Sens. J. 2022, 22, 11135–11143. [Google Scholar] [CrossRef]
- Sciuto, A.; Roccaforte, F.; Di Franco, S.; Liotta, S.F.; Raineri, V.; Bonanno, G. High efficiency. Superlattices Microstruct. 2007, 41, 29–35. [Google Scholar] [CrossRef]
- Roccaforte, F.; La Via, F.; Raineri, V. Ohmic Contact to SiC. Int. J. High Speed Electron. Syst. 2005, 15, 781–820. [Google Scholar] [CrossRef]
- Malthankar, A.S.; Game, M.D. Development of UV Spectrophotometric Method for the Estimation of Methyl Salicylate from Trandermal Patch. IJCRT 2022, 10, a140–a148. [Google Scholar]
- Lopez-Delgado, R.; Lazare, S. Fluorescence Properties of Methyl Salicylate in Vapor, Liquid, and Solution. J. Phys. Chem. A 1980, 85, 763–768. [Google Scholar] [CrossRef]
- Tevault, D.E.; Buettner, L.C.; Crouse, K.L. Vapor Pressure of Methyl Salicylate and n-Hexadecane. 2014. Available online: https://apps.dtic.mil/sti/pdfs/ADA592343.pdf (accessed on 1 March 2025).
- Sarang, K.; Rudziński, K.J.R. Szmigielski Green Leaf Volatiles in the Atmosphere—Properties, Transformation, and Significance. Atmosphere 2021, 12, 1655. [Google Scholar] [CrossRef]
- Epping, R.; Koch, M. On-Site Detection of Volatile Organic Compounds (VOCs). Molecules. 2023, 28, 1598. [Google Scholar] [CrossRef]
- Das, T.; Mohar, M. Development of a smartphone-based real time cost-effective VOC sensor. Heliyon 2020, 6, e05167. [Google Scholar] [CrossRef] [PubMed]
- Ruzsanyi, V.; Wiesenhofer, H.; Ager, C.; Herbig, J.; Aumayr, G.; Fischer, M.; Renzler, M.; Ussmueller, T.; Lindner, K.; Mayhew, C.A. A portable sensor system for the detection of human volatile compounds against transnational crime. Sens. Actuators B Chem. 2021, 328, 129036. [Google Scholar] [CrossRef]
- Binson, V.A.; Akbar, R.; Thankachan, N.; Thomas, S. Design and construction of a portable e-nose system for human exhaled breath VOC analysis. Mater. Today Proc. 2022, 58, 422–427. [Google Scholar]
- Zhang, B.; Rahman, M.A.; Liu, J.; Huang, J.; Yang, Q. Real-time detection and analysis of foodborne pathogens via machine learning based fiber-optic Raman sensor. Measurement 2023, 217, 113121. [Google Scholar] [CrossRef]


| Spotted Volume (µL) | Mass (mg) | Concentration (mol/L) | Concentration (ppb) | |
|---|---|---|---|---|
| First Measurements Series at 72 °C | 0.25 | 0.29 | 2.94 × 10⁻⁷ | 72.5 |
| 0.5 | 0.58 | 9.64 × 10⁻⁷ | 145 | |
| 1 | 1.17 | 1.93 × 10⁻⁶ | 292 | |
| 1.4 | 1.65 | 2.71 × 10⁻⁶ | 412 | |
| 2 | 2.35 | 3.86 × 10⁻⁶ | 584 |
| Molar Concentration | Optical Attenuation | Mean | Std Dev σ |
|---|---|---|---|
| 2.94 × 10⁻⁷ | run 1 0.98796 | 0.98772 | 6.5 × 10⁻⁴ |
| run 2 0.98822 | |||
| run 3 0.98699 | |||
| 9.64 × 10⁻⁷ | run 1 0.98523 | 0.98459 | 6.3 × 10⁻⁴ |
| run 2 0.98398 | |||
| run 3 0.98455 | |||
| 1.93 × 10⁻⁶ | run 1 0.97475 | 0.97544 | 6.7 × 10⁻⁴ |
| run 2 0.97609 | |||
| run 3 0.97547 | |||
| 2.71 × 10⁻⁶ | run 1 0.97103 | 0.97058 | 1.9 × 10⁻³ |
| run 2 0.97226 | |||
| run 3 0.96845 | |||
| 3.86 × 10⁻⁶ | run 1 0.95836 | 0.9577 | 7.0 × 10⁻⁴ |
| run 2 0.95789 | |||
| run 3 0.94998 |
| Molecule | Spotted Volume (µL) | Concentration (mol/L) |
|---|---|---|
MeSA | 10 | 1.93 × 10⁻⁵ |
MeJA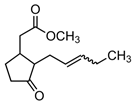 | 18 | 1.96 × 10⁻⁵ |
Disclaimer/Publisher’s Note: The statements, opinions and data contained in all publications are solely those of the individual author(s) and contributor(s) and not of MDPI and/or the editor(s). MDPI and/or the editor(s) disclaim responsibility for any injury to people or property resulting from any ideas, methods, instructions or products referred to in the content. |
© 2025 by the authors. Licensee MDPI, Basel, Switzerland. This article is an open access article distributed under the terms and conditions of the Creative Commons Attribution (CC BY) license (https://creativecommons.org/licenses/by/4.0/).
Share and Cite
Di Bari, I.; Longo, D.; D’Arrigo, G.; Giudice, G.; Sciuto, A. A Preliminary Study for Ultraviolet Optical Methyl Salicylate Monitoring in Agriculture. Sensors 2025, 25, 3021. https://doi.org/10.3390/s25103021
Di Bari I, Longo D, D’Arrigo G, Giudice G, Sciuto A. A Preliminary Study for Ultraviolet Optical Methyl Salicylate Monitoring in Agriculture. Sensors. 2025; 25(10):3021. https://doi.org/10.3390/s25103021
Chicago/Turabian StyleDi Bari, Ivana, Domenico Longo, Giuseppe D’Arrigo, Gaetano Giudice, and Antonella Sciuto. 2025. "A Preliminary Study for Ultraviolet Optical Methyl Salicylate Monitoring in Agriculture" Sensors 25, no. 10: 3021. https://doi.org/10.3390/s25103021
APA StyleDi Bari, I., Longo, D., D’Arrigo, G., Giudice, G., & Sciuto, A. (2025). A Preliminary Study for Ultraviolet Optical Methyl Salicylate Monitoring in Agriculture. Sensors, 25(10), 3021. https://doi.org/10.3390/s25103021