
Using Masked Image Modelling Transformer Architecture for Laparoscopic Surgical Tool Classification and Localization

 ,
,  ,
,  ,
,  ,
,  , , ,
, , ,  and
and
Abstract
1. Introduction
1.1. Motivation
1.2. Contribution
2. Related Studies
2.1. Literature Review
2.2. Problem Statement
3. Methodology
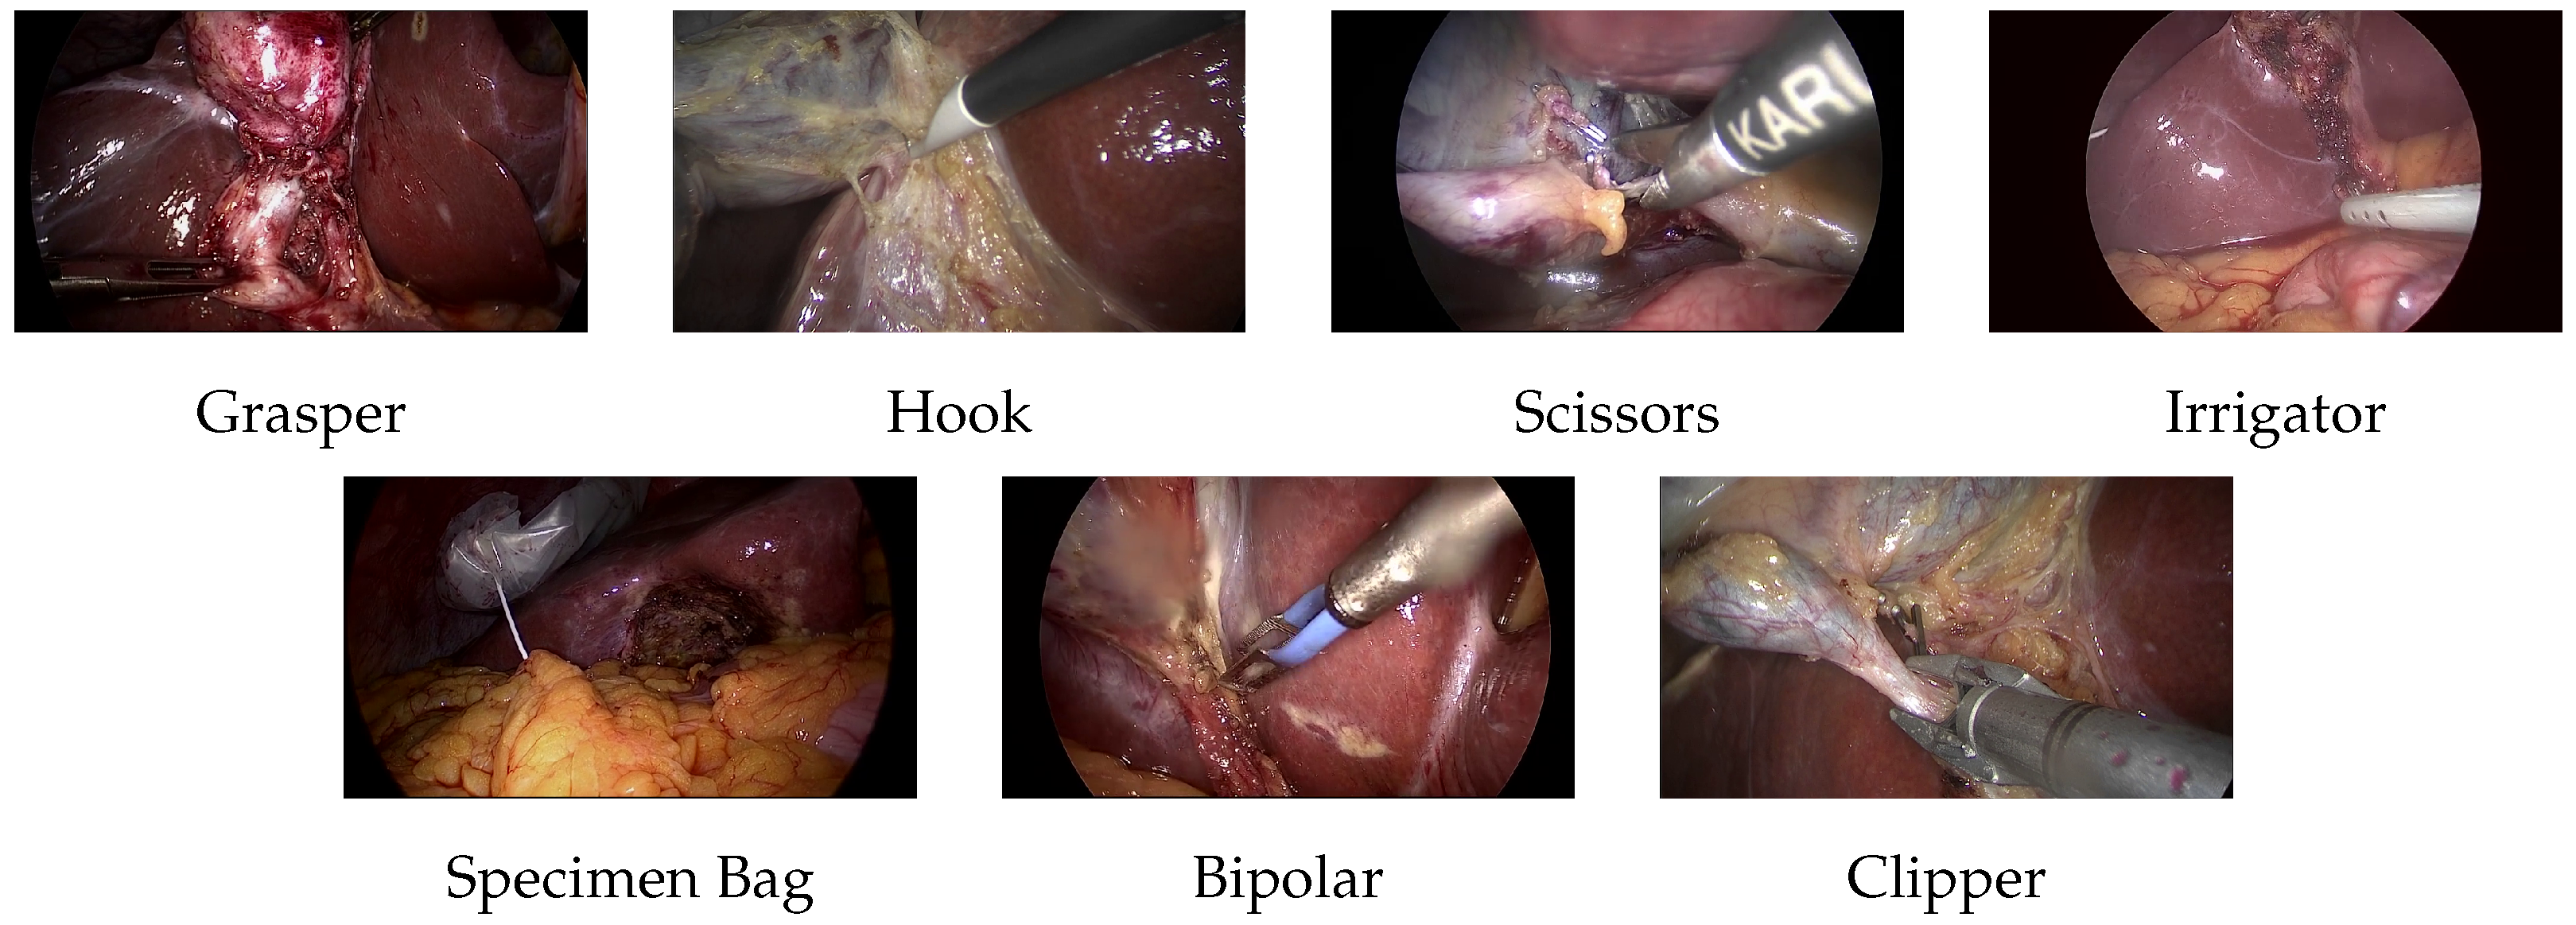
3.1. Dataset
- Grasper, bipolar, hook, scissors, and clipper: The smallest bounding box containing the tool tip and the initial part of the tool shaft was selected.
- Irrigator: If the complete tool is visible, the smallest bounding box containing almost half the irrigator. If the tool is partially visible, a bounding box is added to the visible part of the tool.
- Specimen bag: The smallest bounding box containing the visible part of the bag was selected.
3.2. ViT Architecture
3.3. BEiT Architecture
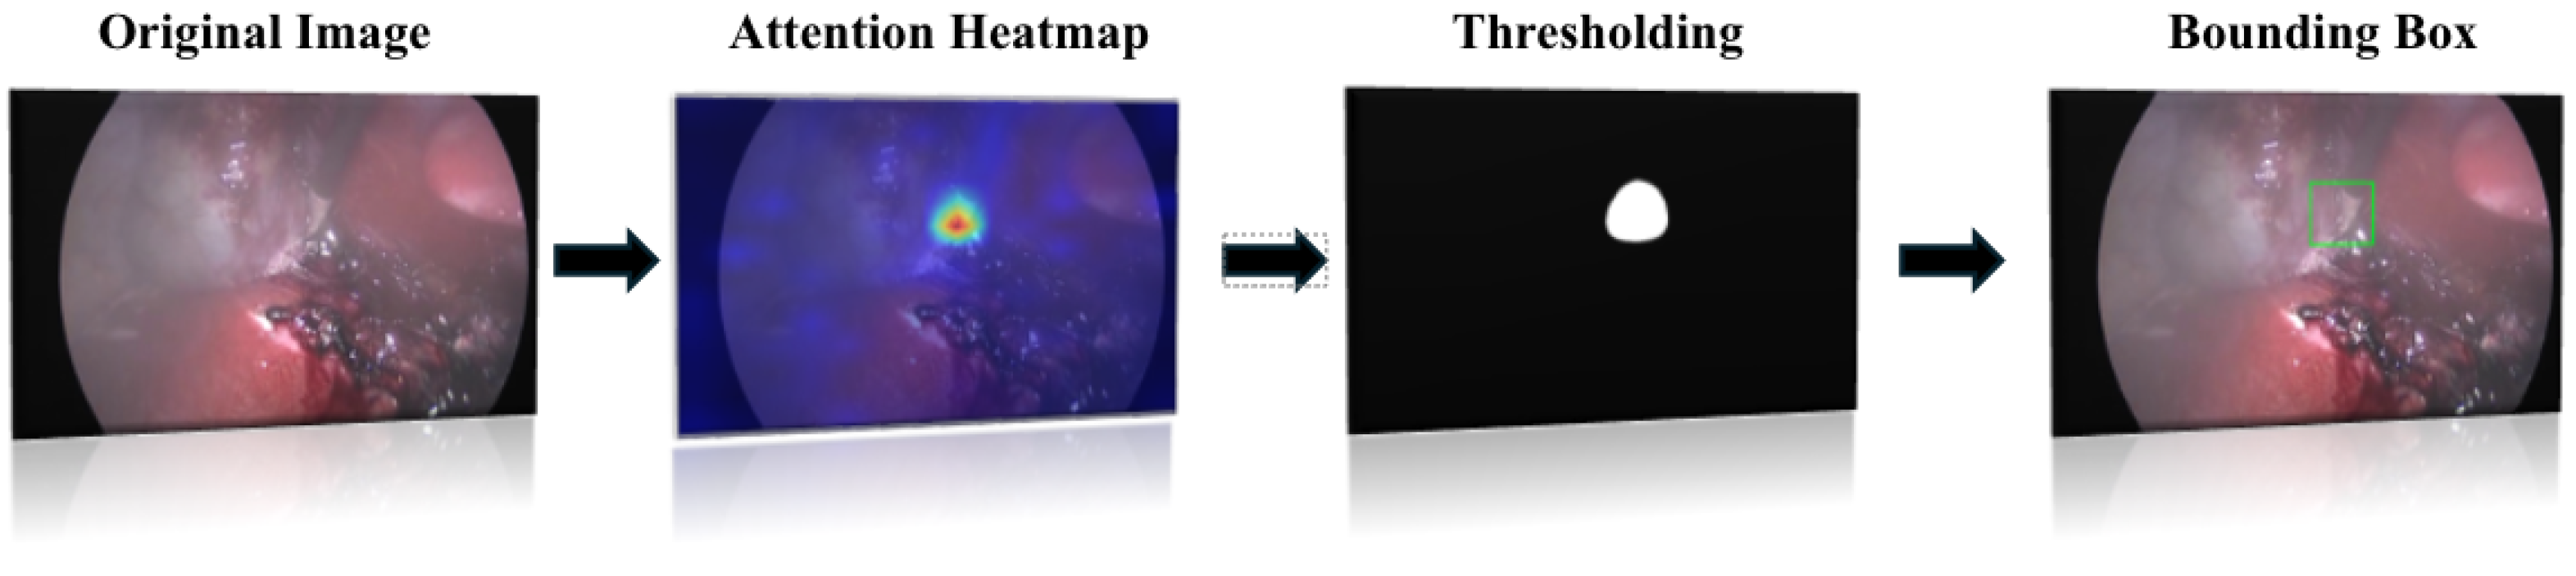
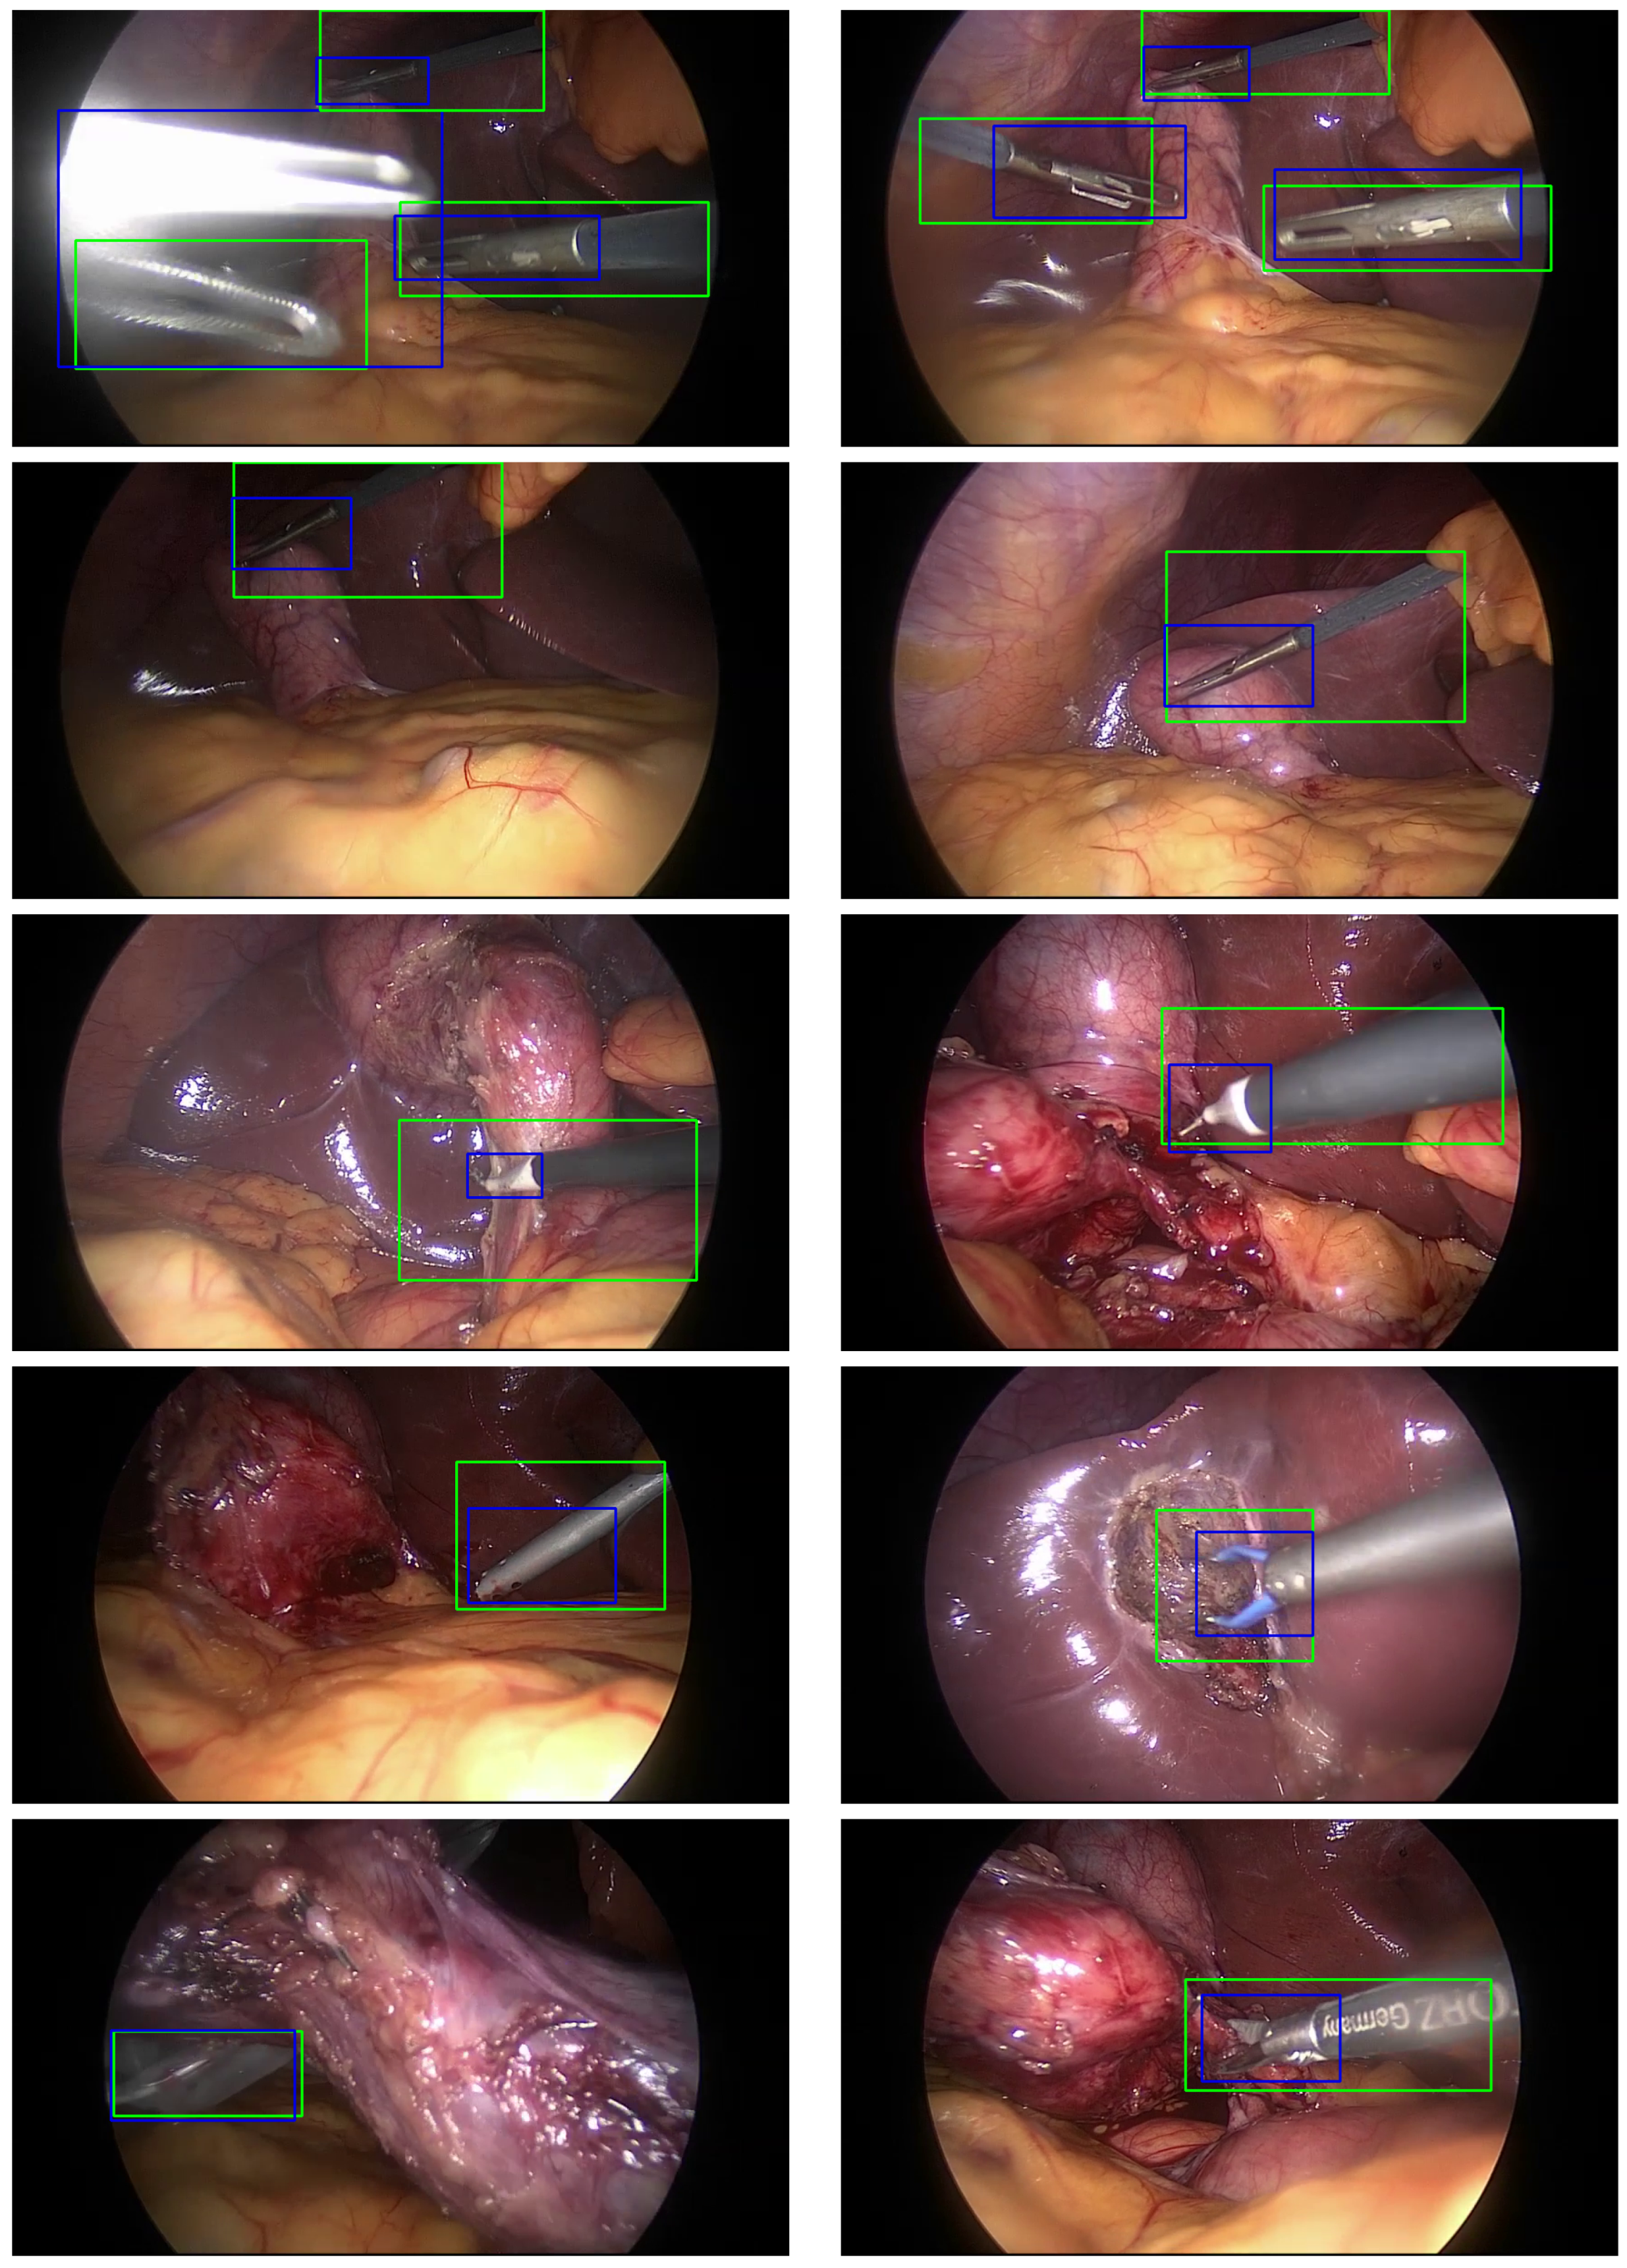
3.4. Localization Algorithm
4. Experimental Setup
4.1. Class Imbalance
4.2. Model Training
4.3. Evaluation Metrics
5. Results and Discussion
6. Implementation Details and Analysis
7. Conclusions and Future Work
Supplementary Materials
Author Contributions
Funding
Institutional Review Board Statement
Informed Consent Statement
Data Availability Statement
Conflicts of Interest
References
- Nwoye, C.I.; Yu, T.; Gonzalez, C.; Seeliger, B.; Mascagni, P.; Mutter, D.; Marescaux, J.; Padoy, N. Rendezvous: Attention mechanisms for the recognition of surgical action triplets in endoscopic videos. Med. Image Anal. 2022, 78, 102433. [Google Scholar] [CrossRef] [PubMed]
- Garrow, C.R.; Kowalewski, K.-F.; Li, L.; Wagner, M.; Schmidt, M.W.; Engelhardt, S.; Hashimoto, D.A.; Kenngott, H.G.; Bodenstedt, S.; Nickel, F.; et al. Machine Learning for Surgical Phase Recognition. Ann. Surg. 2021, 273, 684–693. [Google Scholar] [CrossRef]
- Maier-Hein, L.; Vedula, S.S.; Speidel, S.; Navab, N.; Kikinis, R.; Park, A.; Eisenmann, M.; Feussner, H.; Forestier, G.; Giannarou, S.; et al. Surgical data science for next-generation interventions. Nat. Biomed. Eng. 2017, 1, 691–696. [Google Scholar] [CrossRef]
- Jin, Y.; Li, H.; Dou, Q.; Chen, H.; Qin, J.; Fu, C.-W.; Heng, P.-A. Multi-task recurrent convolutional network with correlation loss for surgical video analysis. Med. Image Anal. 2020, 59, 101572. [Google Scholar] [CrossRef] [PubMed]
- Twin, A.P.; Shehata, S.; Mutter, D.; Marescaux, J.; De Mathelin, M.; Padoy, N. EndoNet: A deep architecture for recognition tasks on laparoscopic videos. IEEE Trans. Med. Imaging 2017, 36, 86–97. [Google Scholar] [CrossRef]
- Bao, H.; Dong, L.; Piao, S.; Wei, F. BEIT: BERT Pre-Training of Image Transformers. arXiv 2021, arXiv:2106.08254. [Google Scholar]
- Miyawaki, F.; Namiki, H.; Kano, K. Development of real-time acquisition system of intraoperative information on use of surgical instruments for scrub nurse robot. IFAC Proc. Vol. 2011, 44, 9458–9463. [Google Scholar] [CrossRef]
- Primus, M.J.; Schoeffmann, K.; Böszörmenyi, L. Instrument classification in laparoscopic videos. In Proceedings of the 2015 13th International Workshop on Content-Based Multimedia Indexing (CBMI), Prague, Czech Republic, 10–12 June 2015; IEEE: Piscataway, NJ, USA, 2015. [Google Scholar]
- Laina, I.; Rieke, N.; Rupprecht, C.; Vizcaıno, J.P.; Eslami, A.; Tombari, F.; Navab, N. Concurrent segmentation and localization for tracking of surgical instruments. In Proceedings of the International Conference on Medical Image Computing and Computer-Assisted Intervention, Qucbec City, QC, Canada, 10–14 September 2017; Springer: Berlin/Heidelberg, Germany, 2017; pp. 664–672. [Google Scholar]
- Pakhomov, D.; Premachandran, V.; Allan, M.; Azizian, M.; Navab, N. Deep residual learning for instrument segmentation in robotic surgery. Mach. Learn. Med. Imaging 2019, 11861, 566–573. [Google Scholar]
- Alshirbaji, T.A.; Jalal, N.A.; Docherty, P.D.; Neumuth, T.; Moeller, K. Assessing generalisation capabilities of CNN models for surgical tool classification. Curr. Dir. Biomed. Eng. 2021, 7, 476–479. [Google Scholar] [CrossRef]
- Shi, P.; Zhao, Z.; Hu, S.; Chang, F. Real-Time surgical tool detection in minimally invasive surgery based on Attention-Guided convolutional neural Network. IEEE Access 2020, 8, 228853–228862. [Google Scholar] [CrossRef]
- Dosovitskiy, A.; Beyer, L.; Kolesnikov, A.; Weissenborn, D.; Zhai, X.; Unterthiner, T.; Dehghani, M.; Minderer, M.; Heigold, G.; Gelly, S.; et al. An Image is Worth 16 × 16 Words: Transformers for Image Recognition at Scale. An Image Is Worth 16 × 16 Words: Transformers for Image Recognition at Scale. May 2021. Available online: https://openreview.net/pdf?id=YicbFdNTTy (accessed on 28 September 2024).
- Devlin, J.; Chang, M.W.; Lee, K.; Toutanova, K. BERT: Pre-training of Deep Bidirectional Transformers for Language Understanding. arXiv 2018, arXiv:1810.04805. [Google Scholar]
- Abiyev, R.H.; Altabel, M.Z.; Darwish, M.; Helwan, A. A Multimodal Transformer Model for Recognition of Images from Complex Laparoscopic Surgical Videos. Diagnostics 2024, 14, 681. [Google Scholar] [CrossRef] [PubMed]
- Batić, D.; Holm, F.; Özsoy, E.; Czempiel, T.; Navab, N. EndoViT: Pretraining vision transformers on a large collection of endoscopic images. Int. J. Comput. Assist. Radiol. Surg. 2024, 19, 1085–1091. [Google Scholar] [CrossRef]
- Deng, J.; Dong, W.; Socher, R.; Li, L.-J.; Li, K.; Fei-Fei, L. Imagenet: A large-scale hierarchical image database. In Proceedings of the 2009 IEEE Conference on Computer Vision and Pattern Recognition, Miami, FL, USA, 20–25 June 2009; pp. 248–255. [Google Scholar]
- Abdulbaki Alshirbaji, T.; Jalal, N.A.; Arabian, H.; Battistel, A.; Docherty, P.D.; ElMoaqet, H.; Neumuth, T.; Moeller, K. Cholec80 Boxes: Bounding Box Labelling Data for Surgical Tools in Cholecystectomy Images. Data 2025, 10, 7. [Google Scholar] [CrossRef]
- Vaswani, A.; Shazeer, N.; Parmar, N.; Uszkoreit, J.; Jones, L.; Gomez, A.N.; Kaiser, L.; Polosukhin, I. Attention is All you Need. arXiv 2017, arXiv:1706.03762v5. [Google Scholar]
- Moaqet, H.E.; Janini, R.; Alshirbaji, T.A.; Jalal, N.A.; Möller, K. Using vision transformers for classifying surgical tools in computer aided surgeries. Curr. Dir. Biomed. Eng. 2024, 10, 232–235. [Google Scholar] [CrossRef]
- Ostu, N. A Threshold Selection Method from Gray-Level Histograms. IEEE Trans. Syst. Man, Cybern. 1979, 9, 62–66. [Google Scholar]
- Hosang, J.; Benenson, R.; Schiele, B. Learning non-maximum suppression. arXiv 2017, arXiv:1705.02950. [Google Scholar]
- Alshirbaji, T.A.; Jalal, N.A.; Möller, K. Surgical tool classification in laparoscopic videos using convolutional neural network. Curr. Dir. Biomed. Eng. 2018, 4, 407–410. [Google Scholar] [CrossRef]
- Loshchilov, I.; Hutter, F. Decoupled weight decay regularization. arXiv 2017, arXiv:1711.05101. [Google Scholar]
- Jalal, N.A.; Alshirbaji, T.A.; Docherty, P.D.; Arabian, H.; Neumuth, T.; Moeller, K. Surgical Tool Classification & Localisation Using Attention and Multi-feature Fusion Deep Learning Approach. IFAC-PaperOnline 2024, 56, 5626–5631. [Google Scholar] [CrossRef]
- Nwoye, C.I.; Mutter, D.; Marescaux, J.; Padoy, N. Weakly supervised convolutional LSTM approach for tool tracking in laparoscopic videos. Int. J. Comput. Assist. Radiol. Surg. 2019, 14, 1059–1067. [Google Scholar] [CrossRef] [PubMed]


| Tool | Class Frequency |
|---|---|
| Grasper | 102,569 |
| Hook | 103,099 |
| Scissors | 3254 |
| Irrigator | 9814 |
| Specimen Bag | 11,462 |
| Bipolar | 8876 |
| Clipper | 5986 |
| Total | 245,060 |
| Metric | Recall (%) | F1 Score (%) | mAP (%) |
|---|---|---|---|
| Fold 1 | 90.81 | 92.75 | 95.24 |
| Fold 2 | 92.30 | 94.04 | 96.31 |
| Fold 3 | 91.80 | 93.60 | 97.74 |
| Average | 91.64 | 93.46 | 96.43 |
| Tool | Recall (%) | F1 Score (%) | AP (%) |
|---|---|---|---|
| Grasper | 94.41 | 92.89 | 98.13 |
| Bipolar | 95.60 | 96.95 | 98.62 |
| Hook | 99.01 | 98.87 | 99.75 |
| Scissors | 86.18 | 89.77 | 88.63 |
| Clipper | 94.33 | 96.13 | 98.18 |
| Irrigator | 96.10 | 95.78 | 97.74 |
| Specimen Bag | 93.84 | 93.99 | 97.51 |
| Mean | 94.21 | 94.91 | 96.94 |
| Tool | MTRC [4] | Nwoye [26] | Jalal [11] | CNN_SE_MF [25] | ViT [20] | BEiT |
|---|---|---|---|---|---|---|
| Grasper | 84.7 | 99.7 | 91.0 | 90.6 | 91.6 | 98.1 |
| Bipolar | 90.1 | 95.6 | 97.3 | 95.3 | 99.7 | 98.6 |
| Hook | 95.6 | 99.8 | 99.8 | 99.4 | 97.3 | 99.8 |
| Scissors | 86.7 | 86.9 | 90.3 | 86.1 | 92.4 | 88.6 |
| Clipper | 89.8 | 97.5 | 97.4 | 96.6 | 95.8 | 98.2 |
| Irrigator | 88.2 | 74.7 | 95.6 | 92.8 | 96.3 | 97.7 |
| Specimen Bag | 88.9 | 96.1 | 98.3 | 96.5 | 97.7 | 97.5 |
| Mean | 89.1 | 92.9 | 95.6 | 94.1 | 95.8 | 96.9 |
Disclaimer/Publisher’s Note: The statements, opinions and data contained in all publications are solely those of the individual author(s) and contributor(s) and not of MDPI and/or the editor(s). MDPI and/or the editor(s) disclaim responsibility for any injury to people or property resulting from any ideas, methods, instructions or products referred to in the content. |
© 2025 by the authors. Licensee MDPI, Basel, Switzerland. This article is an open access article distributed under the terms and conditions of the Creative Commons Attribution (CC BY) license (https://creativecommons.org/licenses/by/4.0/).
Share and Cite
ElMoaqet, H.; Janini, R.; Ryalat, M.; Al-Refai, G.; Abdulbaki Alshirbaji, T.; Jalal, N.A.; Neumuth, T.; Moeller, K.; Navab, N. Using Masked Image Modelling Transformer Architecture for Laparoscopic Surgical Tool Classification and Localization. Sensors 2025, 25, 3017. https://doi.org/10.3390/s25103017
ElMoaqet H, Janini R, Ryalat M, Al-Refai G, Abdulbaki Alshirbaji T, Jalal NA, Neumuth T, Moeller K, Navab N. Using Masked Image Modelling Transformer Architecture for Laparoscopic Surgical Tool Classification and Localization. Sensors. 2025; 25(10):3017. https://doi.org/10.3390/s25103017
Chicago/Turabian StyleElMoaqet, Hisham, Rami Janini, Mutaz Ryalat, Ghaith Al-Refai, Tamer Abdulbaki Alshirbaji, Nour Aldeen Jalal, Thomas Neumuth, Knut Moeller, and Nassir Navab. 2025. "Using Masked Image Modelling Transformer Architecture for Laparoscopic Surgical Tool Classification and Localization" Sensors 25, no. 10: 3017. https://doi.org/10.3390/s25103017
APA StyleElMoaqet, H., Janini, R., Ryalat, M., Al-Refai, G., Abdulbaki Alshirbaji, T., Jalal, N. A., Neumuth, T., Moeller, K., & Navab, N. (2025). Using Masked Image Modelling Transformer Architecture for Laparoscopic Surgical Tool Classification and Localization. Sensors, 25(10), 3017. https://doi.org/10.3390/s25103017