The electroosmotic pressure signal is very weak and buried in a very strong background noise. Obtaining a high signal-to-noise ratio of electroosmotic pressure is the difficulty and focus of electroosmotic experiments. Theoretically, there are two ways to improve the signal-to-noise ratio: one is to increase the amplitude of the electroosmotic pressure; the other is to suppress the background noise. The amplitude of electroosmotic pressure is limited by the amplitude of the excitation voltage, which cannot be arbitrarily increased. From Equation (5), theoretically, an increase in the excitation voltage can be equal to the amplitude of the electroosmotic pressure in the equilibrium state. However, for excitation frequencies on the order of millihertz, an excitation voltage of a few volts is sufficient to cause electrolysis of the solution and release of gases, while electrolysis also alters the pH and conductivity of the solution [
15]. The gases produced by electrolysis, as well as changes in the pH and conductivity of the solution change the value of the electroosmotic pressure coefficient. For experiments on rock samples saturated with highly mineralized solutions, excessive excitation currents (>5 mA/cm
2) can lead to a significant increase in the temperature of the rock samples within a safe excitation voltage range [
16]. It can be seen that both excitation voltage and excitation current have upper limits. In this paper, the excitation voltage is less than or equal to 0.2 V and the excitation current is less than or equal to 1 mA/cm
2. In this case, increasing the electroosmotic pressure by increasing the excitation voltage is not favorable to the accuracy of the experimental data, i.e., it is not feasible to increase the magnitude of the electroosmotic pressure.
Other scholars have used the single pressure sensor method to measure the electroosmotic pressure, i.e., a single pressure sensor is used to convert the electroosmotic pressure from a pressure signal to an electrical signal, and then the value of the electroosmotic pressure is extracted by a lock-in amplifier [
15]. The lock-in amplifier has two input signals, one is the measured signal and the other is the reference signal. The lock-in amplifier first multiplies the two input signals by a phase-sensitive detector, and then the output signal of the phase-sensitive detector is filtered with a low-pass filter to obtain the output signal of the low-pass filter, where ‘amplitude’ and ‘phase’ represent the amplitude and phase of the measured signal, respectively. The amplitude and phase of the measured signal can be obtained by using two sets of phase-sensitive detectors and a low-pass filter with a 90° difference in the reference signals, which is referred to as a quadrature vector-type lock-in amplifier (hereinafter referred to as a lock-in amplifier) [
17,
18].
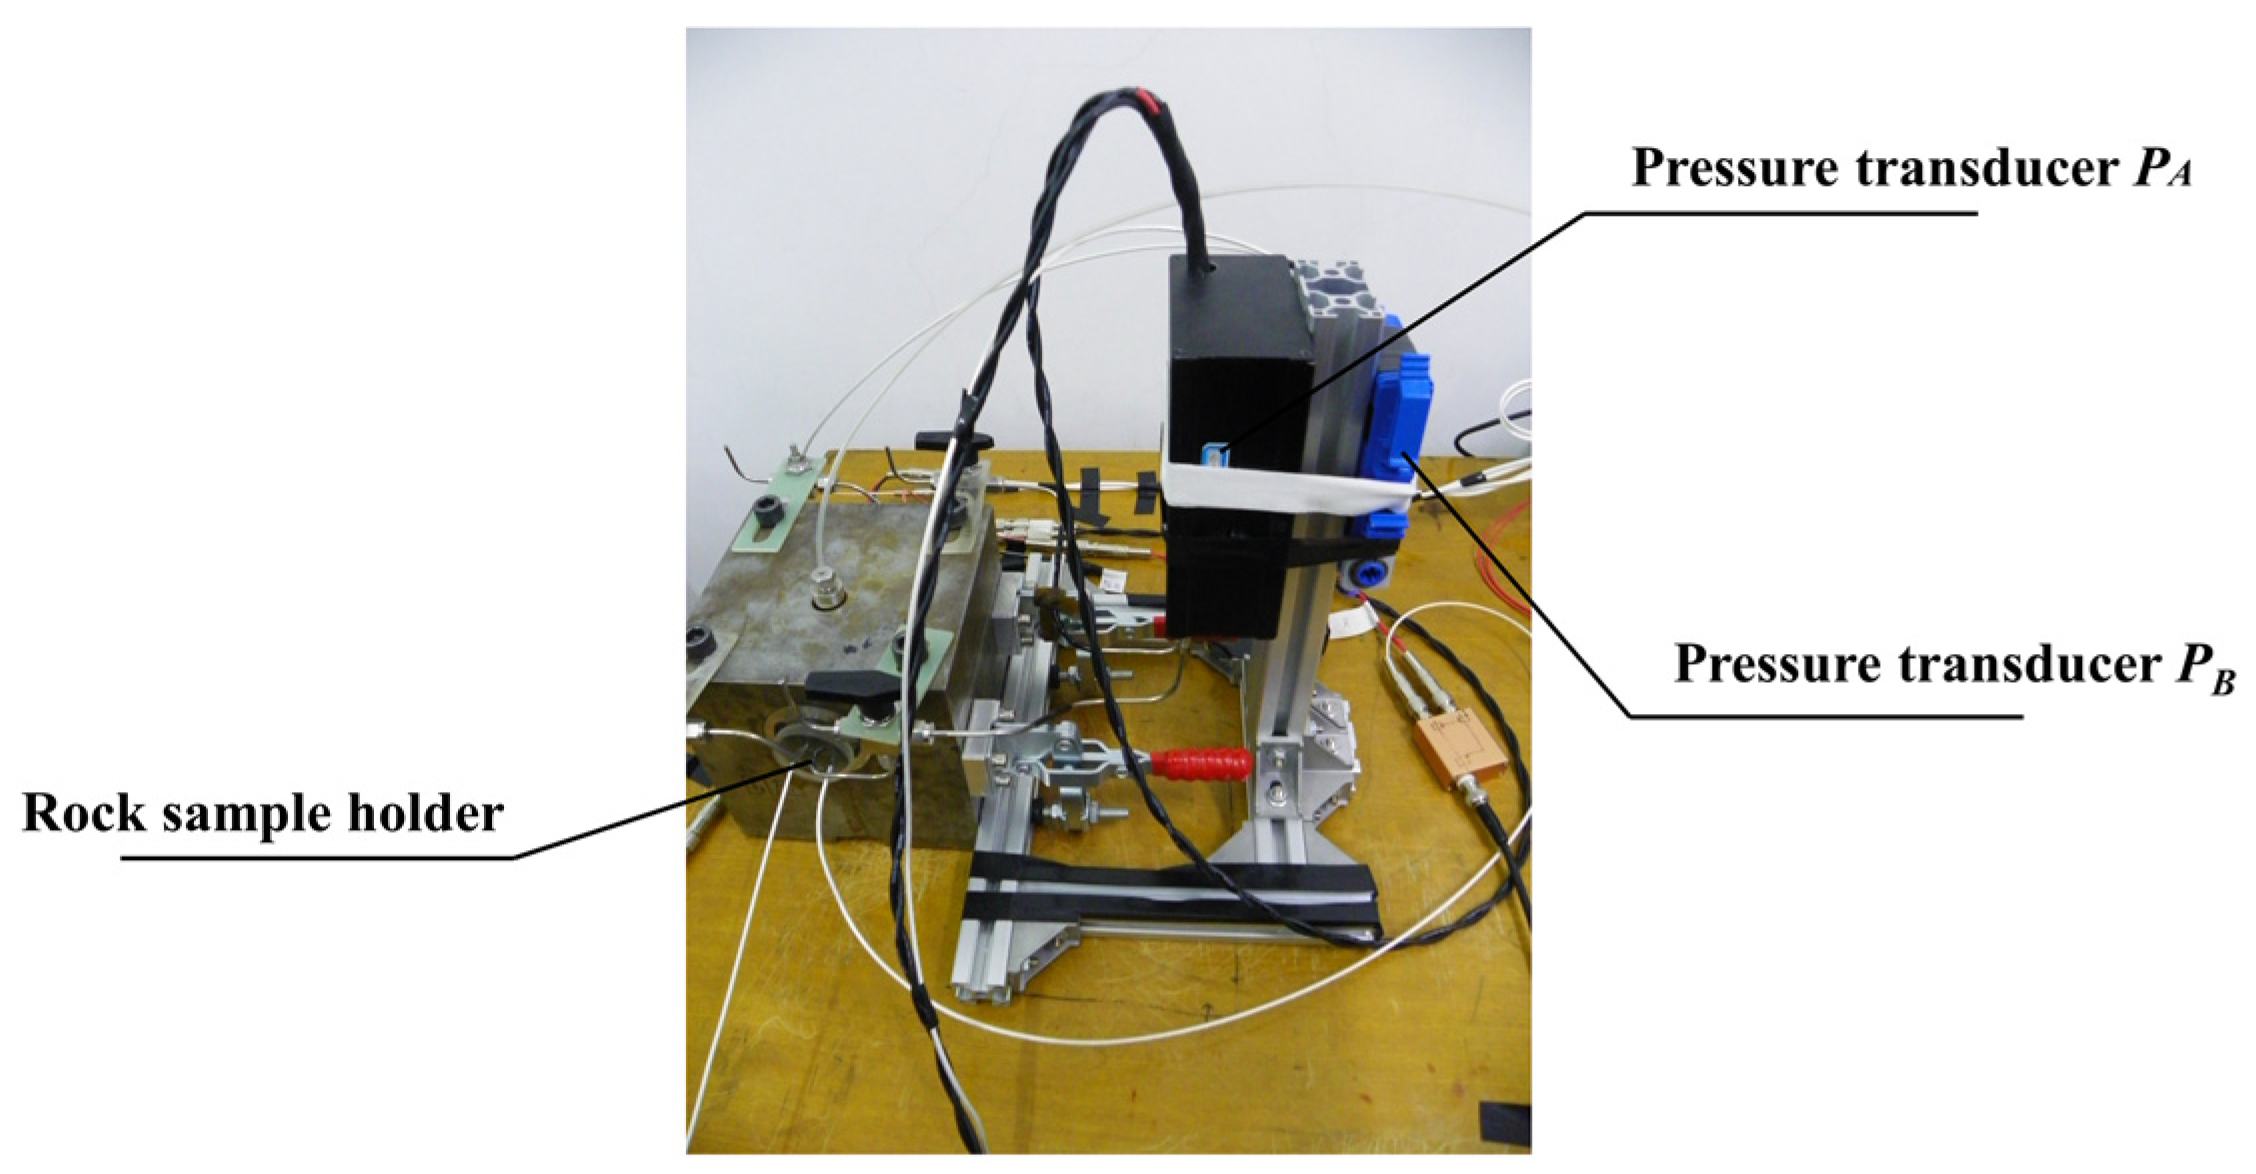
In order to suppress the background noise of electroosmotic pressure, the dual pressure sensor method is proposed in this paper, as shown in
Figure 2. The dual pressure sensor method uses two pressure sensors to measure the electroosmotic pressure and the background noise separately, and then the data acquisition card is used for analog/digital conversion, and finally, the electroosmotic pressure and its error estimation are obtained by weighted difference, spline fitting and fast Fourier transform. The lab measures at room temperature. The lateral side of the sample is sealed by rubber under about 1.2 MPa in a rock sample holder, and two ends of the sample link to two input ports of the pressure transducer
, respectively.
3.1. Theory of Dual Pressure Sensor Method
In this paper, two low range pressure sensors of the same type are used to measure electroosmotic pressure. The pressure sensors are used to measure electroosmotic pressure signals with background noise,
where
is the measured value of the pressure sensor
and
is the background noise of the pressure sensor
. The pressure sensor
is used to synchronize the monitoring of the background noise, the
where
is the measured value of the pressure sensor
and
is the background noise of the pressure sensor
.
In this paper, it is found experimentally that there is a strong correlation between the background noise of two pressure sensors although they are not numerically equal. In order to estimate the background noise
by measuring the background noise
, it is necessary to obtain the conversion coefficients
of the two pressure sensors,
From Equation (1) the electroosmotic seepage is zero when there is no excitation voltage at both ends of the rock sample, i.e.,
From the principle of electroosmotic effect, the electroosmotic pressure is caused by electroosmotic seepage, i.e.,
Substituting Equations (11) and (12) into Equation (8) gives
Substituting Equations (9) and (13) into Equation (10) gives
Therefore, the conversion coefficient
of the two pressure sensors can be obtained by measuring the pressure signals of the two pressure sensors when there is no excitation voltage.
For the traditional single pressure sensor method, the pressure sensor’s measurement is the electroosmotic pressure signal, i.e.,
where
is the electroosmotic pressure signal obtained by the single pressure sensor method.
For the dual pressure sensor method, from Equations (8)–(10),
where
is the electroosmotic pressure signal obtained by the dual pressure sensor method and
is the background noise of the pressure sensor
. In this way, the electroosmotic pressure signal can be obtained after suppressing the background noise.
3.2. Determination of Conversion Coefficients for Two Pressure Sensors
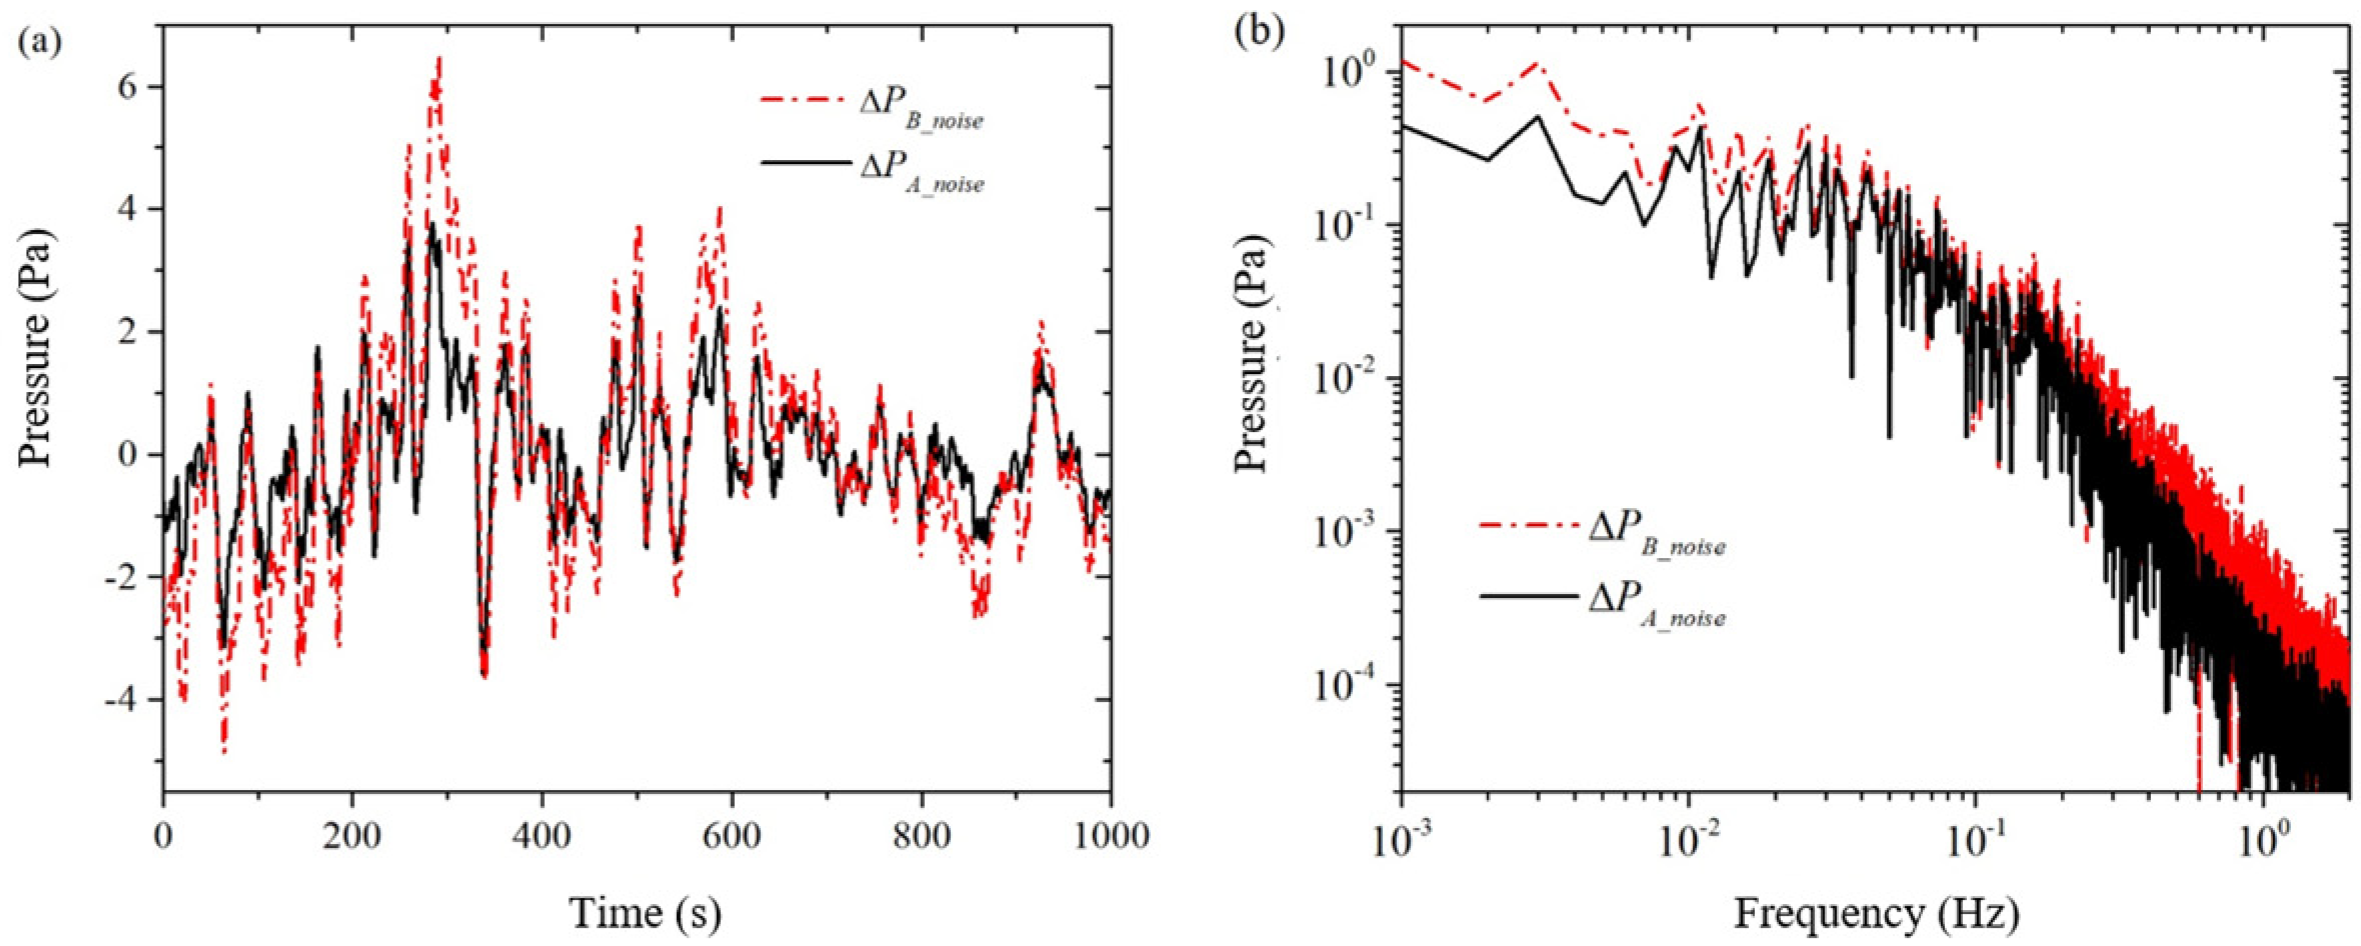
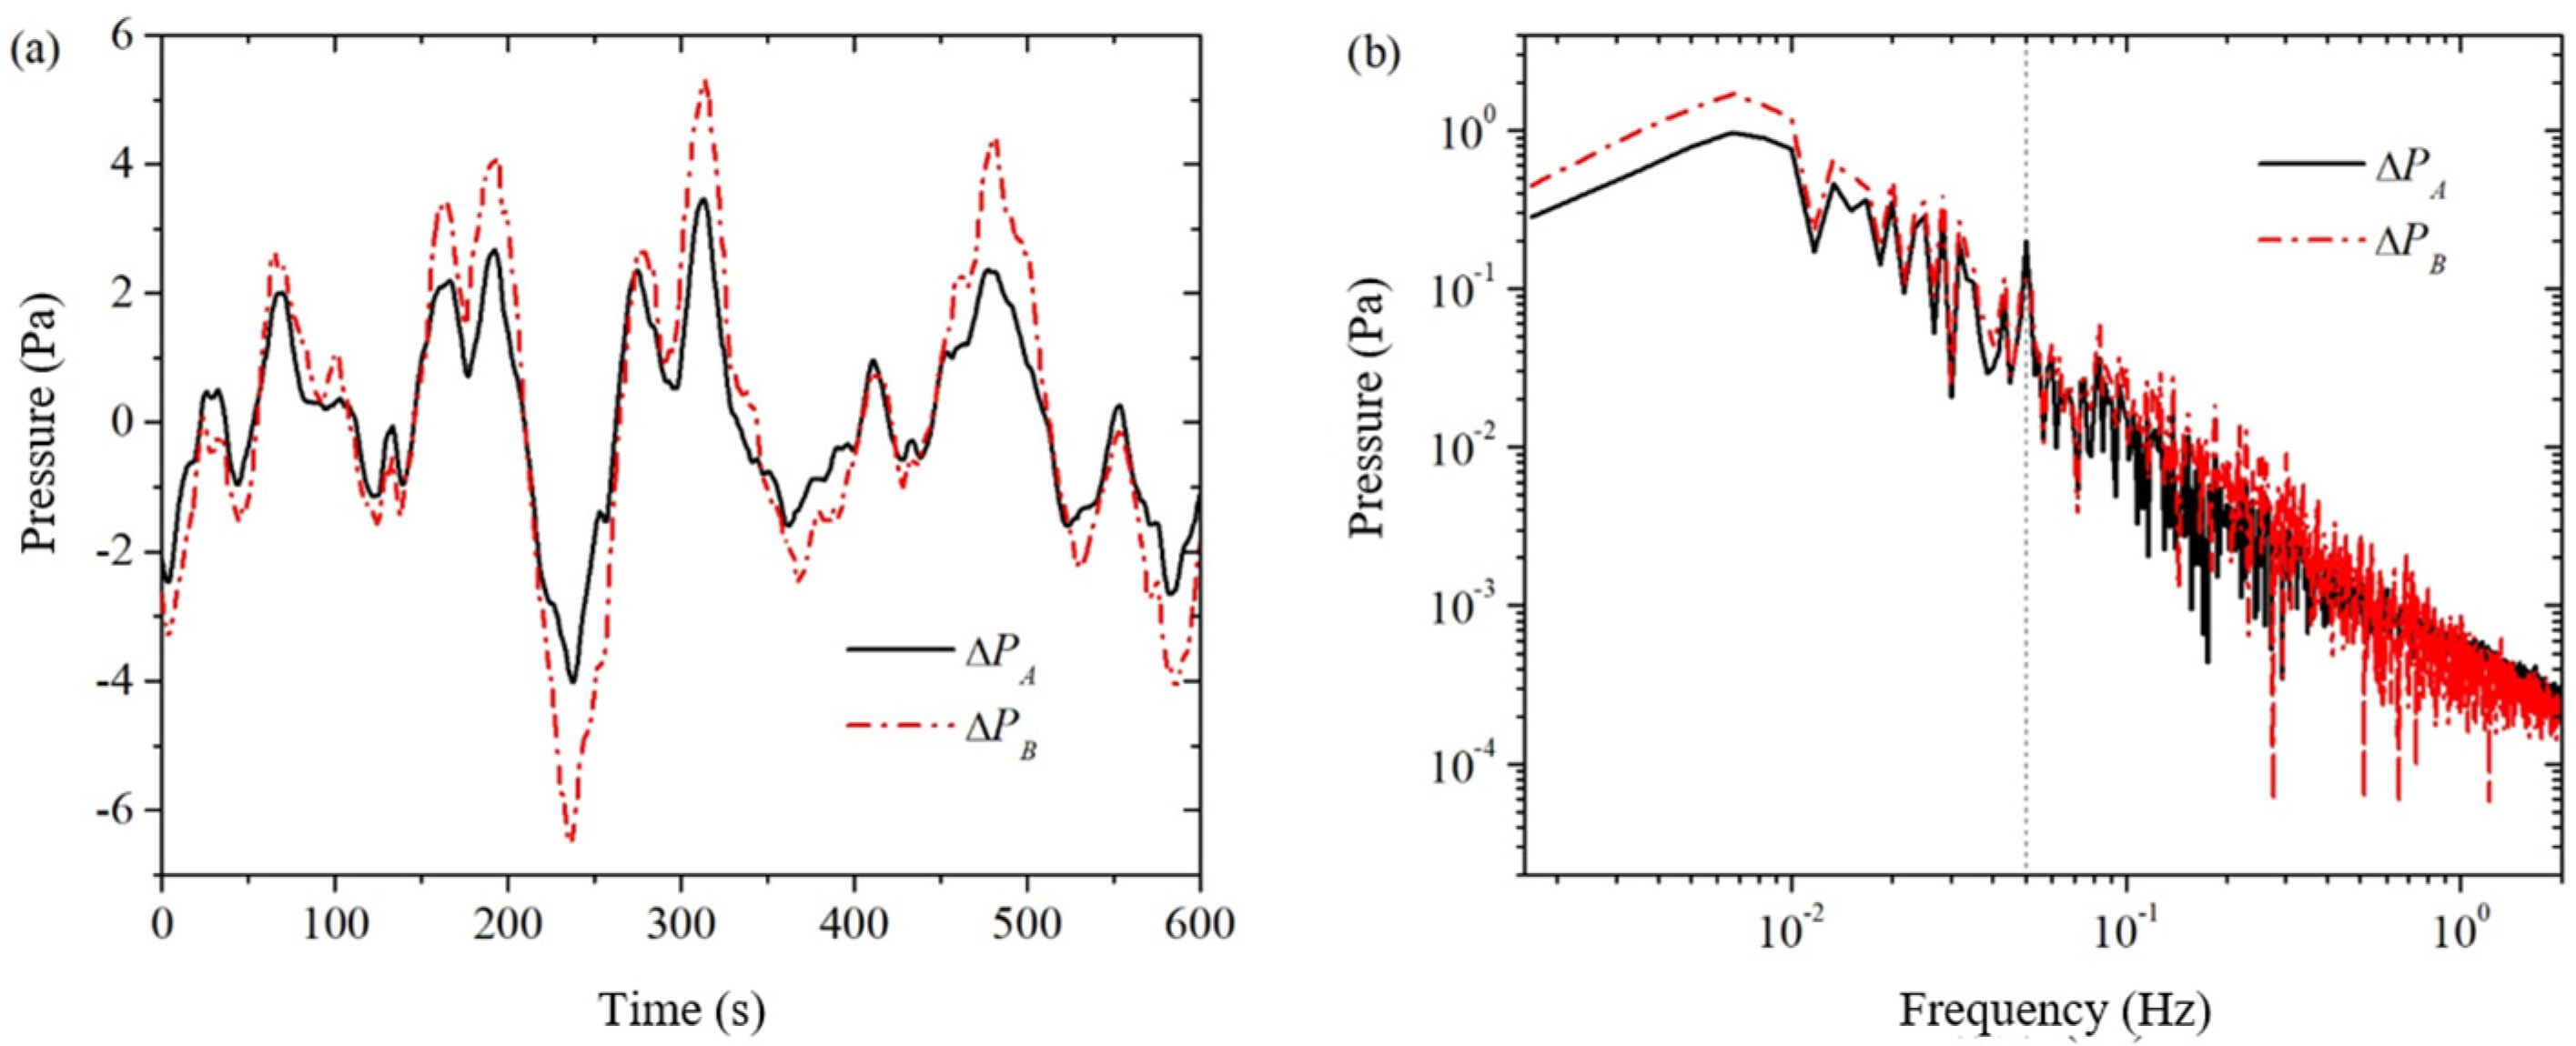
The solid and dashed lines in
Figure 3 represent the measured background noise
and
for pressure sensors
and
, respectively, in a single simultaneous acquisition. As seen from the time-domain signals in
Figure 3a, the waveforms of the two pressure sensors are very similar, but the amplitude of the pressure sensor
is slightly larger than that of pressure sensor
in terms of amplitude. We made several measurements and found that the time-domain signals of both pressure sensors have nearly identical waveforms but different amplitudes. This shows a good correlation between the background noise of the two pressure sensors. From the frequency domain signal in
Figure 3b, it can be seen that the conversion coefficient
of the background noise of the two pressure sensors is not a constant: in the middle of the frequency band from 0.01 Hz to 0.2 Hz, the difference in the background noise is relatively small, and from the formula, it can be seen that the conversion coefficient a is larger at this time; at the two ends of the frequency bands from 0.001 Hz to 0.01 Hz and from 0.2 Hz to 2 Hz, the difference of the background noise is relatively larger, at this time the conversion coefficient
a is smaller.
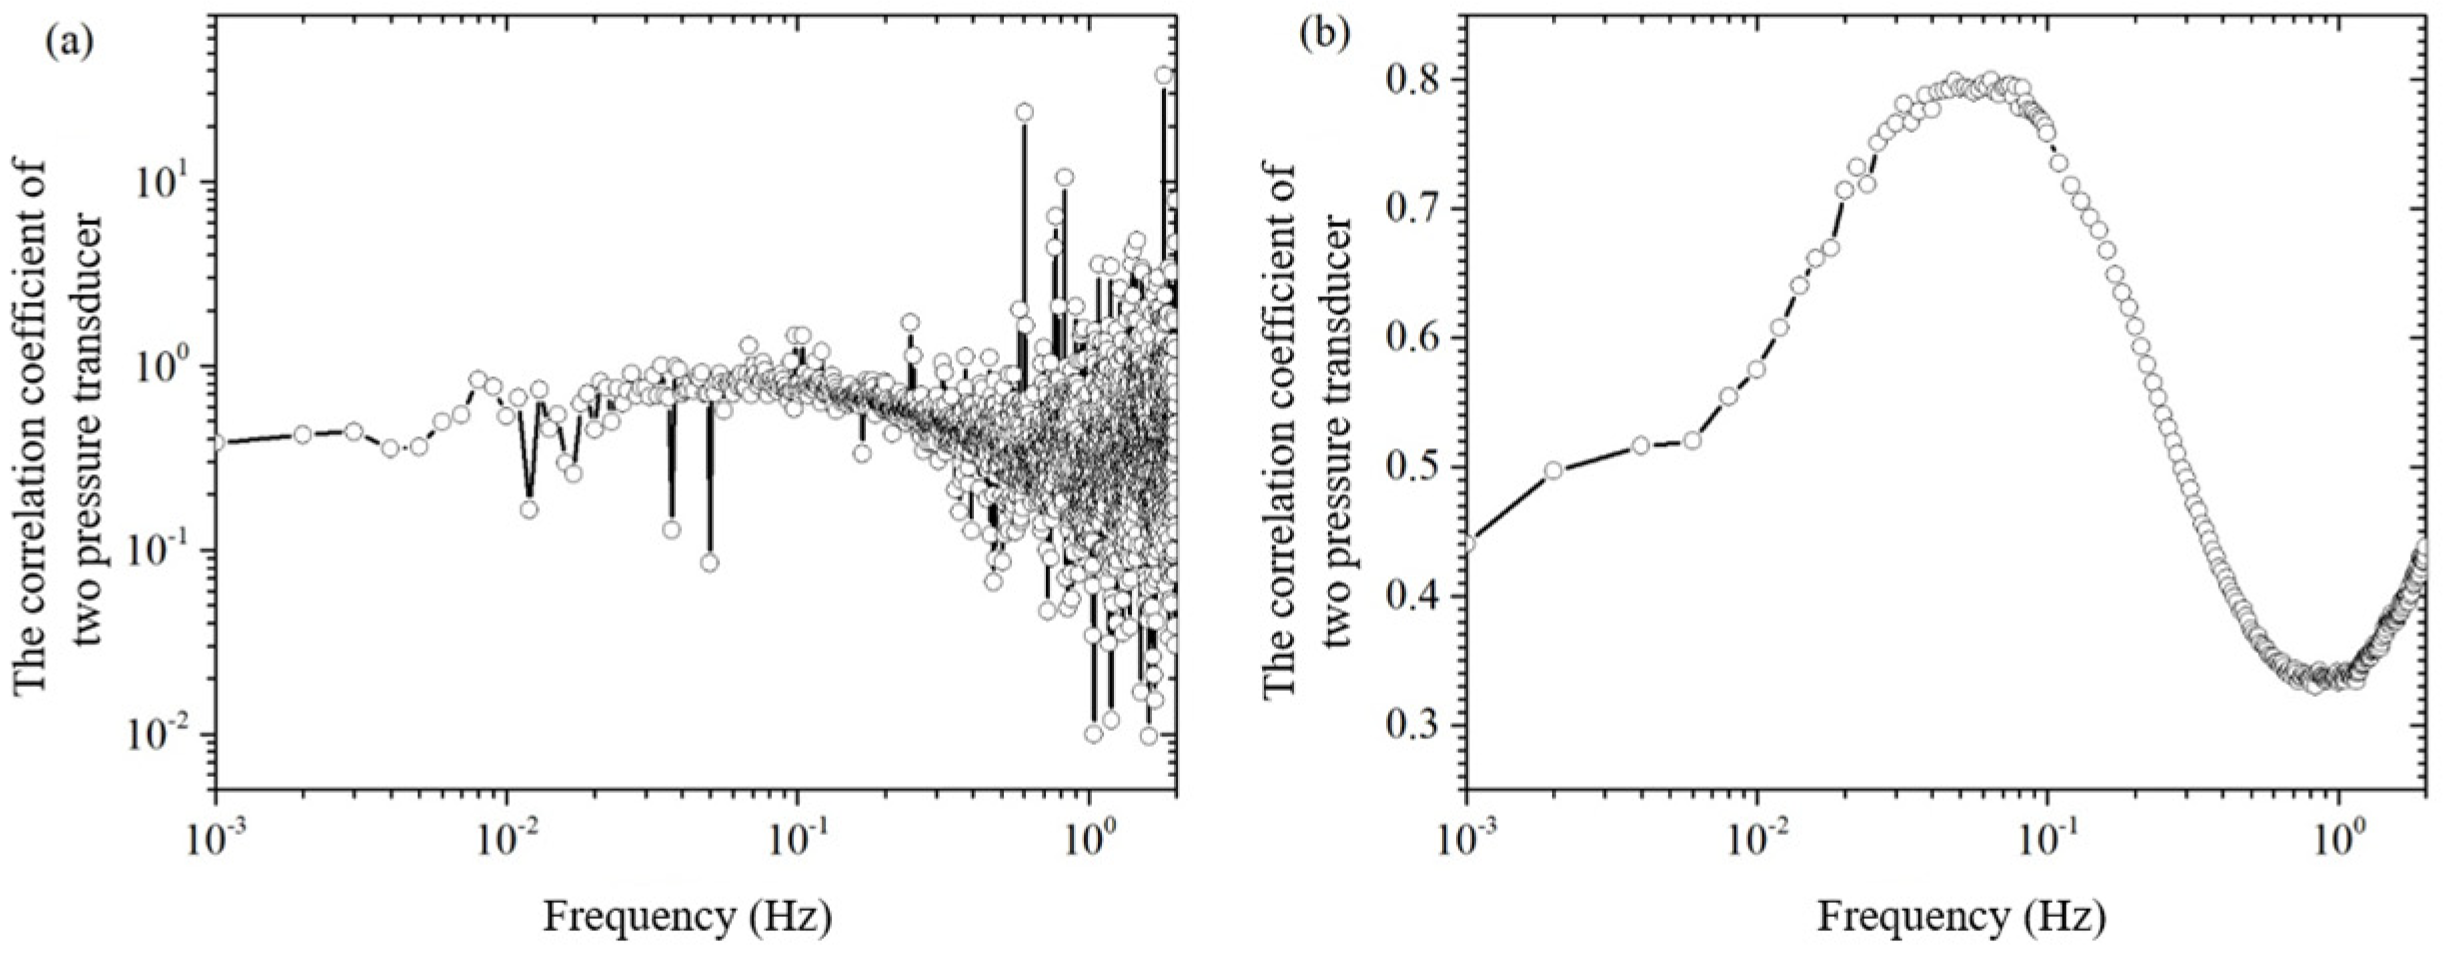
By dividing the amplitudes at the same frequency of the two pressure sensors in
Figure 3b, the theoretical conversion coefficient of the two pressure sensors can be obtained, which is called the point-to-point pressure sensor conversion coefficient, denoted as
. As shown in
Figure 4a, the amplitude curve of the point-to-point pressure sensor conversion factor oscillates more and more as the frequency increases. This “burr”-like oscillation is caused by the two frequency domain signals in
Figure 3b, the peaks and valleys of the wave division (or wave valley and peak division). It is clear that the error in the conversion factor of the point-to-point pressure sensor is too large to be used to estimate the background noise
of the pressure sensor
from the known background noise
of the pressure sensor
.
In order to eliminate the “burr” on the conversion coefficient curve in
Figure 4a, this paper adopts the following methods: (1) As shown in
Figure 3, measure the background noise of the two pressure sensors and the two pressure sensors when there is no excitation pressure, and obtain the frequency-domain signals; (2) In the frequency-domain signals, average the two curves with their surrounding points, so that frequency domain curves become relatively smooth; (3) Do point-to-point division on the two averaged smooth frequency domain curves to obtain the averaged conversion coefficients of a single measurement; (4) Repeat steps 1 to 3 to obtain the averaged conversion coefficients of multiple single measurements; and (5) Do averaging on the averaged conversion coefficients of multiple single measurements to obtain the averaged conversion coefficients of multiple measurements, as shown in
Figure 4b. From comparison of
Figure 4a,b, it can be seen that, through the averaging process, the conversion coefficient curve on the “burr” has been eliminated.
3.3. The Measured Signal of the Dual Pressure Sensor Method
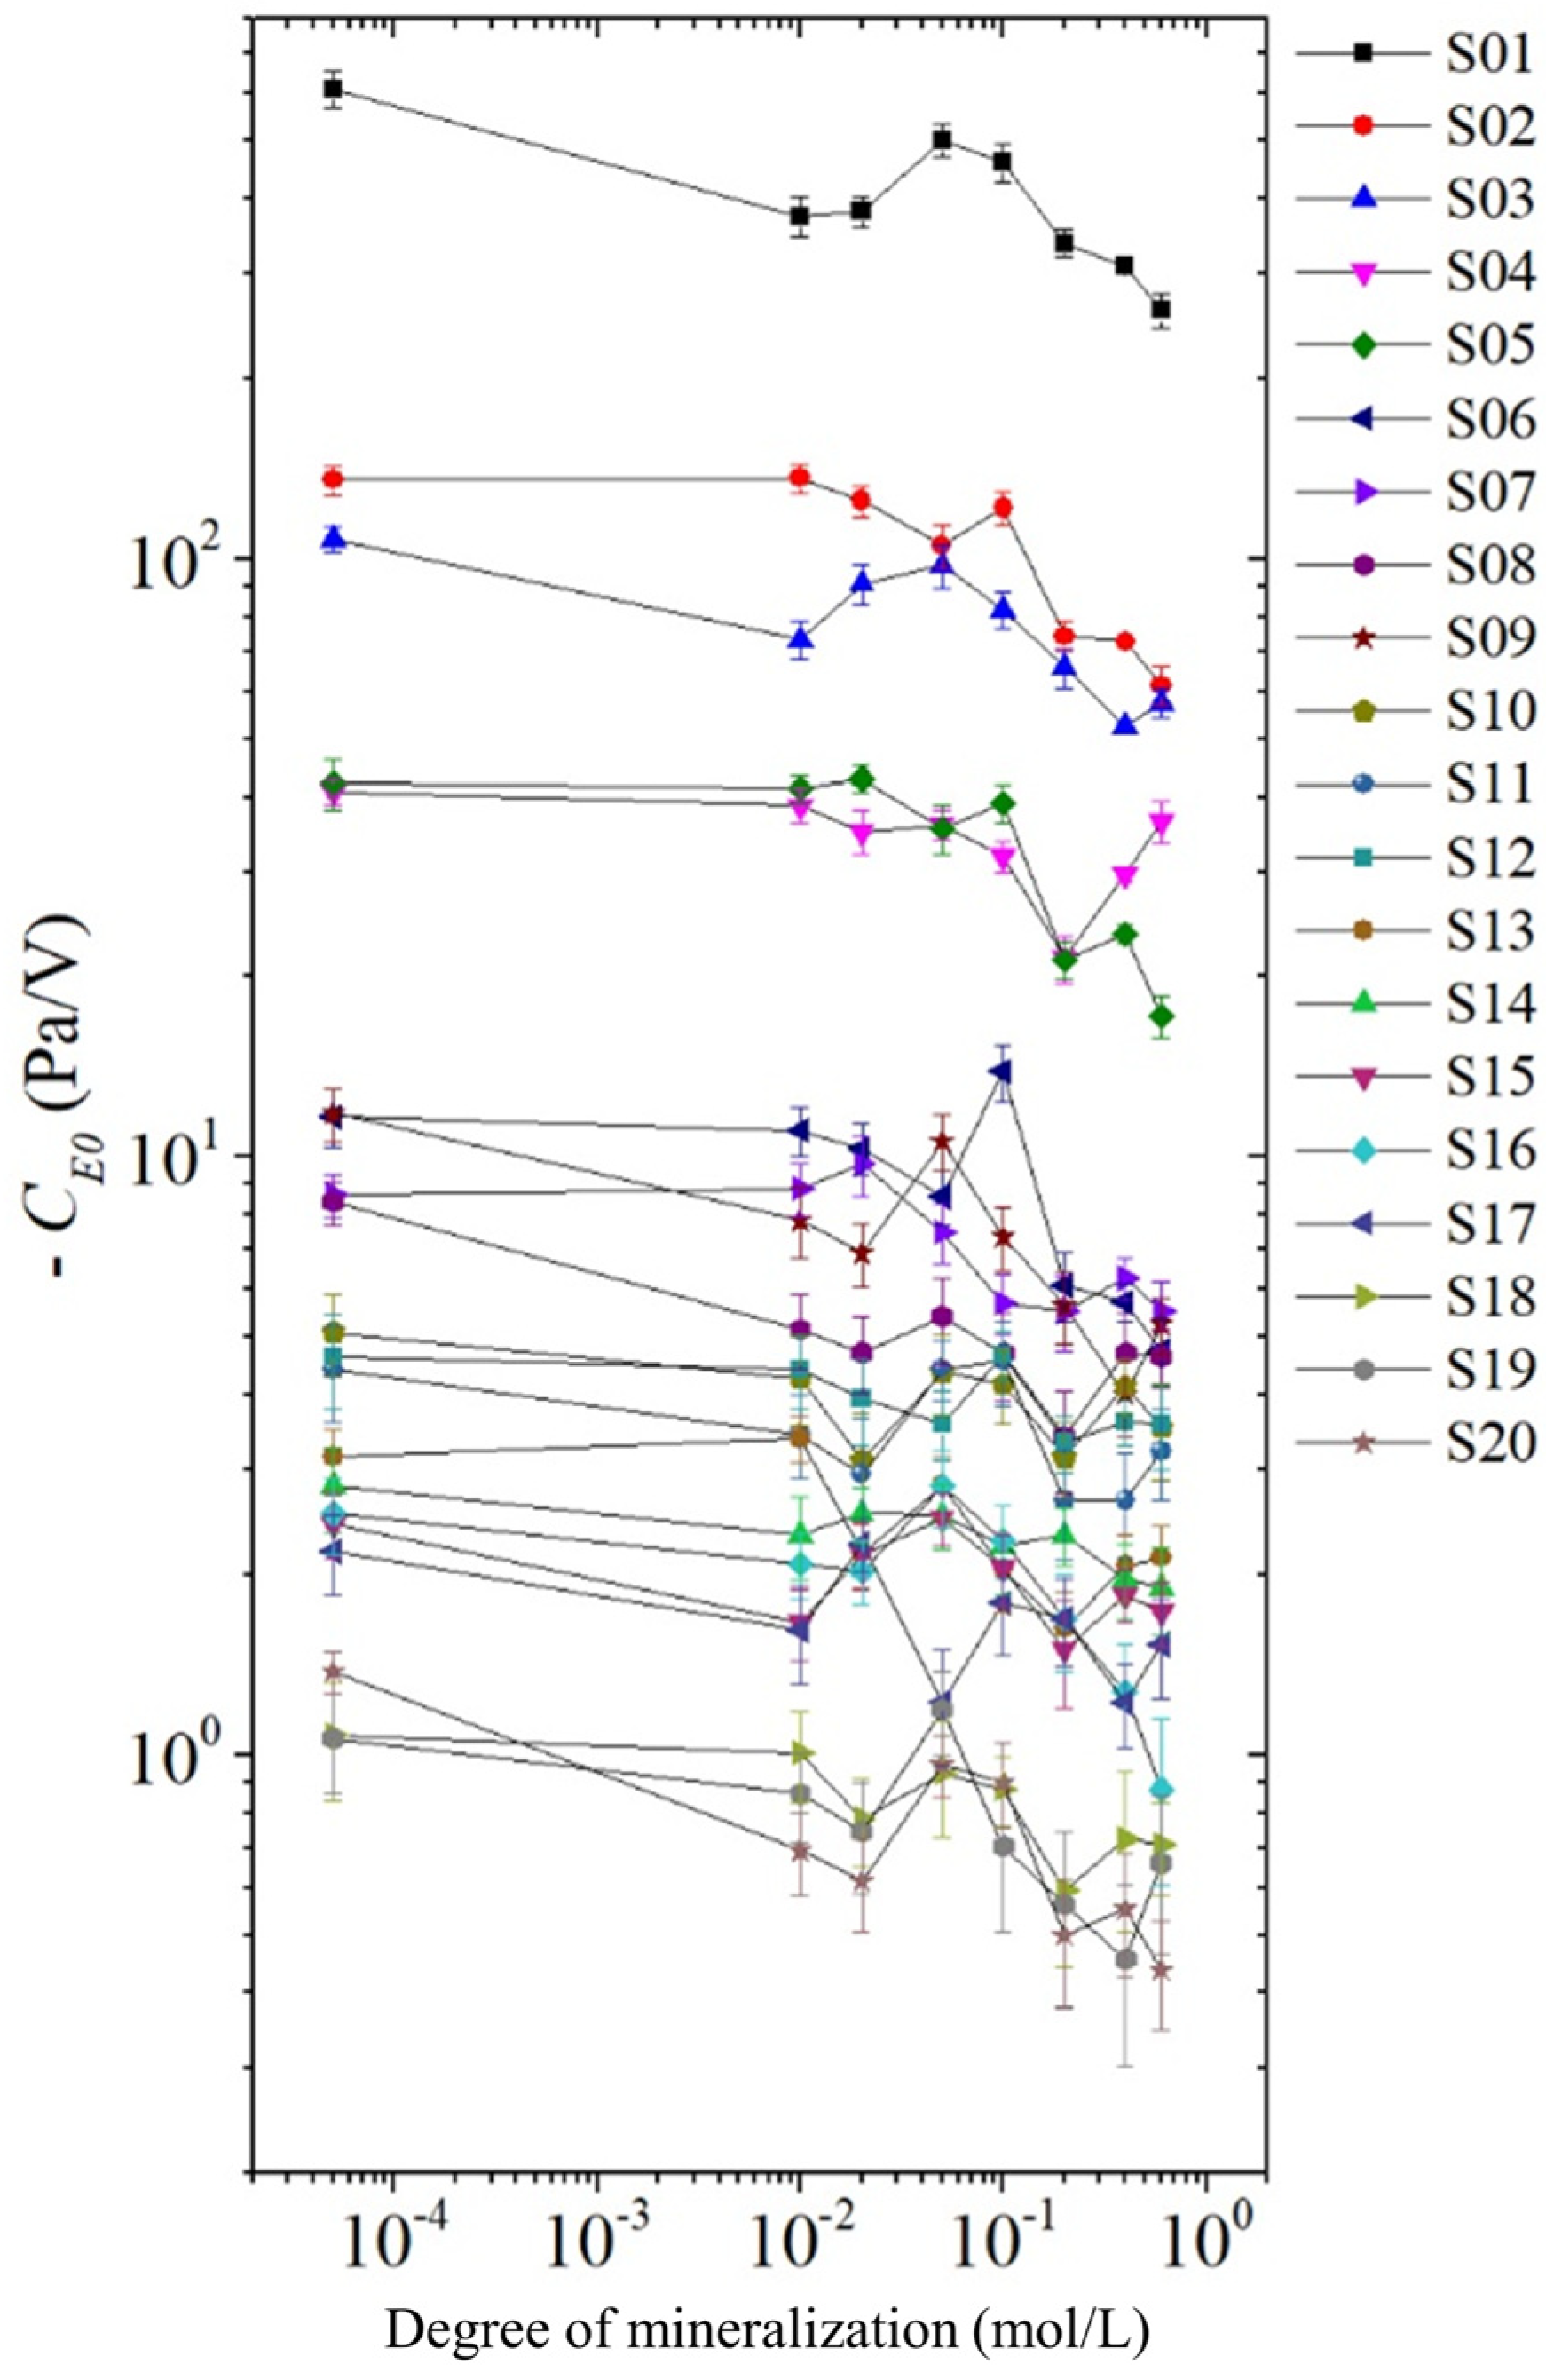
Figure 5 shows a set of measured signals of the electroosmotic pressure, where the rock sample is sandstone S12 (as shown in
Table 1), the mineralization is 0.4 mol/L, the excitation frequency is 0.05 Hz, and the number of excitation cycles is 30 cycles. For this example, the excitation frequency is 0.05 Hz, then the frequency of the electroosmotic pressure is also 0.05 Hz. This is shown as a sine wave with a period of 20 s in the time domain plot and as a peak at 0.05 Hz in the frequency domain (indicated by the vertical line in the figure). As shown in
Figure 5a, there are some peaks and valleys in the pressure signal measured by the pressure sensor
containing electroosmotic pressure
as well as strong background noise
(solid line), but these peaks and valleys are not in the period of 20 s, instead, they are similar to the pure background noise measured by the pressure sensor
(dashed line) in terms of waveforms, but there are some differences in amplitude. This indicates that the electroosmotic pressure signal
is essentially drowned in the strong background noise. As shown in
Figure 5b, the measured signal
of the pressure sensor
(solid line) has a less pronounced peak at the excitation frequency of 0.05 Hz, and is very similar to the pure background noise
measured by the pressure sensor
(dashed line) at the rest of the frequency.
3.4. Data Processing of Dual Pressure Sensor Method
Multiplying the obtained averaged conversion factor
of the two pressure sensors with the background noise
measured by the pressure sensor
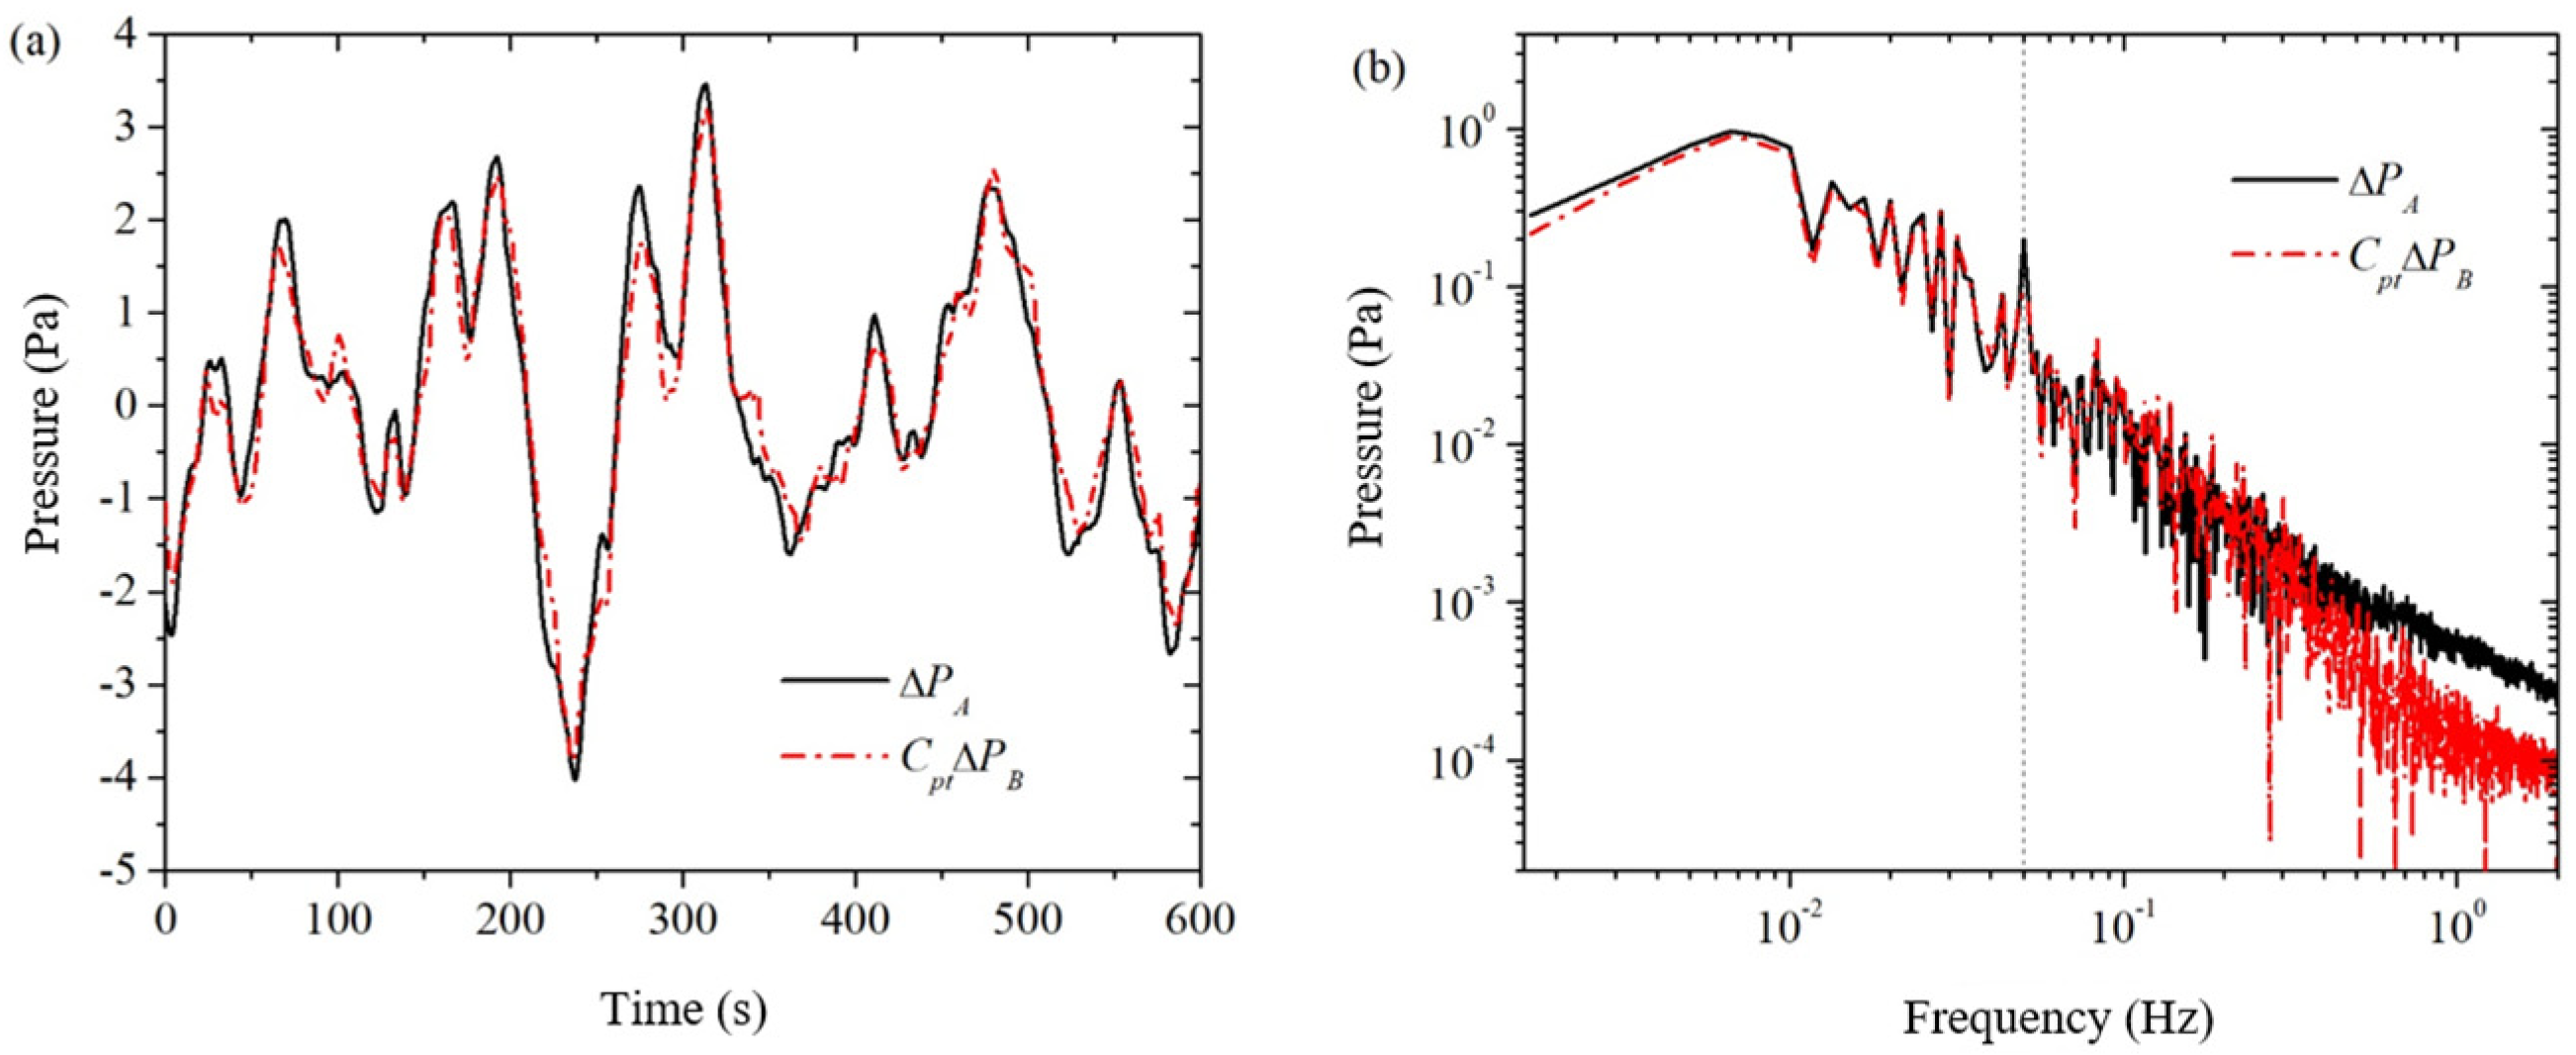
in the frequency domain yields the corrected background noise
, as shown by the dashed line in
Figure 6. In
Figure 6a, the corrected background noise
is very close to the actual measured signal
from the pressure sensor
. This indicates on the one hand that the electroosmotic pressure signal
is very weak relative to the background noise, and on the other hand the corrected background noise
can relatively well simulate the actual background noise
of the pressure sensor
. In
Figure 6b, the corrected background noise
is very close
in the frequency band of 0.3 Hz and below, but the difference between the two is larger in the frequency band above 0.3 Hz. This indicates that the dual pressure sensor method is more applicable to the lower frequency band of 0.3 Hz and below (hereafter referred to as the lower frequency band). Although the dual pressure sensor method for measuring electroosmotic pressure has a range of applicability in the frequency domain, this does not affect its application to the measurement of electroosmotic pressure coefficients. This is because the higher frequency band above 0.3 Hz (hereinafter referred to as the higher frequency band) of the electroosmotic pressure of the background noise of the magnitude of 1 mPa and below, if the higher frequency band of the electroosmotic pressure of the magnitude of 10 mPa and below, then the electroosmotic pressure coefficient is mainly dependent on the lower band of the electroosmotic pressure and the excitation voltage of the ratio of the electroosmotic pressure that is, at this time, the higher band of electroosmotic pressure and not the role of the actual.; If the higher frequency band electroosmotic pressure is off the order of 100 mPa and above, then the higher frequency band electroosmotic pressure itself has enough signal-to-noise ratio, and there is no need for the dual pressure sensor method. In addition, this paper uses the spline fitting interpolation method to correct the drift of the higher frequency band.
Subtracting the measured signal
from the pressure sensor
with the corrected background noise
from the pressure sensor
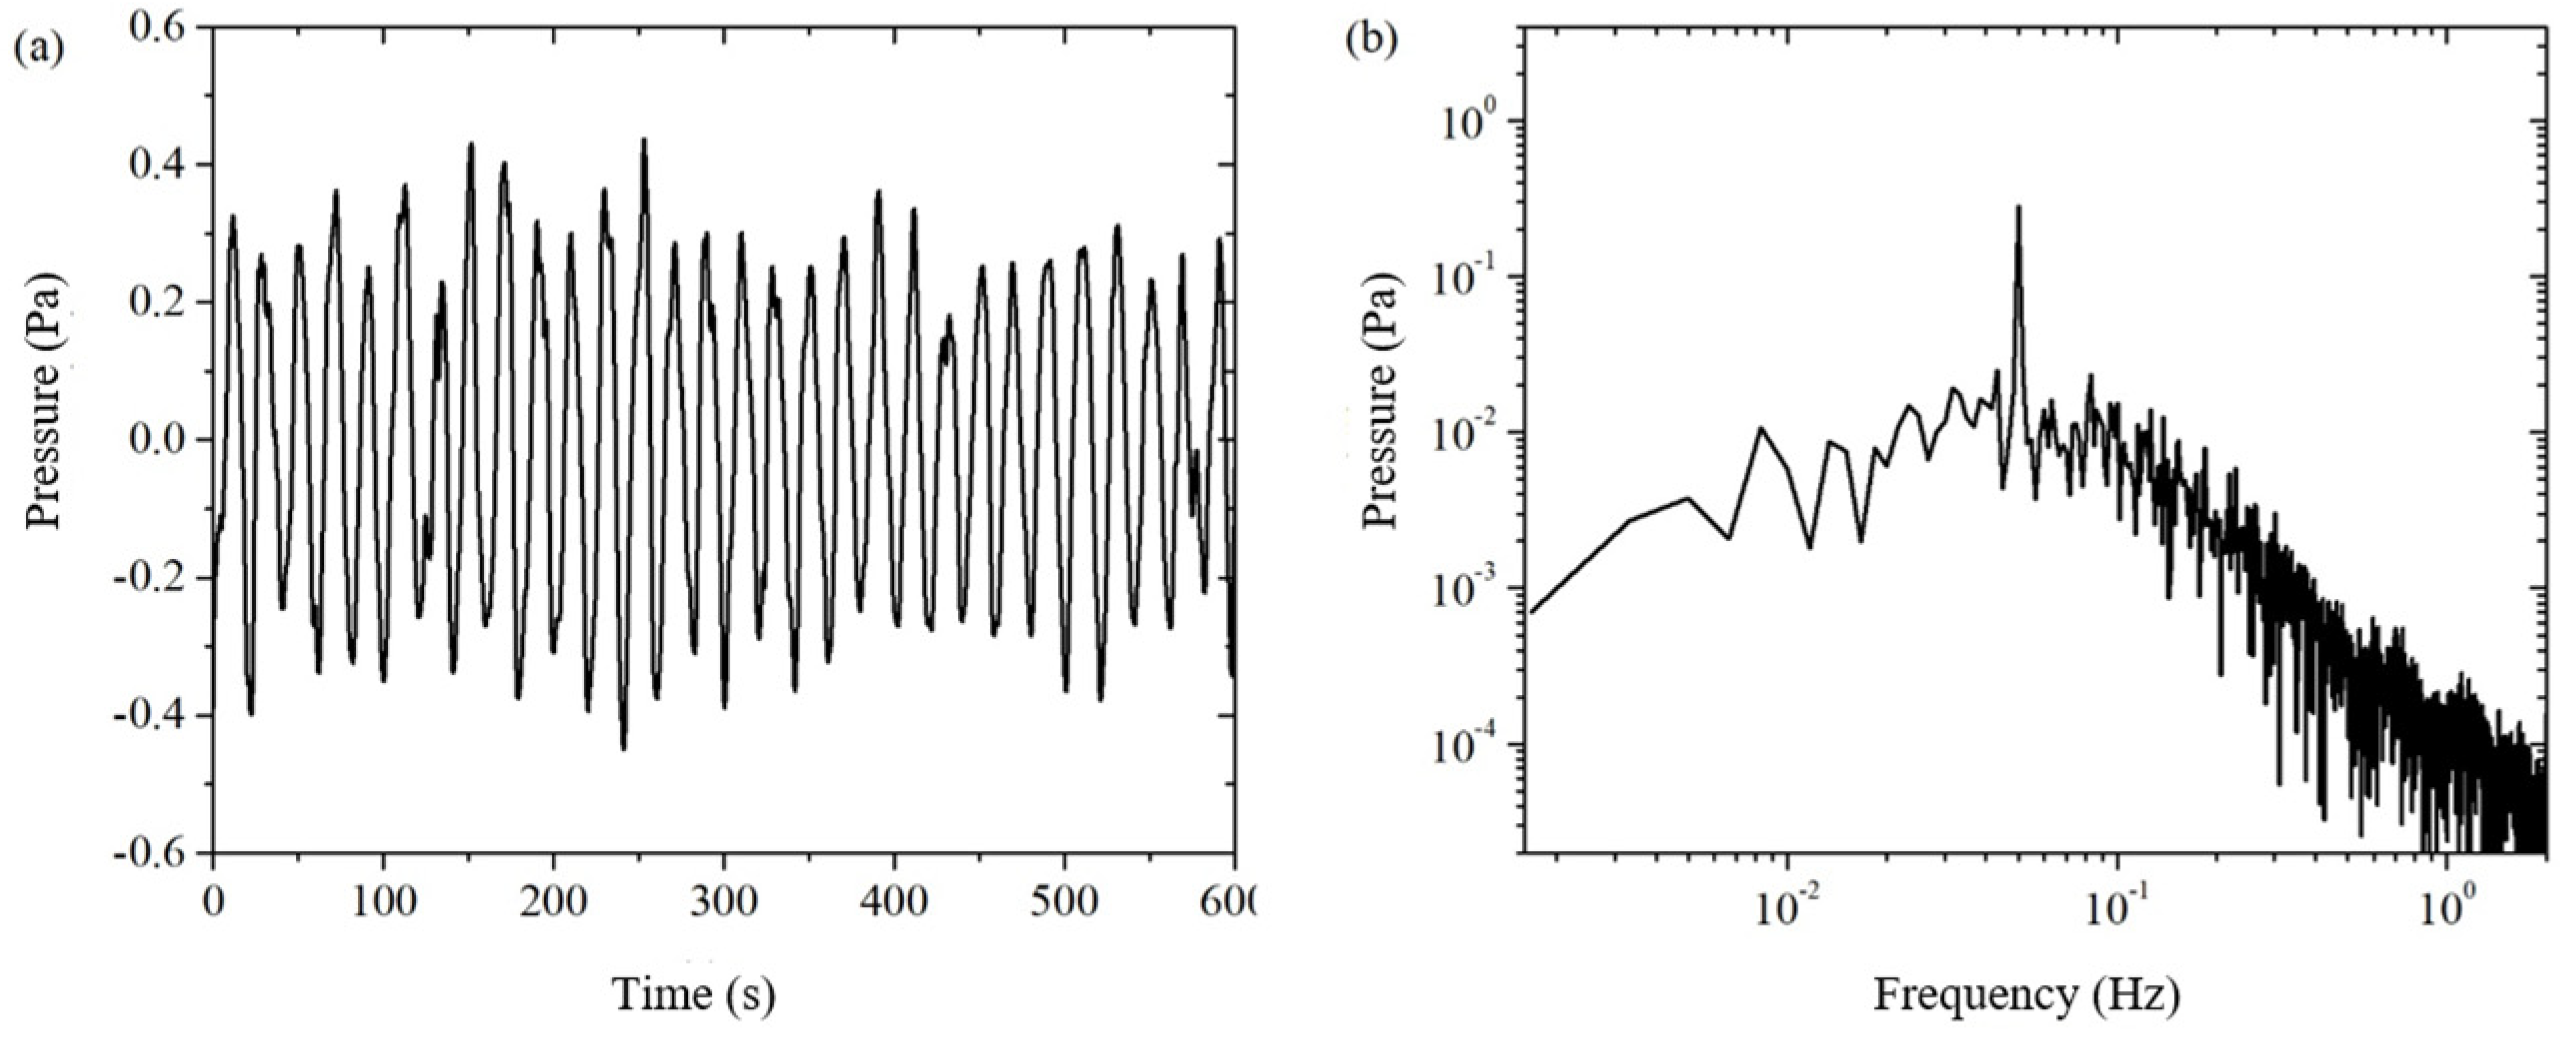
gives the electroosmotic pressure signal after using the weighted difference, noted as
. In
Figure 7a, we can clearly see the electroosmotic pressure signal with a period of 20 s. It can be seen that the signal-to-noise ratio of the electroosmotic pressure is improved by the weighted difference of the dual pressure sensors. In
Figure 7b, the electroosmotic pressure signal at 0.05 Hz is clearly much stronger than the residual background noise around it. By reading the amplitude of the excitation frequency signal and the critical frequency noise in the frequency domain plot, it can be obtained
.
In order to further suppress the residual background noise, this paper uses spline fitting interpolation to do further data processing on the electroosmotic pressure signal
. The electroosmotic pressure signal
after spline fitting interpolation is shown in
Figure 8. Comparing the time-domain signals before and after the spline fitting interpolation in
Figure 7a and
Figure 8a, we can see that the slow drift of the signal is completely eliminated; comparing the frequency-domain signals in
Figure 7b and
Figure 8b, we can clearly see that the noise with a frequency lower than the excitation frequency is well suppressed. The spline-fit interpolation method not only significantly improves the time-domain signal by eliminating the drift, but also helps to reduce the noise of the same frequency at the excitation frequency. This is because the excitation frequency is an integer multiple (equal to the number of cycles of the collected electroosmotic pressure, in this case, 30 times) of the fundamental frequency of the drift (which is related to the total measurement duration, in this case, 1/600 Hz), and a harmonic component of the drift will be mixed into the excitation frequency to form a cochannel noise. By eliminating the drift, that harmonic component of the cochannel noise is eliminated. The principle of the spline fit interpolation method makes it more suitable for higher frequency bands, and in this paper, it is used in the frequency bands above 0.05 Hz. By reading the amplitude of the excitation frequency signal and the critical frequency noise in the frequency domain plot, it can be obtained
. The environment disturbances such as temperature are well suppressed through the above method.
3.5. Comparison of Single/Dual Pressure Sensor Methods
In the traditional single pressure sensor method, a pressure sensor is used to directly obtain the time-domain signal of the electroosmotic pressure, and then the electroosmotic pressure is extracted by lock-in amplification (LIA), which is recorded as Single + LIA method [
19]. As can be seen from Equation (15), the electroosmotic pressure obtained by the single pressure sensor method is the measured value of the pressure sensor. Therefore, the solid line in
Figure 5a is the electroosmotic pressure time domain signal of the Single method. In this paper, the Double Pressure Sensor method, using two pressure sensors, obtains the time-domain signal of electroosmotic pressure through the weighted difference of the double pressure sensors as well as the spline fitting interpolation and then extracts the electroosmotic pressure through the Fast Fourier Transform (FFT), which is noted as the Double + FFT method. From the above, the time-domain signal of electroosmotic pressure of the Double method is shown in
Figure 8a.
In order to compare the electroosmotic pressure time-domain signals of the Single and Double methods, we combine the time-domain signals of the two methods in
Figure 9. The solid line in the figure is the time-domain signal of the Single method and the dashed line is the time-domain signal of the Double method. Comparing the two time-domain signals, it can be seen that the signal-to-noise ratio of the Double method is much higher than that of the Single method. LIA and FFT are two different data extraction methods, and their extracted data are formally different, so it is not intuitive to directly compare the Single + LIA method and the Double + FFT method. Therefore, this paper compares the Single method and Double method in terms of the FFT method and LIA method, respectively.
Let’s first compare the Single + FFT method with the Double + FFT method of this paper in terms of the FFT method, as shown in
Figure 5 and
Figure 8. The solid line in
Figure 5a is the electroosmotic pressure time-domain signal of the Single method, then the value of the solid line in
Figure 5b at the excitation frequency of 0.05 Hz is the amplitude of the electroosmotic pressure
of the Single + FFT method. In order to evaluate the signal-to-noise ratio of the electroosmotic pressure signal, the maximum amplitude of the noise at several frequency points near the excitation frequency is selected as an estimate of the actual noise amplitude at the excitation frequency, which is obtained
.
Figure 8a is the time-domain signal of electroosmotic pressure measured by the Double method, and then the value of
Figure 8b at the excitation frequency is the amplitude of electroosmotic pressure by the Double + FFT method. The electroosmotic pressure signal and its error estimation
of the Double + FFT method can be obtained by reading the frequency domain
Figure 4,
Figure 5,
Figure 6,
Figure 7 and
Figure 8b.
Obviously, the signal-to-noise ratio of electroosmotic pressure obtained by the Double + FFT method in this paper is higher than that of the Single + FFT method.
Then, we compare the Double + LIA method with the traditional Single + LIA method from the aspect of the LIA method, as shown in
Figure 10. In the figure, the black solid line is the output data of the traditional Single + LIA method, whose input data comes from the time-domain signals of the Single method; the red solid line is the output data of the Double + LIA method, whose input data comes from the time-domain signals of the Double method; and the dashed line is the output data of the reference group, whose input data is a purely sinusoidal signal, which is used for interpreting the meanings of the LIA output curves. The LIA needs to be parameterized for its low-pass filter. The low-pass filter for the example in the figure is a 4th-order inverse Chebyshev filter with a cutoff frequency of 0.03 Hz.
Figure 10b shows the three-phase curves of the lock-in amplifier LIA output. (1) The output data from the reference group (dashed line) converges quickly to 0° and then remains constant. This indicates that the lock-in amplifier detects a sinusoidal signal with a phase value of 0° and no noise. (2) The output data (solid red line) of the Double + LIA method oscillates slightly between −60° and −75°. This indicates that the electroosmotic pressure signal obtained from the Double method is detected by the lock-in amplifier with a phase value between −60° and −75° and little noise. (3) The output data (black solid line) of the Single + LIA method oscillates between −15° and 105°. This indicates that the electroosmotic pressure signal obtained by the Single method is detected by the lock-in amplifier, but it is noisy. Comparing the red solid line with the black solid line, it can be seen that the signal-to-noise ratio of the Double + LIA method is higher than that of the Single + LIA method.
Figure 10a shows three amplitude curves of the lock-in amplifier LIA output. (1) The output data of the reference group (dashed line), first increases rapidly from zero, then oscillates, and finally stabilizes at 0.285 Pa. This indicates that the sinusoidal input signal is detected by the lock-in amplifier with a magnitude of 0.285 Pa and no noise. (2) The output data of the Double + LIA method (red solid line), first increases rapidly from zero, then oscillates between 0.25 and 0.34 Pa, and finally settles at 0.275 Pa. This indicates that the electroosmotic pressure signal has an amplitude of about 0.275 Pa with little noise. (3) The output data of the Single + LIA method (black solid line), first increases rapidly from zero, then oscillates between 0.13 and 0.32 Pa, and finally fluctuates approximately sinusoidally between 0.13 Pa and 0.225 Pa. This indicates that the electroosmotic pressure signal has an amplitude of about (0.13 + 0.225)/2 Pa ≈ 0.18 Pa and has a large amount of noise. Comparing the red solid line with the black solid line, it can be seen that the signal-to-noise ratio of the Double + LIA method is better than that of the Single + LIA method.
From both phase and amplitude, it can be seen that the signal-to-noise ratio of electroosmotic pressure obtained by the Double + LIA method is higher than that of the conventional Single + LIA method.
In addition, comparing the results of the Double + FFT and Double + LIA methods, it can be found that the amplitude of the extracted signals is about the same for the data extracted using the FFT method and the data extracted using the LIA method, but the amplitude and the error estimation can be obtained automatically using the FFT method, while the amplitude needs to be obtained manually and it is difficult to obtain the quantitative error estimation using the LIA method. The same is true when comparing the results of the Single + FFT method and the Single + LIA method.
