1. Introduction
Air is recognized as a global threat to human health by the World Health Organization (WHO). It also poses challenges to achieving the Sustainable Development Goals of the United Nations as outlined in the 2030 agenda, in particular SDG 3 [
1]. The adverse impact of poor air quality extends to various respiratory conditions, such as asthma and chronic obstructive pulmonary disease (COPD) [
2,
3]. In addition, it has been linked to the development of diseases such as diabetes, lung cancer, cardiovascular problems, and an increased prevalence of psychological disorders affecting mental health [
4,
5]. The detrimental effects of air pollution go beyond human health, as it is associated with the occurrence of acid rain and smog. Additionally, it can harm animals and cause damage to vegetation and food crops [
6,
7].
Air quality monitoring typically relies on costly stationary or mobile stations, needing frequent calibration and skilled operators for precise data collection. Yet, these setups often lack spatial coverage, hindering accurate measurements, notably in economically constrained regions. To tackle this, affordable air quality sensors have emerged, enabling deployment in resource-limited areas [
8]. However, it is vital to acknowledge their reduced accuracy compared to professional stations. Consequently, they are mainly used to detect specific patterns in pollution dynamics, such as pinpointing pollution events, rather than tasks demanding precise measurements. This innovation addresses accessibility issues but underscores the importance of considering sensor limitations in air quality assessments [
9,
10].
Meteorology plays a pivotal role in understanding and managing air quality, as environmental conditions greatly influence the concentrations of pollutants in the atmosphere. Meteorological factors such as temperature, humidity, wind speed, and atmospheric pressure directly impact the dispersion and transformation of pollutants emitted from various sources such as industrial activities, transportation, and natural phenomena such as wildfires [
11]. For instance, stagnant atmospheric conditions can lead to the buildup of pollutants in urban areas, exacerbating air quality issues and posing serious health risks to populations. Conversely, strong winds can disperse pollutants over large areas, affecting regions far from their sources [
12]. By integrating meteorological data into air quality monitoring and forecasting systems, policymakers and environmental agencies can better assess pollution levels, anticipate potential air quality events, and implement timely interventions to mitigate the adverse impacts on public health and the environment. Therefore, meteorology serves as a critical tool in understanding the complex interactions between atmospheric dynamics and air quality essential for developing effective strategies to protect human health and ecosystems from the detrimental effects of air pollution [
13].
Unfortunately, existing weather stations in many low-income countries are affected by the same issues as air quality stations: high cost of equipment and lack of trained personnel for maintenance and operation [
13]. A possible solution to this lack is the integration of low-cost automatic weather stations with air quality systems powered by the internet of things (IoT). By combining real-time meteorological data with air quality measurements, these systems provide a comprehensive understanding of atmospheric conditions and pollutant levels [
14]. IoT-enabled sensors can continuously collect data on temperature, humidity, wind speed, atmospheric pressure, and various pollutants, allowing for precise monitoring and analysis. This integration facilitates early detection of air quality issues, enabling proactive measures to be taken to protect public health and the environment [
15,
16].
The scalability and flexibility of IoT technology allow for the deployment of low-cost sensor networks in diverse geographical locations, far from urban areas, providing comprehensive coverage and enhancing the accuracy of environmental assessments [
17]. Additionally, the remote monitoring capabilities of these systems enable efficient data collection and analysis, reducing the need for manual intervention and minimizing operational costs [
18,
19]. Overall, the integration of automatic weather stations with air quality systems through IoT technology represents a powerful approach to environmental monitoring, offering timely insights and enabling informed decision making for sustainable development and resource management [
20,
21].
The use of low-cost embedded hardware in a tropical climate poses a unique additional challenge for the technology developed to monitor air quality [
22]. The high temperatures and humidity levels prevalent in tropical regions can affect the performance and reliability of monitoring equipment. These conditions can lead to accelerated degradation of sensors, reducing their accuracy and lifespan. Additionally, intense rainfall and thunderstorms common in tropical climates may disrupt communication systems and power supply to monitoring stations, hindering data transmission and collection [
23,
24]. To overcome these challenges, researchers and engineers need to design new sensor systems that can withstand the rigors of tropical climates [
23,
24,
25]. By developing tailored solutions that account for the specific challenges of tropical climates, researchers and policymakers can ensure the effectiveness and reliability of air quality monitoring systems in these regions, ultimately supporting efforts to safeguard human health and the environment.
Cuban government agencies grapple with limited resources in monitoring air quality, lacking continuous automated devices. They rely on localized systems without remote capabilities, resulting in irregular manual sample collection and analysis. This situation limits long-term data accessibility, hindering comprehensive studies on historical trends. Meanwhile, at the Central University “Marta Abreu” of Las Villas (UCLV), collaboration with international partners has led to the development of systems for measuring air quality variables [
25,
26] and meteorological parameters [
27]. These systems are based on open technologies and low-cost calibrated sensors, designed to provide valuable information for decision making [
28,
29]. However, integration and interoperability issues persist, causing fragmented data collection and analysis.
To address the abovementioned problems, the present research aims to create a unified IoT platform gathering data from diverse sources for understanding tropical environmental conditions. This paper presents the designs of a versatile monitoring system utilizing IoT technology to analyze air quality and climate parameters suitable for urban or remote areas. It introduces an affordable IoT solution for measuring air quality and weather conditions, particularly focusing on their interrelation in tropical environments.
2. Background
Several companies have recognized the need for integrated solutions in monitoring air quality and meteorological parameters, simplifying IoT technology for wider adoption [
30]. Well-known systems such as AQMesh [
31] and Libelium’s Smart Environment [
32] or Smart Environment Pro [
33], utilizing cost-effective sensors, have undergone extensive real-world testing and deployment. Some of these systems are modular, allowing users to choose specific sensors to address their particular issues.
Alternatively, users can combine open-source building blocks and build their own system. Academic research delves deeper into this area, utilizing various platforms and technologies, as presented in
Table 1. These studies contribute to a more profound understanding, forming the basis for further investigations. This approach requires greater technical background knowledge on the part of the user. It is clear from
Table 1 that temperature and humidity are the most commonly monitored parameters in IoT technologies [
21]. Wind direction and speed, solar radiation, atmospheric pressure, and precipitation are also included when meteorological parameters are to be measured. Parameters such as VOC (Volatile Organic Compounds), PM (Particulate Matter), O
3 (Ozone), SO
2 (Sulfur dioxide), CO
2 (Carbon dioxide), CO (Carbon monoxide), and NO
2 (Nitrogen dioxide) are the base of most air quality monitoring systems. For this kind of research, ESP32, NodeMCU, and Raspberry Pi are widely used as processing units, either independently or in conjunction with add-on boards that extend their communication capabilities [
34]. Many systems that can be found in the literature measure either air quality or weather parameters. Only a few have made the integration of both, and in some cases, wind speed and direction are not taken into account. The few publications that integrate all these parameters reflect the importance of the joint measures for posterior analysis.
2.1. Communication Technologies
The IoT relies on efficient communication technology for seamless device connectivity and data exchange. WiFi, GSM, and LoRa are commonly used (see
Table 1), each with distinct advantages [
49]. WiFi offers high-speed data transfer suitable for real-time applications such as home automation [
50]. However, WiFi is limited to short distances. GSM provides wide coverage, ideal for remote areas and long-range applications such as asset tracking [
50], but its usage depends on the availability of telecommunication providers for long-range functionality. LoRa specializes in long-range, low-power communication, suitable for widespread deployment in sectors such as agriculture, smart metering, and logistics. Its ability to pass through obstacles and send signals over several kilometers, coupled with its low-cost infrastructure, makes LoRa an attractive option for IoT deployments that require long-range connectivity and extended battery life [
51]. Therefore, the LoRa protocol emerges as a viable alternative capable of facilitating communication over longer distances and in areas where GSM coverage is not available. For this reason, LoRa has been selected as the optimal communication technology for this work.
2.2. Software Platforms for IoT
Software IoT platforms have transformed connectivity, managing vast data volumes from billions of devices, crucial for informed decision making. These platforms equip the infrastructure to acquire, process, store, and analyze IoT data. Common tools for monitoring air quality and weather include ThingSpeak, The Things Network, Node-RED, and Grafana [
52]. ThingSpeak offers an open-source platform for defining data channels and capturing data from various sources using HTTP or MQTT protocols, while The Things Network utilizes LoRa technology for decentralized data acquisition [
53]. Although ThingSpeak and The Things Network offer significant capabilities, they are not accessible without cost. In contrast, Node-RED excels in data acquisition and processing, InfluxDB in storage efficiency, and Grafana in data visualization. Combining these tools creates a flexible IoT software platform free of cost and able to meet specific research needs.
Besides the combination of Node-RED, InfluxDB, and Grafana, other combinations of freely available software blocks are also available to build an IoT platform. In addition to InfluxDB, Prometheus and QuestDB can also be used to process time series data. Prometheus is widely used for monitoring, while QuestDB shows reliable performance despite its newness. InfluxDB, though with weaker performance, remains a viable option because it is easy to program and has adequate security capabilities [
54,
55]. Node-RED has limited possibilities to visualize information. Instead, Grafana, Kibana, or Metabase can be integrated in the IoT software platform. However, Kibana and Metabase have limitations compared to Grafana’s flexibility, data handling, and customization options, making Grafana preferable in scalable scenarios [
56,
57,
58].
3. Unified IoT Platform System Design
The preceding section provided an overview of the possibilities to construct a low-cost IoT platform, detailing some essential decisions related to the use and selection of specific building blocks. The following section gives a detailed description of the constructed platform.
3.1. Hardware
Figure 1 shows the proposed hardware architecture. It consists of a “remote sensor system” and a “collector system”. The remote sensor system consists of a Bresser 5-in-1 weather station that measures the meteorological parameters and an in-house developed sensor box (i.e., HZS-GARP-AQ-04) containing an ESP32-based development board named TTGO TBeam that collects all acquired data and sends them to the collector system using LoRa communication. The collector system contains the same ESP32 (i.e., TBeam Receiver) to receive all data, which is connected to a Raspberry Pi used for edge computing.
3.1.1. Remote Sensor System
The Bresser weather station model 7,002,510 consists of a device containing the external sensors that measure five different meteorological parameters (
Table 2) and a base station [
59]. Both devices are powered by three 1.5 V AA batteries that allow continuous operation for several months. The external sensor is programmed to capture data at 45-s intervals and transmits this information wirelessly to the base station using frequency shift keying (FSK). Upon transmission, the TBeam board within the HZS-GARP-AQ-04 system intercepts these measurements for further processing.
The system used for air quality measurements is a variation of a previously developed sensor box (i.e., HZS-GARP-AQ-04) [
25]. It utilizes the TTGO TBeam development board as its foundation. That board is equipped with an ESP32 microcontroller, PSRAM for storage, and WiFi and Bluetooth capabilities for short-distance communication. Additionally, a SX1276 Radio module, enabling LoRa or FSK communication, facilitates long-range communication. The sensors deployed in the HZS-GARP-AQ-04 (
Table 3) were calibrated using low-cost methods as described elsewhere [
28,
29]. The specifications for all the sensors’ environmental operating conditions suggest that they can be used in a tropical environment.
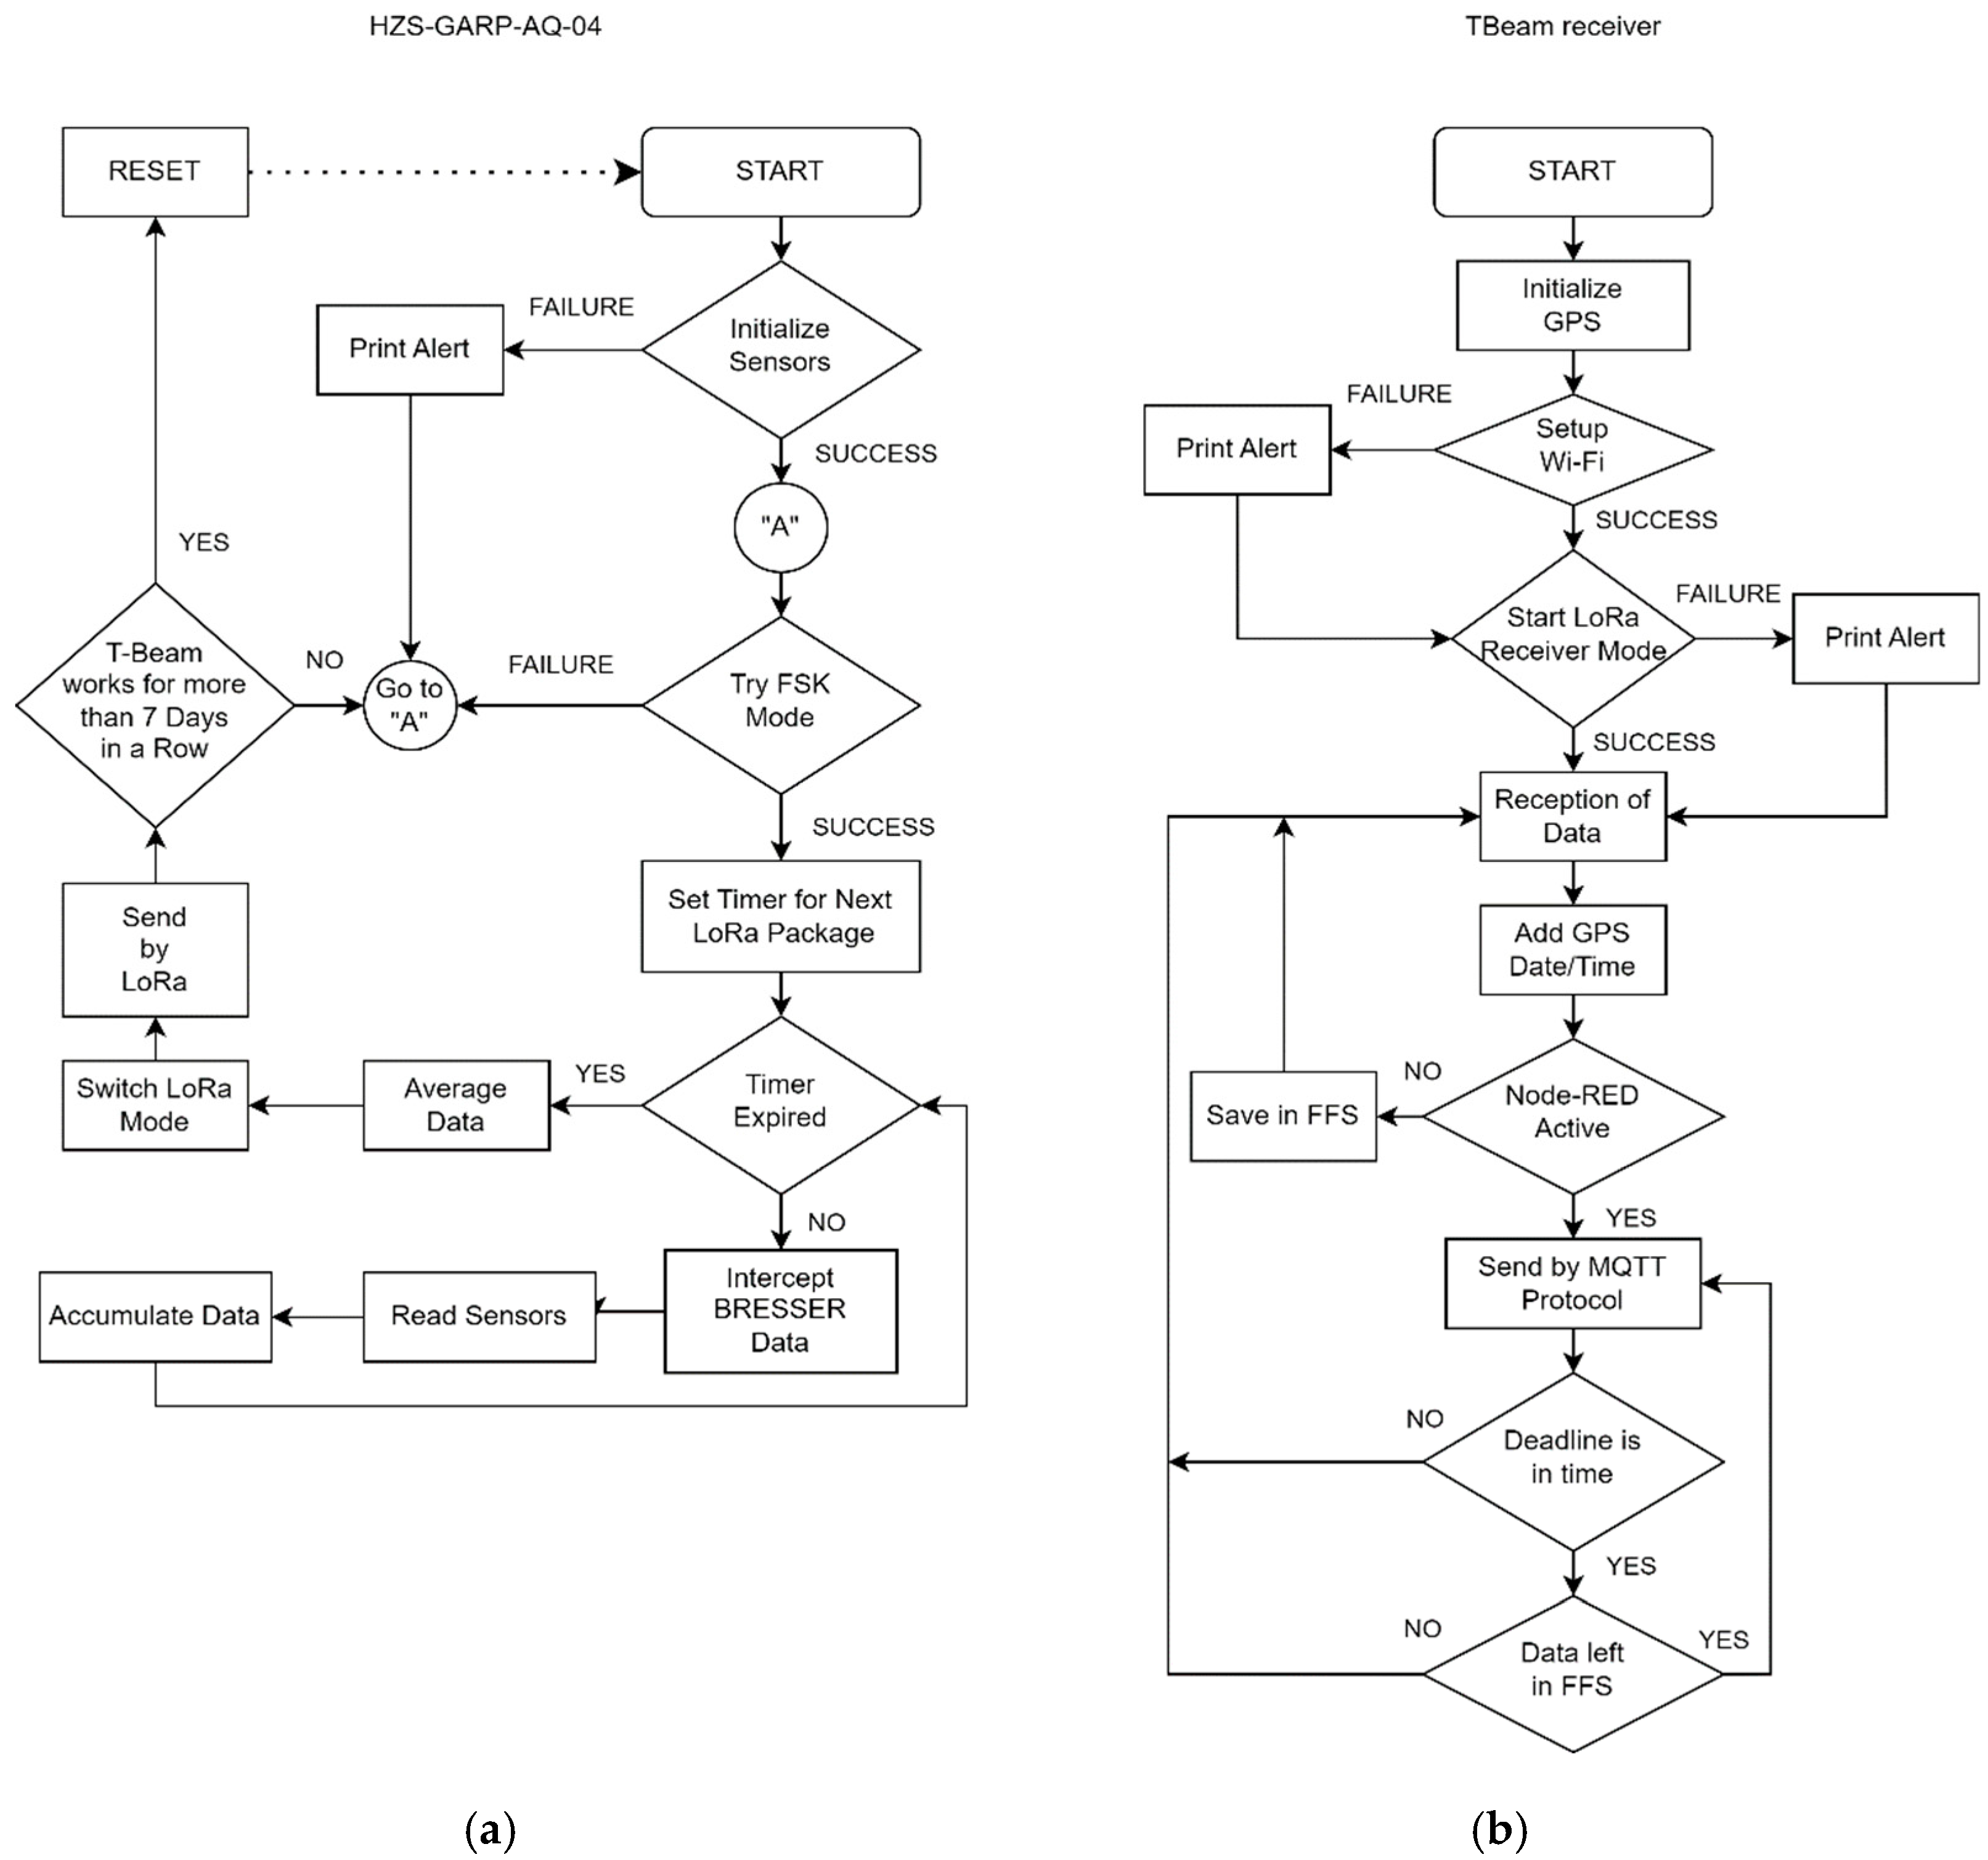
The TBeam inside the HZS-GARP-AQ-04 receives, through wireless FSK communication, the data sent by the Bresser station. The decoding process for extracting information transmitted by the Bresser station and acquiring it with a TBeam board is detailed in [
27]. The duty cycle of the TBeam board in the HZS-GARP-AQ-04 handles the measurements of the meteorological station and the sensors interconnected directly to it which send data at different rates. In addition, it calculates the average values for each sampling period (
Figure 2a). The flowcharts in
Figure 2a also include a control for communication interruptions and can trigger a board reset if needed.
3.1.2. Collector System
The TTGO TBeam-based receiver collects the information from the “remote sensor system” through LoRa protocol using an 868 MHz frequency. MQTT (Message Queuing Telemetry Transport) protocol is used to establish a connection between the TBeam Receiver and the Raspberry Pi using the Mosquitto broker. MQTT is a lightweight messaging protocol designed for efficient communication between IoT devices and resource-constrained environments. The TTGO TBeam board acts as a sensor or actuator device, while the Raspberry Pi acts as a central host. The Mosquitto broker acts as an intermediary for message exchange.
The Raspberry Pi 4 Model B, receiving data via MQTT from the TBeam Receiver, boasts a Quad-core 64-bit ARM Cortex (Cambridge, UK) processor clocked at 1.5 GHz. It packs 2 GB of RAM and operates on a 32 GB SD card. It is connected to the TBeam Receiver’s network for data exchange by Ethernet and WiFi. Its robust computational power is vital for future edge computing and prediction algorithms, addressing challenges inherent in IoT device computing, which demand adherence to strict requirements [
60,
61]. The Raspberry Pi implements an open-source IoT architecture comprising back-end components (Node-RED, MQTT Broker, and InfluxDB) and a front-end component (Grafana), as illustrated in
Figure 3. Node-RED acquires and processes received information, storing it in InfluxDB, and presenting it on a Grafana dashboard.
In the Raspberry Pi, the logic followed after the capture of each data packet consists of adding a temporary identifier to the frame before sending it to an “eclipse-mosquitto” broker via MQTT. In case of an error during this process, the frame is saved in the internal storage (SPIFFS), to be returned to the received state by LoRa. If the sending is successful, it is finally checked for unsent iterations before returning to the receiving state of the system.
Figure 2b shows the flow followed by this device. The TBeam Receiver acts as a gateway, is located indoors, and must be connected to the same network as the Raspberry Pi to achieve data transfer. To enhance its protection and portability, a case was fabricated using an Ender 5 3D printer.
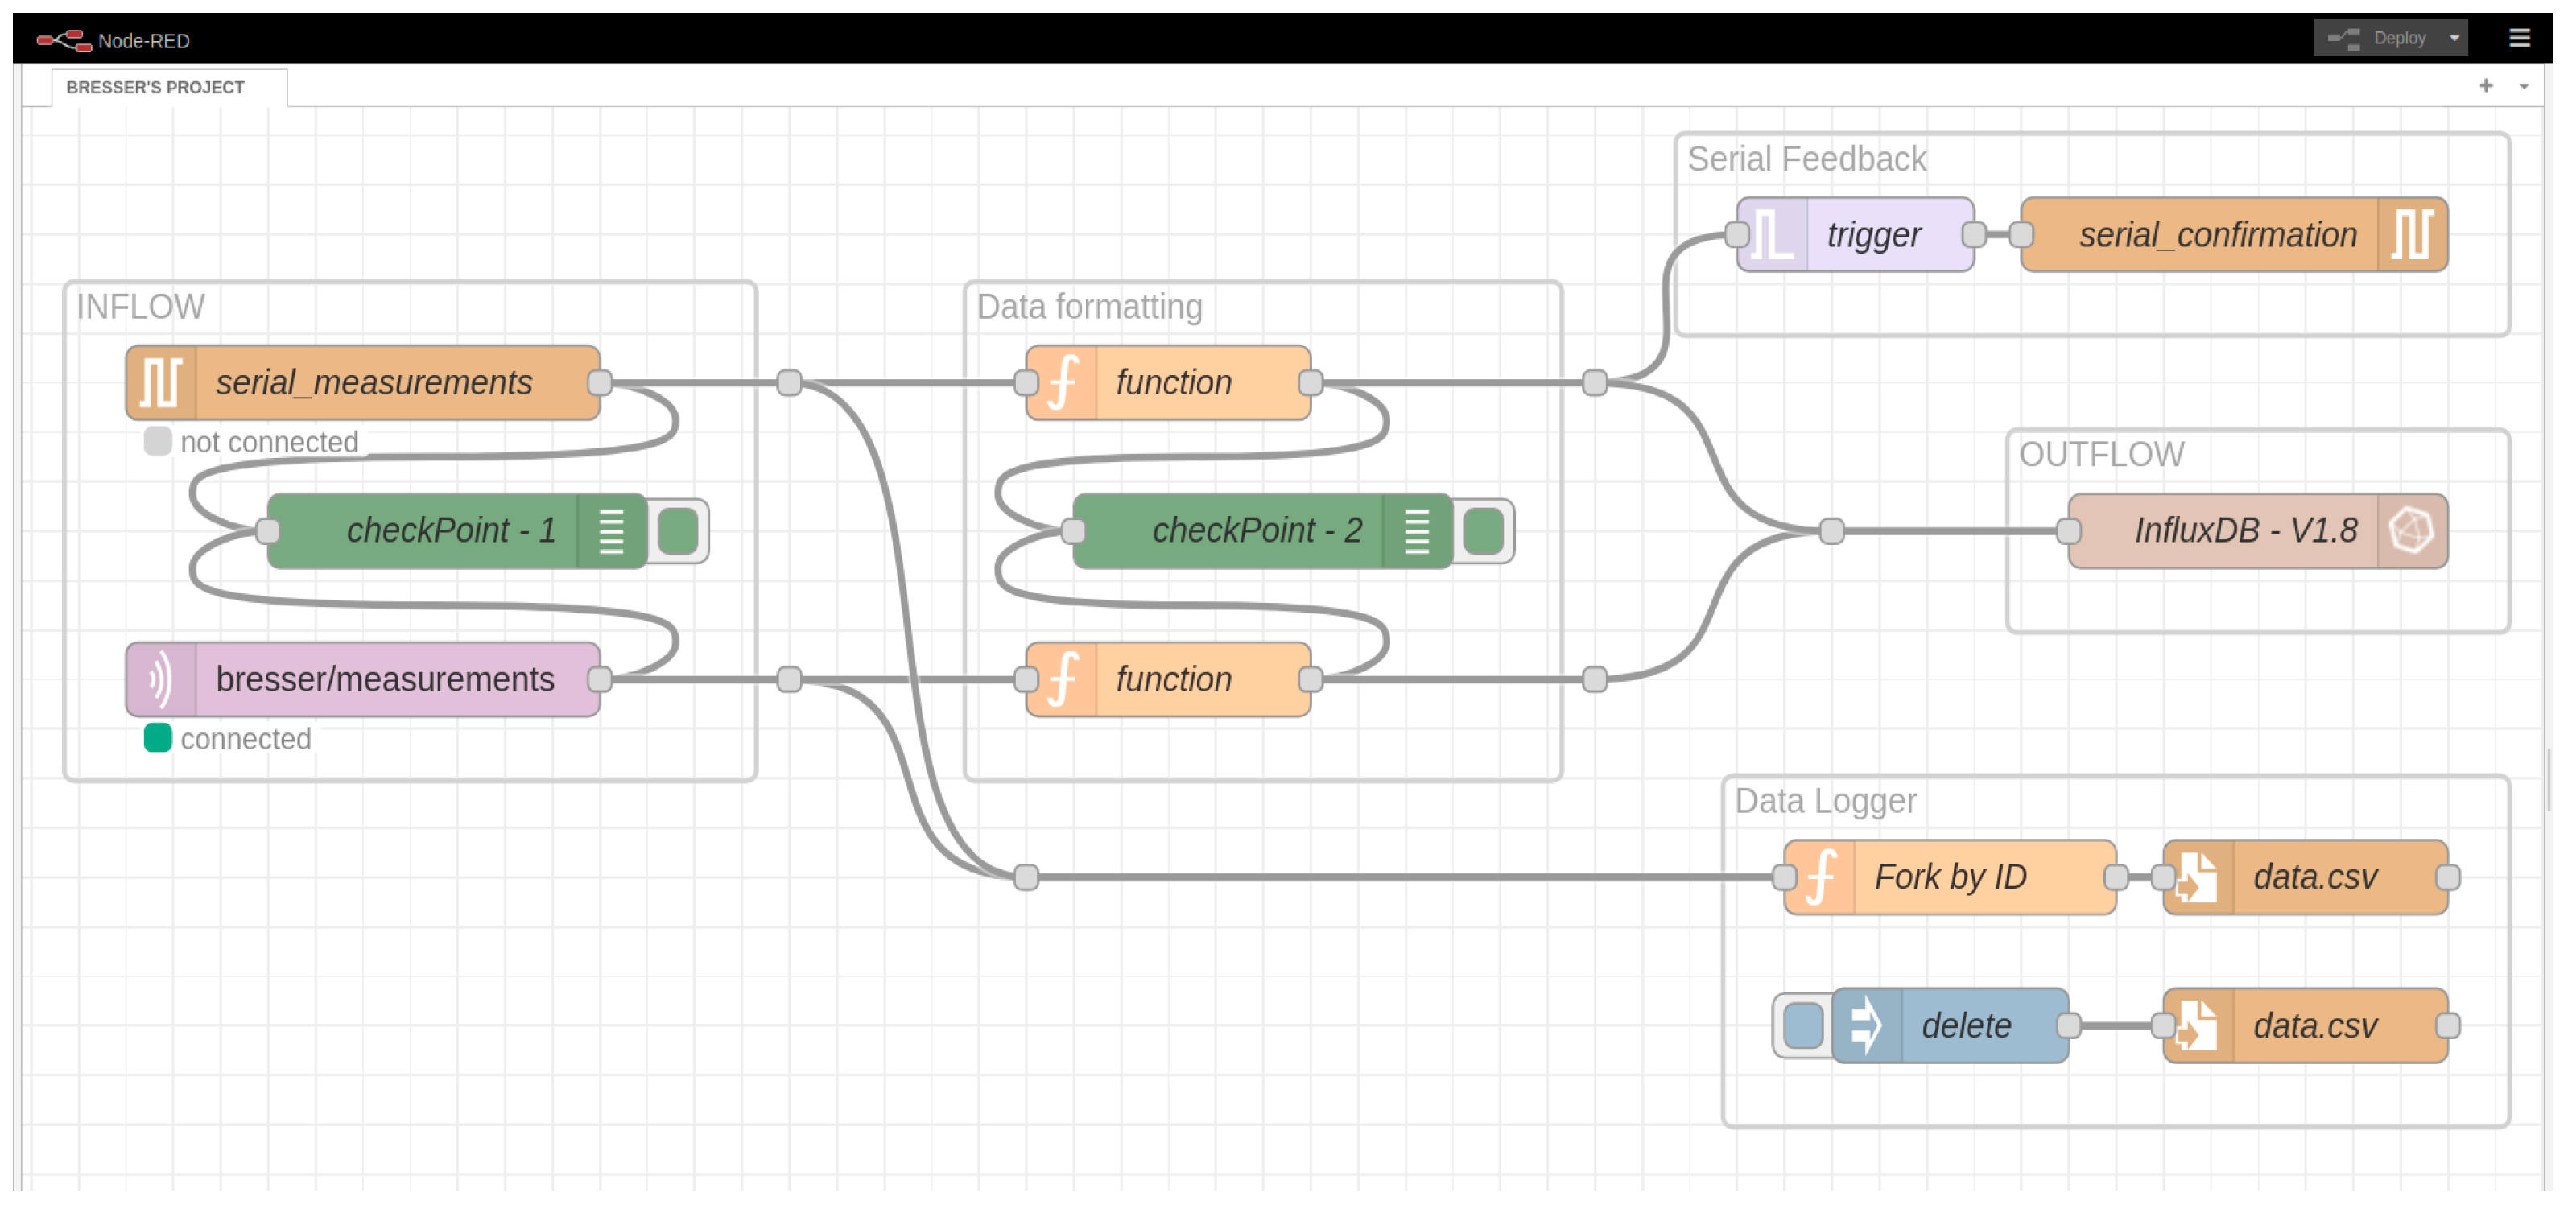
The IoT platform Node-RED utilizes the MQTT broker to process data from the remote sensor system. This visual tool employs flow programming, easing connectivity among hardware devices, APIs, and online services [
62,
63]. Data variables are parsed and organized into an ordered pattern within the InfluxDB database.
Figure 4 illustrates the control flow ensuring data packet integrity, segmented into functional blocks for clarity.
The flow features two input types: “serial” for direct USB connection and “MQTT” utilizing the broker as an intermediary. Data formatting and validation occur in the “data formatting” block, producing JSON output structured with a UNIX timestamp compatible with InfluxDB. Serial input confirms data reception via a feedback node, while MQTT relies on broker mechanisms and QoS for integrity.
Timestamp-based identification maintains data integrity for transmission resumption. Incoming data is stored in a .CSV file for easy access and inspection facilitated by the “data logger” block. Real-time monitoring allows anomaly detection within the system architecture, aiding in data stream filtering for further analysis in external programs like MATLAB, enhancing data processing capabilities.
Grafana takes information from a database in InfluxDB. The dashboard was developed to offer a user-friendly interface, presenting key information and aiding in data comprehension. It comprises two primary sections: meteorological variables and air quality parameters. Each section displays the latest measurements. Furthermore, the Grafana dashboard includes historical graphs that enable users to track the trends and behaviors of variables over time. The data visualization gives insight to the user about the environmental dynamics, assisting users in identifying data patterns, anomalies, or trends.
4. Experimental
To assess the performance of the unified IoT platform system design outlined in the previous section, a 15-day experiment was conducted in a real outdoor setting. For outdoor testing, the remote sensor system was installed on the roof of the Faculty of Electrical Engineering at UCLV, Santa Clara, Cuba. Positioned atop a four-story building, the surroundings were free from obstructions, such as taller buildings or trees, that might impede airflow. The Collector System was located inside an office on the first floor of that building.
The Smart Environment Pro is an IoT solution manufactured by Libelium and was used as a reference for the IoT platform. In this case, the Libelium device contained the Alphasense sensors for CO, O
3, NO
2, and SO
2 and were connected on sockets A, B, C, and F, respectively. In this model, the sensor in socket D was always reserved for PM
1, PM
2.5, and PM
10 using an OPC-N3 optical particle counter. The temperature, humidity, and pressure probe was on socket E with a BME280 sensor. It had the ATmega 1281 microcontroller as core, working at a frequency of 14.7456 MHz, and allowed an SD card module up to 2 GB. The device incorporated a Real Time Clock (RTC) that allowed the Waspmote sensor platform to go to Deep Sleep and Hibernate modes for energy saving. It contained a rechargeable lithium-ion battery of 3.7 V (nominal voltage) and a capacity of 6600 mAh. It included a rigid solar panel of 6 W. This device can be programmed similarly to an Arduino using the Waspmote IDE, developed and maintained by the company [
64].
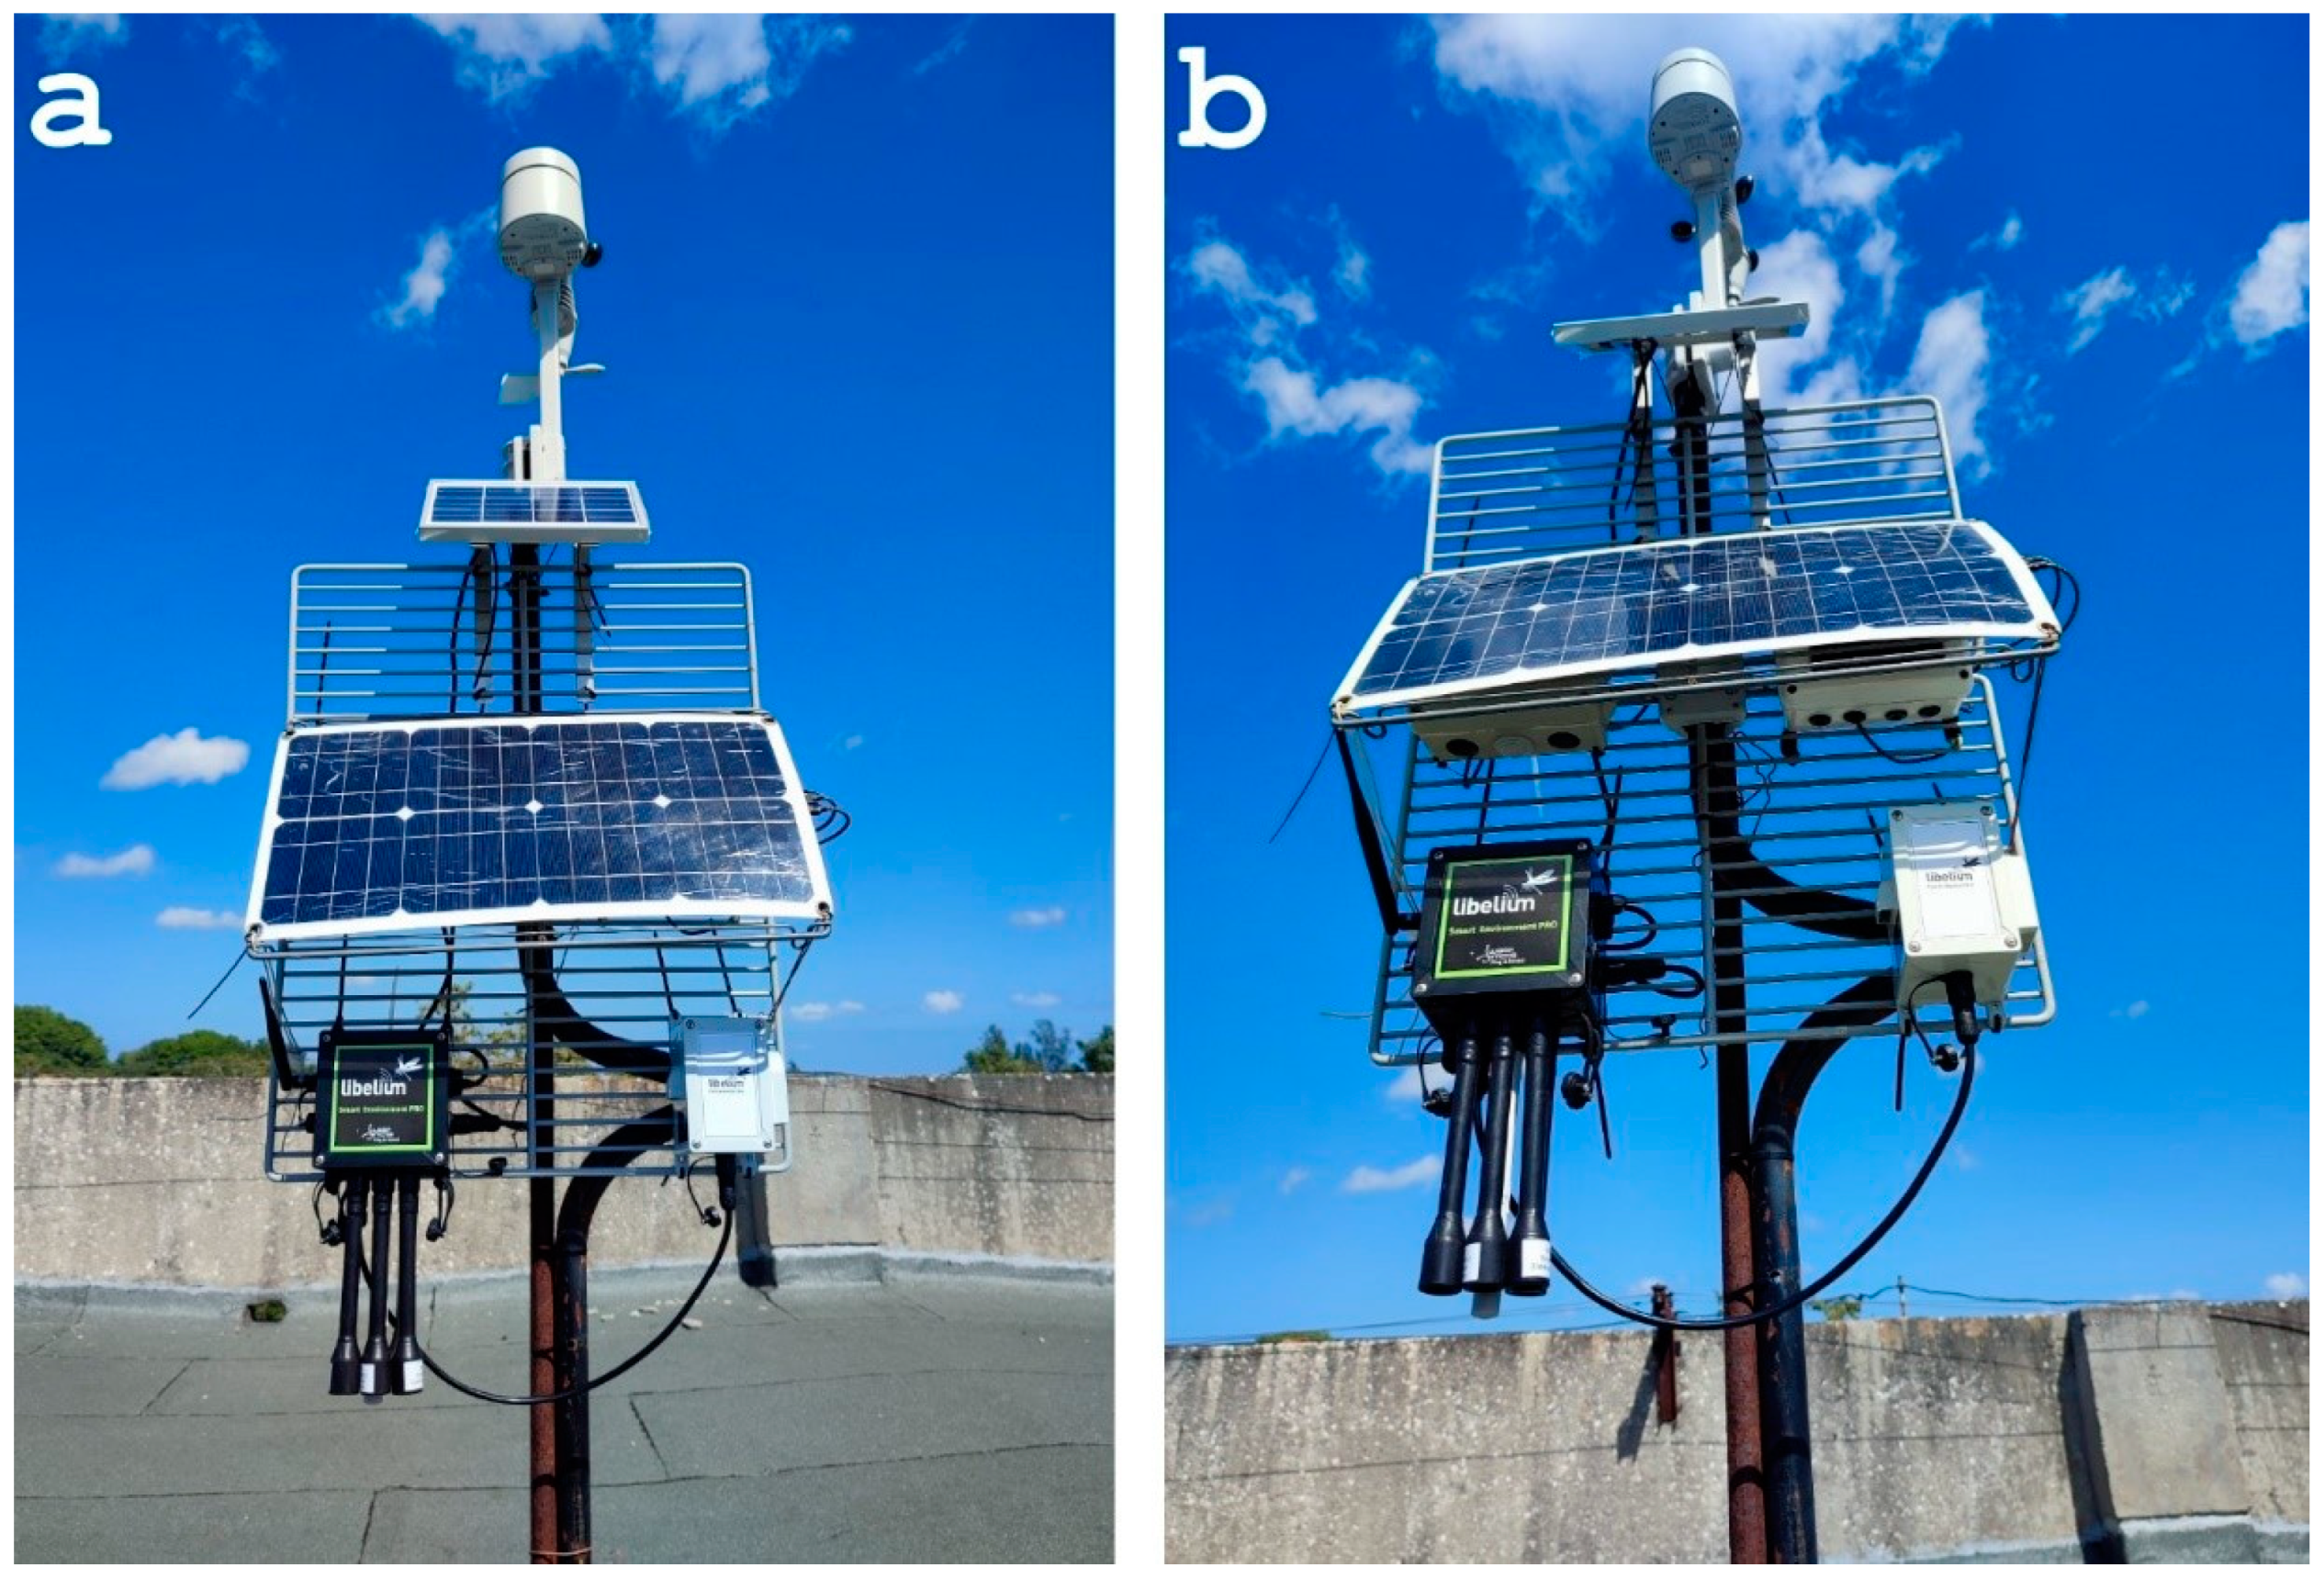
Figure 5 depicts the configuration for the comparative study, showcasing how two distinct air quality measurement systems monitor the same environmental conditions simultaneously. The Smart Environment Pro instrument of Libelium, accompanied by a smaller solar panel, was positioned on a mast at a height of 1.50 m from the roof. For the remote sensor system, the HZS-GARP-AQ-04 was positioned 30 cm above the reference instrument, at a height of approximately 1.80 m. That system was connected to the larger solar panel shown in
Figure 5. The Bresser station was installed on top of the mast at a height of 2.10 m, facing north. The placement of both systems on the rooftop ensured exposure to the environmental conditions of interest, facilitating the evaluation of their performance and reliability.
Data cleaning and data visualization for analyses were performed with the software MATLAB. To evaluate and compare signals obtained from two different measuring systems, several parameters are commonly used, such as the coefficient of determination (R
2), cross-correlation, root mean square error (RMSE), mean square error (MSE), and mean absolute error (MAE). In particular, in air quality studies, it has been observed that the most commonly used parameters for comparison with reference methods are the RMSE, the coefficient of determination (R
2), the cross-correlation, and the comparison of the measuring range (Mean + stdev) of both methods [
13,
65,
66,
67,
68].
5. Results
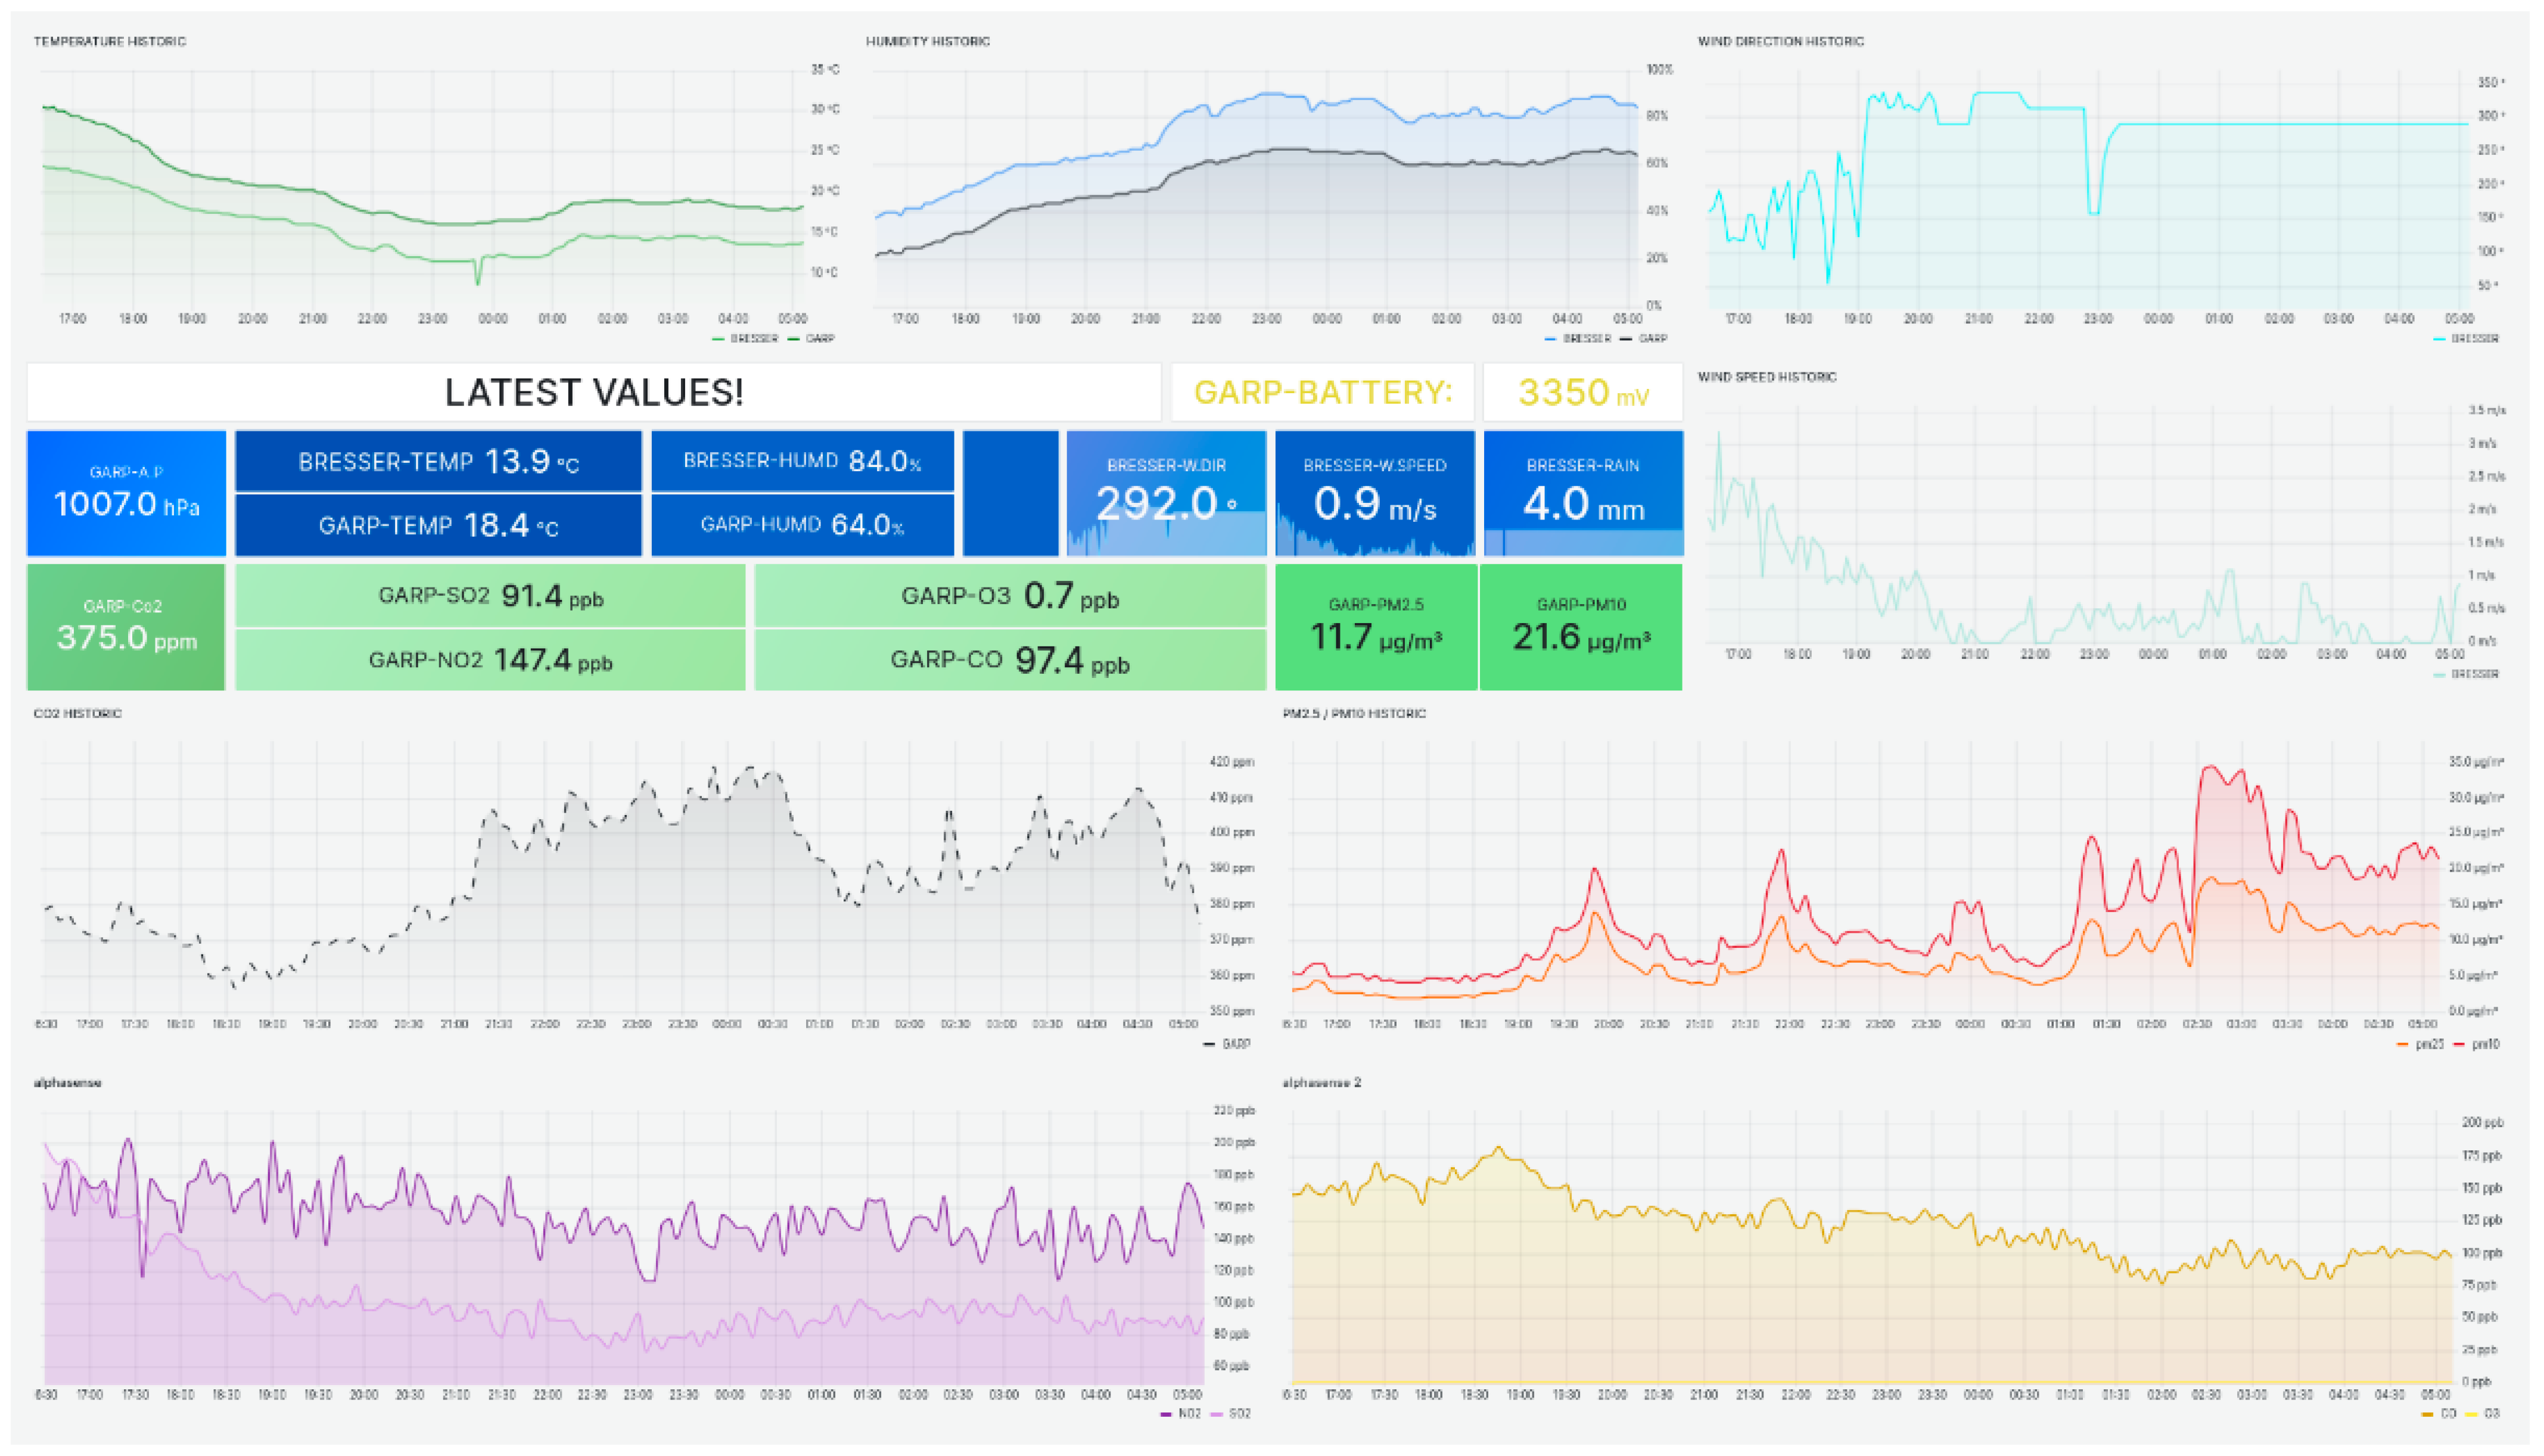
The Grafana dashboard, shown in
Figure 6, indicates that it is possible to collect all data and visualize their dynamic patterns in graphs in real time. This facilitates the analysis of the parameter’s dynamics and allows for faster action when unforeseen events occur. By integrating weather and air quality data sources, the dashboard provides a global view of the rooftop environment. The Grafana dashboard appears to be a valuable tool for visualizing and interpreting the local air quality, allowing for informed decisions.
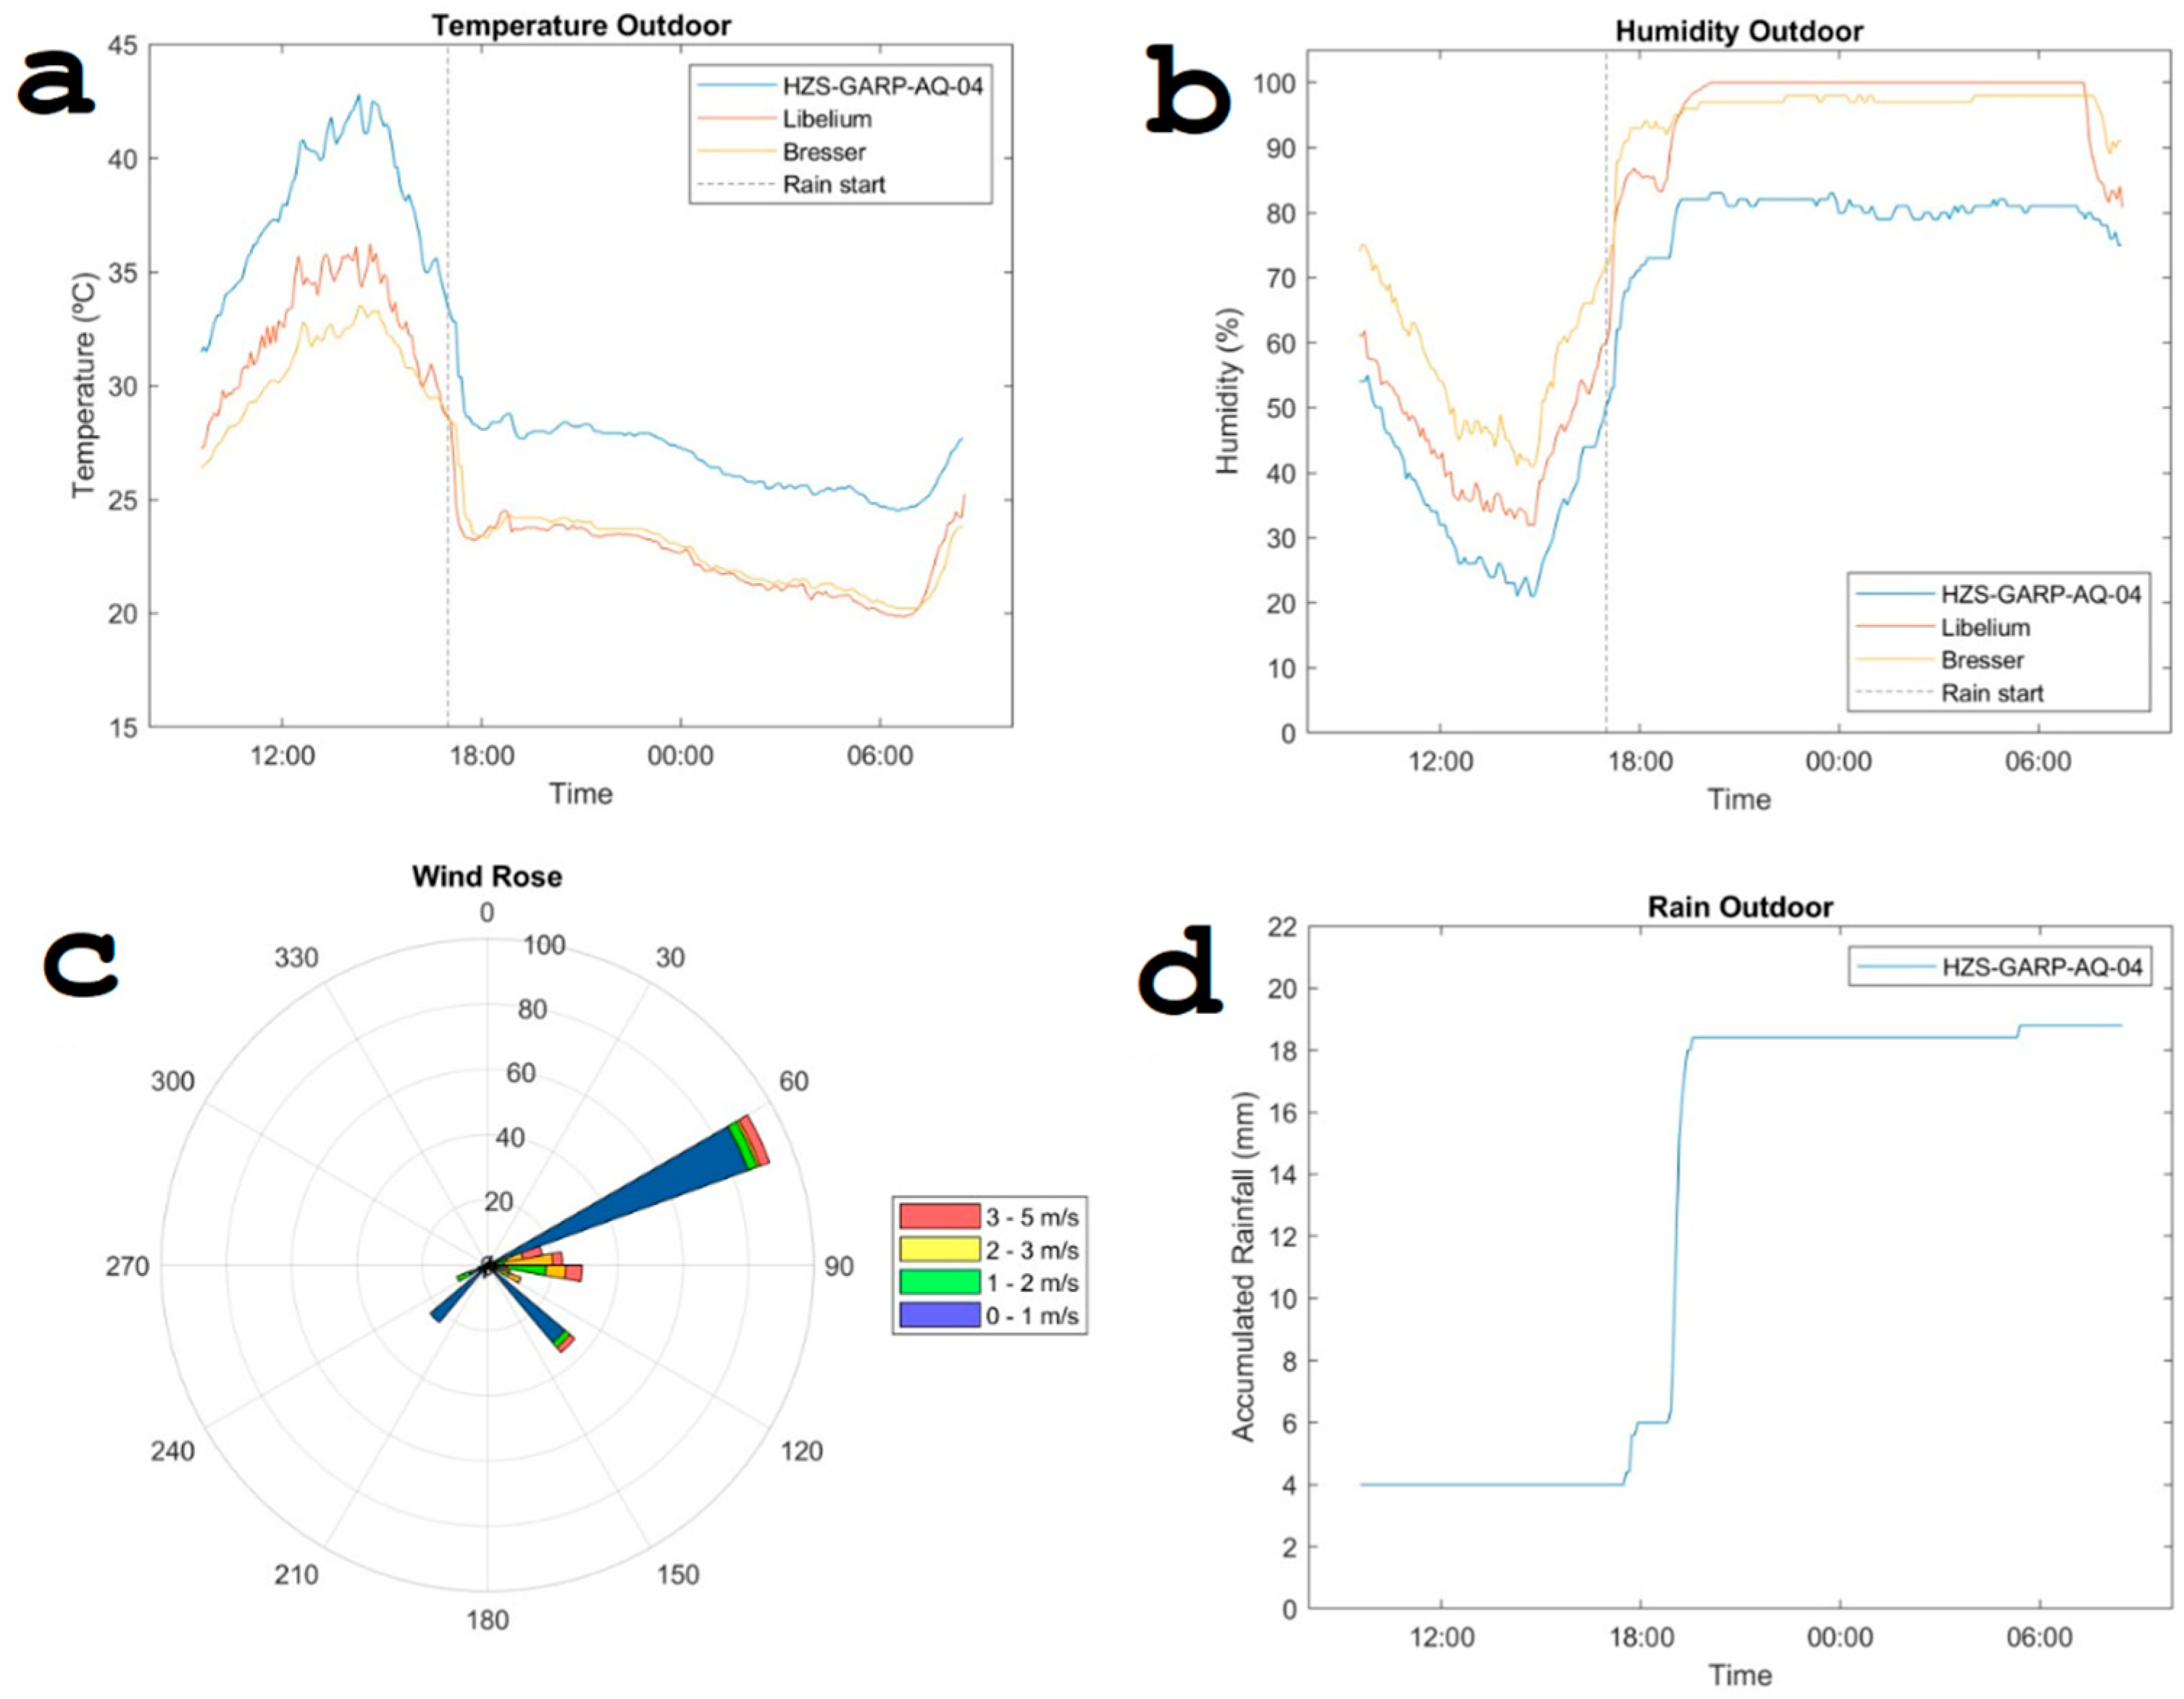
A comparative analysis was conducted between the remote sensor system and the reference instrument for temperature and relative humidity.
Figure 7 illustrates a “cold start” scenario where both systems were suddenly switched on. It shows the details of a larger measurement campaign where the black dashed line indicates the start of a rain event. Throughout the 15-day observation period, a cumulative rainfall of 18.8 mm was recorded (see
Figure 7d). Wind speeds remained generally subdued, peaking at 5 m/s, with occasional calm periods. The predominant wind direction was primarily east. This information is shown in the wind rose in
Figure 7c. The pattern of the temperature and relative humidity dynamics obtained from the different sensors is similar except for a vertical shift. This means that the calibration of the sensors was not perfect.
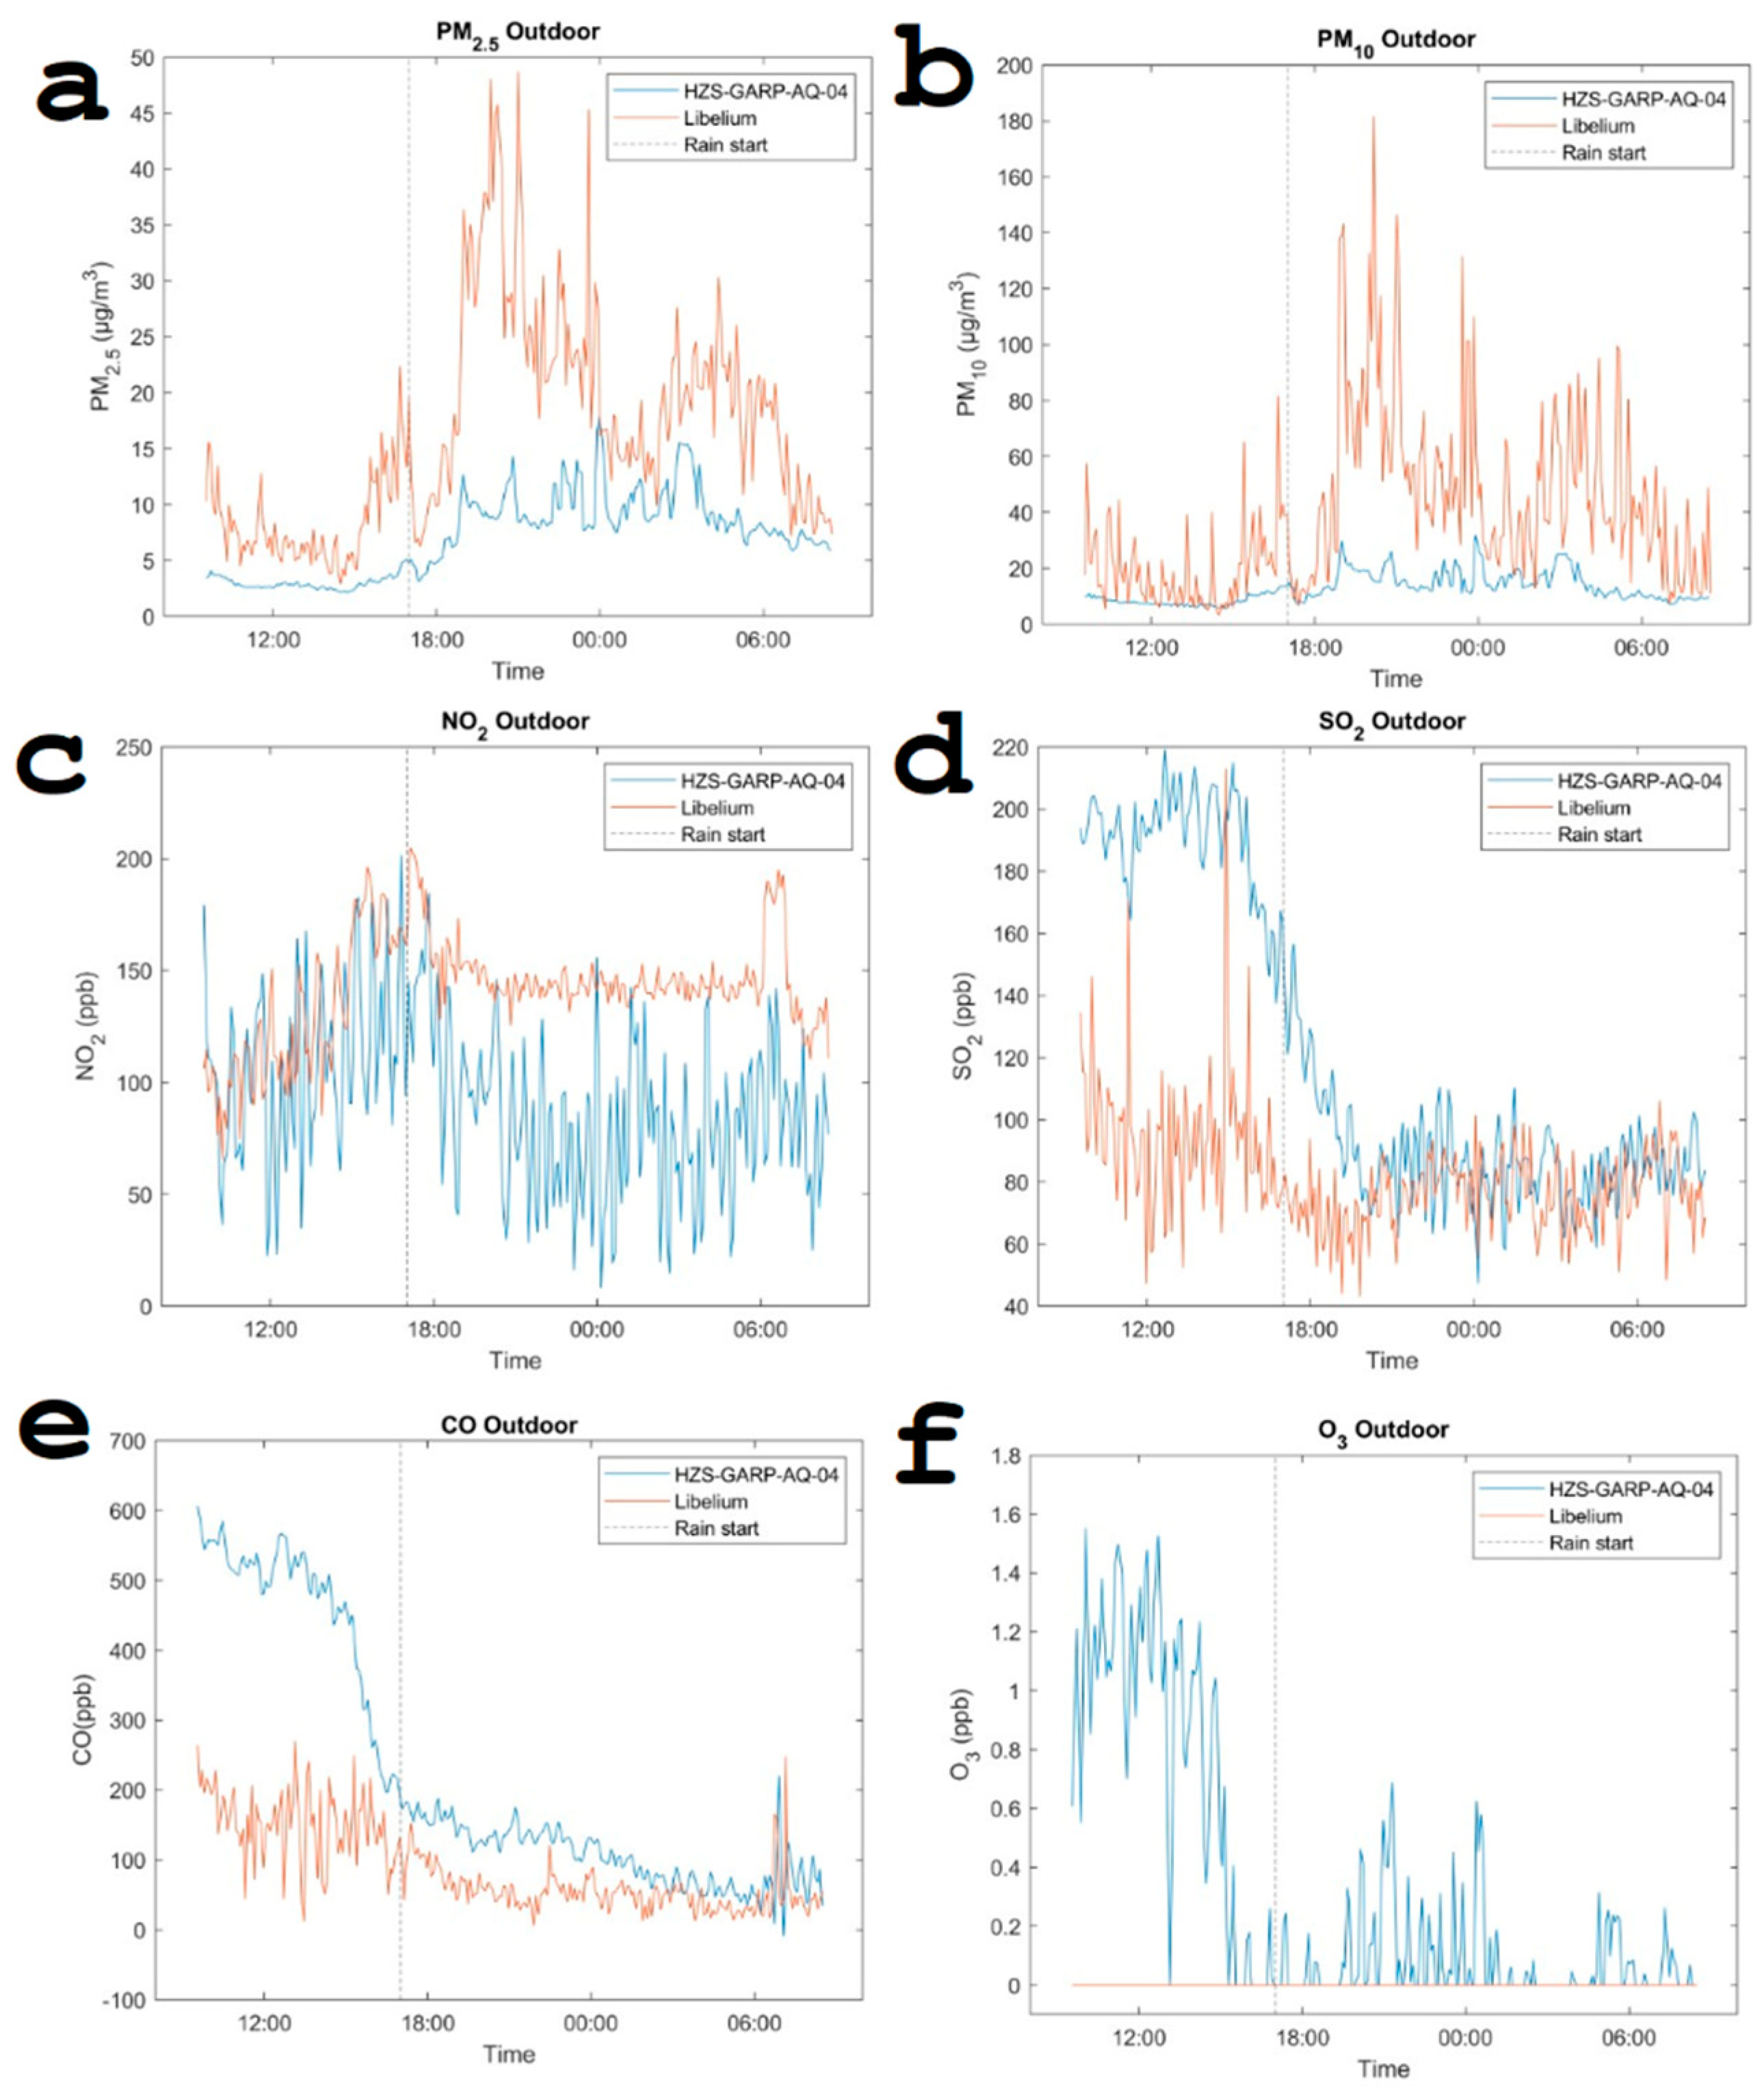
Another comparative analysis was conducted between the remote sensor system and the reference instrument for the pollutants PM
2.5, PM
10, NO
2, SO
2, CO, and O
3.
Figure 8 illustrates the impact of a “cold start” on the accuracy of measurements obtained with the Alphasense electrochemical sensors. The deliberate inclusion of a transition period was intended to evaluate the performance of the Alphasense sensors under varying conditions, providing insights into their response and stability over time [
65]. The analysis reveals complex behavior in the measured parameters, characterized by pronounced peaks on top of a slowly fluctuating background. For most peaks, there is synchrony between both systems. However, the calibration of the sensors is, for both systems, fundamentally different. For particulate matter, there is an observed increase in concentration when it is raining, possibly because the sensor misidentifies small water droplets as solid particles. A sudden drop in sulfur dioxide (SO
2) is observed when it starts to rain, likely due to its dissolution in water. Notably, the Libelium system failed to record any data for ozone levels, and similarly, the remote sensor system detected ozone concentrations that were barely above the sensor’s threshold. Incorporating meteorological information offers a significant benefit by providing additional context, which is crucial for interpreting sudden shifts in dynamic patterns. This extra layer of data helps elucidate the environmental factors influencing these changes, enhancing the analysis and understanding of the data collected.
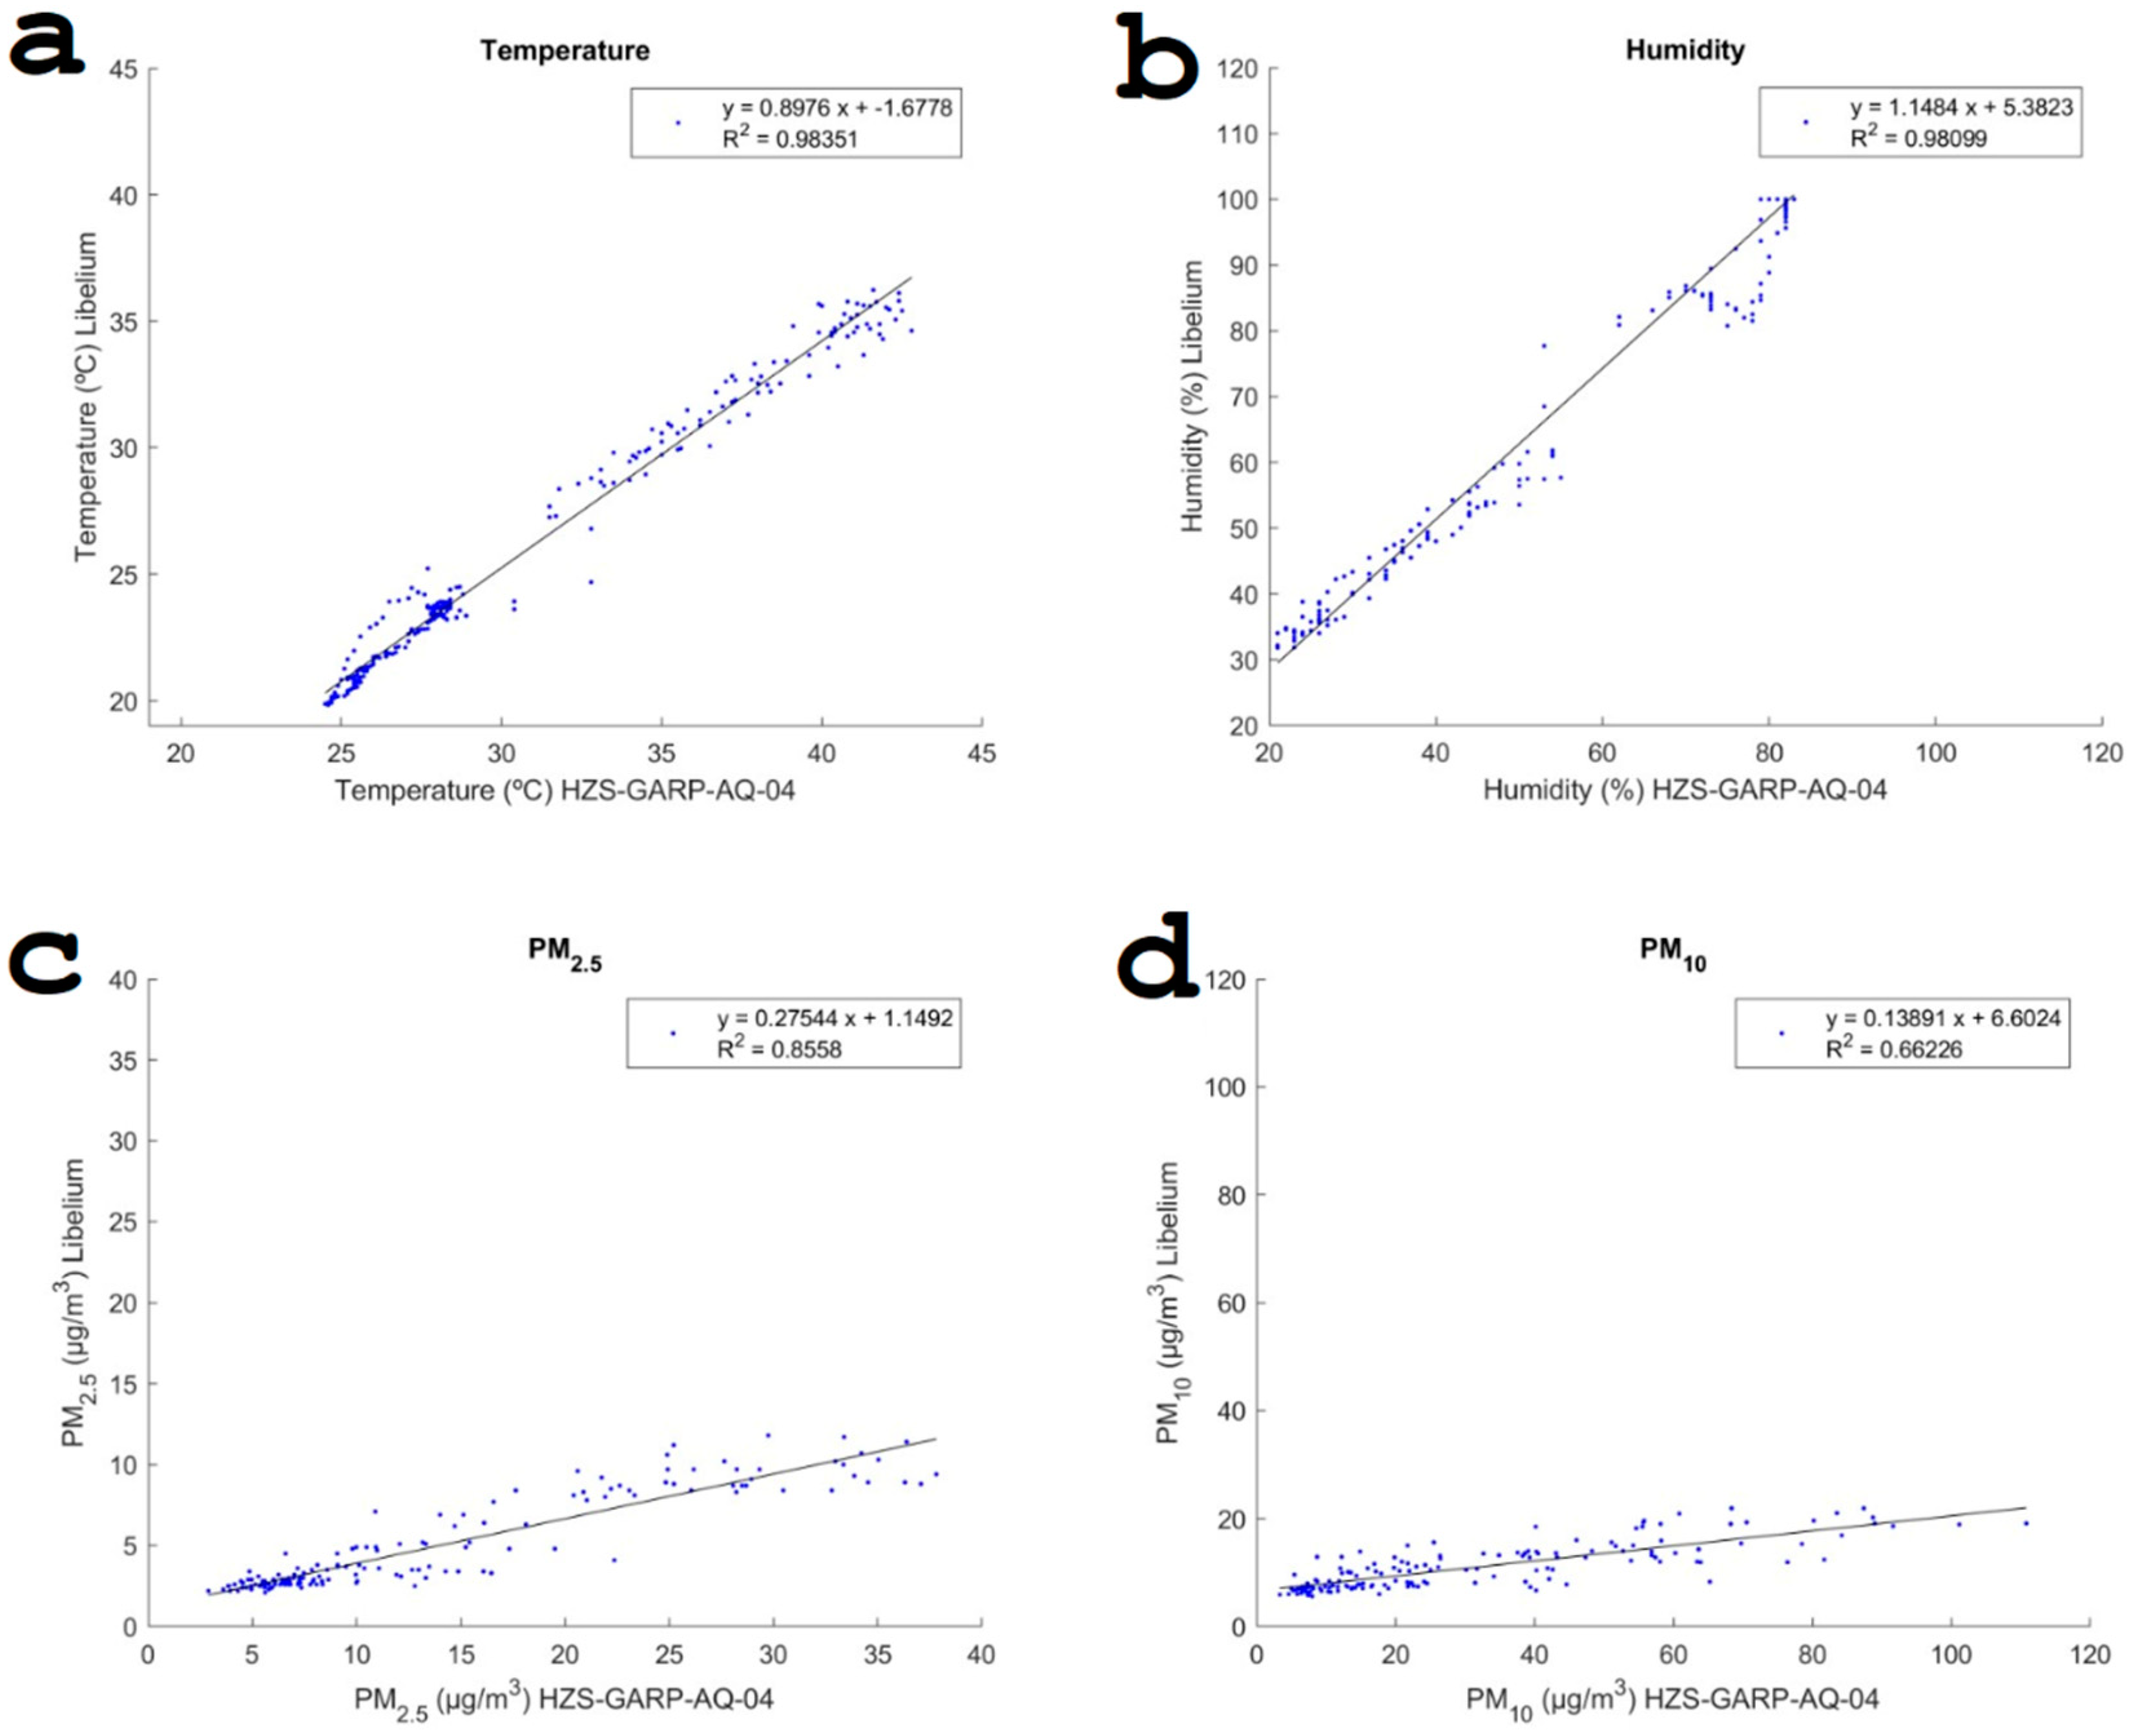
To delve deeper into how the measurements from both systems align, various comparative analyses were conducted. The outcomes of these studies are consolidated in
Table 4. The highest congruence between the HZS-GARP-AQ-04 and the Libelium system measurements, as illustrated through linear regression, was seen in the temperature and humidity data, both achieving an R
2 value of 0.98. This high level of correlation was anticipated because both systems utilize BME280 sensors for measuring these parameters. Nonetheless, despite this high correlation, a notable difference in the absolute quantities measured by each system was observed.
Despite the usage of the same Alphasense gas sensors and their calibration by the manufacturer, SO
2, NO
2, and CO measurements showed no clear correlation between both systems. The best, but not good, fit regarded CO (R
2 = 0.63) measurements, while SO
2 (R
2 = 0.22) and NO
2 (R
2 = 0.21) displayed poor performance when compared with Libelium (
Figure 9). O
3 showed relatively low values for the HZS-GARP-AQ.04 with an average of 0.3 ppb and a maximum of 1.55 ppb—concentrations that fell below the detection limit of Libelium (
Figure 10).
For particulate matter, PM
2.5 showed a high fit (R
2 = 0.85) between the Nova SDS011 sensor (Nova Fitness, Jinan, China) used for HZS-GARP-AQ-04 and the Alphasense OPC-N3 in the Libelium system. A relatively poor fit was achieved for the PM
10 concentrations (R
2 = 0.66). This low coefficient can be explained by the overestimation of the PM
10 concentrations by OPC-N3 and its predecessor model, OPC-N2 [
69].
6. Discussion
While extended periods of operation are necessary to confirm its resilience in tropical environments, initial results show no signs of degradation of the hardware components. Leveraging its LoRa communication capability, the platform ensures seamless data transmission over distances of up to 2 km in open fields, with negligible data packet loss. The collector device received 98.2% of the packages sent by the sensor system, demonstrating a low package loss and the correct functioning of the LoRa protocol. These promising findings underscore the platform’s potential for reliable environmental monitoring applications, particularly in challenging conditions prevalent in tropical regions.
In the conducted tests, the Libelium system exhibited a notable autonomy of 48 h utilizing a 6600 mAh battery. Conversely, the HZS-GARP-AQ-04 system demonstrated a battery endurance of 10 h with a 2600 mAh battery. Considering that the Libelium battery possesses a capacity 2.5 times greater than that of the HZS system, it is reasonable to deduce that, under these circumstances, the system equipped with a 6600 mAh battery should provide 25 h. It is worth mentioning that the Libelium system was not engaged in any wireless communication during the test, while the other system was consistently receiving data via FSK or transmitting data through LoRa.
The purpose of incorporating the Libelium system in this study was to conduct a comparative analysis between the measurements obtained from the IoT platform and a commercially available device designed to measure similar air pollutants. It should be emphasized that some of the sensors used by Libelium are similar to the ones in the IoT platform. While Libelium trusts the calibration provided by Alphasense, we also conducted additional calibrations. Differences in the absolute values between the two systems are mainly caused by imperfect calibration, cross-interference (e.g., rain droplet considered as particulate matter), calibration drift, etc. As a result, it is hard to determine what measurements are the most reliable. Therefore, data from the Libelium system were not used as control measurements to adjust the results of the proposed platform.
External factors such as rain can obscure genuine signals in PM sensor readings, making it challenging to isolate these signals accurately. Therefore, post-processing techniques may not be fully effective in removing these external influences. Additionally, the high-frequency components of the signals, including peaks and valleys, are essential in this type of research and should be preserved. As a result, the analysis was carried out using the unfiltered, raw data from the IoT platform. This approach allows the data to be evaluated in their original state, facilitating an examination of sensor performance. By opting not to use post-processing techniques in the current analysis, we maintain the option to implement them in future projects, after gaining a deeper understanding of the platform’s behavior.
In terms of component costs alone, the estimated value of the system is around USD 650, without taking into account factors such as intellectual labor, shipping, and packaging costs. In comparison, existing commercial solutions, such as AQ Mesh, are priced at around USD 3500, while the Libelium Smart Environment Pro system used in this study cost approximately USD 5000.
7. Conclusions
The unified IoT platform efficiently handled and displayed data for both meteorological and air quality measurements, demonstrating strong performance under the demanding conditions of a tropical environment, notably high humidity levels and solar radiation, without any system failures. This success illustrates the feasibility of deploying a network of monitoring stations to consistently track environmental parameters on a constrained budget. This study shows that it is possible to monitor key risk parameters that determine the impact of air quality to human health in a developing country.
The comparative analysis between the unified IoT platform developed and the Libelium Smart Environment Pro determined both are able to capture the dynamics of the environmental parameters, making them well suited for air quality monitoring and identifying events causing moments of poorer air quality. Statistical analysis highlighted the differences in performance between the Alphasense sensors used in the HZS-GARP-AQ-04 device and the Libelium system. This is evidenced by lower R-squared values. There are significant differences between the measurements of both systems. Since both systems use the same types of sensors, it is not entirely clear which system is more reliable in determining the absolute amount of the measured quantities. This shows the need for sensor calibration and, in particular, regular in situ calibrations to improve the reliability of the sensor measurements.
Further research is required to improve the reliability of air quality measurements. The sensors used in this study to measure NO2, O3, SO2, and CO are provided by Alphasense, and the manufacturer indicates these sensors generally have a lifespan of about two years. A future study should therefore aim to assess how these sensors perform in a tropical environment, which typically causes a faster degradation of materials and electronics. While the IoT platform generally performed adequately, it is important to implement in situ calibration to maintain high data quality throughout the monitoring campaign. Future deployments will include these calibrations to support accurate decision making and health assessments.
Author Contributions
D.K.-C.: Design of the sensor system, data processing, performance and evaluation of the experiments, and manuscript preparation. V.H.-R.: Design and implementation of the IoT software architecture, evaluation of the experiments, and manuscript preparation. O.S.: Conception and design of the experiments, research conception and preparation, review, editing and approval of the final version of the manuscript. A.M.: Data processing and preparation, review, editing, and approval of the final version of the manuscript. P.M.L.: Review and approval of the final version of the manuscript. D.A.-S.: Research conception and preparation, review, and approval of the final version of the manuscript. All authors have read and agreed to the published version of the manuscript.
Funding
The authors express their gratitude for the financial support received from the Global Minds project 2022GMHVLHC106, a collaborative initiative involving all Flemish Universities of Applied Sciences and Arts. Additionally, they acknowledge the support from the project “Low-cost sensor system to improve decision support to evaluate the impact of the air quality” financed by the French embassy in Cuba through the Hubert Curien Agreement entitled Carlos J. Finlay.
Institutional Review Board Statement
Not applicable.
Informed Consent Statement
Not applicable.
Data Availability Statement
All data used in this study are available upon request.
Acknowledgments
The researchers extend their gratitude to the personnel of the Antwerp Maritime Academy (AMA) and the French Maritime Academy (FMA) for their invaluable assistance in assembling and testing the system.
Conflicts of Interest
The authors declare no conflicts of interest.
References
- Arora, N.K.; Mishra, I. United Nations Sustainable Development Goals 2030 and environmental sustainability: Race against time. Environ. Sustain. 2019, 2, 339–342. [Google Scholar] [CrossRef]
- Almetwally, A.A.; Bin-Jumah, M.; Allam, A.A. Ambient air pollution and its influence on human health and welfare: An overview. Environ. Sci. Pollut. Res. 2020, 27, 24815–24830. [Google Scholar] [CrossRef] [PubMed]
- Hill, W.; Lim, E.L.; Weeden, C.E.; Lee, C.; Augustine, M.; Chen, K.; Kuan, F.-C.; Marongiu, F.; Evans, E.J.; Moore, D.A.; et al. Lung adenocarcinoma promotion by air pollutants. Nature 2023, 616, 159–167. [Google Scholar] [CrossRef]
- Gu, H.; Yan, W.; Elahi, E.; Cao, Y. Air pollution risks human mental health: An implication of two-stages least squares estimation of interaction effects. Environ. Sci. Pollut. Res. 2020, 27, 2036–2043. [Google Scholar] [CrossRef]
- Pope, C.A.; Coleman, N.; Pond, Z.A.; Burnett, R.T. Fine particulate air pollution and human mortality: 25+ years of cohort studies. Environ. Res. 2020, 183, 108924. [Google Scholar] [CrossRef] [PubMed]
- Jhun, I.; Coull, B.A.; Schwartz, J.; Hubbell, B.; Koutrakis, P. The impact of weather changes on air quality and health in the United States in 1994–2012. Environ. Res. Lett. 2015, 10, 084009. [Google Scholar] [CrossRef] [PubMed]
- Reddy, R.; Appannagari, R.; Ramamohana, D.R. Environmental Pollution Causes and Consequences: A Study. North Asian Int. Res. J. Soc. Sci. Humanit. 2017, 3, 2454–9827. [Google Scholar]
- Concas, F.; Mineraud, J.; Lagerspetz, E.; Varjonen, S.; Liu, X.; Puolamäki, K.; Nurmi, P.; Tarkoma, S. Low-Cost Outdoor Air Quality Monitoring and Sensor Calibration. ACM Trans. Sens. Netw. 2021, 17, 1–44. [Google Scholar] [CrossRef]
- Ottosen, T.B. Perspectives on the Calibration and Validation of Low-Cost Air Quality Sensors. Environ. Sci. Technol. 2021, 55, 12773–12775. [Google Scholar] [CrossRef]
- Narayana, M.V.; Jalihal, D.; Nagendra, S.M.S. Establishing A Sustainable Low-Cost Air Quality Monitoring Setup: A Survey of the State-of-the-Art. Sensors 2022, 22, 394. [Google Scholar] [CrossRef]
- Bian, Y.; Huang, Z.; Ou, J.; Zhong, Z.; Xu, Y.; Zhang, Z.; Xiao, X.; Ye, X.; Wu, Y.; Yin, X.; et al. Evolution of anthropogenic air pollutant emissions in Guangdong Province, China, from 2006 to 2015. Atmos. Chem. Phys. 2019, 19, 11701–11719. [Google Scholar] [CrossRef]
- Poole, J.A.; Barnes, C.S.; Demain, J.G.; Bernstein, J.A.; Padukudru, M.A.; Sheehan, W.J.; Fogelbach, G.G.; Wedner, J.; Codina, R.; Levetin, E.; et al. Impact of weather and climate change with indoor and outdoor air quality in asthma: A Work Group Report of the AAAAI Environmental Exposure and Respiratory Health Committee. J. Allergy Clin. Immunol. 2019, 143, 1702–1710. [Google Scholar] [CrossRef] [PubMed]
- Rivera, A.; Ponce, P.; Mata, O.; Molina, A.; Meier, A. Local Weather Station Design and Development for Cost-Effective Environmental Monitoring and Real-Time Data Sharing. Sensors 2023, 23, 9060. [Google Scholar] [CrossRef] [PubMed]
- Çorak, B.H.; Okay, F.Y.; Güzel, M.; Murt, Ş.; Ozdemir, S. Comparative Analysis of IoT Communication Protocols. 2018 Int. Symp. Networks, Comput. Commun. In Proceedings of the ISNCC, Rome, Italy, 19–21 June 2018. [Google Scholar] [CrossRef]
- Buelvas, J.; Múnera, D.; Tobón, V.D.P.; Aguirre, J.; Gaviria, N. Data Quality in IoT-Based Air Quality Monitoring Systems: A Systematic Mapping Study. Water. Air. Soil Pollut. 2023, 234, 1–23. [Google Scholar] [CrossRef]
- Moursi, A.S.; El-Fishawy, N.; Djahel, S.; Shouman, M.A. An IoT enabled system for enhanced air quality monitoring and prediction on the edge. Complex Intell. Syst. 2021, 7, 2923–2947. [Google Scholar] [CrossRef]
- Andreadis, A.; Giambene, G.; Zambon, R. Low-Power IoT Environmental Monitoring and Smart Agriculture for Unconnected Rural Areas. In Proceedings of the 2022 20th Mediterranean Communication and Computer Networking Conference, Paphos, Cyprus, 1–3 June 2022; pp. 31–38. [Google Scholar] [CrossRef]
- Mallach, G.; Sun, L.; McKay, M.; Kovesi, T.; Lawlor, G.; Kulka, R.; Miller, J.D. Indoor air quality in remote first nations communities in Ontario, Canada. PLoS ONE 2023, 18, e0294040. [Google Scholar] [CrossRef] [PubMed]
- Wang, S.; Ma, Y.; Wang, Z.; Wang, L.; Chi, X.; Ding, A.; Yao, M.; Li, Y.; Li, Q.; Wu, M.; et al. Mobile monitoring of urban air quality at high spatial resolution by low-cost sensors: Impacts of COVID-19 pandemic lockdown. Atmos. Chem. Phys. 2021, 21, 7199–7215. [Google Scholar] [CrossRef]
- Krichen, M. A Survey on Formal Verification and Validation Techniques for Internet of Things. Appl. Sci. 2023, 13, 8122. [Google Scholar] [CrossRef]
- Majumdar, P.; Mitra, S.; Bhattacharya, D. IoT for Promoting Agriculture 4.0: A Review from the Perspective of Weather Monitoring, Yield Prediction, Security of WSN Protocols, and Hardware Cost Analysis. J. Biosyst. Eng. 2021, 46, 440–461. [Google Scholar] [CrossRef]
- Kondaveeti, H.K.; Kumaravelu, N.K.; Vanambathina, S.D.; Mathe, S.E.; Vappangi, S. A systematic literature review on prototyping with Arduino: Applications, challenges, advantages, and limitations. Comput. Sci. Rev. 2021, 40, 100364. [Google Scholar] [CrossRef]
- Feng, Y.; Bai, Z.; Yao, Q.; Zhang, D.; Song, J.; Dong, C.; Wu, J.; Xiao, K. Corrosion behavior of printed circuit boards in tropical marine atmosphere. Int. J. Electrochem. Sci. 2019, 14, 11300–11301. [Google Scholar] [CrossRef]
- Sahu, R.; Dixit, K.K.; Mishra, S.; Kumar, P.; Shukla, A.K.; Sutaria, R.; Tiwari, S.; Tripathi, S.N. Validation of Low-Cost Sensors in Measuring Real-Time PM10 Concentrations at Two Sites in Delhi National Capital Region. Sensors 2020, 20, 1347. [Google Scholar] [CrossRef] [PubMed]
- Hernandez-Rodriguez, E.; Kairúz-Cabrera, D.; Martinez, A.; González-Rivero, R.A.; Schalm, O. Low-Cost Portable System for the Estimation of Air Quality. Stud. Syst. Decis. Control 2023, 464, 287–297. [Google Scholar] [CrossRef] [PubMed]
- Martinez, A.; Hernandez-Rodriguez, E.; Hernandez, L.; Schalm, O.; Gonzalez-Rivero, R.A.; Alejo-Sanchez, D. Design of a Low-Cost System for the Measurement of Variables Associated With Air Quality. IEEE Embed. Syst. Lett. 2023, 15, 105–108. [Google Scholar] [CrossRef]
- Rodríguez, V.M.H.; Cabrera, D.K.; Laguardia, A.S.M.; Merino, P.; Schalm, O. Estación meteorológica IoT basada en TTGO T-Beam y comunicación LoRa. Ing. Electrónica Automática y Comun. 2024, 44, 2302. [Google Scholar]
- Rivero, R.A.G.; Schalm, O.; Cruz, A.A.; Rodríguez, E.H.; Pérez, M.C.M.; Sánchez, D.A.; Laguardia, A.M.; Jacobs, W.; Santana, L.H. Relevance and Reliability of Outdoor SO2 Monitoring in Low-Income Countries Using Low-Cost Sensors. Atmosphere 2023, 14, 912. [Google Scholar] [CrossRef]
- Rivero, R.A.G.; Hernández, L.E.M.; Schalm, O.; Rodríguez, E.H.; Alejo Sánchez, D.; Pérez, M.C.M.; Caraballo, V.N.; Jacobs, W.; Laguardia, A.M. A Low-Cost Calibration Method for Temperature, Relative Humidity, and Carbon Dioxide Sensors Used in Air Quality Monitoring Systems. Atmosphere 2023, 14, 191. [Google Scholar] [CrossRef]
- Castell, N.; Dauge, F.R.; Schneider, P.; Vogt, M.; Lerner, U.; Fishbain, B.; Broday, D.; Bartonova, A. Can commercial low-cost sensor platforms contribute to air quality monitoring and exposure estimates? Environ. Int. 2017, 99, 293–302. [Google Scholar] [CrossRef] [PubMed]
- Wahlborg, D.; Björling, M.; Mattsson, M. Evaluation of field calibration methods and performance of AQMesh, a low-cost air quality monitor. Environ. Monit. Assess. 2021, 193, 1–21. [Google Scholar] [CrossRef]
- Soeharwinto, E.S.; Siregar, B. Remote Monitoring of Post-eruption Volcano Environment Based-On Wireless Sensor Network (WSN): The Mount Sinabung Case. J. Phys. Conf. Ser. 2017, 801, 012084. [Google Scholar] [CrossRef]
- Kaivonen, S.; Ngai, E.C.H. Real-time air pollution monitoring with sensors on city bus. Digit. Commun. Netw. 2020, 6, 23–30. [Google Scholar] [CrossRef]
- Hercog, D.; Lerher, T.; Truntič, M.; Težak, O. Design and Implementation of ESP32-Based IoT Devices. Sensors 2023, 23, 6739. [Google Scholar] [CrossRef]
- Sharma, P.; Prakash, S. Real Time Weather Monitoring System Using Iot. ITM Web Conf. 2021, 40, 01006. [Google Scholar] [CrossRef]
- Math, R.K.M.; Dharwadkar, N.V. IoT Based low-cost weather station and monitoring system for precision agriculture in India. In Proceedings of the International Conference on I-SMAC (IoT in Social, Mobile, Analytics and Cloud), I-SMAC 2018, Palladam, India, 30–31 August 2018; pp. 81–86. [Google Scholar] [CrossRef]
- Kumari, S.; Kasliwal, M.H.; Valakunde, N.D. An android based smart environmental monitoring system using IoT. Commun. Comput. Inf. Sci. 2018, 906, 535–544. [Google Scholar] [CrossRef]
- Sung, W.T.; Hsiao, S.J. Building an indoor air quality monitoring system based on the architecture of the Internet of Things. EURASIP J. Wirel. Commun. Netw. 2021, 2021, 1–41. [Google Scholar] [CrossRef]
- Mabrouki, J.; Azrour, M.; Dhiba, D.; Farhaoui, Y.; El Hajjaji, S. IoT-based data logger for weather monitoring using arduino-based wireless sensor networks with remote graphical application and alerts. Big Data Min. Anal. 2021, 4, 25–32. [Google Scholar] [CrossRef]
- Aamer, H.; Mumtaz, R.; Anwar, H.; Poslad, S. A Very Low Cost, Open, Wireless, Internet of Things (IoT) Air Quality Monitoring Platform. In Proceedings of the 2018 15th International Conference on Smart Cities: Improving Quality of Life Using ICT IoT, HONET-ICT 2018, Islamabad, Pakistan, 8–10 October 2018; pp. 102–106. [Google Scholar] [CrossRef]
- Kaewwongsri, K.; Silanon, K. Design and Implement of a Weather Monitoring Station using CoAP on NB-IoT Network. In Proceedings of the 17th International Conference on Electrical Engineering/Electronics, Computer, Telecommunications and Information Technology ECTI-CON 2020, Phuket, Thailand, 24–27 June 2020; pp. 230–233. [Google Scholar] [CrossRef]
- Megantoro, P.; Aldhama, S.A.; Prihandana, G.S.; Vigneshwaran, P. IoT-based weather station with air quality measurement using ESP32 for environmental aerial condition study. TELKOMNIKA Telecommun. Comput. Electron. Control. 2021, 19, 1316–1325. [Google Scholar] [CrossRef]
- Fahim, M.; El Mhouti, A.; Boudaa, T.; Jakimi, A. Modeling and implementation of a low-cost IoT-smart weather monitoring station and air quality assessment based on fuzzy inference model and MQTT protocol. Model. Earth Syst. Environ. 2023, 9, 4085–4102. [Google Scholar] [CrossRef]
- Kishorebabu, V.; Sravanthi, R. Real Time Monitoring of Environmental Parameters Using IOT. Wirel. Pers. Commun. 2020, 112, 785–808. [Google Scholar] [CrossRef]
- Botero, A.Y.; Restrepo, S.L.; Rodriguez, J.S.; Valle, D.; Galvez-Serna, J.; Montilla, E.; Botero, F.; Henzing, B.; Segers, A.; Heemink, A.; et al. Design and Implementation of a Low-Cost Air Quality Network for the Aburra Valley Surrounding Mountains. Pollutants 2023, 3, 150–165. [Google Scholar] [CrossRef]
- Choudhary, V.; Teh, J.H.; Beltran, V.; Lim, H.B. AirQ: A Smart IoT Platform for Air Quality Monitoring. In Proceedings of the 2020 IEEE 17th Annual Consumer Communications & Networking Conference CCNC 2020, Las Vegas, NV, USA, 10–13 January 2020. [Google Scholar] [CrossRef]
- Aashiq, M.N.M.; Kurera, W.T.C.C.; Thilekaratne, M.G.S.P.; Saja, A.M.A.; Rouzin, M.R.M.; Neranjan, N.; Yassin, H. An IoT-based handheld environmental and air quality monitoring station. Acta IMEKO 2023, 12, 1–9. [Google Scholar] [CrossRef]
- González, E.; Casanova-Chafer, J.; Romero, A.; Vilanova, X.; Mitrovics, J.; Llobet, E. LoRa Sensor Network Development for Air Quality Monitoring or Detecting Gas Leakage Events. Sensors 2020, 20, 6225. [Google Scholar] [CrossRef]
- Liya, M.L.; Aswathy, M. LoRa technology for Internet of Things(IoT): A brief Survey. In Proceedings of the 4th International Conference on I-SMAC (IoT in Social, Mobile, Analytics and Cloud), ISMAC 2020, Coimbatore, India, 7–9 October 2020; pp. 128–133. [Google Scholar] [CrossRef]
- Noreen, U.; Bounceur, A.; Clavier, L. A study of LoRa low power and wide area network technology. In Proceedings of the 3rd International Conference on Advanced Technologies for Signal and Image Processing ATSIP 2017, Fez, Morocco, 22–24 May 2017. [Google Scholar] [CrossRef]
- Sendra, S. LoRa-based WSN and its applications. 2019. [Google Scholar]
- García-Valls, M.; Palomar-Cosín, E. An Evaluation Process for IoT Platforms in Time-Sensitive Domains. Sensors 2022, 22, 9501. [Google Scholar] [CrossRef]
- Naghib, A.; Navimipour, N.J.; Hosseinzadeh, M.; Sharifi, A. A comprehensive and systematic literature review on the big data management techniques in the internet of things. Wirel. Netw. 2023, 29, 1085–1144. [Google Scholar] [CrossRef]
- An-Dong, S.; Fang, Z. Research on Open Source Solutions of Data Collection for Industrial Internet of Things. In Proceedings of the 2021 7th International Symposium on Mechatronics and Industrial Informatics, ISMII 2021, Zhuhai, China, 22–24 January 2021; pp. 180–183. [Google Scholar] [CrossRef]
- Wolters, A.; Blazevic, M.; Riehle, D.M. On-Premise Internet of Things (IoT) Data Storage: Comparison of Database Management Systems. In Proceedings of the International Conference on Internet of Things, Big Data and Security, IoTBDS, Prague, Czech Republic, 21–23 April 2023; Science and Technology Publications: Setúbal, Portugal, 2023; pp. 140–149. [Google Scholar] [CrossRef]
- Maceli, M. Internet of things in the archives: Novel tools for environmental monitoring of archival collections. Rec. Manag. J. 2020, 30, 201–220. [Google Scholar] [CrossRef]
- Tansangworn, N. Development of IoT Edge Hub for Wireless Sensor Networks based on Docker Container. In Proceedings of the 2020 IEEE International Conference on Smart Internet of Things, SmartIoT 2020, Beijing, China, 14–16 August 2020; pp. 356–357. [Google Scholar] [CrossRef]
- Ren, S.; Kim, J.S.; Cho, W.S.; Soeng, S.; Kong, S.; Lee, K.H. Big Data Platform for Intelligence Industrial IoT Sensor Monitoring System Based on Edge Computing and AI. In Proceedings of the 3rd International Conference on Artificial Intelligence in Information and Communication ICAIIC 2021, Jeju Island, Republic of Korea, 13–16 April 2021; pp. 480–482. [Google Scholar] [CrossRef]
- Bresser GmbH. Bresser Station Data Sheet; Bresser GmbH: Rhede, Germany, 2022; p. 3. Available online: https://www.bresser.de/out/media/8abd1b94e004efda93d2a43597f96e43.pdf (accessed on 4 October 2023).
- Cheour, R.; Khriji, S.; Abid, M.; Kanoun, O. Microcontrollers for IoT: Optimizations, Computing Paradigms, and Future Directions. In Proceedings of the IEEE 6th World Forum on Internet of Things (WF-IoT), New Orleans, LA, USA, 2–16 June 2020; IEEE: New York, NY, USA, 2020; pp. 1–7. [Google Scholar]
- Raspberry Pi. Raspberry Pi 4 Model B Datasheet. 2019. Available online: https://www.raspberrypi.org (accessed on 27 March 2024).
- Aditama, G.K.L.; Wijaya, S.K.; Siagian, S.B.; Nugroho, W. Developing an IoT-Based Digital Climate Station at Dramaga Climate Observational Station. IOP Conf. Ser. Earth Environ. Sci. 2023, 1167, 012033. [Google Scholar] [CrossRef]
- Clerissi, D.; Reggio, G.; Leotta, M.; Ricca, F. Towards an approach for developing and testing node-red IoT systems. In Proceedings of the Ensemble 2018—1st ACM SIGSOFT International Workshop on Ensemble-Based Software Engineering, Co-Located with FSE 2018, Lake Buena Vista, FL, USA, 4 November 2018; pp. 1–8. [Google Scholar] [CrossRef]
- Libelium. Waspmote Technical Guide; Libelium: Zaragoza, Spain, 2016. [Google Scholar]
- Chan, K.; Schillereff, D.N.; Baas, A.C.; A Chadwick, M.; Main, B.; Mulligan, M.; O’shea, F.T.; Pearce, R.; EL Smith, T.; van Soesbergen, A.; et al. Low-cost electronic sensors for environmental research: Pitfalls and opportunities. Prog. Phys. Geogr. 2021, 45, 305–338. [Google Scholar] [CrossRef]
- Cross, E.S.; Williams, L.R.; Lewis, D.K.; Magoon, G.R.; Onasch, T.B.; Kaminsky, M.L.; Worsnop, D.R.; Jayne, J.T. Use of electrochemical sensors for measurement of air pollution: Correcting interference response and validating measurements. Atmos. Meas. Tech. 2017, 10, 3575–3588. [Google Scholar] [CrossRef]
- Christakis, I.; Sarri, E.; Tsakiridis, O.; Stavrakas, I. Investigation of LASSO Regression Method as a Correction Measurements’ Factor for Low-Cost Air Quality Sensors. Signals 2024, 5, 60–86. [Google Scholar] [CrossRef]
- Papaconstantinou, R.; Demosthenous, M.; Bezantakos, S.; Hadjigeorgiou, N.; Costi, M.; Stylianou, M.; Symeou, E.; Savvides, C.; Biskos, G. Field evaluation of low-cost electrochemical air quality gas sensors under extreme temperature and relative humidity conditions. Atmos. Meas. Tech. 2023, 16, 3313–3329. [Google Scholar] [CrossRef]
- Kaur, K.; Kelly, K.E. Performance evaluation of the Alphasense OPC-N3 and Plantower PMS5003 sensor in measuring dust events in the Salt Lake Valley, Utah. Atmos. Meas. Tech. 2023, 16, 2455–2470. [Google Scholar] [CrossRef]
Figure 1.
Overview of the hardware architecture of the IoT monitoring system.
Figure 1.
Overview of the hardware architecture of the IoT monitoring system.
Figure 2.
Flowchart used to collect, process, send, and receive measurements for (a) the HZS-GARP-AQ-04 and (b) the TBeam Receiver.
Figure 2.
Flowchart used to collect, process, send, and receive measurements for (a) the HZS-GARP-AQ-04 and (b) the TBeam Receiver.
Figure 3.
Software architecture in the Raspberry Pi used to collect and visualize data.
Figure 3.
Software architecture in the Raspberry Pi used to collect and visualize data.
Figure 4.
Node-RED flow for data acquisition and process.
Figure 4.
Node-RED flow for data acquisition and process.
Figure 5.
The sensor system and the reference system by Libelium deployed on the roof of the building of the Faculty of Electrical Engineering, Santa Clara, Cuba. (a) Front view showing the Libelium system attached at the bottom of the grid. (b) The setup seen in frog perspective showing the IoT sensor system underneath the large solar panel.
Figure 6.
Grafana dashboard for the visualization of output variables of the unified IoT platform.
Figure 6.
Grafana dashboard for the visualization of output variables of the unified IoT platform.
Figure 7.
Temperature and relative humidity collected by the remote sensor system and the reference system by Libelium, complemented by meteorological information from the Bresser station.
Figure 7.
Temperature and relative humidity collected by the remote sensor system and the reference system by Libelium, complemented by meteorological information from the Bresser station.
Figure 8.
Dynamic patterns of pollutants observed on 5 and 6 March 2024, just before and after rainfall, following the activation of the unified IoT platform and the Libelium system at the same location.
Figure 8.
Dynamic patterns of pollutants observed on 5 and 6 March 2024, just before and after rainfall, following the activation of the unified IoT platform and the Libelium system at the same location.
Figure 9.
Relation between the measurements of HZS-GARP-AQ-04 and Libelium Smart Environment Pro for gaseous pollutants.
Figure 9.
Relation between the measurements of HZS-GARP-AQ-04 and Libelium Smart Environment Pro for gaseous pollutants.
Figure 10.
Relation between the measurements of HZS-GARP-AQ-04 and Libelium Smart Environment Pro for Temperature, RH, and particulate matter.
Figure 10.
Relation between the measurements of HZS-GARP-AQ-04 and Libelium Smart Environment Pro for Temperature, RH, and particulate matter.
Table 1.
IoT air quality and meteorological monitoring-related research.
Table 1.
IoT air quality and meteorological monitoring-related research.
| Issue | Air Quality Variables | Meteorological Variables | Microcontrollers and Single-Board Computers | Network | IoT
Platform |
|---|
| [35] | No | T, RH, AP, rainfall | Node MCU | WiFi | Web page |
| [36] | No | T, RH, AP, rainfall, solar intensity | ESP32 | WiFi | ThingSpeak |
| [37] | No | T, RH, rainfall, solar intensity, vibration | Raspberry Pi 3 | WiFi | ThingSpeak |
| [38] | CO, CO2, PM2.5 | No | Arduino UNO | WiFi | Web page |
| [39] | O3, NO2, SO2, CO | T, RH | Arduino UNO | WiFi | Web page |
| [40] | NO2, CO | T, RH | Node MCU | WiFi | Google Sheet |
| [16] | CO, PM1, PM2.5, PM10 | T, RH | Raspberry Pi 4 | WiFi | No |
| [41] | O3 | T, RH, AP, rainfall, WS, WD | Arduino Mega | NB-IoT | Grafana |
| [42] | CO, CO2, O3, CH4, Ammonia, Hydrogen | T, RH, AP, rainfall, WS, WD, UVI | ESP32 | GSM | Web page |
| [43] | CO2, NO2 | T, RH, AP | ESP32 | WiFi | Node-RED |
| [13] | CO2, PM1, PM2.5, PM10 | T, RH, AP | STM32 ARM Cortex M3 and Node MCU | WiFi | ThingSpeak |
| [44] | O3, NO2, SO2, CO | T, RH, AP, rainfall, WS, WD | PIC and
Raspberry Pi 3 | WiFi/GSM | Web page |
| [45] | O3, NOx, PM2.5 | T, RH, WS, WD | ESP32 | LoRa | The Things Network |
| [46] | PM2.5, PM10 | T, RH | Mediatek LinkIt One | GSM | Web page |
| [47] | CO, VOC, PM2.5, PM10 | T, RH, AP | Arduino UNO and Node MCU | WiFi | ThingSpeak |
| [48] | CO, NO2, VOC | T, RH, AP | ESP32 LoRa SX1278 | LoRa | The Things Network |
Table 2.
Meteorological variables measured by the Bresser 5-in-1 and the corresponding detection ranges.
Table 2.
Meteorological variables measured by the Bresser 5-in-1 and the corresponding detection ranges.
| Variable | Detection Range |
|---|
| Temperature | −40–80 °C |
| Relative humidity | 0–100% |
| Rainfall | 0–9999 mm |
| Wind speed | 0–180 km/h |
| Wind direction | 0–360° |
Table 3.
Sensors and variables measured by the in-house developed sensor box HZS-GARP-AQ-04.
Table 3.
Sensors and variables measured by the in-house developed sensor box HZS-GARP-AQ-04.
| Sensor | Variable | Interface | Detection Range |
|---|
| Sensirion SCD30 | CO2 | I2C | 400–10,000 ppm |
| Nova SDS011 | PM2.5/PM10 | UART | 0–999.9 μg/m3 |
| BME280 | T/RH/AP | I2C | 0–100%/−40–85 °C/300–1100 hPa |
| OX-A431 | O3 | Analog | 0–20 ppm |
| SO2-A4 | SO2 | Analog | 0–50 ppm |
| NO2-A43F | NO2 | Analog | 0–20 ppm |
| CO-AX | CO | Analog | 0–2000 ppm |
Table 4.
Statistical overview of some of the collected parameters with the two monitoring systems supplemented with statistical tests to assess the correlation between both systems.
Table 4.
Statistical overview of some of the collected parameters with the two monitoring systems supplemented with statistical tests to assess the correlation between both systems.
| Variable | HZS-GARP-AQ-04
Mean ± Stdev | Libelium
Mean ± Stdev | Cross
Correlation | RMSE | R2 |
|---|
| Temperature (°C) | 30 ± 6 | 26 ± 5 | 0.99 | 4.87 | 0.98 |
| Humidity (%) | 65 ± 22 | 80 ± 26 | 0.99 | 15.72 | 0.98 |
| SO2 (ppb) | 125 ± 52 | 82 ± 20 | 0.47 | 63.32 | 0.22 |
| NO2 (ppb) | 89 ± 38 | 150 ± 18 | 0.46 | 69.74 | 0.21 |
| CO (ppb) | 220 ± 180 | 86 ± 60 | 0.77 | 194.56 | 0.63 |
| PM2.5 (μg/m3) | 5 ± 3 | 14 ± 10 | 0.91 | 11.40 | 0.85 |
| PM10 (μg/m3) | 11 ± 4 | 32 ± 25 | 0.81 | 29.88 | 0.66 |
| Disclaimer/Publisher’s Note: The statements, opinions and data contained in all publications are solely those of the individual author(s) and contributor(s) and not of MDPI and/or the editor(s). MDPI and/or the editor(s) disclaim responsibility for any injury to people or property resulting from any ideas, methods, instructions or products referred to in the content. |
© 2024 by the authors. Licensee MDPI, Basel, Switzerland. This article is an open access article distributed under the terms and conditions of the Creative Commons Attribution (CC BY) license (https://creativecommons.org/licenses/by/4.0/).


 ,
, 


