
A Real-Time Monitoring Method for Droplet Transfer Frequency in Wire-Filled GTAW Based on Arc Sensing

Abstract
1. Introduction
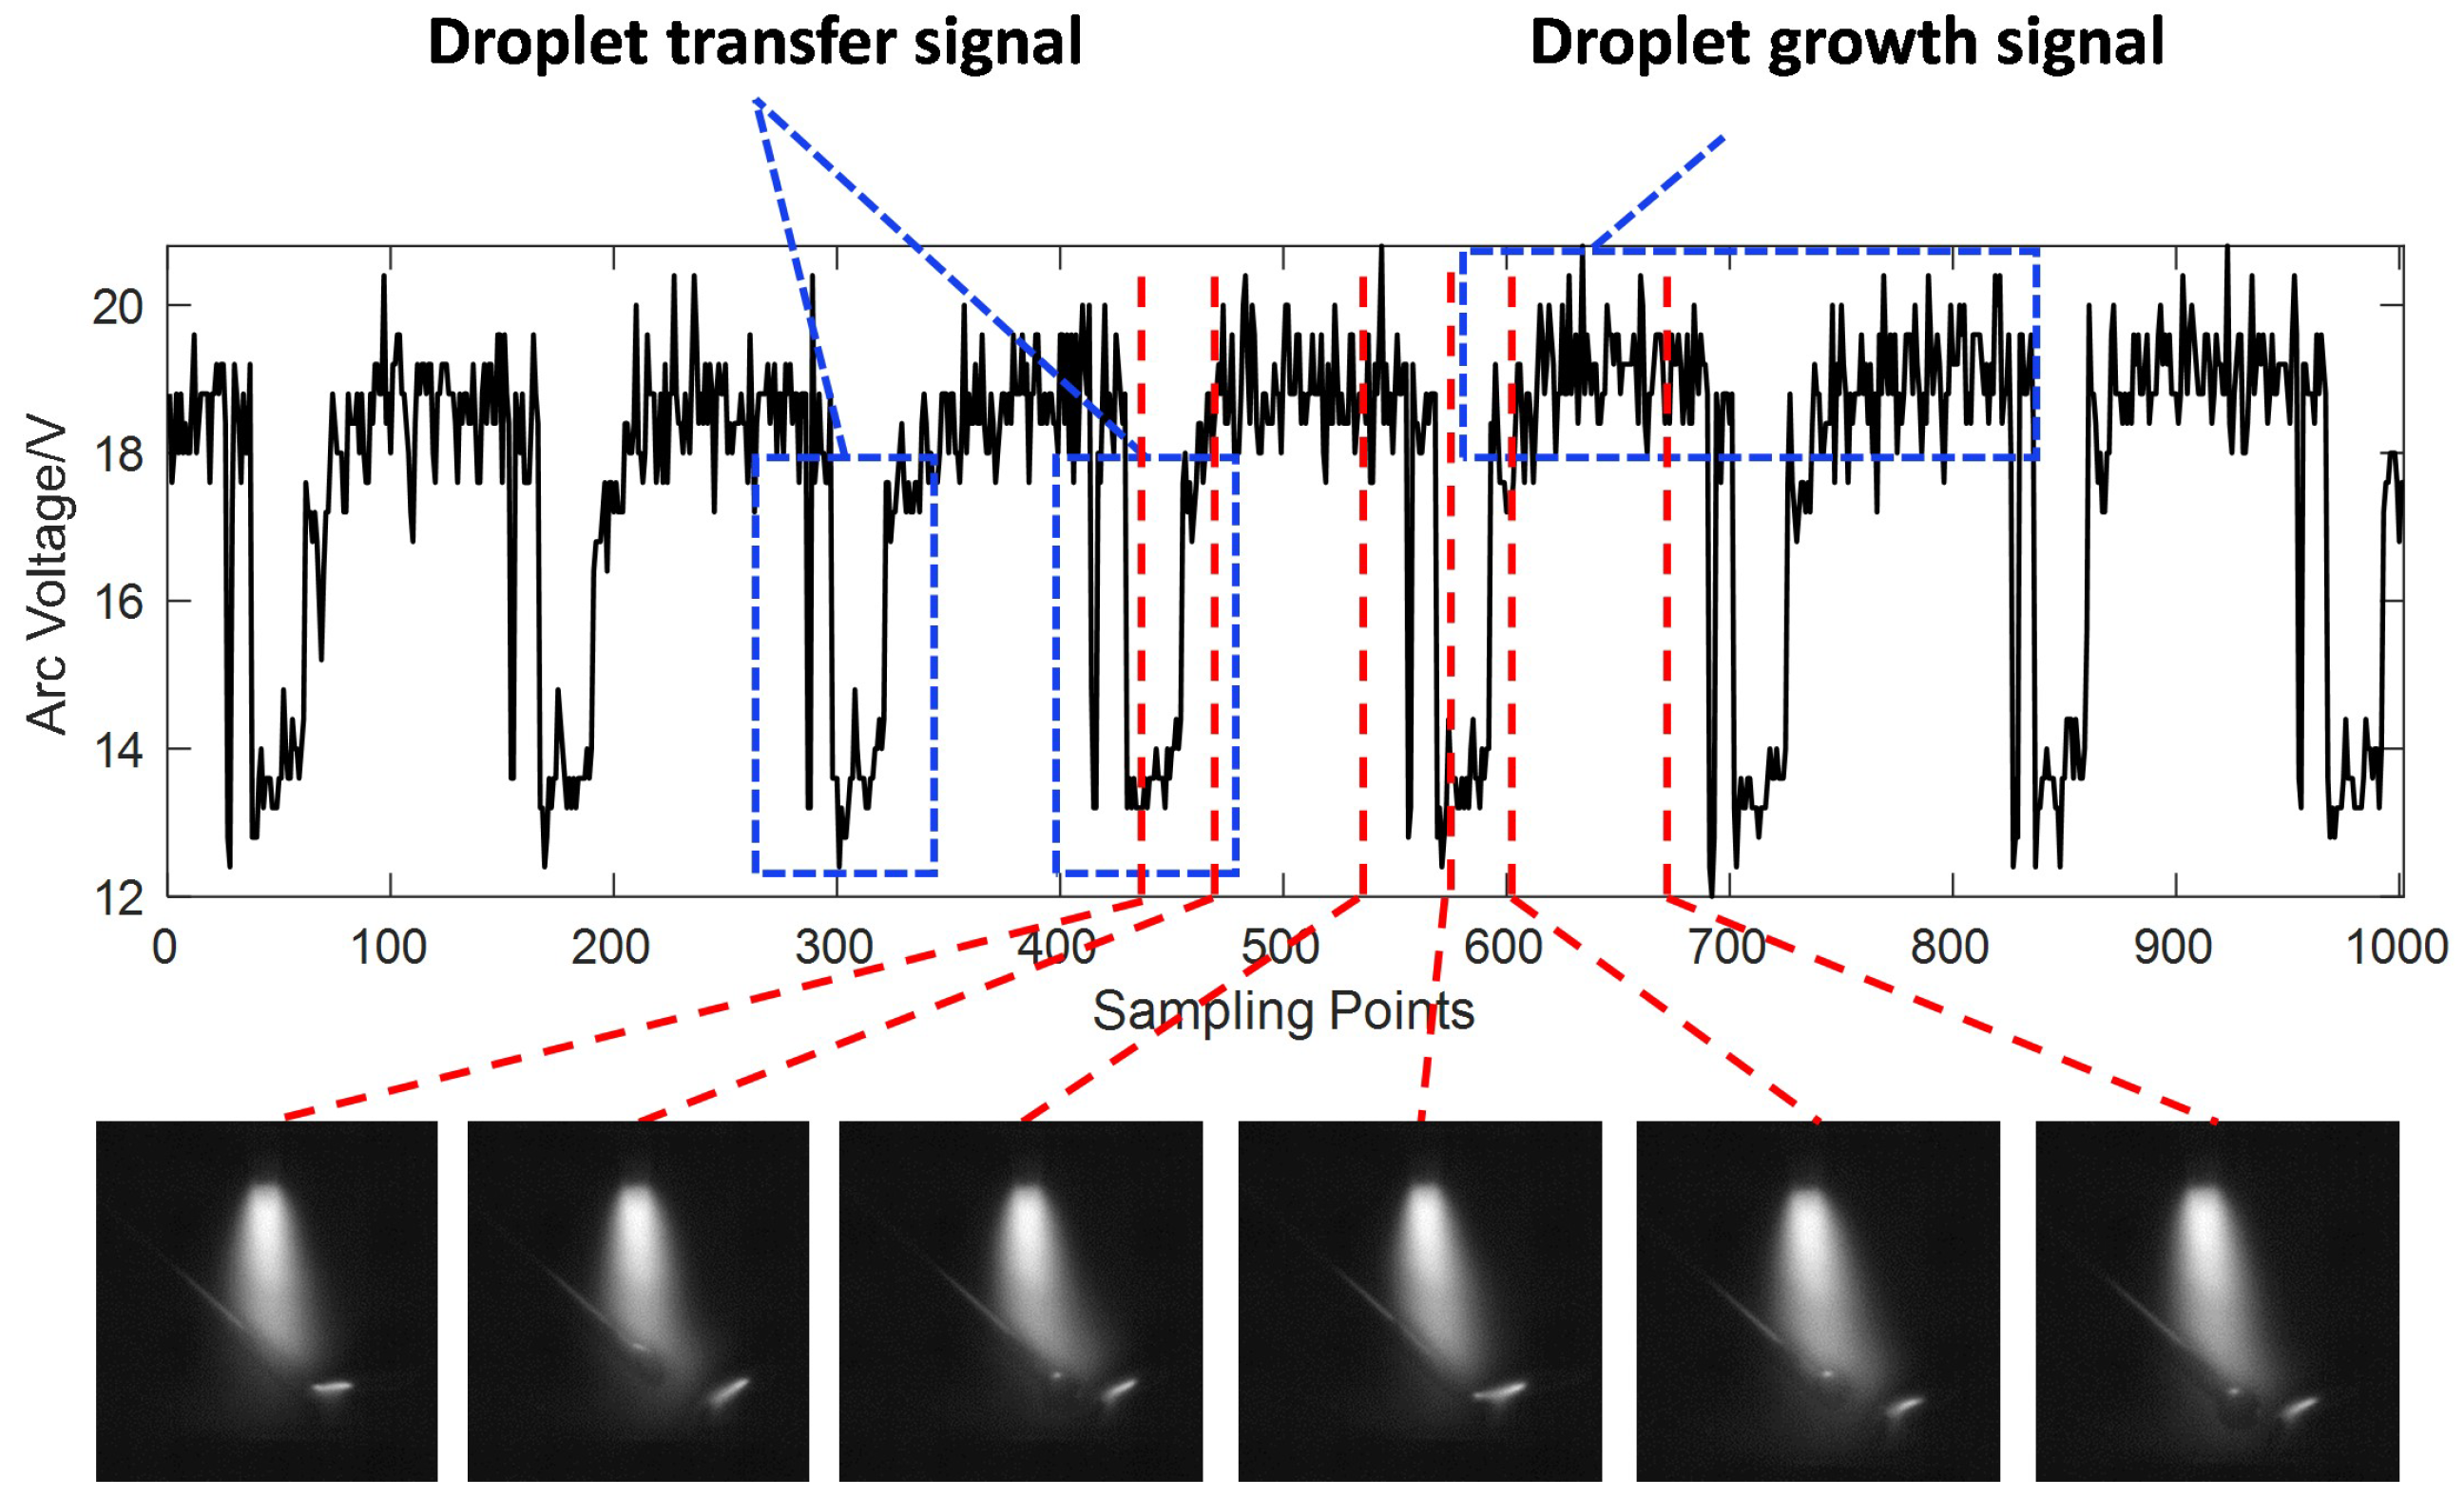
2. Principles
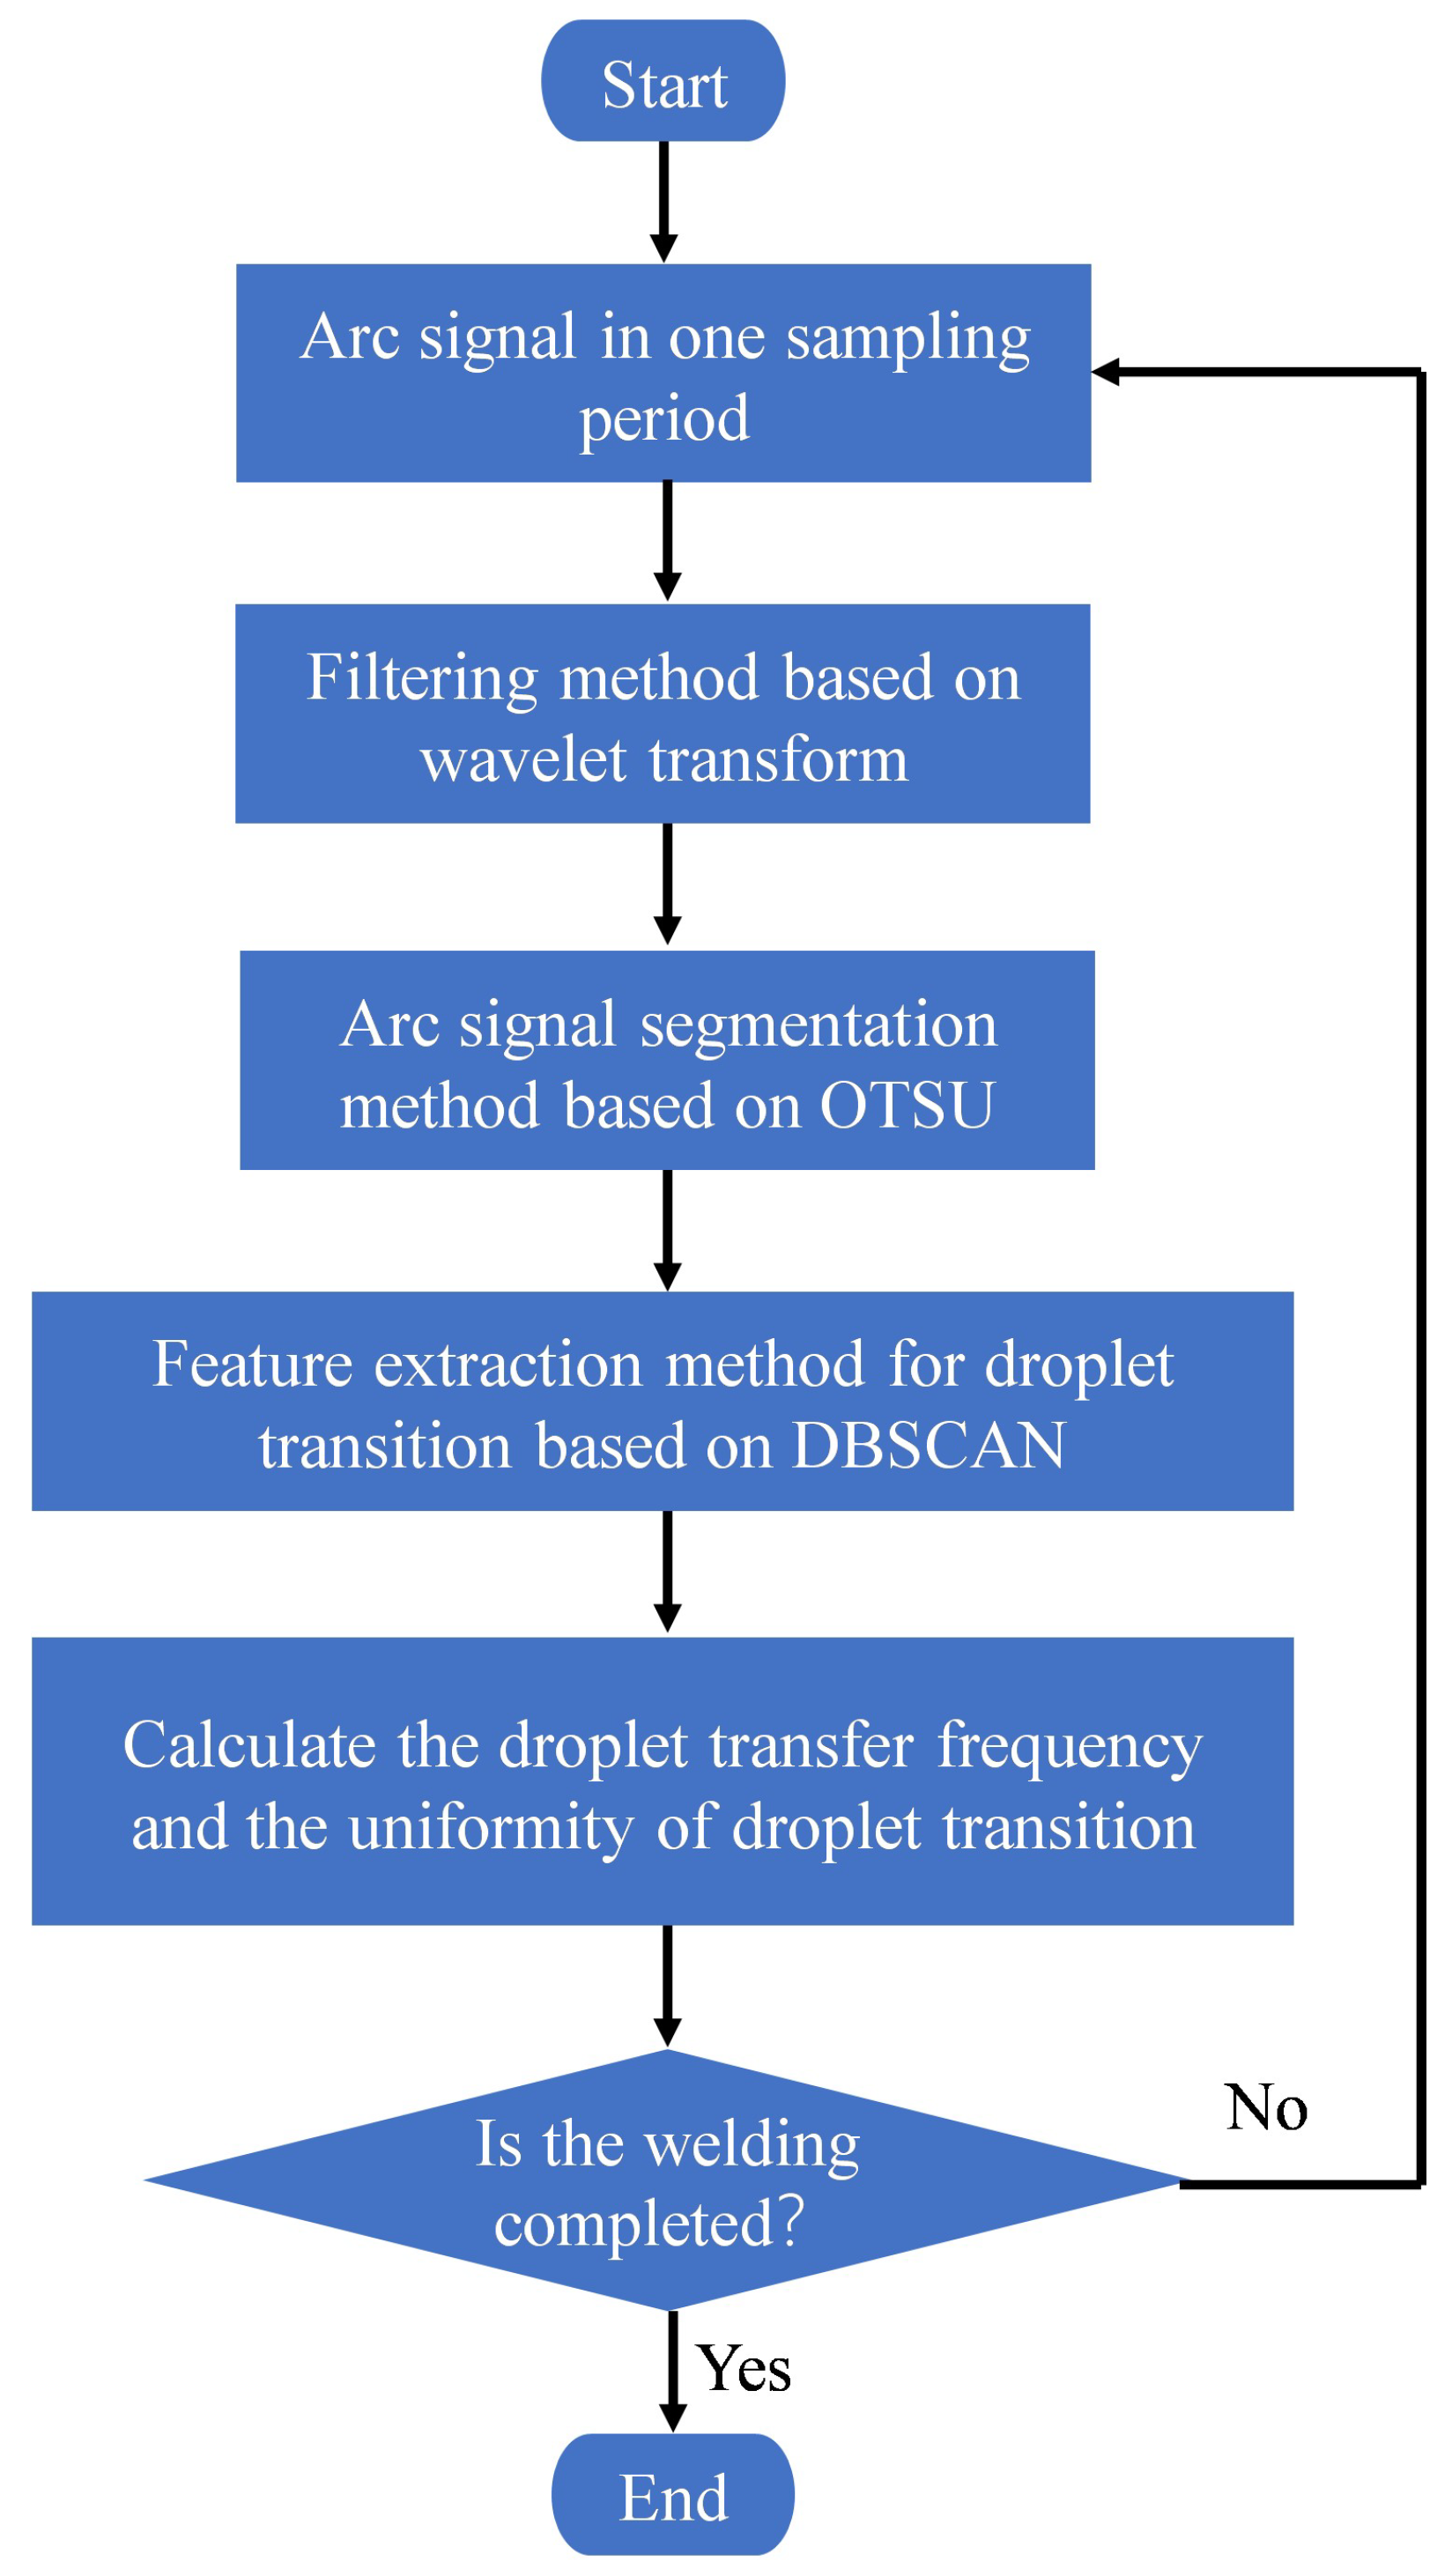
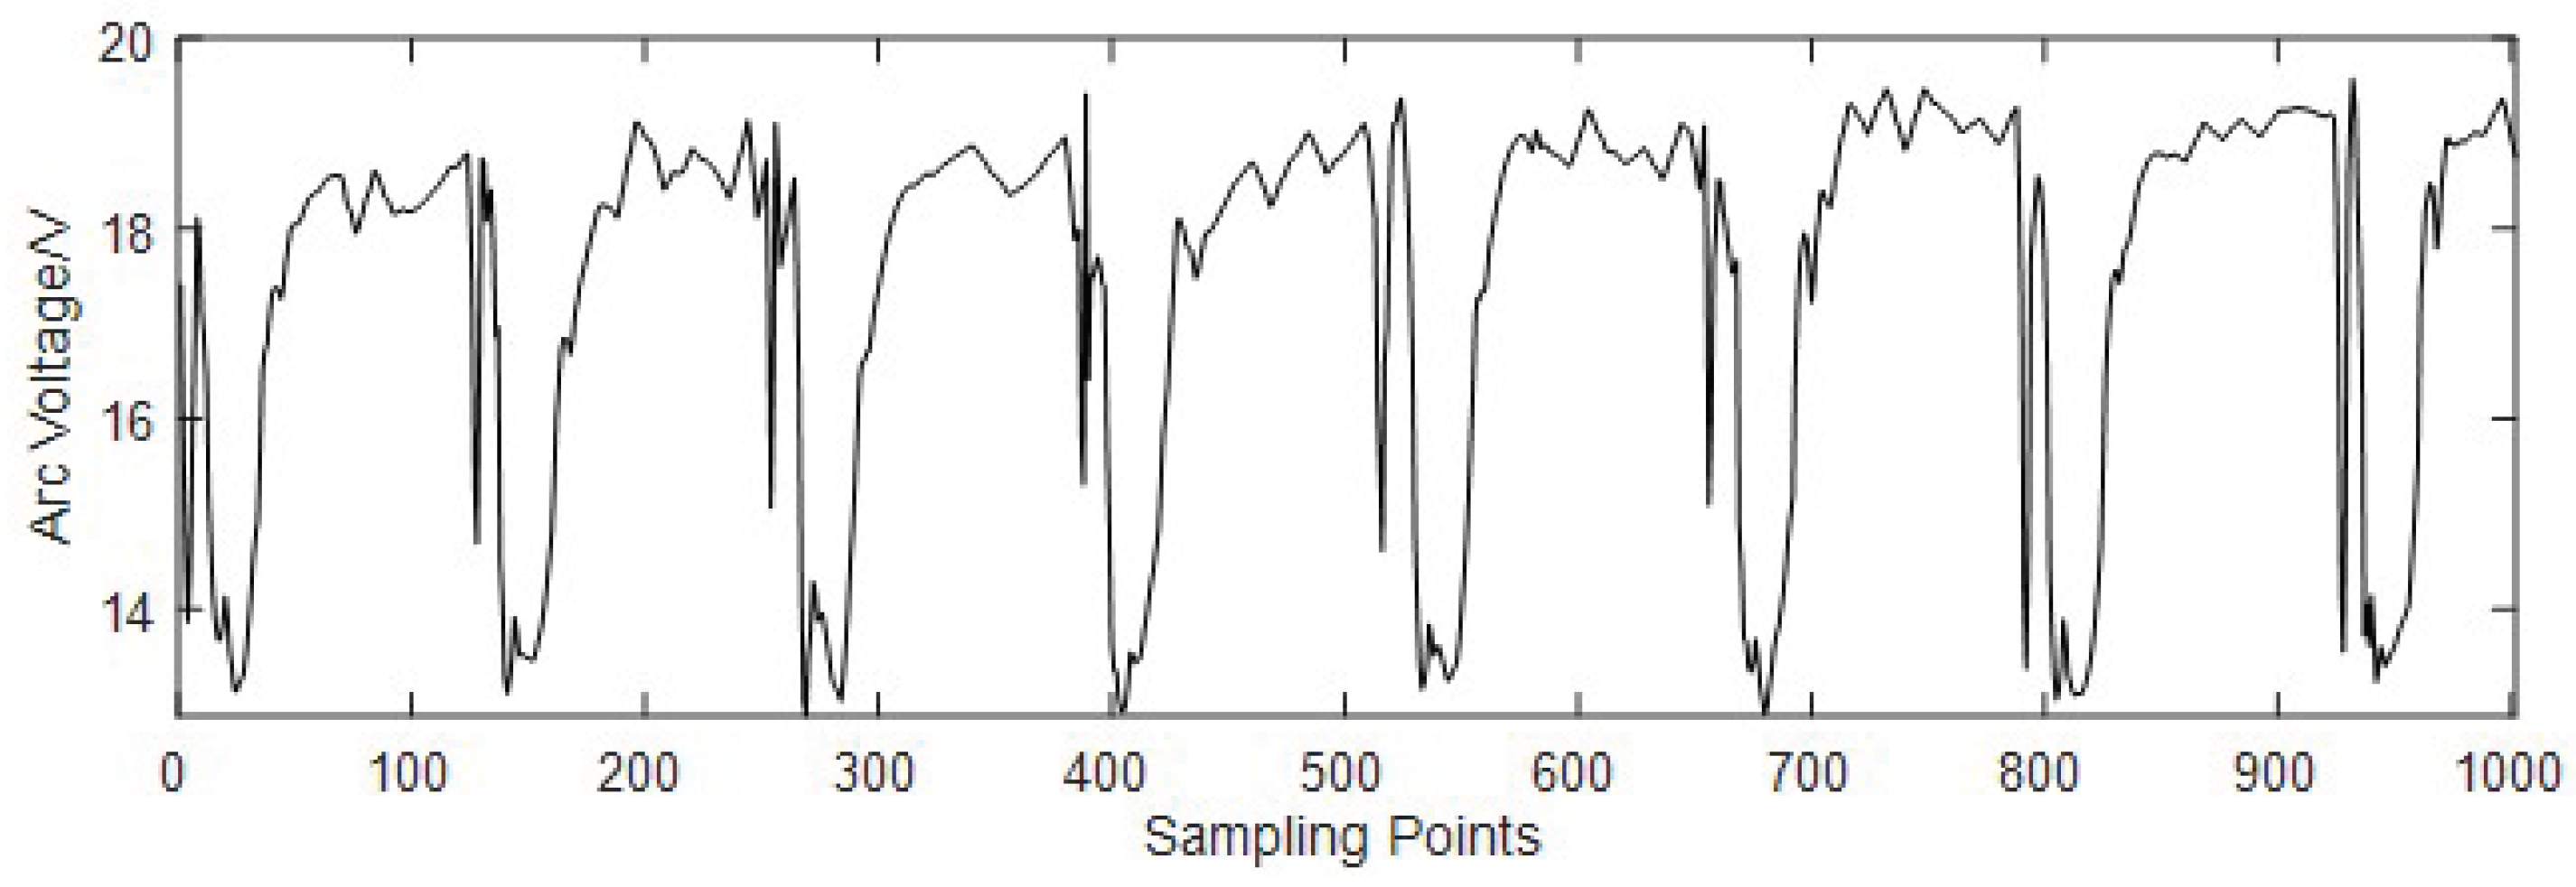
2.1. Filtering Method Based on Wavelet Transforms
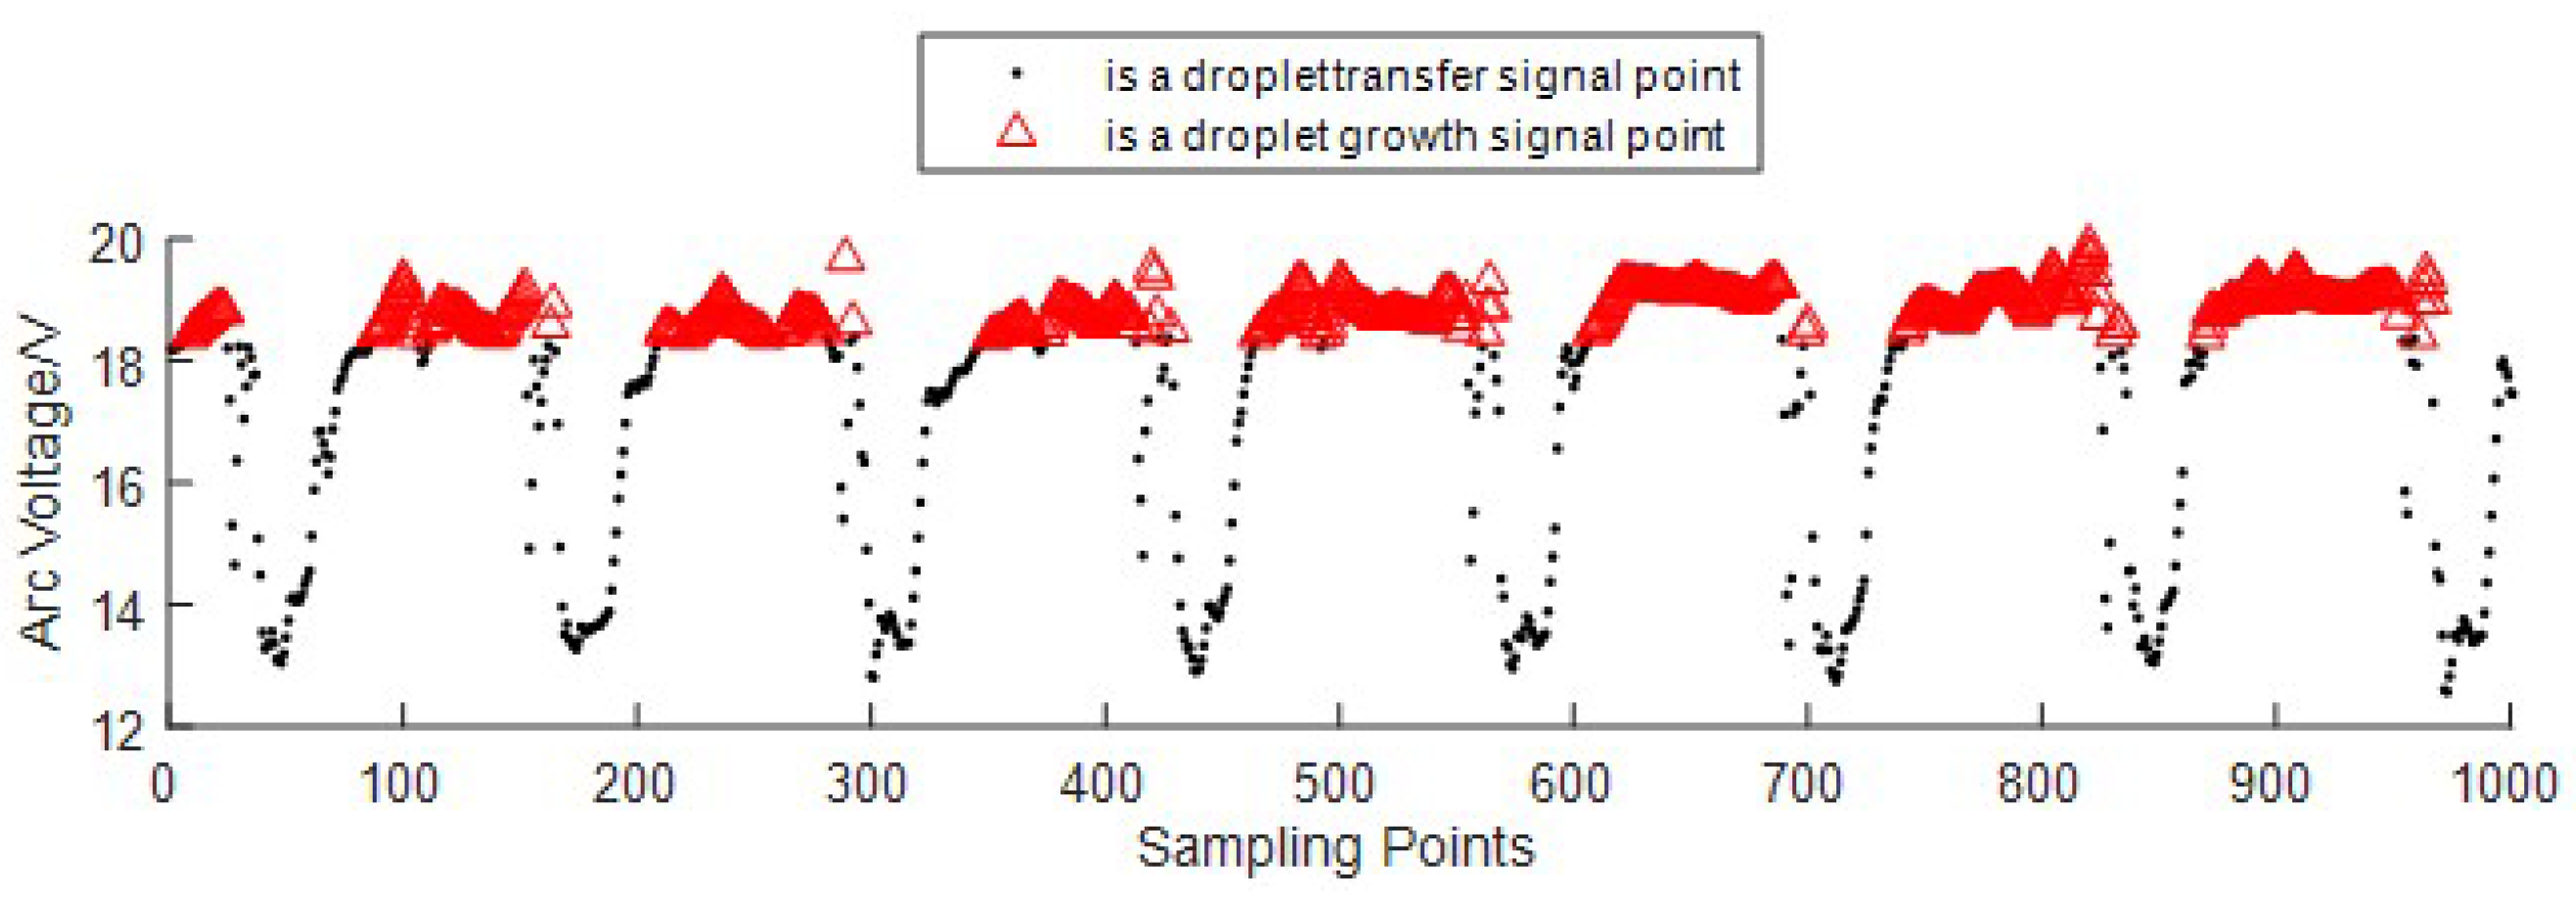
2.2. Arc Signal Segmentation Method Based on the OTSU Algorithm
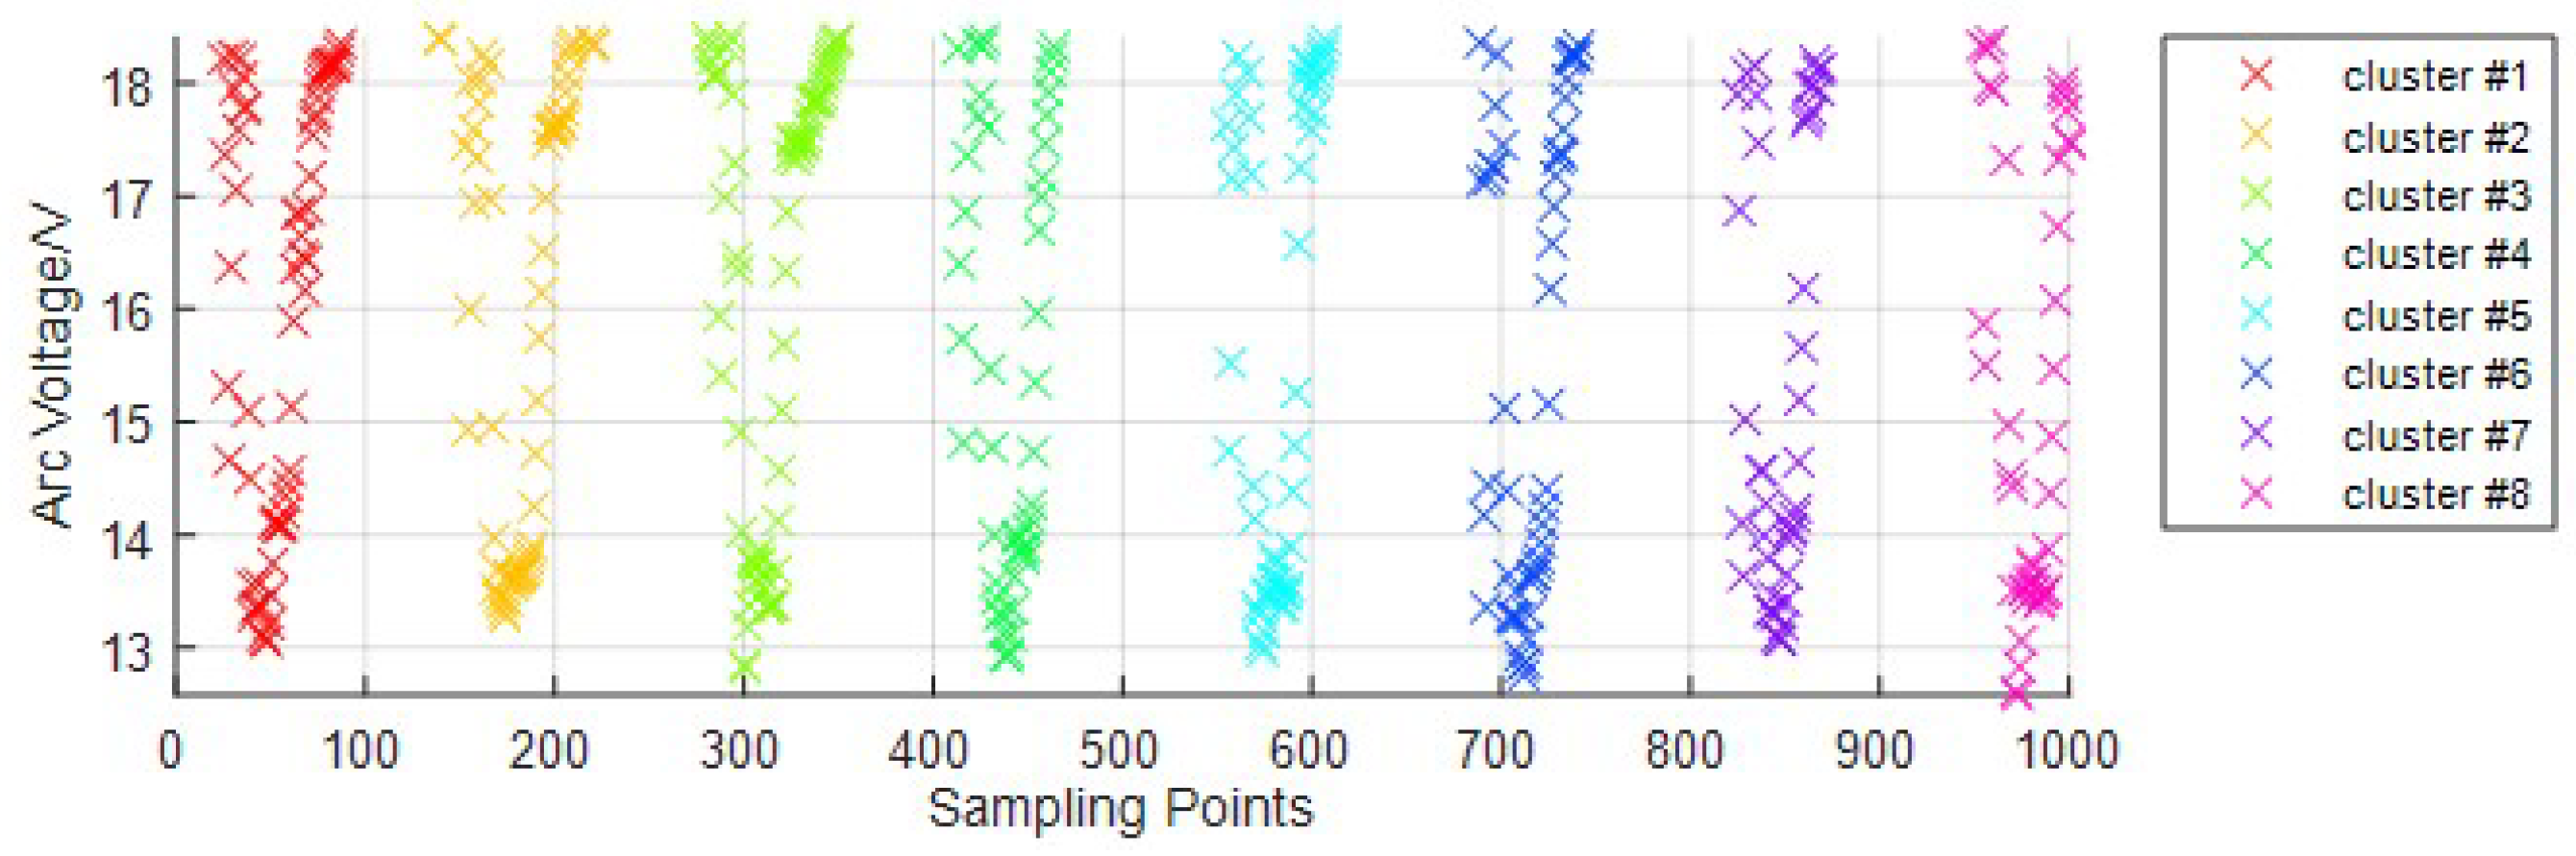
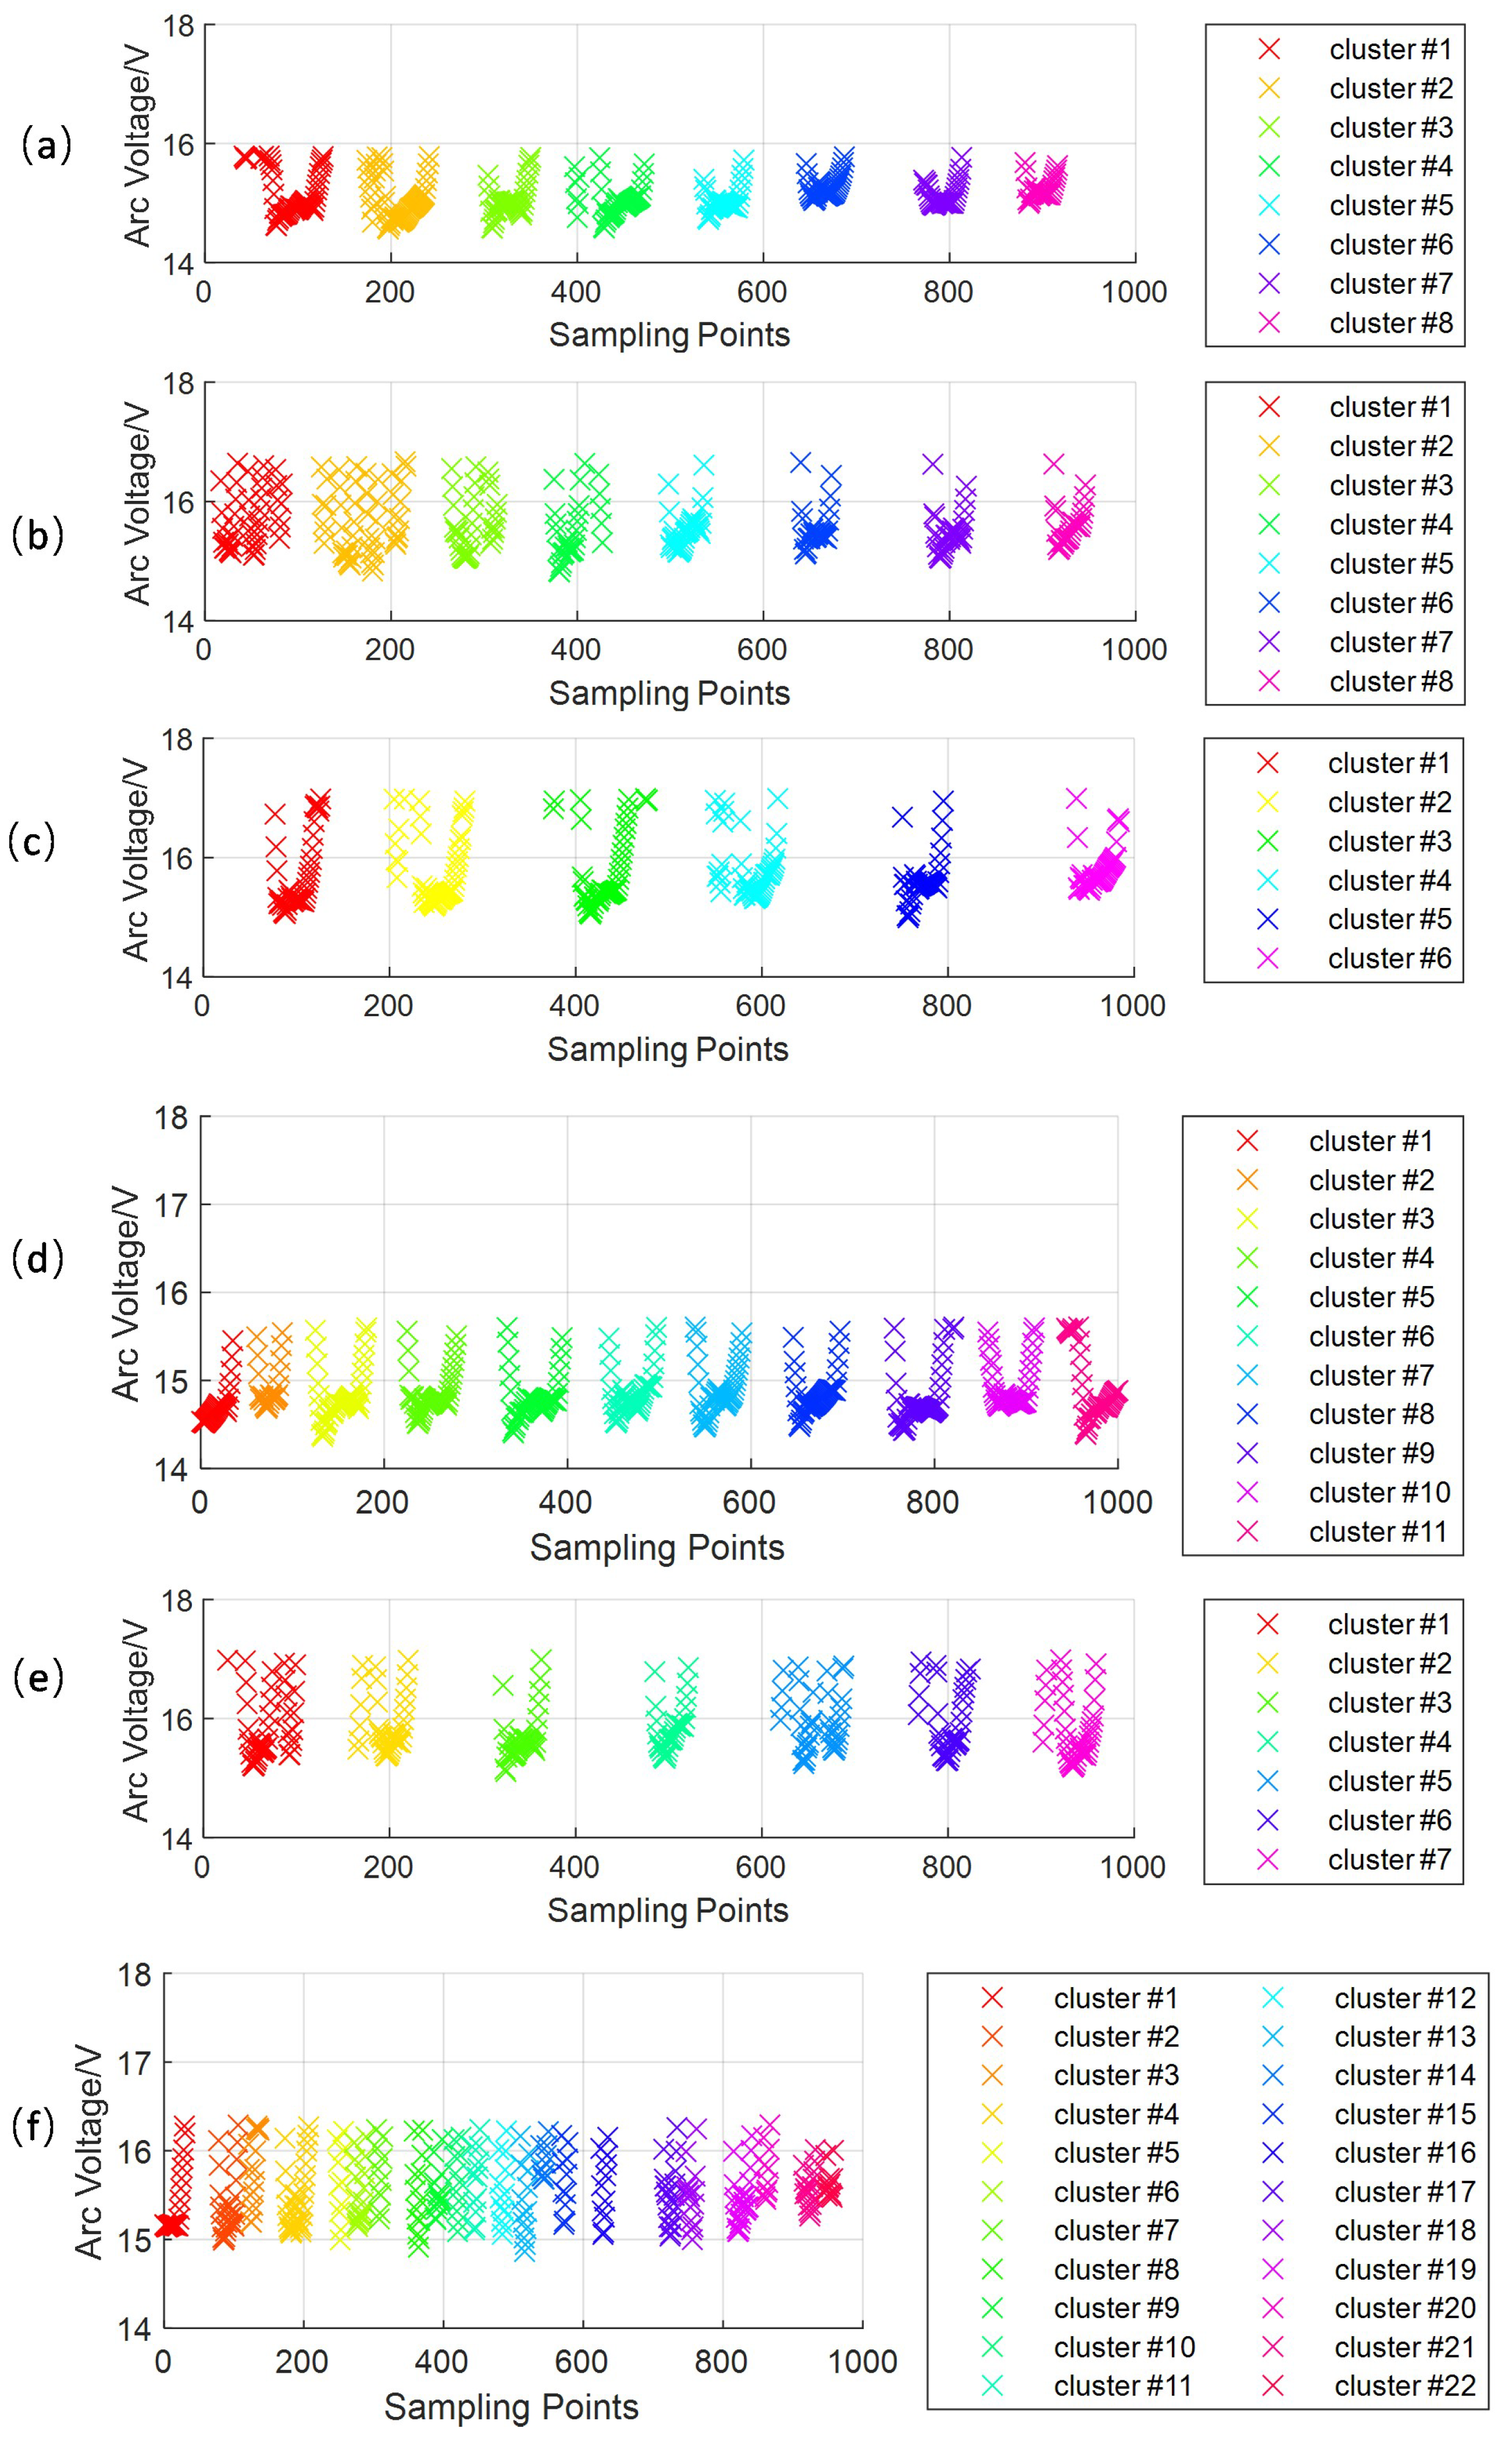
2.3. Feature Extraction Method for Droplet Transition Based on DBSCAN
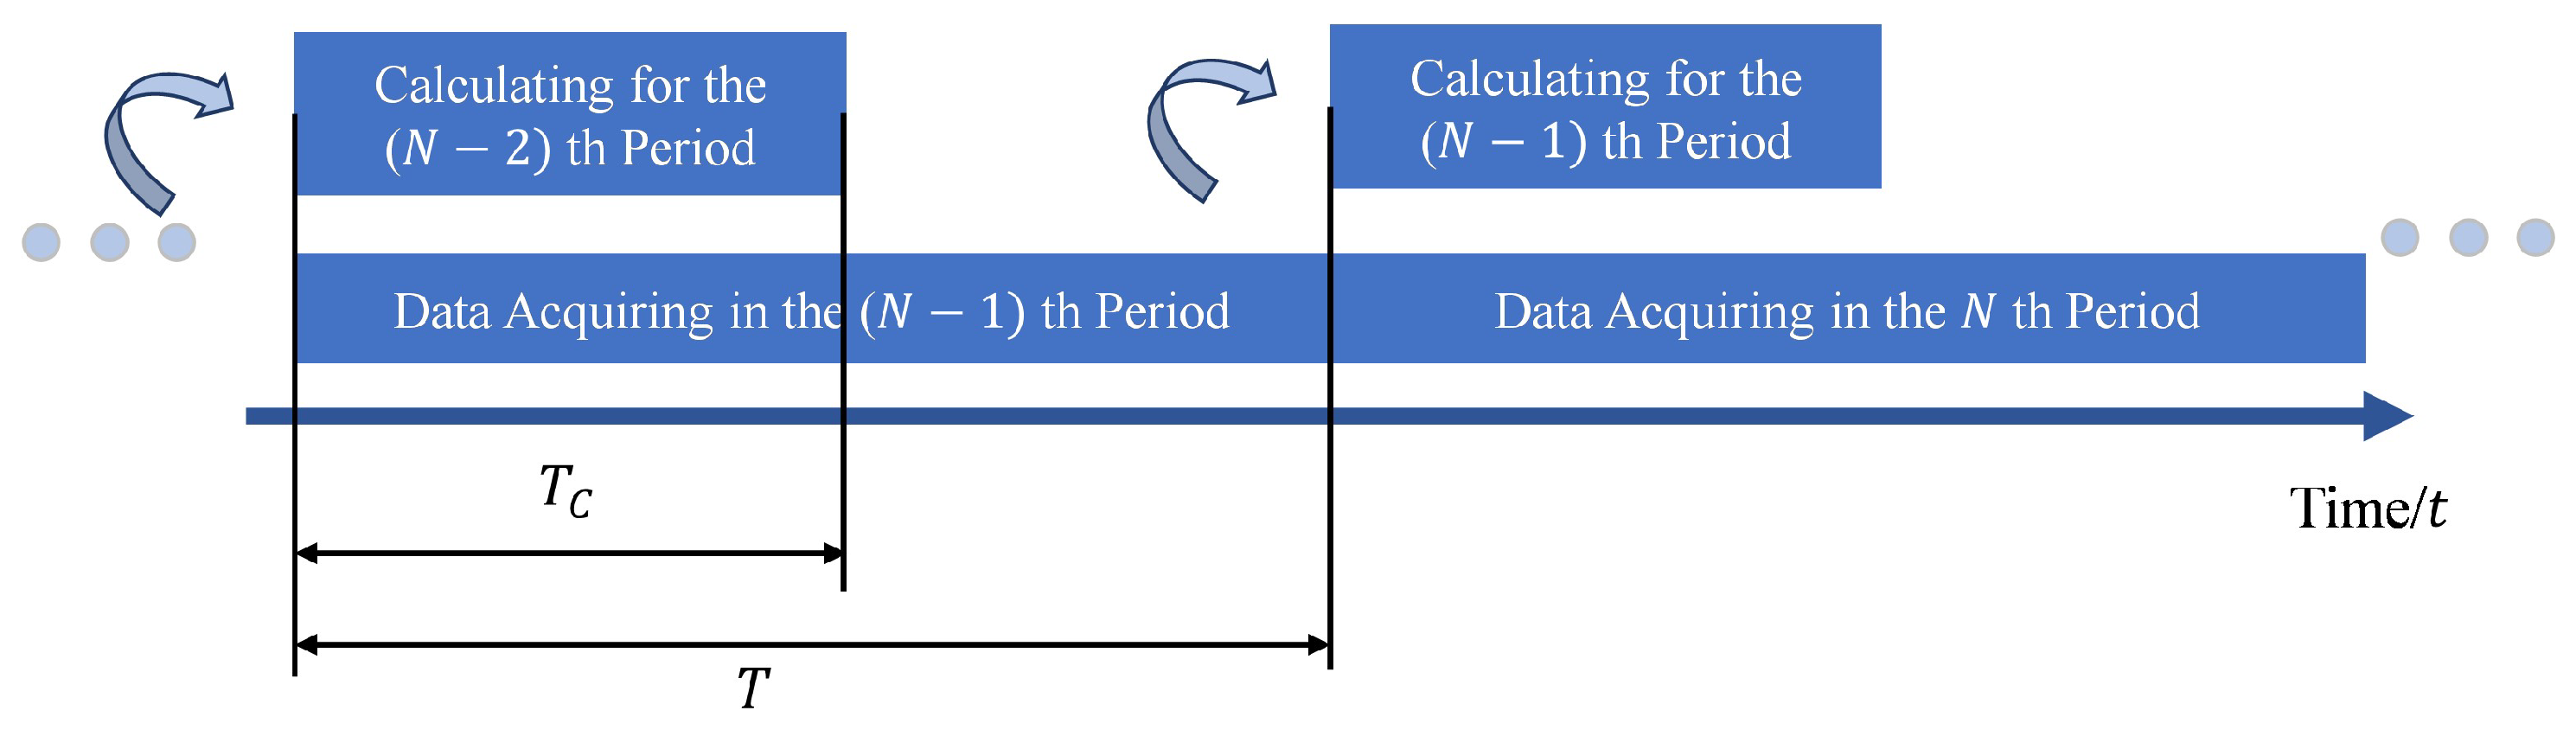
2.4. Real-Time Extraction for Droplet Transfer Frequency and Droplet Transition Uniformity
2.5. Algorithm Efficiency Analysis
3. Experimental Results and Analysis
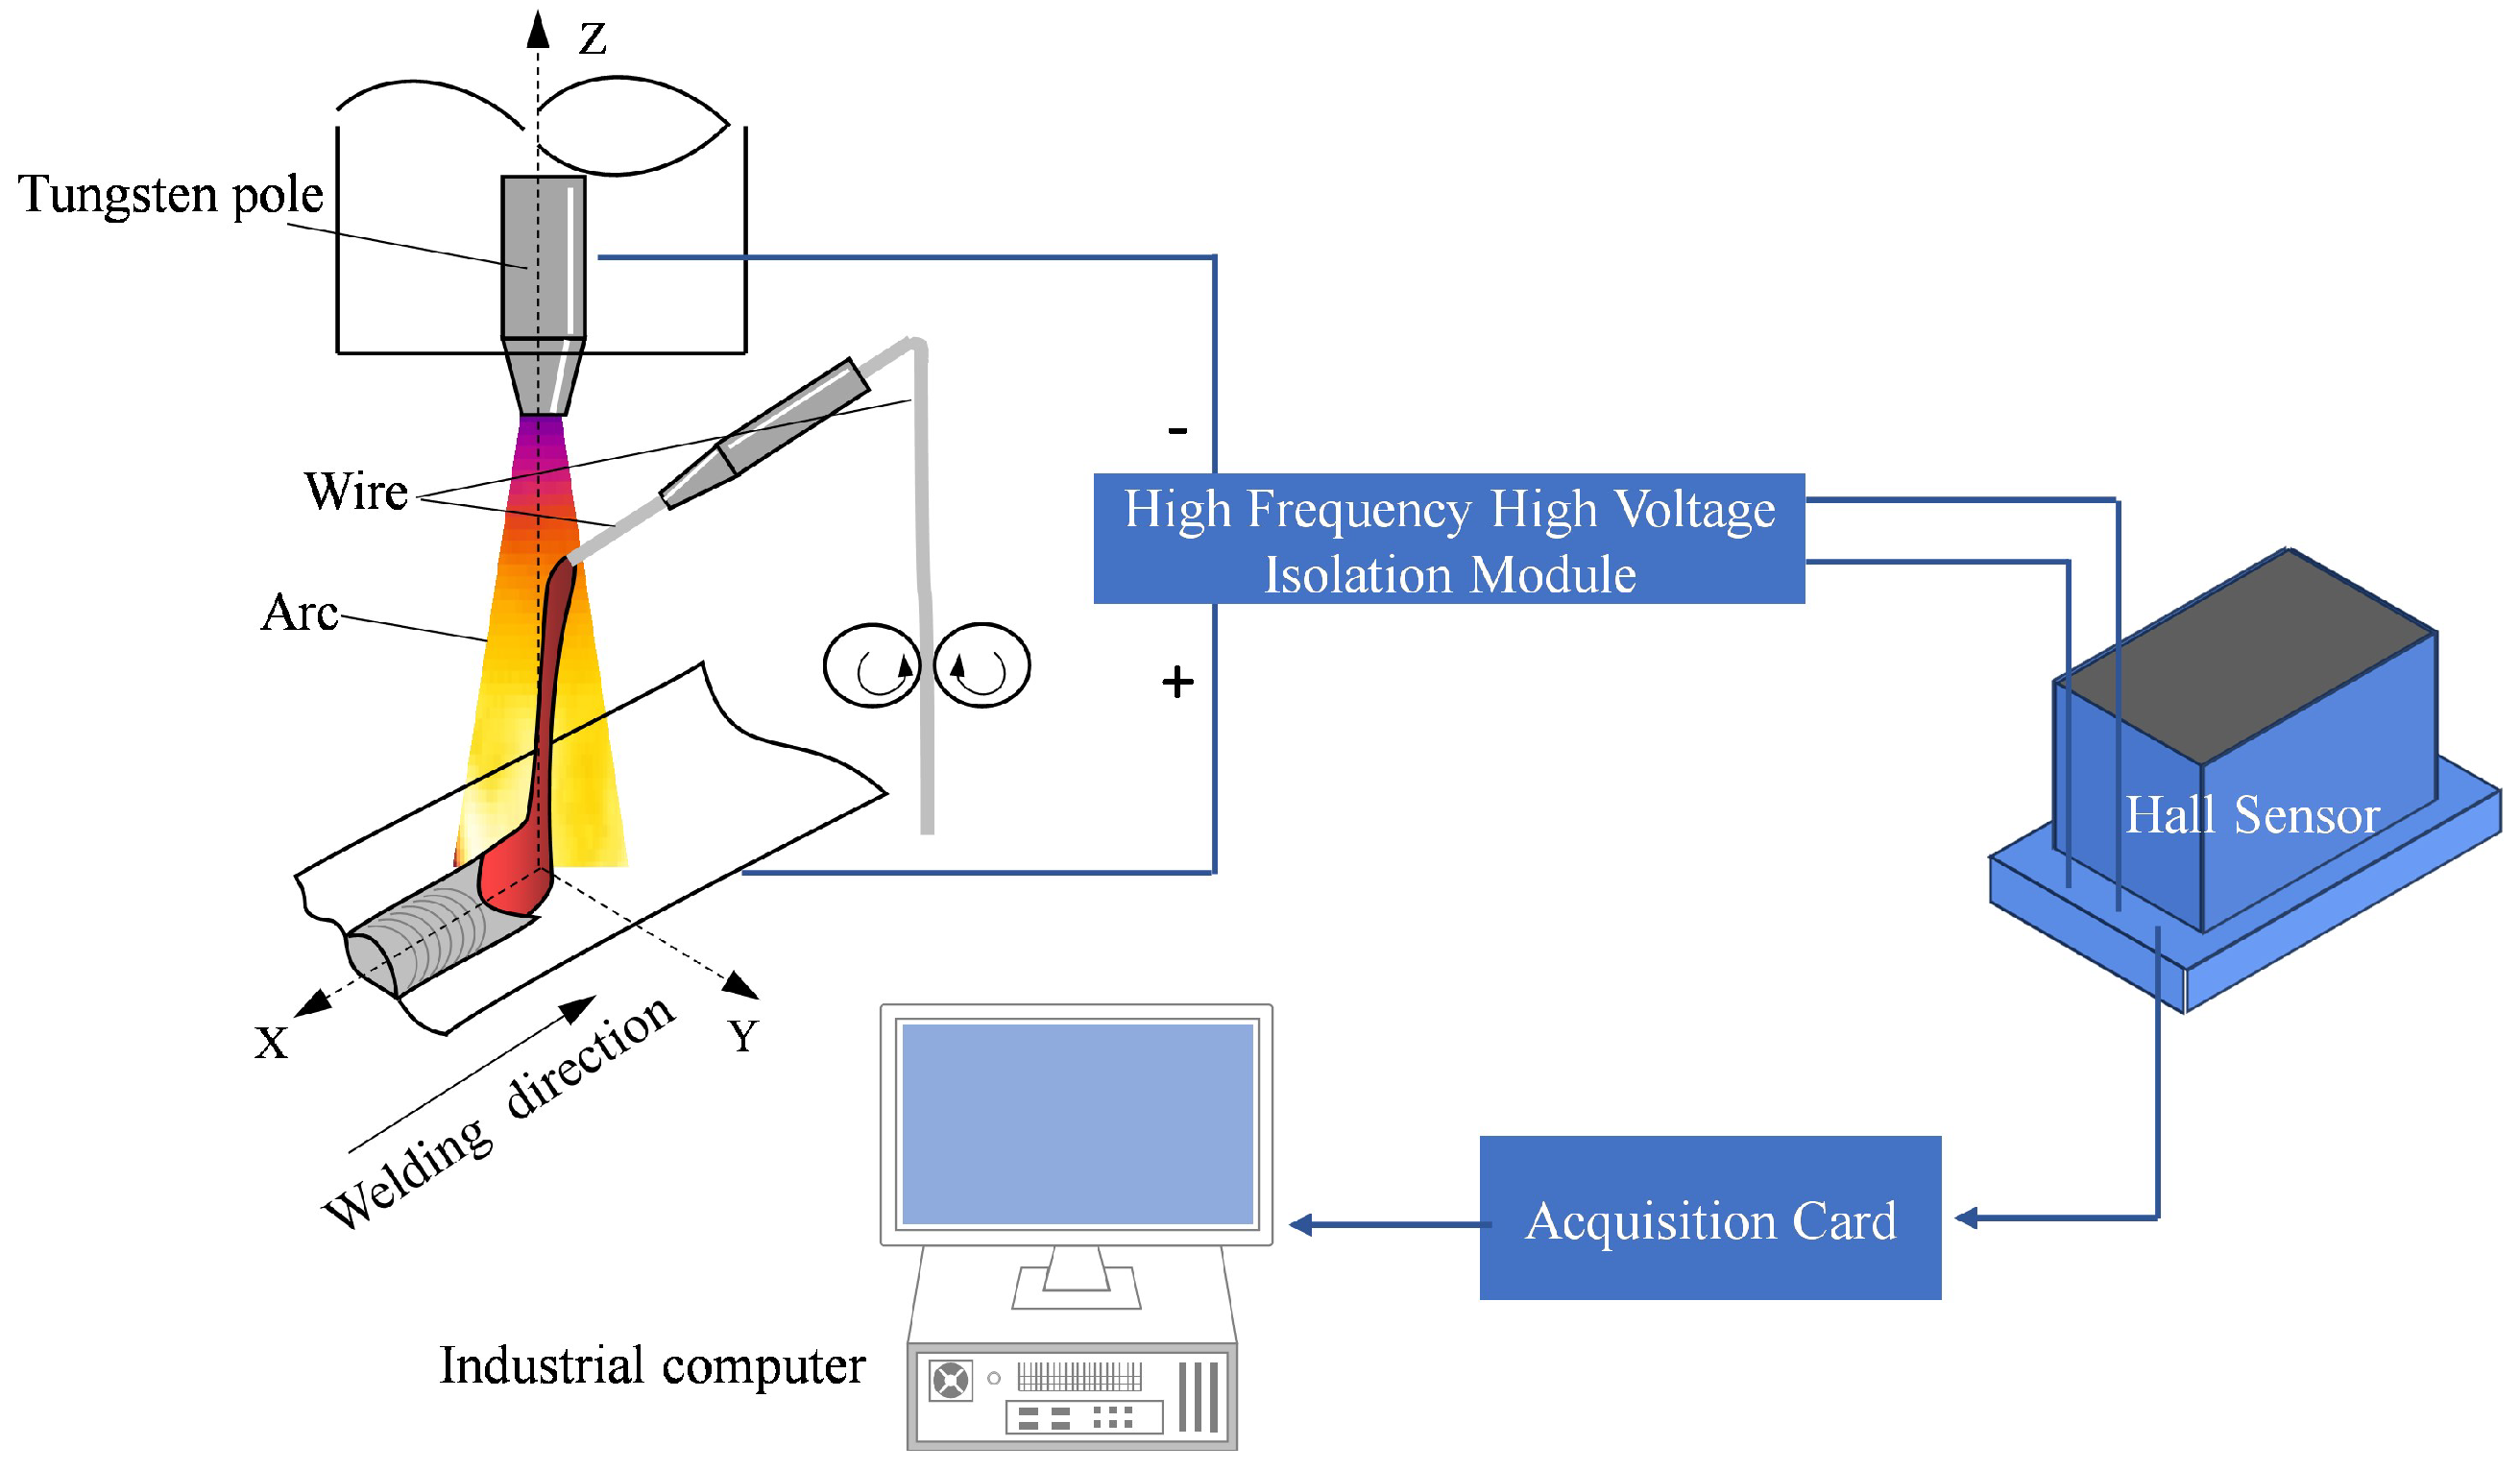
3.1. Experimental Equipment
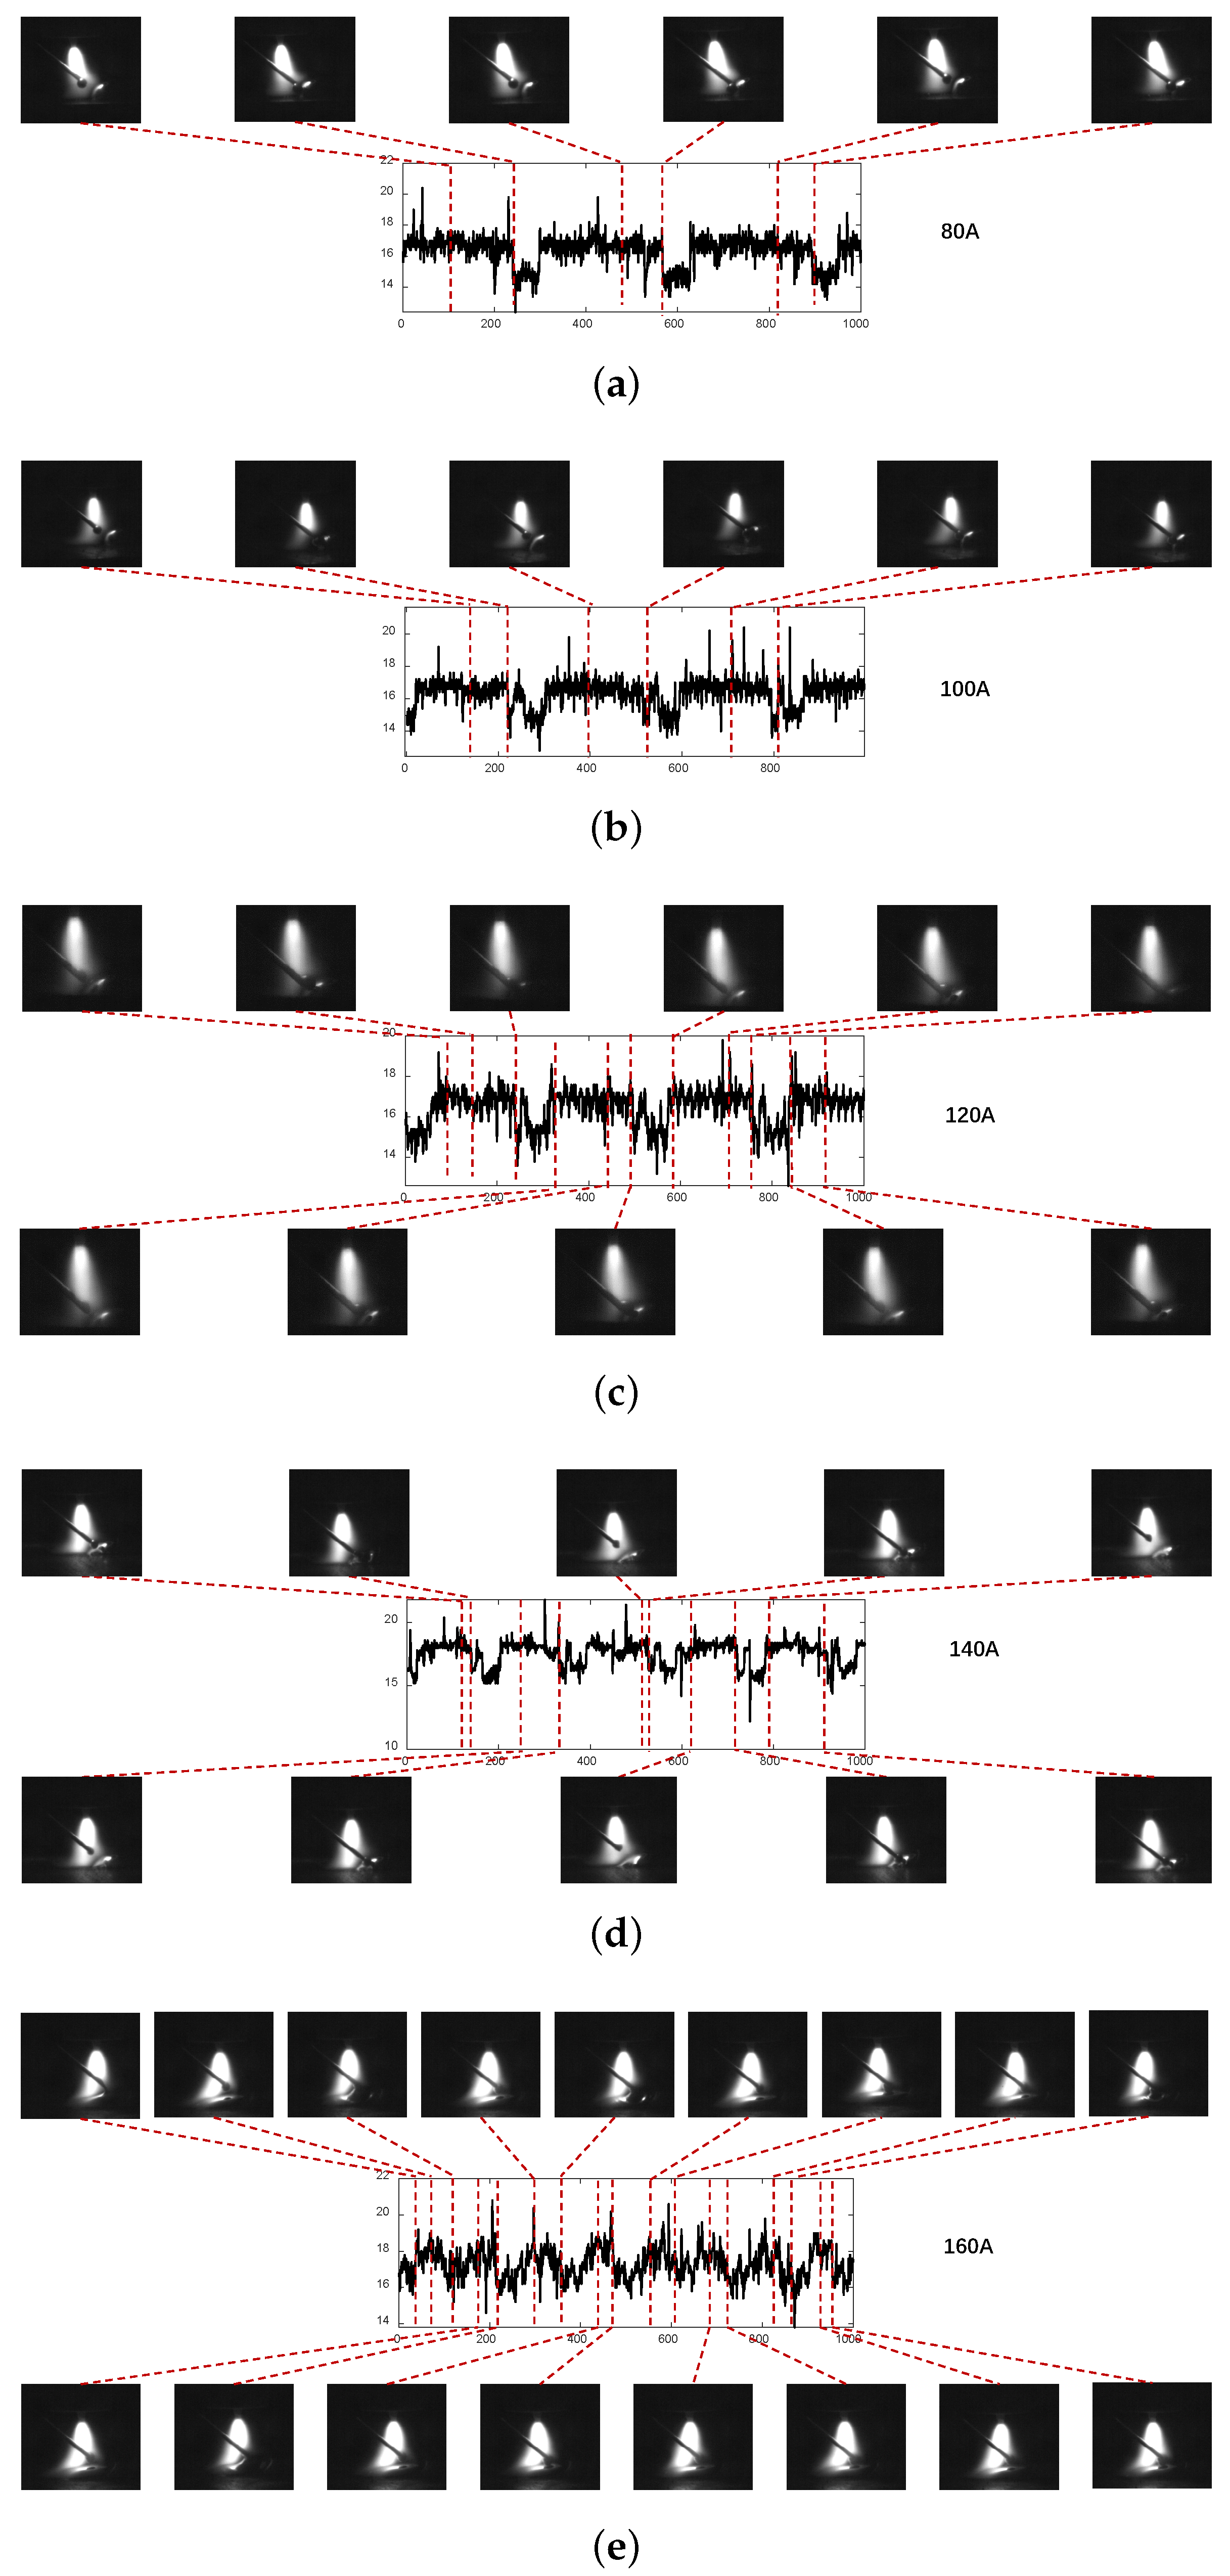
3.2. Real-Time Monitoring Experiment of Droplet Transfer Frequency
3.3. Error Analysis
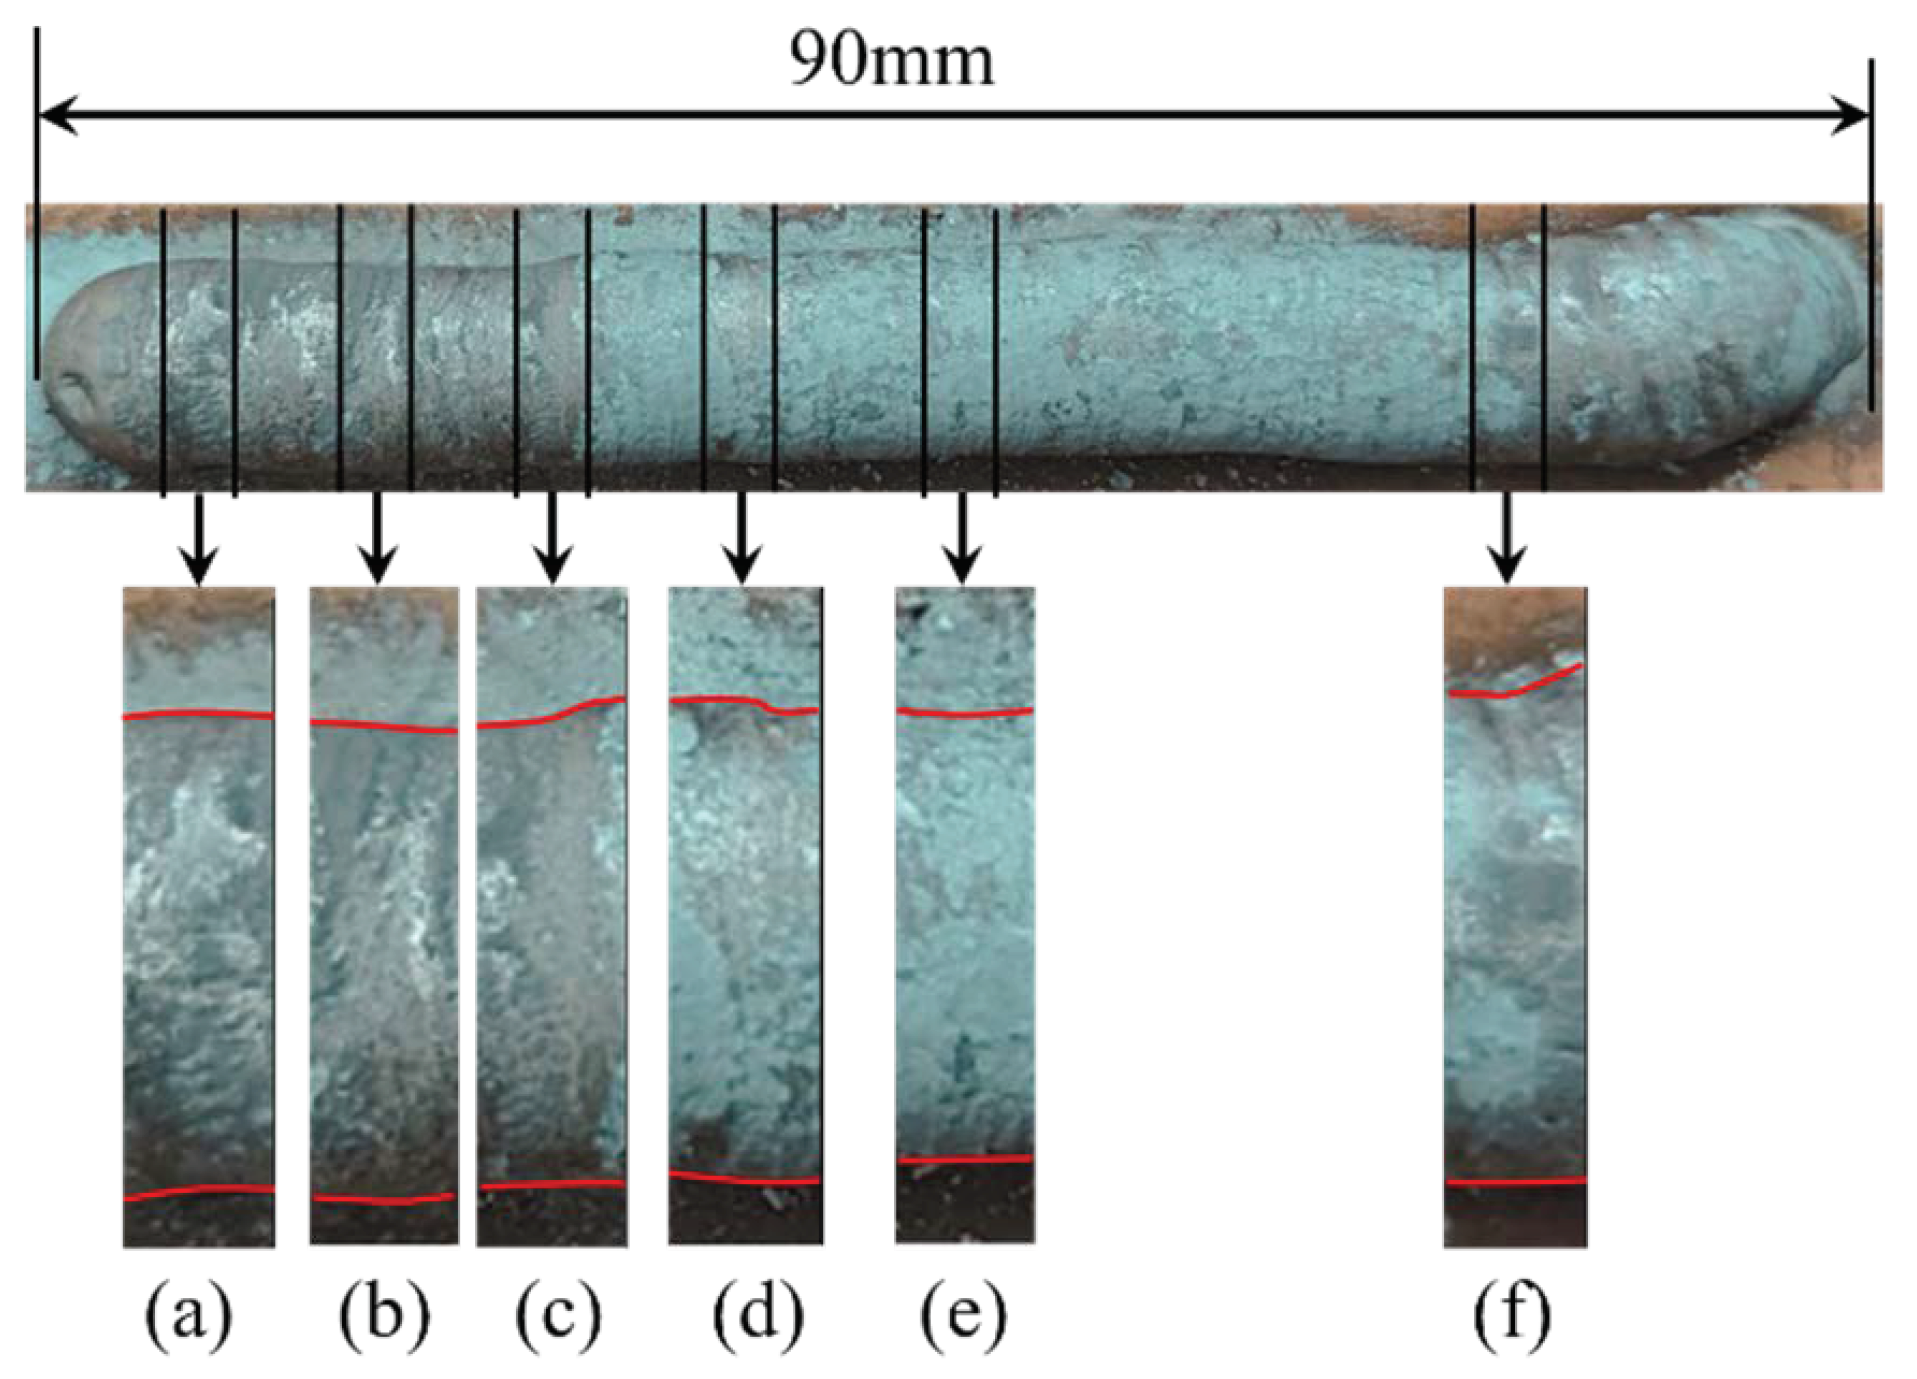
3.4. Experiments on the Relationship between the Uniformity of Droplet Transitions and the Uniformity of Weld Width
4. Conclusions
- A real-time monitoring method for droplet transfer frequency using arc sensing is proposed. In this method, the original signal acquired by a hall sensor is filtered by the wavelet transform method; the feature signal of the droplet transition is extracted by the arc signal segmentation method based on OTSU, and the feature extraction method for droplet transition based on DBSCAN is proposed. The real-time monitoring method we propose satisfies the demand for the real-time monitoring of droplet transfer frequency since the running time of the four main algorithms is 27.86 ms in total.
- We propose a concept of droplet transition uniformity. The experiments prove that weld width uniformity and droplet transition uniformity are positively correlated under conditions of uniform wire feeding and welding speeds. This principle can be used to monitor the weld bead width uniformity.
- The results of the experiments with typical parameters show that the maximal monitoring error is 0.05 Hz. This method holds promise for widespread use in monitoring and providing feedback control for droplet transfer in surface repairing and WAAM based on GTAW.
Author Contributions
Funding
Institutional Review Board Statement
Informed Consent Statement
Data Availability Statement
Conflicts of Interest
References
- Jiang, H.; Qin, G.; Feng, C.; Meng, X. High-Speed Tandem Pulsed GTAW of Thin Stainless Steel Plate. Weld. J. 2019, 98, 215S–226S. [Google Scholar]
- Zhang, Y.; Yang, Y.; Zhang, W.; Suck-Joo, N. Advanced Welding Manufacturing: A Brief Analysis and Review of Challenges and Solutions. J. Manuf. Sci. Eng. 2020, 142, 110816. [Google Scholar] [CrossRef]
- Wang, Z.; Jiang, D.; Wu, J.; Xu, M. A review on high-frequency pulsed arc welding. J. Manuf. Processes 2020, 60, 503–519. [Google Scholar] [CrossRef]
- Xiong, J.; Yu, Y.; Zheng, S.; Zhang, G. Arc voltage measurements for height control in pulsed arc additive manufacturing. Measurement 2022, 191, 110867. [Google Scholar] [CrossRef]
- Guilherme, A.M.; Queiroz, B.A.; José, S.C.; Natália, D.F.D. Effect of electromagnetic arc constriction applied in GTAW-based wire arc additive manufacturing on walls’ geometry and microstructure. J. Manuf. Processes 2021, 71, 156–167. [Google Scholar]
- Chen, S.; Zhang, S.; Huang, N.; Zhang, P.; Han, J. Droplet transfer in arcing-wire GTAW. J. Manuf. Processes 2016, 23, 5419–5429. [Google Scholar] [CrossRef]
- Yang, J.; Xu, S.; Jia, C.; Han, Y.; Maksymov, S.; Wu, C. A novel 3D numerical model coupling droplet transfer and arc behaviors for underwater FCAW. Int. J. Therm. Sci. 2023, 184, 107906. [Google Scholar] [CrossRef]
- Li, C.; Jiang, F.; Xu, B.; Zhang, G.; Chen, S.; Yan, Z.; Wang, B.; Lin, S.; Fan, C. In-situ measurement of the droplet temperature, velocity and mass under plasma arc. Measurement 2022, 202, 111905. [Google Scholar] [CrossRef]
- Ferreira, G.R.B.; Filho, R.M.M.; Scotti, A.; Lagares, M.L. Exploring a locus of maximum metal transfer stability of the short-circuiting GMAW process based on the reignition voltage peaks. J. Braz. Soc. Mech. Sci. Eng. 2021, 43, 503. [Google Scholar] [CrossRef]
- Liu, S.; Siewert, T.A. Metal transfer in gas metal arc welding Droplet rate. Weld. J. 1989, 68, 52s–58s. [Google Scholar]
- Anzehaee, M.M.; Haeri, M. Estimation and control of droplet size and frequency in projected spray mode of a gas metal arc welding (GMAW) process. ISA Trans. 2011, 50, 409–418. [Google Scholar] [CrossRef] [PubMed]
- Norrish, J. Recent gas metal arc welding (GMAW) process developments: The implications related to international fabrication standards. Weld. World 2017, 61, 755–767. [Google Scholar] [CrossRef]
- Lemes, J.V.; Matos, S.F.; Pablo, R.R.; Américo, S. Wire feed pulsation as a means of inducing surface tension metal transfer in Gas Metal Arc Welding. J. Manuf. Processes 2021, 62, 655–669. [Google Scholar]
- Tipi, D.; Reza, A.; Sani, H.; Kamal, S.; Pariz, N. Frequency control of the drop detachment in the automatic GMAW process. J. Mater. Process. Technol. 2015, 216, 248–259. [Google Scholar] [CrossRef]
- Luo, Y.; Li, J.; Xu, J.; Zhu, L.; Han, J.; Zhang, C. Influence of pulsed arc on the metal droplet deposited by projected transfer mode in wire-arc additive manufacturing. J. Mater. Process. Technol. 2018, 259, 353–360. [Google Scholar] [CrossRef]
- Zheng, H.; Qi, B.; Yang, M. Dynamic analysis of the ultrasonic-frequency pulsed GMAW metal transfer process. J. Manuf. Processes 2021, 62, 283–290. [Google Scholar] [CrossRef]
- Wu, K.; Zhan, J.; Cao, X.; Zeng, M.; Ding, N. Metal transfer of aluminum alloy double-wire pulsed GMAW with a median waveform. J. Mater. Process. Technol. 2020, 286, 116761. [Google Scholar] [CrossRef]
- Jorge, V.L.; Scotti, F.M.; Reis, R.R.P.; Scotti, A. The effect of pulsed cold-wire feeding on the performance of spray GMAW. Int. J. Adv. Manuf. Technol. 2020, 107, 3485–3498. [Google Scholar] [CrossRef]
- Chang, S.; Zhang, H.; Xu, H.; Sang, X.; Wang, L.; Du, D.; Chang, B. Closed-Loop Control of Droplet Transfer in Electron-Beam Freeform Fabrication. Sensors 2020, 20, 923. [Google Scholar] [CrossRef]
- Solano, J.L.O.; Mauricio Moreno-Uribe, A.; Jaimes, B.R.A.; Okuyama, M.P.; Arias, A.R.; Silva, R.H.G. Detection and characterization of metal transfer in GMAW using computational vision algorithms. Int. J. Adv. Manuf. Technol. 2023, 128, 3415–3425. [Google Scholar] [CrossRef]
- Wang, Z. A laser back-lighting based metal transfer monitoring system for robotic gas metal arc welding. Robot. Comput.-Integr. Manuf. 2016, 38, 52–66. [Google Scholar] [CrossRef]
- Pérez, I.G.; Meruane, V.; Mendez, P.F. Deep-learning based analysis of metal-transfer images in GMAW process. J. Manuf. Processes 2023, 85, 9–20. [Google Scholar] [CrossRef]
- Chaurasia, P.; Goecke, S.; De, A. Real-time monitoring of temperature field, metal transfer and cooling rate during gas metal arc-directed energy deposition. Sci. Technol. Weld. Join. 2022, 27, 512–521. [Google Scholar] [CrossRef]
- Teixeira, G.S.; Mazzaferro, J.A.E. GMA welding metal transfer mode study by high-speed imaging and electrical signal acquisition. J. Braz. Soc. Mech. Sci. Eng. 2019, 41, 315. [Google Scholar] [CrossRef]
- Jiao, Z.; Qin, H.; Gao, X.; Feng, Z.; Xu, Y.; Chen, S.; Shi, N.; Liu, W. Image Processing and Feature Extraction for Hull Structure GMAW Based on Weld Pool Visual Sensing. J. Sens. 2023, 2023, 6317992. [Google Scholar] [CrossRef]
- Lin, J.; Jia, A.; Huang, W.; Wen, Z.; Hong, B.; Hong, Y. Weld seam tracking method of root pass welding with variable gap based on magnetically controlled arc sensor. Int. J. Adv. Manuf. Technol. 2023, 126, 5227–5243. [Google Scholar] [CrossRef]
- Liu, H.; Xue, R.; Zhou, J.; Bao, Y.; Liu, X. Implementation of a two-stage algorithm for NG-GMAW seam tracking and oscillation width adaptation in pipeline welding. Sci. Technol. Weld. Join. 2023, 28, 992–1002. [Google Scholar] [CrossRef]
- Wang, H.; Lei, T.; Rong, Y.; Shao, W.; Huang, Y. Arc length stable method of GTAW based on adaptive Kalman filter. J. Manuf. Processes 2021, 63, 130–138. [Google Scholar] [CrossRef]
- Wang, Q.L.; Li, P.J.; Naka, M. Arc Light Sensing of Droplet Transfer and Its Analysis in Pulsed GMAW Process. Q. J. Jpn. Weld. Soc. 1997, 15, 415–424. [Google Scholar] [CrossRef]
- Le, J.; Liu, Y.; He, Y.; Zhang, H.; Chen, X. Detection of wire feeding speed and its influence on rotating arc welding quality. Int. J. Adv. Manuf. Technol. 2023, 125, 5419–5429. [Google Scholar] [CrossRef]
- Le, J.; Zhang, H.; Le, M.; Hu, L. Research on identification of the corner point of 90° weld based on multi-sensor signal fusion technology. Int. J. Adv. Manuf. Technol. 2020, 107, 2277–2290. [Google Scholar] [CrossRef]
- Jang, J.; Lee, J.; Lee, J.; Park, S.R.; Kim, J.; Kim, Y.B.; Lee, S.H. Monitoring of root gap change based on electrical signals of flux-cored arc welding using random convolution kernel transform. Sci. Technol. Weld. Join. 2023, 28, 738–746. [Google Scholar] [CrossRef]
- Ríos, S.; Colegrove, P.A.; Williams, S.W. Metal transfer modes in plasma Wire + Arc additive manufacture. J. Mater. Process. Technol. 2019, 264, 45–54. [Google Scholar] [CrossRef]
- Taguchi, H.; Haneda, M.; Imanaga, S.; Sejima, I. Characteristics of Plasma Arc Welding with Arc Wire Addition. Trans. Jpn. Weld. Soc. 1978, 9, 35–40. [Google Scholar]
- Qin, J.; Wang, Y.; Ding, J.; Williams, S. Optimal droplet transfer mode maintenance for wire arc additive manufacturing (WAAM) based on deep learning. J. Intell. Manuf. 2022, 33, 2179–2191. [Google Scholar] [CrossRef]
- Otsu, N. A Threshold Selection Method from Gray-Level Histograms. IEEE Trans. Syst. Man Cybern. 1979, 9, 62–66. [Google Scholar] [CrossRef]
- Ester, M.; Kriegel, H.P.; Sander, J.; Xu, X. A Density-Based Algorithm for Discovering Clusters in Large Spatial Databases with Noise. In Proceedings of the 2nd International Conference on Knowledge Discovery and Data Mining, Portland, OR, USA, 2–4 August 1996; Volume 96, pp. 226–231. [Google Scholar]


| Algorithm | Running Time/ms |
|---|---|
| A filtering method based on wavelet transform | 3.12 |
| An arc signal segmentation method based on OTSU | 6.80 |
| A feature extraction method for droplet transition based on DBSCAN | 16.50 |
| Calculating for droplet transfer frequency and the uniformity of transition | 1.44 |
| Total | 27.86 |
| Number | Welding Speed (mm/min) | Wire Feeding Speed (mm/min) | Welding Current (A) |
|---|---|---|---|
| 50 | 1200 | 80 | |
| 60 | 1500 | 100 | |
| 70 | 1800 | 120 | |
| 90 | 2400 | 140 | |
| 110 | 2700 | 160 |
| Number | Droplet Transfer Frequency (f/Hz) | The Uniformity of Droplet Transitions () |
|---|---|---|
| 1.50 | 0.0153 | |
| 1.50 | 0.0098 | |
| 2.00 | 0.1080 | |
| 2.50 | 0.3879 | |
| 4.50 | 0.1788 |
| Number | |||||
|---|---|---|---|---|---|
| E (Hz) | 0.02 | 0.01 | 0.01 | 0.05 | 0.05 |
| Welding Speed (mm/min) | Wire Feeding Speed (mm/min) | Welding Current (A) |
|---|---|---|
| 60 | 1500 | 100 |
| Number | Droplet Transfer Frequency f (Hz) | The Uniformity of Droplet Transitions |
|---|---|---|
| 4.0 | 0.0715 | |
| 4.0 | 0.2670 | |
| 3.0 | 0.5031 | |
| 5.5 | 0.5391 | |
| 3.5 | 0.2467 | |
| 11.0 | 0.7894 |
Disclaimer/Publisher’s Note: The statements, opinions and data contained in all publications are solely those of the individual author(s) and contributor(s) and not of MDPI and/or the editor(s). MDPI and/or the editor(s) disclaim responsibility for any injury to people or property resulting from any ideas, methods, instructions or products referred to in the content. |
© 2024 by the authors. Licensee MDPI, Basel, Switzerland. This article is an open access article distributed under the terms and conditions of the Creative Commons Attribution (CC BY) license (https://creativecommons.org/licenses/by/4.0/).
Share and Cite
Jia, A.; Luo, Y.; Hong, B.; Li, X.; Yin, L.; Luo, M. A Real-Time Monitoring Method for Droplet Transfer Frequency in Wire-Filled GTAW Based on Arc Sensing. Sensors 2024, 24, 1924. https://doi.org/10.3390/s24061924
Jia A, Luo Y, Hong B, Li X, Yin L, Luo M. A Real-Time Monitoring Method for Droplet Transfer Frequency in Wire-Filled GTAW Based on Arc Sensing. Sensors. 2024; 24(6):1924. https://doi.org/10.3390/s24061924
Chicago/Turabian StyleJia, Aiting, Yifang Luo, Bo Hong, Xiangwen Li, Li Yin, and Mina Luo. 2024. "A Real-Time Monitoring Method for Droplet Transfer Frequency in Wire-Filled GTAW Based on Arc Sensing" Sensors 24, no. 6: 1924. https://doi.org/10.3390/s24061924
APA StyleJia, A., Luo, Y., Hong, B., Li, X., Yin, L., & Luo, M. (2024). A Real-Time Monitoring Method for Droplet Transfer Frequency in Wire-Filled GTAW Based on Arc Sensing. Sensors, 24(6), 1924. https://doi.org/10.3390/s24061924