1. Introduction
The implementation of augmented reality technology in minimally invasive surgery (MIS) lies in the real-time acquisition and integration of internal cavity data by laparoscopy, feedback on its pose and depth information, and how to achieve cognitive display correlation between virtual information and real scenes, thereby reducing doctors’ workload, improving spatial awareness, and expanding vision [
1,
2]. In response to the observation limitations of laparoscopic fixed display devices, it is necessary to use advanced 3D reconstruction technology to achieve a real-time overlay of preoperative or intraoperative 3D virtual images on the basis of 2D imaging display.
The prerequisite for reconstruction technology is accurate feature tracking. However, for narrow, lack of features, specular reflections, and poor lighting conditions in intracavity environments, feature tracking remains highly challenging [
3]. Due to the fact that laparoscopy can only obtain two-dimensional information about the characteristics of the inner cavity, and cannot obtain its depth information through a single observation, when the feature is detected again during the movement of the laparoscope, the three-dimensional spatial information is calculated based on the principle of triangulation using the disparity angle of the laparoscope at different positions. Therefore, how to obtain internal cavity features and perform data matching is a great challenge for laparoscopic 3D reconstruction [
4].
Existing research indicates that there are issues in directly applying commonly used visual techniques to MIS due to the involvement of large-scale, free-form tissue deformation and constantly changing surgical scenes that are influenced by complex factors [
5]. In this case, the accuracy and efficiency of tracking largely depend on the detection of visual features, which need to exhibit high repeatability under image transformation and robustness under scene changes. The inner cavity environment is very complex, with uneven lighting, high specular reflection, soft tissue deformation in the inner cavity, and often without strong edge features, which pose higher requirements for the robustness of visual processing algorithms to improve the number, repeatability, and distribution of extracted feature points in the medical image processing field.
Vascular features are the most obvious features in the lumen environment, and effective vascular structure enhancement methods can provide useful structural information for later vascular feature extraction. Although the vascular structure is complex and detailed, it shares the common characteristics of a tubular-like structure. The ideal enhancement method should be able to achieve a high and uniform response to the following factors: variable vascular morphology; intensity nonuniformity caused by blood contrast or background; other unrelated structural tissues surrounding blood vessels leading to blurred boundaries; and a large amount of complex information such as background noise [
6].
Most of the curve structure enhancement methods are based on the classical Hessian matrix analysis of images, and the research of Frangi et al. has been widely recognized [
7]. The method proposed by Meijering et al. further developed the use of Hessian matrices [
8]. A Hessian matrix is based on second-order Gaussian derivatives and can be calculated at different scales to enhance features similar to curves, which helps distinguish specific shapes such as circular, tubular, and planar structures. In images, when dark curve structures appear relative to the background, chromaticity measurement is used to describe the image. However, the main drawback of the Hessian matrix is its sensitivity to noise [
9]. Due to the large eigenvalues, the curved feature response at the connections is very small, which results in poor performance in dealing with different curved branch structures. In the field of cardiovascular structure enhancement, Huang established an improved non-local Hessian-based weighted filter (NLHWF) to suppress nonvascular structures and noise around real vascular structures in contrast images [
10]. In the field of neural structure enhancement, the use of diffusion tensors has a more positive effect on vascular structure enhancement. Jerman et al. used spherical diffusion tensors to overcome the shortcomings of using Hessian matrices, but did not fully solve the problem of low intersection strength [
11]. The fractional anisotropic tensor (FAT) measures the variance of eigenvalues between different structures and can detect changes in vascular anisotropy [
12]. This feature enables FAT to more reliably enhance the vascular structure, ultimately resulting in a more uniform response. Alhasson proposed a new enhancement function based on FAT, which robustly maintains the relationship between isotropy and anisotropy by considering the degree of anisotropy of the target structure, in order to maintain low amplitude feature values, and successfully achieves high-quality curve structure enhancement for retinal images [
13]. Dash et al. proposed a fusion method to enhance the fusion of coarse and fine blood vessels, combined with the advantage of the Jerman filter’s effective response to blood vessel branches, using mean-C threshold segmentation to improve the performance of traditional curved transformation and improve the algorithm speed [
14]. The above vascular structure enhancement methods are mainly used for extracting neural structures, coronary angiography, or curve structures of retinal blood vessels, and have not yet been applied in the lumen environment.
Human luminal vascular feature extraction refers to the automatic or semi-automatic extraction of key points of blood vessels from medical images, such as bifurcation points, endpoints, and intersections. The lumen environment measured by laparoscopy is often unknown. Considering factors such as image quality, lighting conditions, background generated by image correction, uncertain environmental descriptions, and noise, robust features can provide effective and accurate two-dimensional information for three-dimensional reconstruction of the lumen environment. The traditional feature extraction methods started with Harris’s definition of corners [
15], and then classic methods such as the features from the accelerated segment test (FAST) [
16] and scale invariant feature transform (SIFT) [
17] were successively proposed. Improved algorithms for SIFT, such as the speed up robust features (SURF) algorithm [
18], have better computational speed but poor stability.
Although the oriented FAST and rotated BRIEF (ORB) algorithm [
19] solves the rotational invariance in binary robust independent elementary features (BRIEF), it is prone to errors caused by local homogenization of feature points and cumulative drift. Faced with the complex environment of minimally invasive surgery, traditional feature extraction methods applied in large-scale environments with sufficient light and strong edge features are no longer applicable. Therefore, Stamatia proposed an affine invariant anisotropic feature detector based on automatic feature detection (AFD), which only responds to features with low anisotropy, compensating for the shortcomings of LoG and DoG and effectively processing isotropic features [
20]. Lin proposed the vessel branching circle test (VBCT) based on Frangi and verified its robustness and saliency for MIS images through monotonic mapping [
21]. Subsequently, due to the presence of a certain pixel width in blood vessels, more than one branch point may be detected on a branch, leading to redundancy. Udayakumar put forward the ridgeness-based circle test (RBCT), which simplifies the structure of blood vessels into single pixels, making feature extraction of blood vessels more efficient [
22]. They used the patch search process of parallel tracking and mapping (PTAM) [
23] to perform feature matching by calculating the zero mean zero sum of squared differences (ZSSD). However, due to the large-scale nature of branch points, their positioning error is about 1.6 ± 0.7 pixels, and the large error introduces uncertainty to subsequent 3D reconstruction. Li et al. added a decision tree based on the C4.5 algorithm to the traditional FAST algorithm, making the feature extraction performance of MIS images more stable and feature point extraction more efficient [
24].
On the other hand, rough feature matching methods often have mismatches and the feature point matching methods based on certain structures are adopted according to different application scenarios. For example, matching based on lines and matching based on various stable geometric structures [
25]. Davison proposed an active matching method [
26], while random sample consensus (RANSAC) and its improved algorithm eliminated the occurrence of mismatches in active matching [
27]. Wu propose a feature point mismatch removal method that combines optical flow, descriptor, and RANSAC, to eliminate incorrect feature point matches layer by layer through these constraints and exhibits robustness and accuracy under various interferences such as lighting changes, image blurring, and unclear textures [
28]. Liu et al. proposed an improved ORB feature matching algorithm that utilizes non-maximum suppression (NMS) and retinal sampling models to solve mismatch problems in complex environments [
29].
In addition to the direct impact of the accuracy of intracavity feature matching on the localization estimation of laparoscopy, the computational complexity of intracavity feature matching is also an important factor affecting the real-time performance of the entire algorithm. Puerto Souza proposed new hierarchical multiaffine (HMA) and adaptive multiaffine (AMA) algorithms to improve the feature matching performance of endoscopic images [
30,
31]. Zhu proposed a feature matching method for endoscopic images based on motion consensus. A spatial motion field was constructed based on candidate feature matching, and the true match was identified by checking the difference between feature motion and the estimated field, achieving a 3.7 pixel average reprojection error [
32]. Li designed a global and local point-by-point matching algorithm based on feature fusion for extracting contour features from gastrointestinal endoscopic images, which used fast Fourier transform (FFT) to reduce the dimensionality of dense feature descriptors and achieve robust and accurate contour feature extraction and matching [
33]. Currently, in the medical field, most visual-based 3D reconstruction methods still rely on matching features obtained by traditional methods; even by directly estimating and fusing keyframe depth maps [
34] or combining them with camera pose estimation [
35] to avoid the need for feature matching. Therefore, feature extraction and matching of the inner cavity environment remains a challenging task.
The main contributions of the proposed method are summarized as follows:
To solve the problems of noise and false detection caused by different inner cavity environment boundary areas and highlight areas, we analyze the characteristics of the inner cavity environment, design a targeted preprocessing framework, use a self-adaptive threshold to generate binary masks, introduce a local variance threshold to automatically detect highlight areas, and use the fast marching method (FMM) method for highlight repair.
In order to robustly extract effective structural information for vascular features, a Gaussian weighted fusion algorithm for single-pixel enhancement of the vascular structure using dual-branch Frangi measure and multiscale fractional anisotropic tensor (MFAT) is designed. The structural similarity (SSIM) index is introduced to achieve self-adaptive Gaussian weighted fusion, solving the problems of structural measurement differences and uneven response between venous vessels and microvessels, ensuring the continuity and integrity of the vascular structure.
To enhance adaptability to different scale vascular structures, a dual-circumference detection of vascular features is implemented. Redundancy is reduced by introducing NMS. Feature matching of neighboring blocks of the results before and after frames is achieved by calculating the zero sum of squared differences (ZSSD).
2. Methods
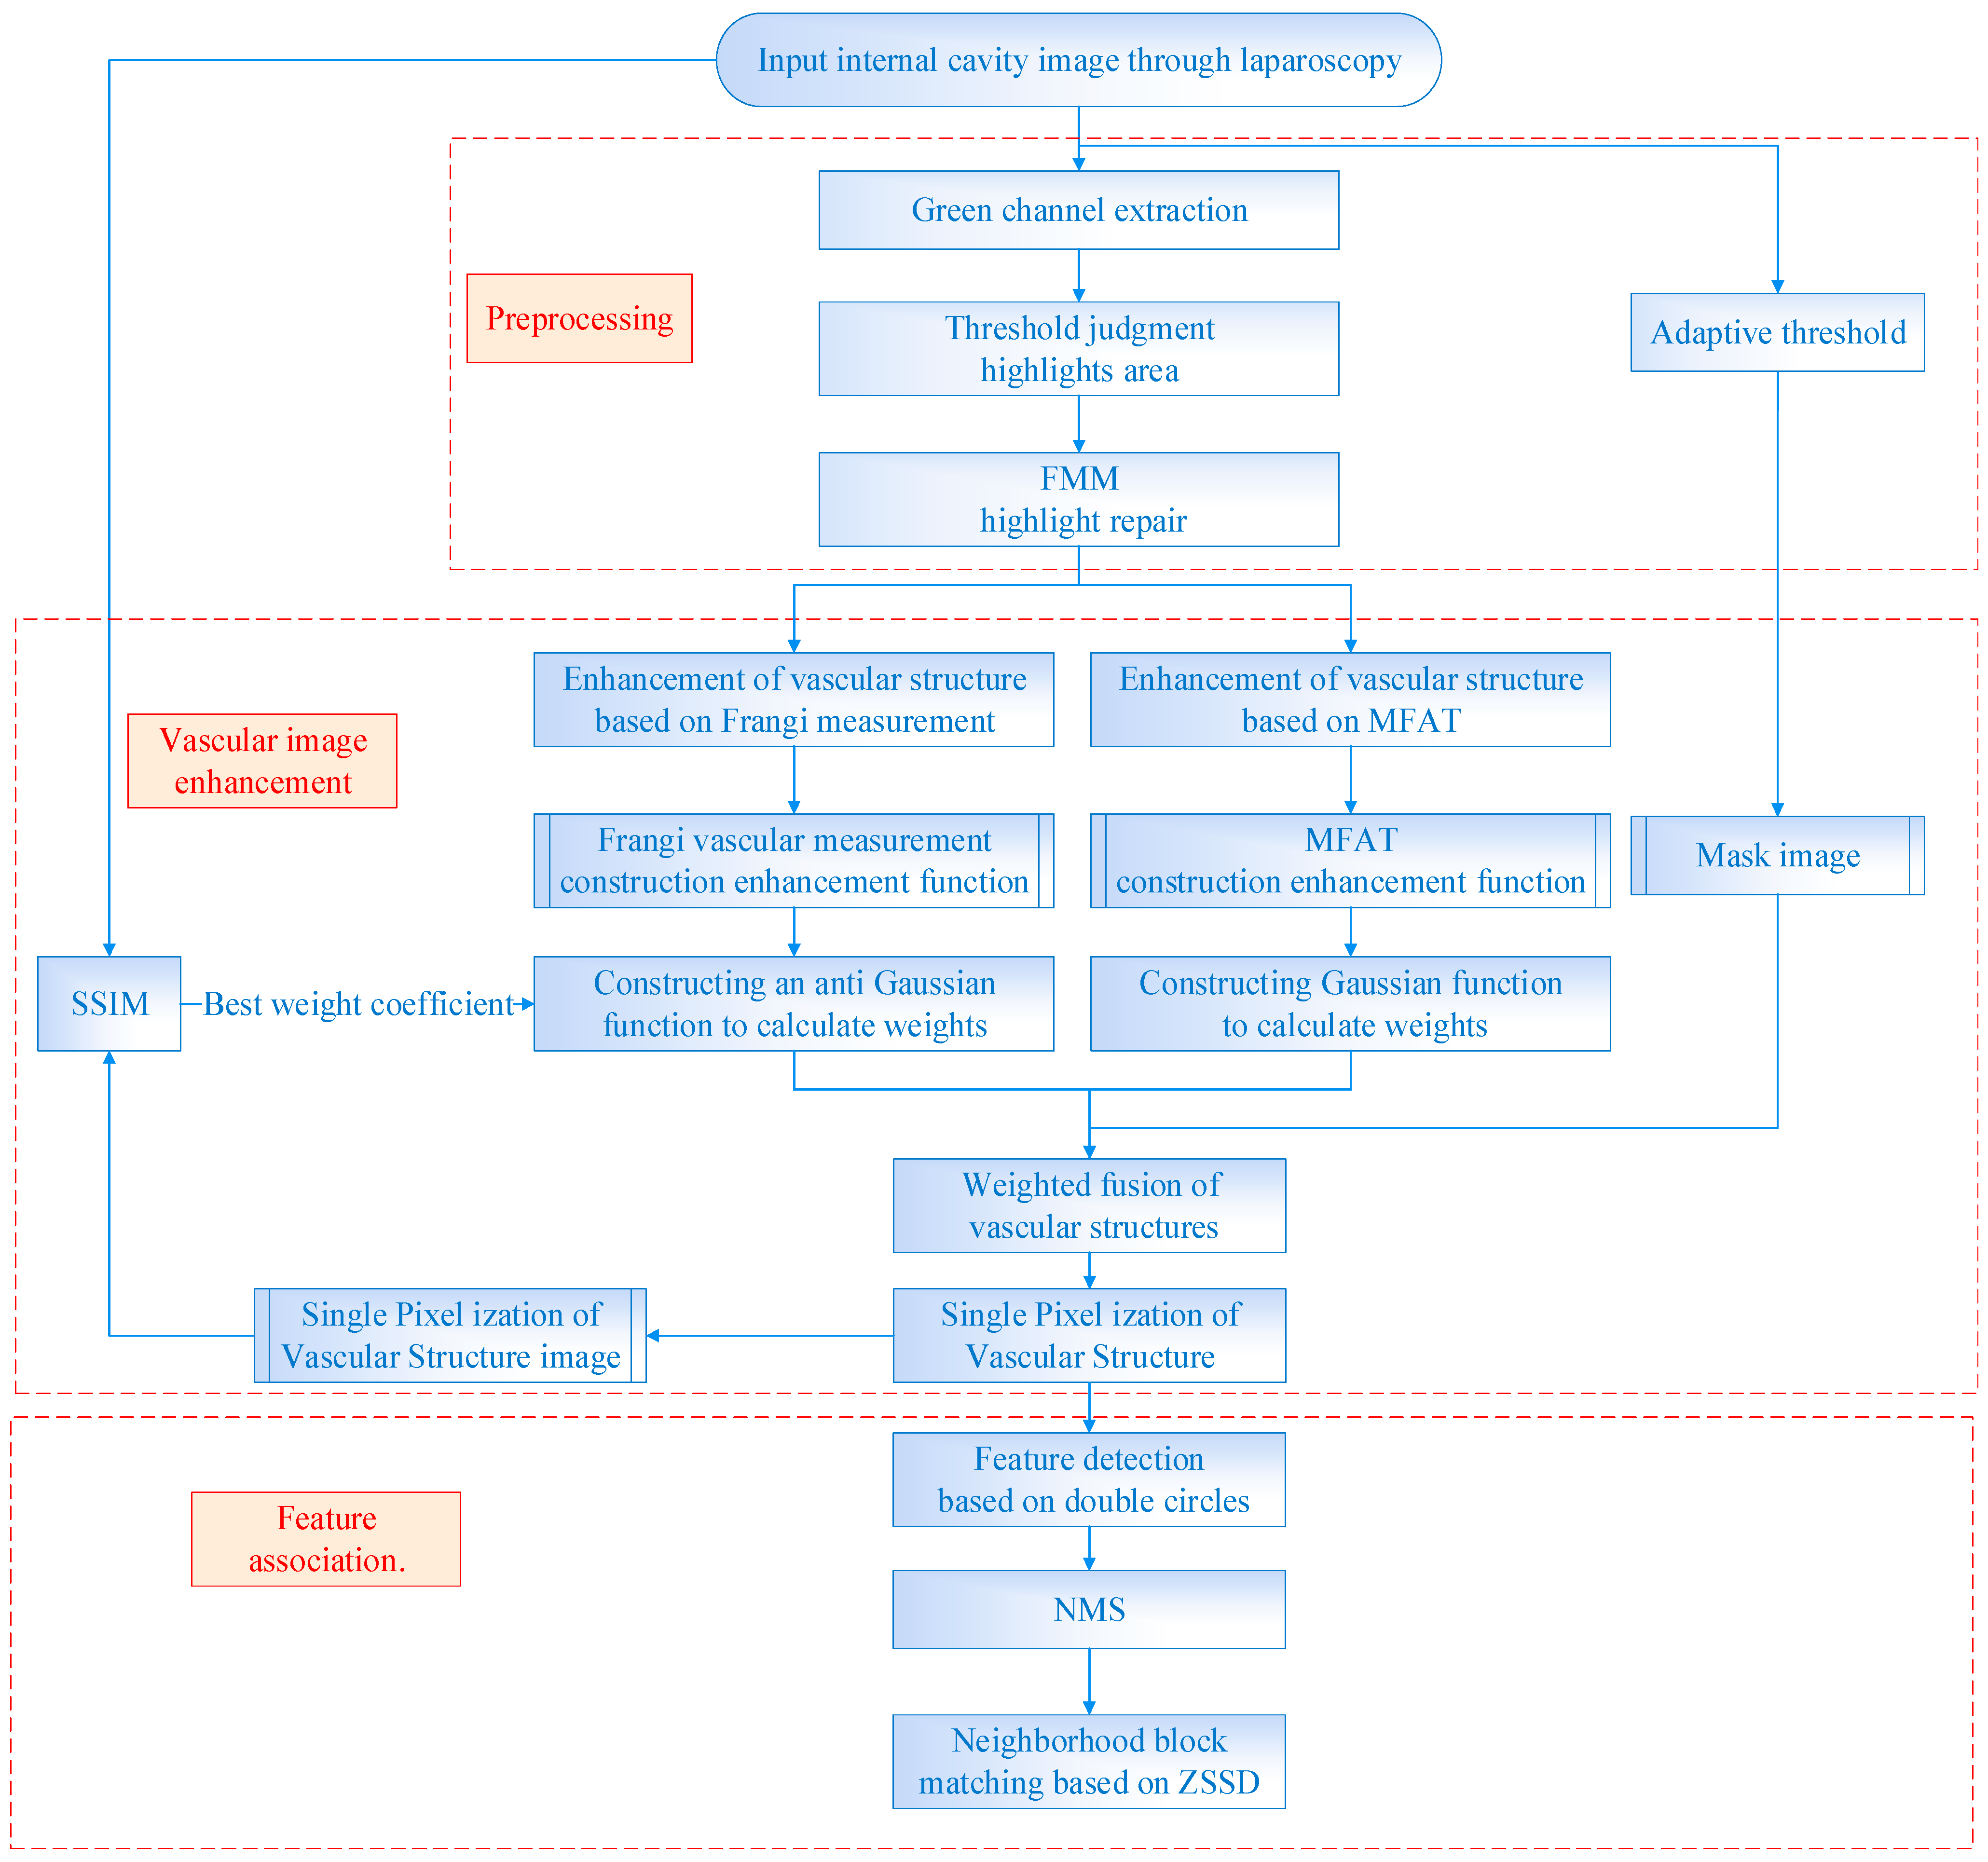
This paper proposes a method for detecting and matching vascular features based on dual-branch weighted fusion vascular structure enhancement, as shown in
Figure 1. An image preprocessing framework is designed based on the characteristics of the internal cavity environment to improve the method’s performance. Binary mask images of boundary regions are generated using a self-adaptive threshold to preserve pixels with valid information in the field of view. The green channel is selected with the highest contrast and the threshold judgment and FMM are used to repair the highlighted areas. Based on the characteristics of the vascular structure, a single-pixel, dual-branch weighted fusion vascular image enhancement algorithm is designed by combining the vascular structure enhancement function based on Frangi measurement and the vascular structure enhancement function based on MFAT. Finally, the double circles detection based on the characteristics of branch points is performed and NMS to extract feature points is introduced. Then, the ZSSD is calculated for the neighboring blocks of feature points extracted from the frames before and after, followed by feature point matching.
2.1. Preprocessing
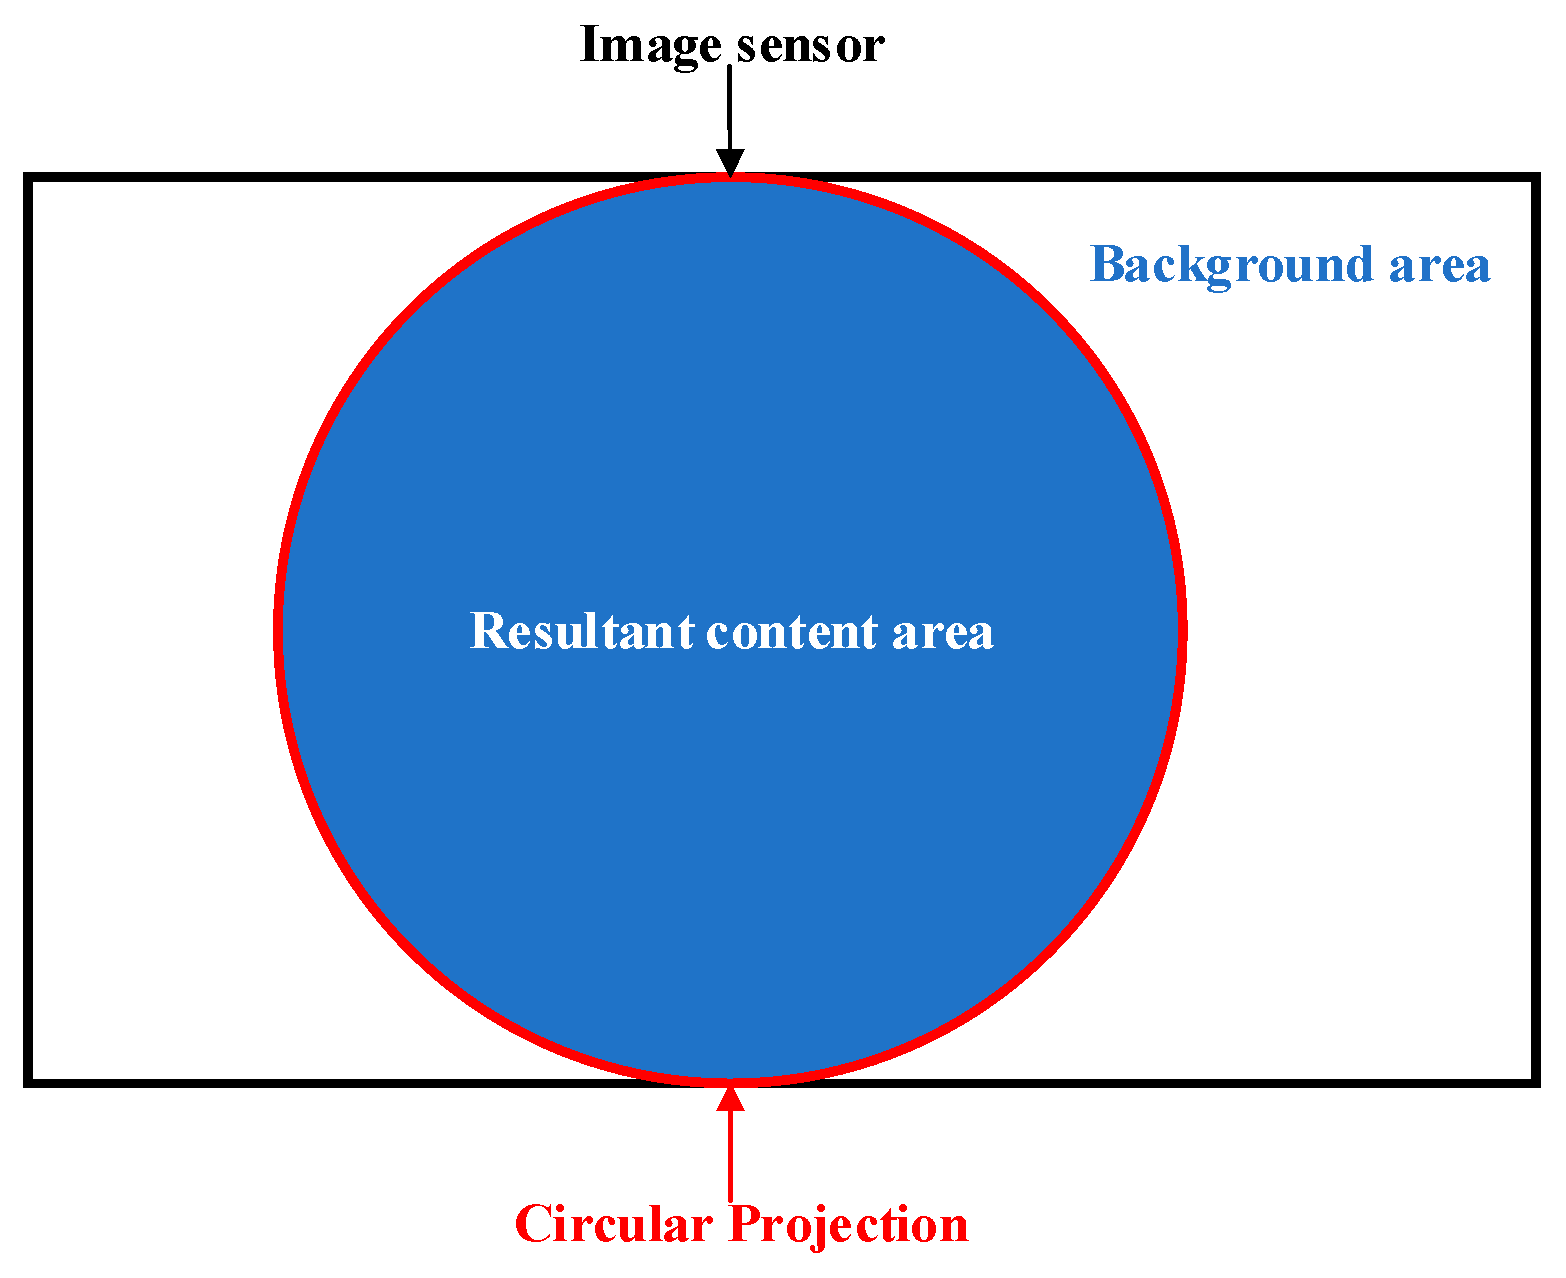
As medical optical equipment, endoscopes have a wide variety of types and are applied in different fields. The requirement for minimally invasive surgery limits the size of the optical field that doctors can see. Therefore, in order to maximize the doctor’s field of view, a circular projection created by some laparoscopic descending optical systems is placed inside the image sensor, as shown in
Figure 2. As a result, the obtained endoscopic images have noncontent areas, namely dark and uninformed boundary areas, with clear and sharp edges between them and the content areas [
36]. For binocular laparoscopy, parallax correction can also result in boundary areas containing noise in the corrected image. At the same time, the large area of bleeding also lacks vascular information, so this paper defines it as a boundary area. The boundary region will generate interference information during image enhancement, so self-adaptive threshold [
37] is used to generate effective mask images for different types of laparoscopic images, improving the generalization of the method.
For each pixel (
x,
y), the window size centered on it is (
w,
h), and the grayscale mean and median of all pixels in the window are calculated to obtain a binary threshold. As shown in Equation (1), pixels (
x,
y) that are greater than the threshold are assigned to the foreground or content area, otherwise they are the background or boundary area to obtain a masked image.
Among them,
Im(
x,
y) represents the binarization threshold of pixel points (
x,
y);
represents the average grayscale around a pixel (
x,
y); median(
x,
y) represents the median grayscale around a pixel (
x,
y); and
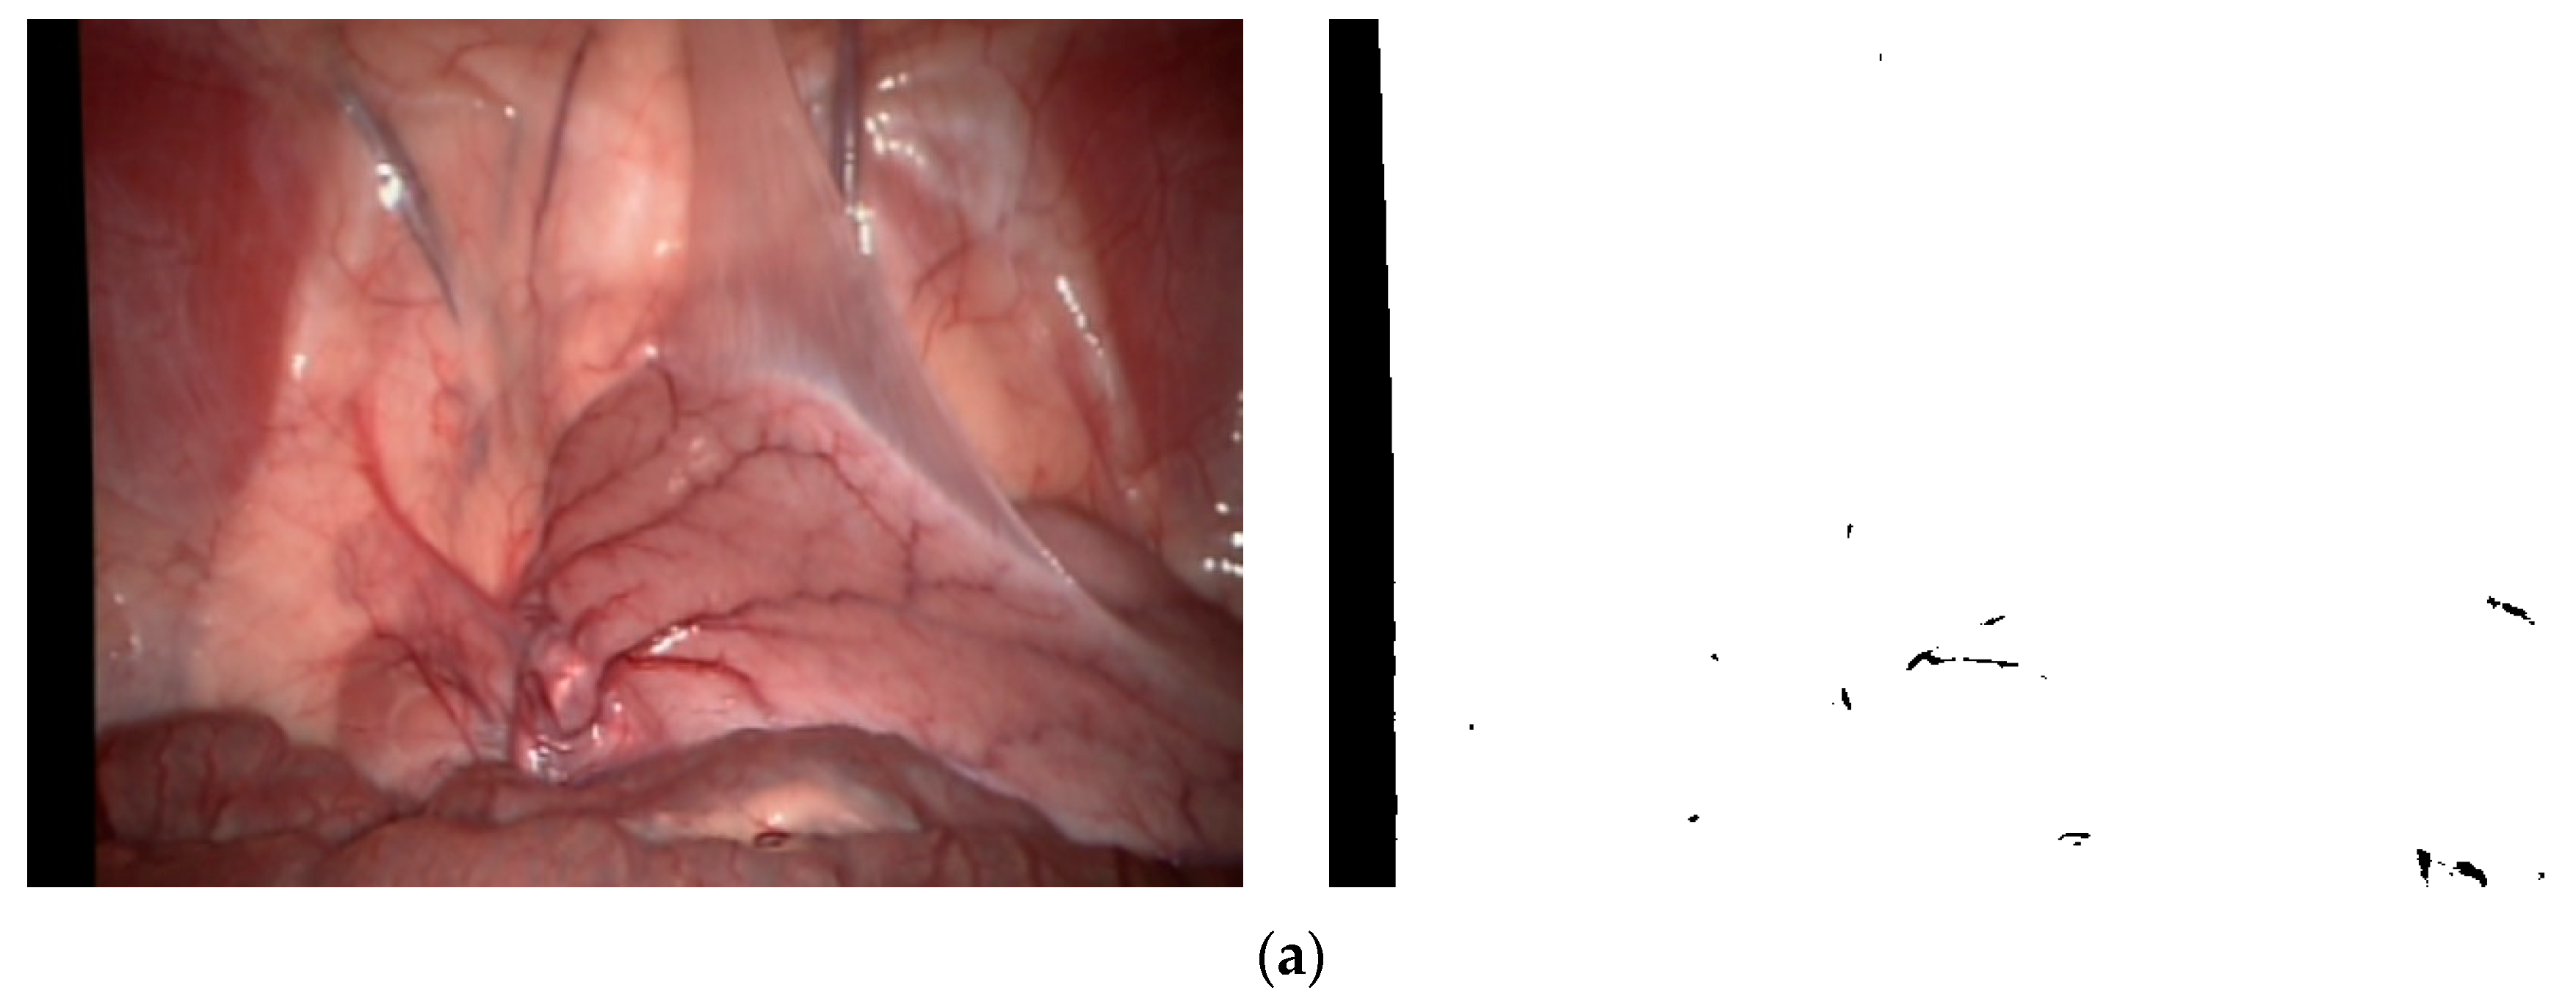
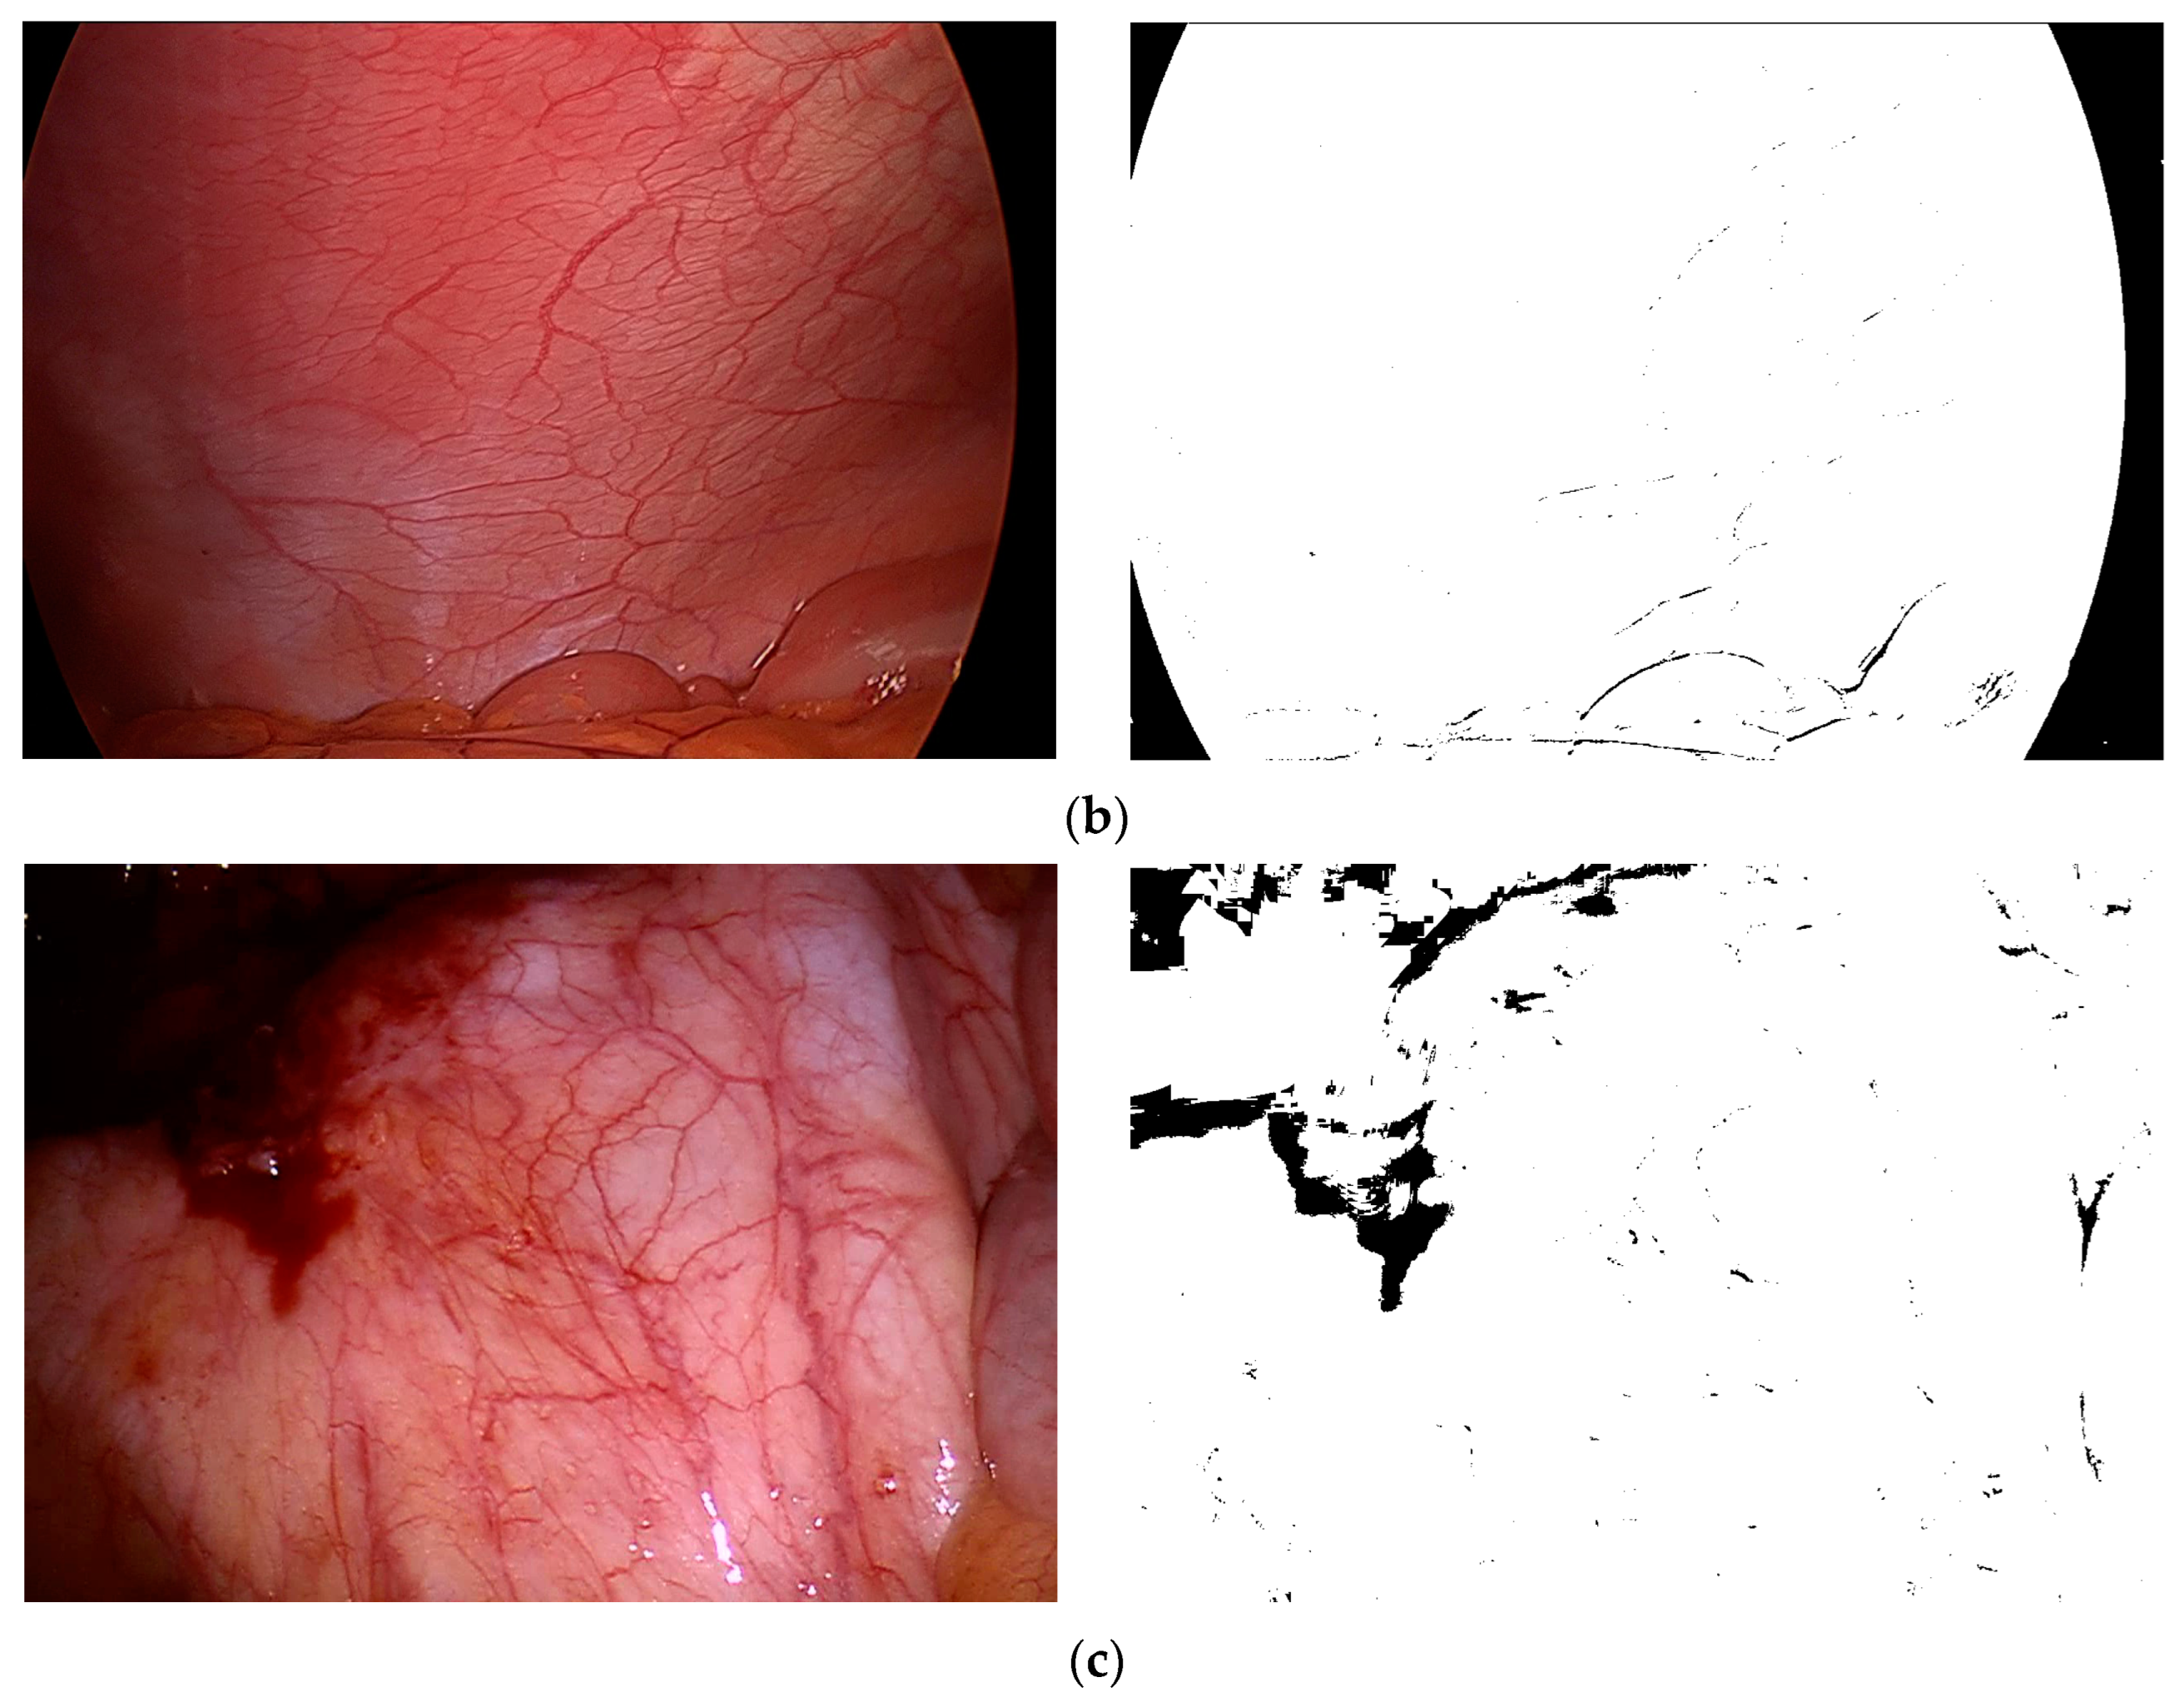
k is the sensitivity coefficient used to control the threshold size. This binary mask image is applicable to various types of MIS images. We selected three typical environments from the Hamlyn data set and Vivo data set, as shown in
Figure 3, where (a) represents the left image “0000000000” after inspection and correction in the Hamlyn data set Rectificed01 (binocular) and its corresponding binary mask images, (b) represents the image “base” in the Vivo data set clip2 and its corresponding binary mask images, and (c) represents the image “base” in the Vivo data set clip3 and its corresponding binary mask images.
Among the three RGB channels in MIS images, the most prominent colors for blood vessels are red and green, while the background color is closer to blue. The contrast between the red and blue channels is very poor and noisy, and the corresponding channel pixels do not provide much information about blood vessels [
38]. Therefore, the green channel provides the best contrast between blood vessels and the background, with blood vessels being the clearest.
Using the local variance threshold to automatically identify the highlight areas in the image, based on the special grayscale distribution and spatial distribution characteristics of the highlight areas, the threshold for each pixel point in the image is determined by calculating the variance of the surrounding pixels as follows:
where
T(
x,
y) represents the threshold of the local neighborhood centered on (
x,
y),
var(
R(
x, y)) represents the pixel value variance of the local neighborhood centered on (
x,
y), and
k and
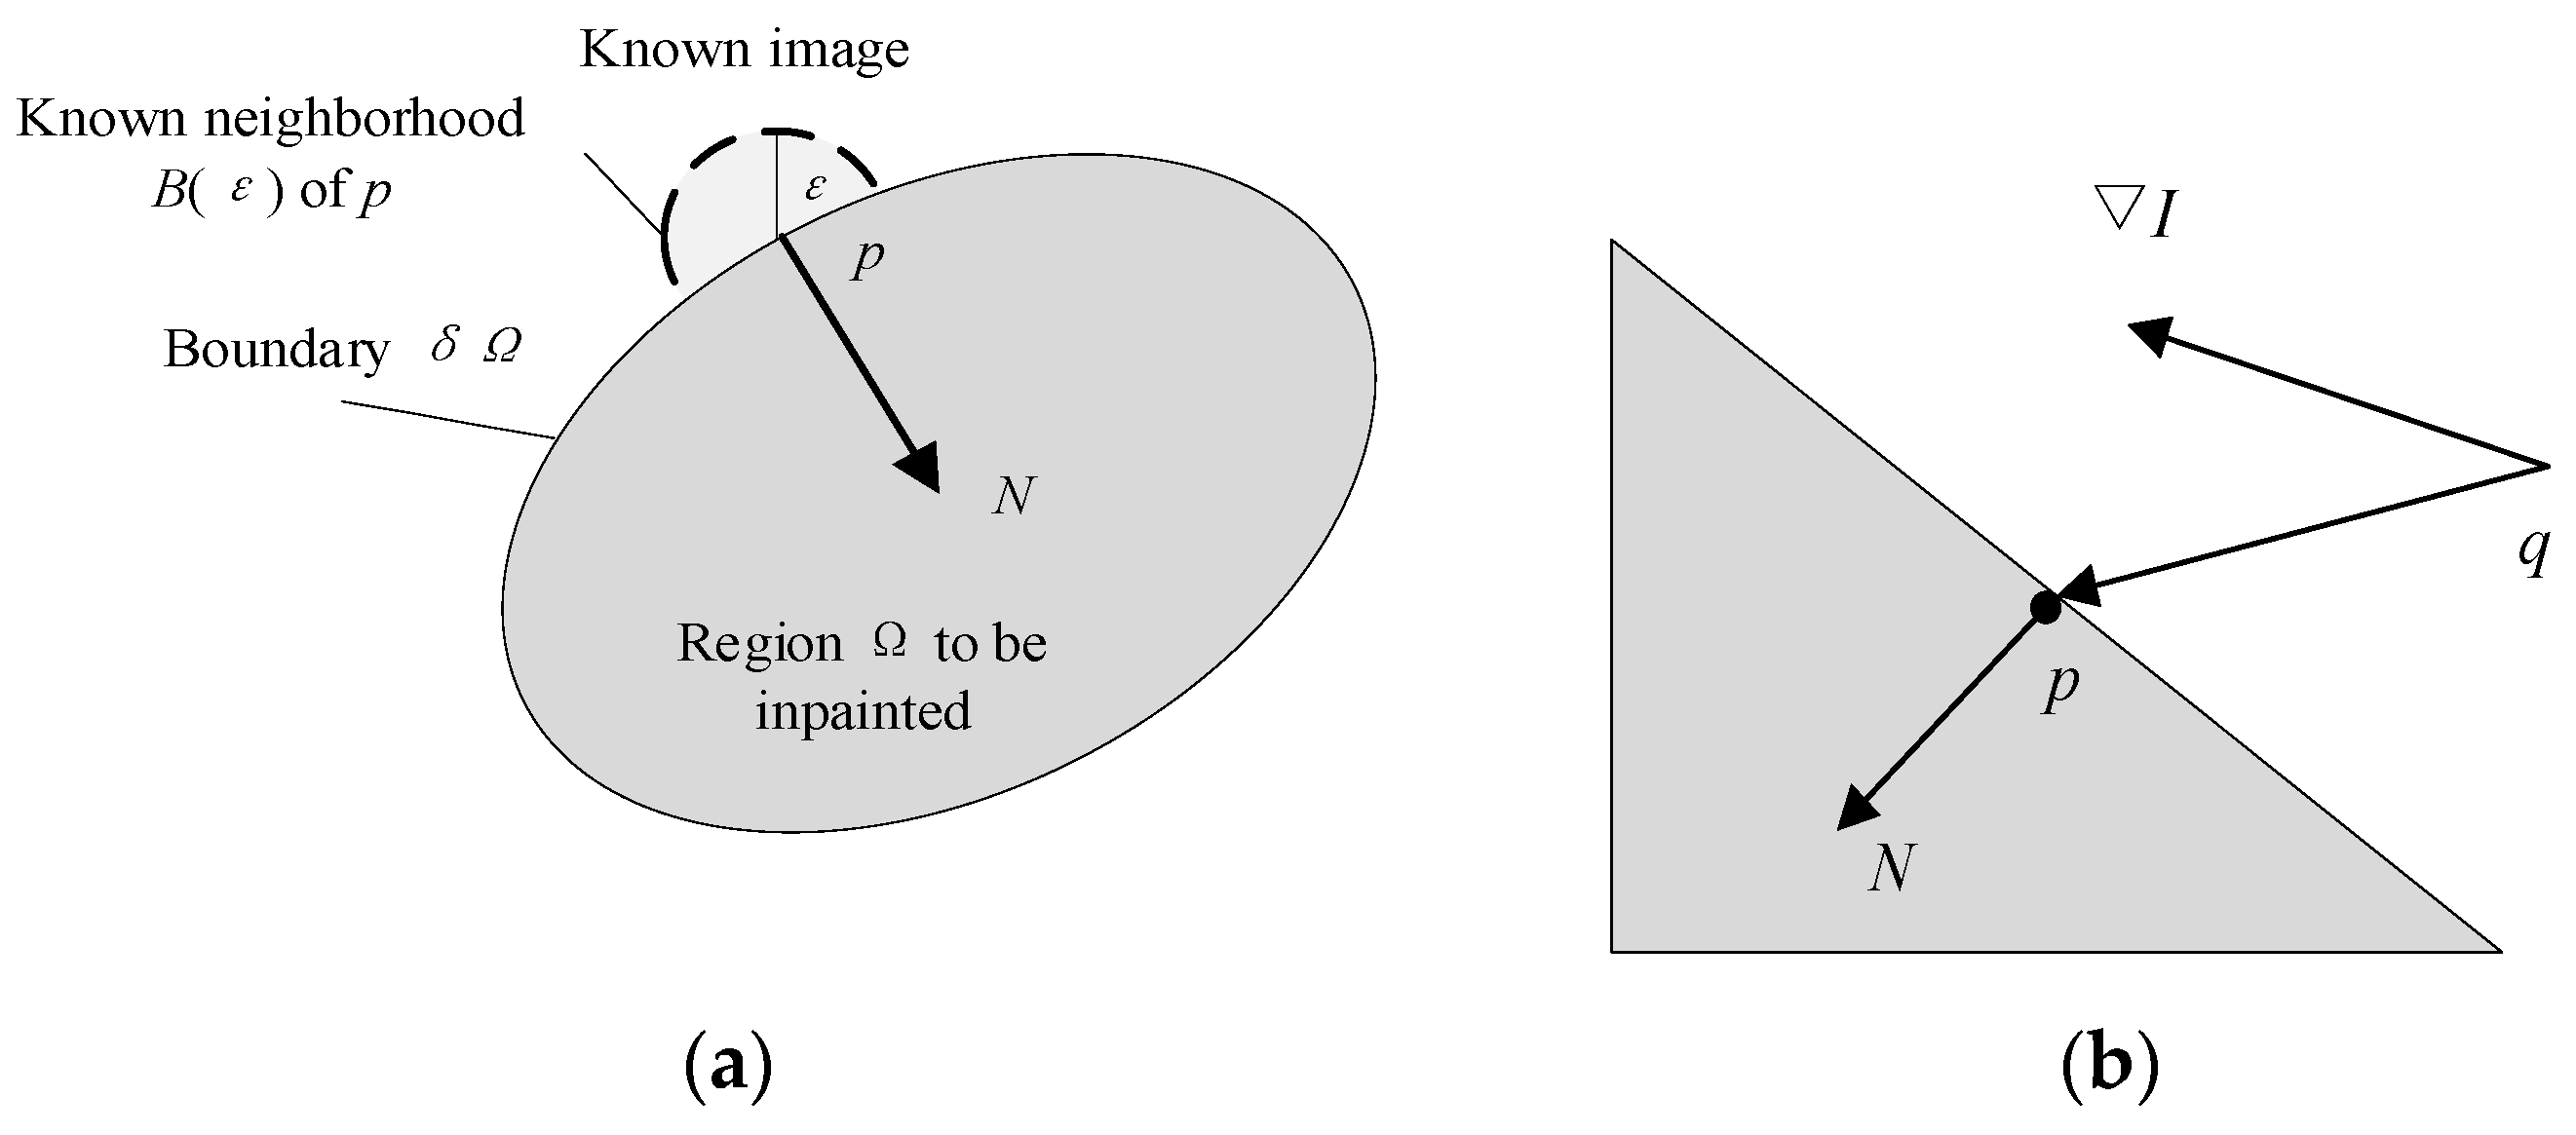
C are scaling factors and constants, respectively, used to adjust the size and position of the threshold. Then, FMM is used to achieve highlight restoration, as shown in
Figure 4.
The highlight area is used as the initial boundary condition, and new pixel values are calculated with neighboring points based on the weight of different distances to replace the values of adjacent point sets in the highlight area [
39] as follows:
Among them,
q is a point of
. Due to the different influence of pixels with different distances within the neighborhood on the new pixel values of point
p, it is necessary to set the respective weight for each pixel as follows:
where
w(
p,
q) is the weight function used to quantify the impact of each pixel in the neighborhood on new pixel values. The weight functions are shown in Equations (6)–(8)
Among them,
d0 and
T0 are distance parameters and horizontal parameters, usually taken as 1. dir(
p,
q) is the directional factor, dst(
p,
q) is the geometric distance factor, and lev(
p,
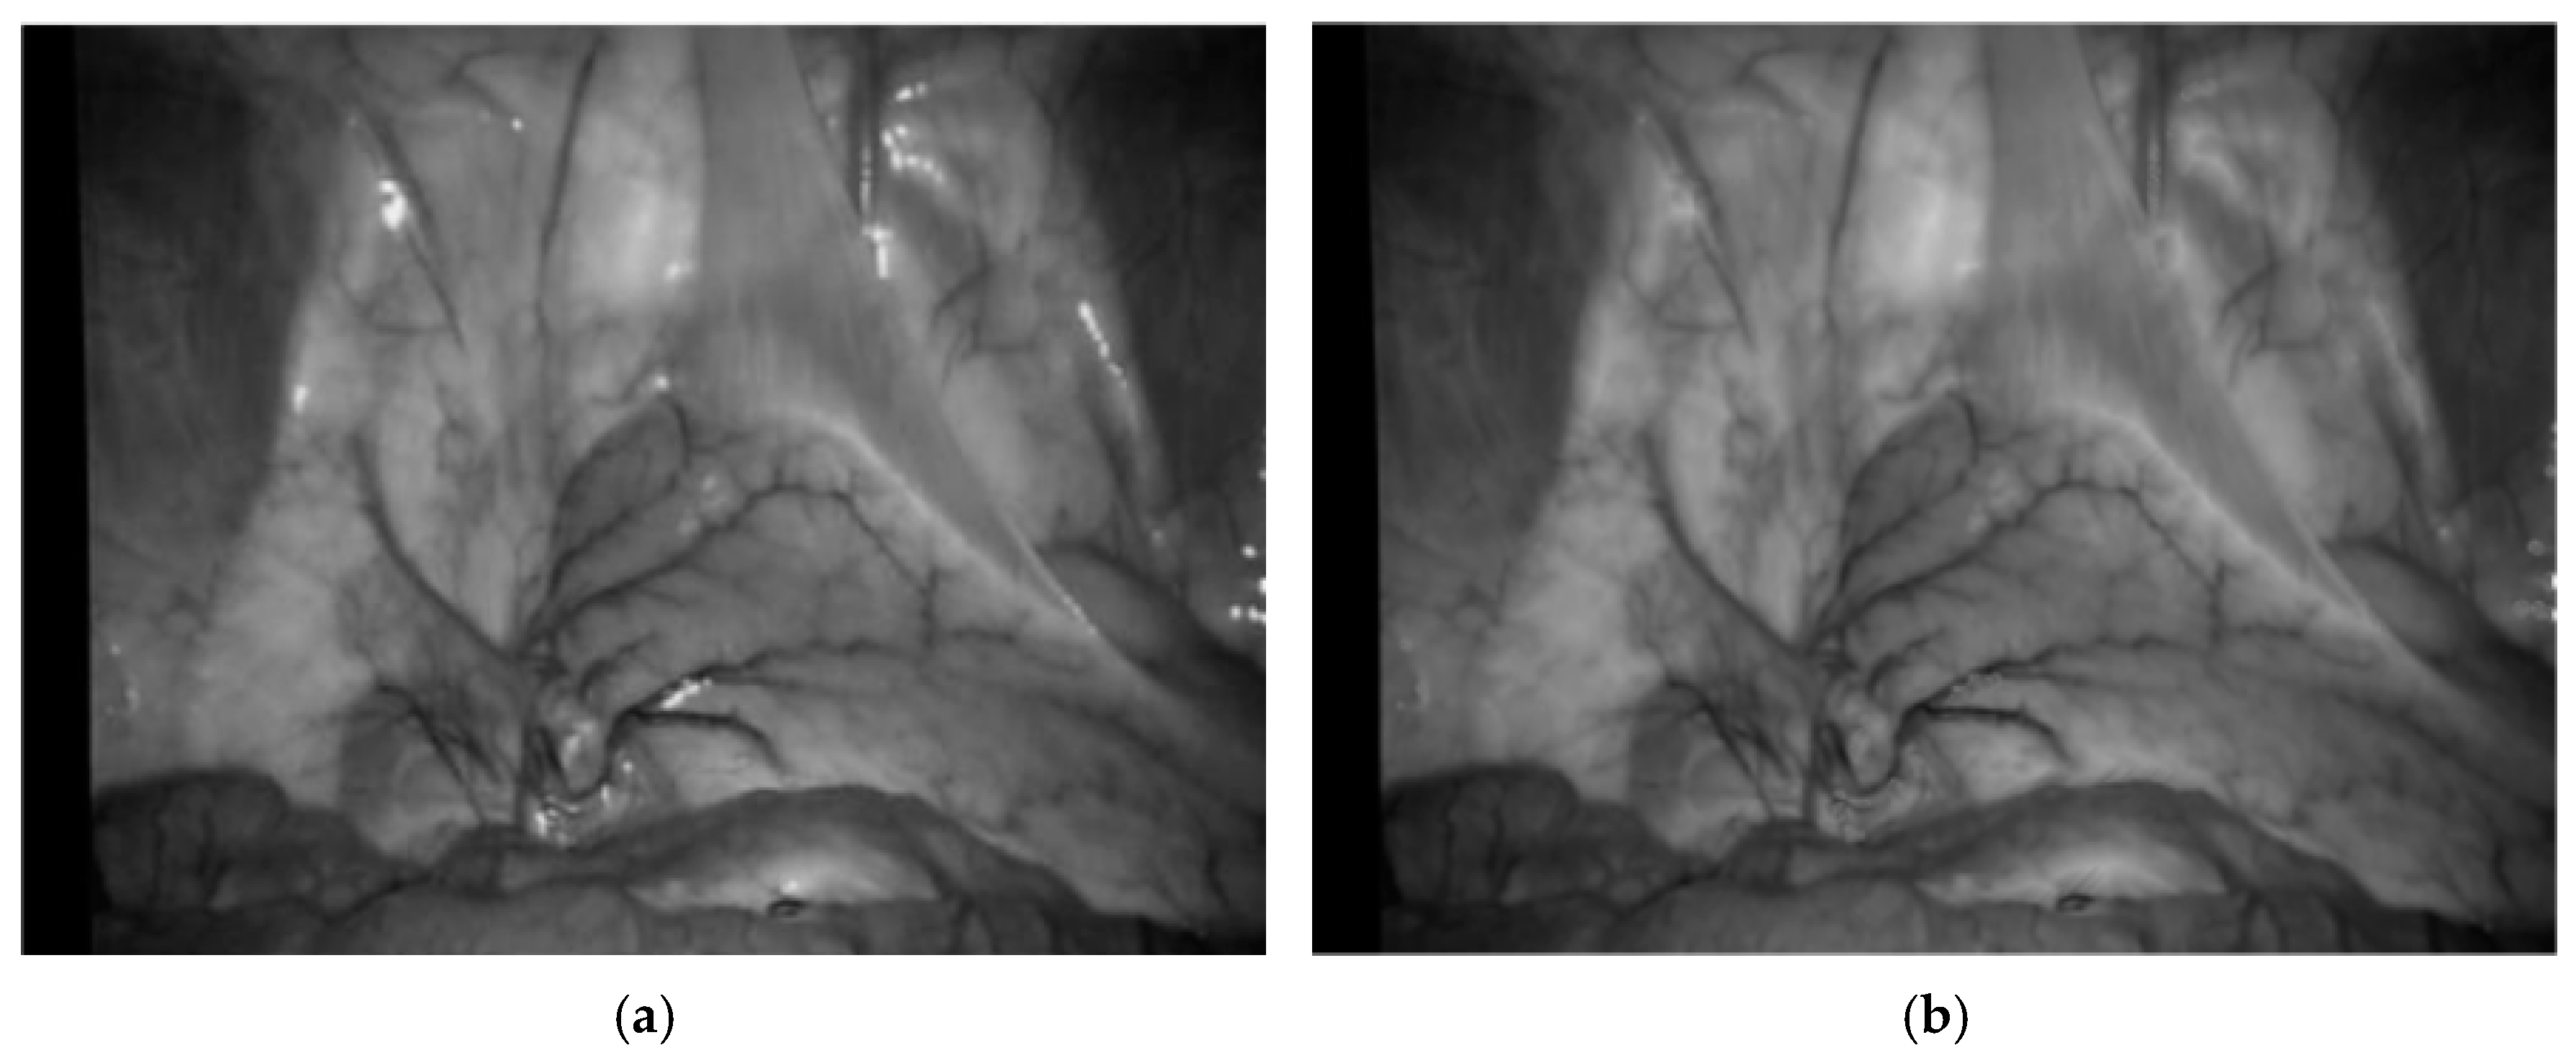
q) is the horizontal set distance factor. The preprocessing results are shown in
Figure 5.
2.2. Vascular Structure Enhancement
2.2.1. Analysis of Vascular Features Based on the Hessian Matrix
The Hessian matrix is based on second-order Gaussian derivatives, where the first derivative represents the grayscale gradient and the second derivative represents the rate of change of the grayscale gradient. It can be calculated at different scales to enhance features similar to curves, which helps to distinguish specific shapes, such as circular, tubular, and planar structures. In an image, the chromaticity measurement is used to describe the image when the dark curve structure appears relative to the background. The Hessian matrix
H is used to calculate the eigenvalues
and
pixel by pixel for
L, which represent the anisotropy of image changes in the two eigenvector directions. By analyzing the symbols and sizes of Hessian eigenvalues, as shown in
Table 1, the selective enhancement can be performed on local image structures independent of direction based on the shape of the structure and foreground and background brightness. The spotted structure tends to be isotropic, and the stronger the linearity, the more anisotropic the structure. This method can be used to distinguish the linear vascular structures in the inner cavity, as shown in Equation (9)
Ideally, in a two-dimensional image, it is assumed that |λ1| ≤ |λ2|, where H represents high eigenvalues, L represents low eigenvalues, N represents noise, +/− represents the sign of the eigenvalues, and λ2 represents a bright (dark) structure on a dark (bright) background. The tubular structure is a vascular target that enhances the human lumen.
2.2.2. Vascular Enhancement Based on the Frangi Measure Filtering
The classic Frangi filter is an enhanced filtering algorithm based on the Hessian matrix [
7], where the value
RB is approximately zero when the image structure is a tubular structure; that is, a blood vessel. The Frangi vascular enhancement function uses response
RB to distinguish between speckled and tubular structures, and measures
S to distinguish the background. The calculation is shown in Equations (10) and (11)
Then, construct an enhancement function based on
RB and
S as shown in Equation (12)
where
β is used to adjust the sensitivity of the distinguishing block and strip regions, and
c is used to adjust the overall smoothness of the filtered image.
2.2.3. Vascular Enhancement Based on MFAT
The Frangi vascular enhancement function aims to suppress the components of circular structures, but not all vascular structures elongate. In the process of exploring three-dimensional vascular structure enhancement, image analysis is usually closely related to the formation of neural processes and dihedral differentiation. Jerman et al. analyzed multiple vascular enhancement functions and summarized the advantages and disadvantages of solving vascular structure enhancement problems based on different functions [
11]. For two-dimensional images, the Frangi vascular enhancement function was simplified. Based on
, it was found that
Through analysis, it was found that the main reason for Frangi’s function design, which is proportional to the size of the feature values, is to suppress noise in low-intensity and uniform-intensity image regions, where all feature values have low and similar sizes. This method usually relies on the values of eigenvalues, which leads to several problems as follows: (1) in a slender or circular structure with uniform strength, the eigenvalues are uneven, (2) the feature values vary with the intensity of the image, and (3) enhancement is uneven at different scales. Therefore, redefining characteristic values, −λ is for bright structures on a dark background, and λ is for dark structures on a bright background.
According to Meijering et al. [
8], the Hessian matrix has been improved as shown in Equation (14)
Then, construct neuron measures as shown in Equations (15) and (16)
Among them,
λmax is the maximum eigenvalue and
λmin is the minimum eigenvalue, representing the normalized eigenvector and eigenvalues of
H′. The above neuron measures suppress background intensity discontinuity points and darker linear structures that are immune to first-order derivatives (
λmax (
x) ≥ 0). Meanwhile, the neuron measure is a scalable function that can be used as a scale parameter
σ Gaussian kernel and is used to suppress noise. Therefore, Alhasson et al. proposed an improved diffusion tensor measure FAT based on to enhance the vascular structure in three-dimensional images [
40]. We applied it to two-dimensional internal cavity images and introduced auxiliary techniques
λ3, which is defined as the three-dimensional shape of blood vessels in a two-dimensional image to obtain the regularized eigenvalues
λp and its cutoff threshold
τ. Construction
λp1,
λp2 through the upper limit cutoff threshold is passed
τ1 and lower cut-off threshold
τ2, respectively. And
λp1,
λp2 are used to adjust
λ3Correspondingly, to suppress background noise, construct a response
as shown in Equation (19)
According to the concept of amplitude regularization, construct a multiscale enhancement function
based on the maximum cumulative response through each scale
σ, as shown in Equations (20) and (21)
2.2.4. Gaussian Weighted Fusion and Single-Pixel Vascular Structure
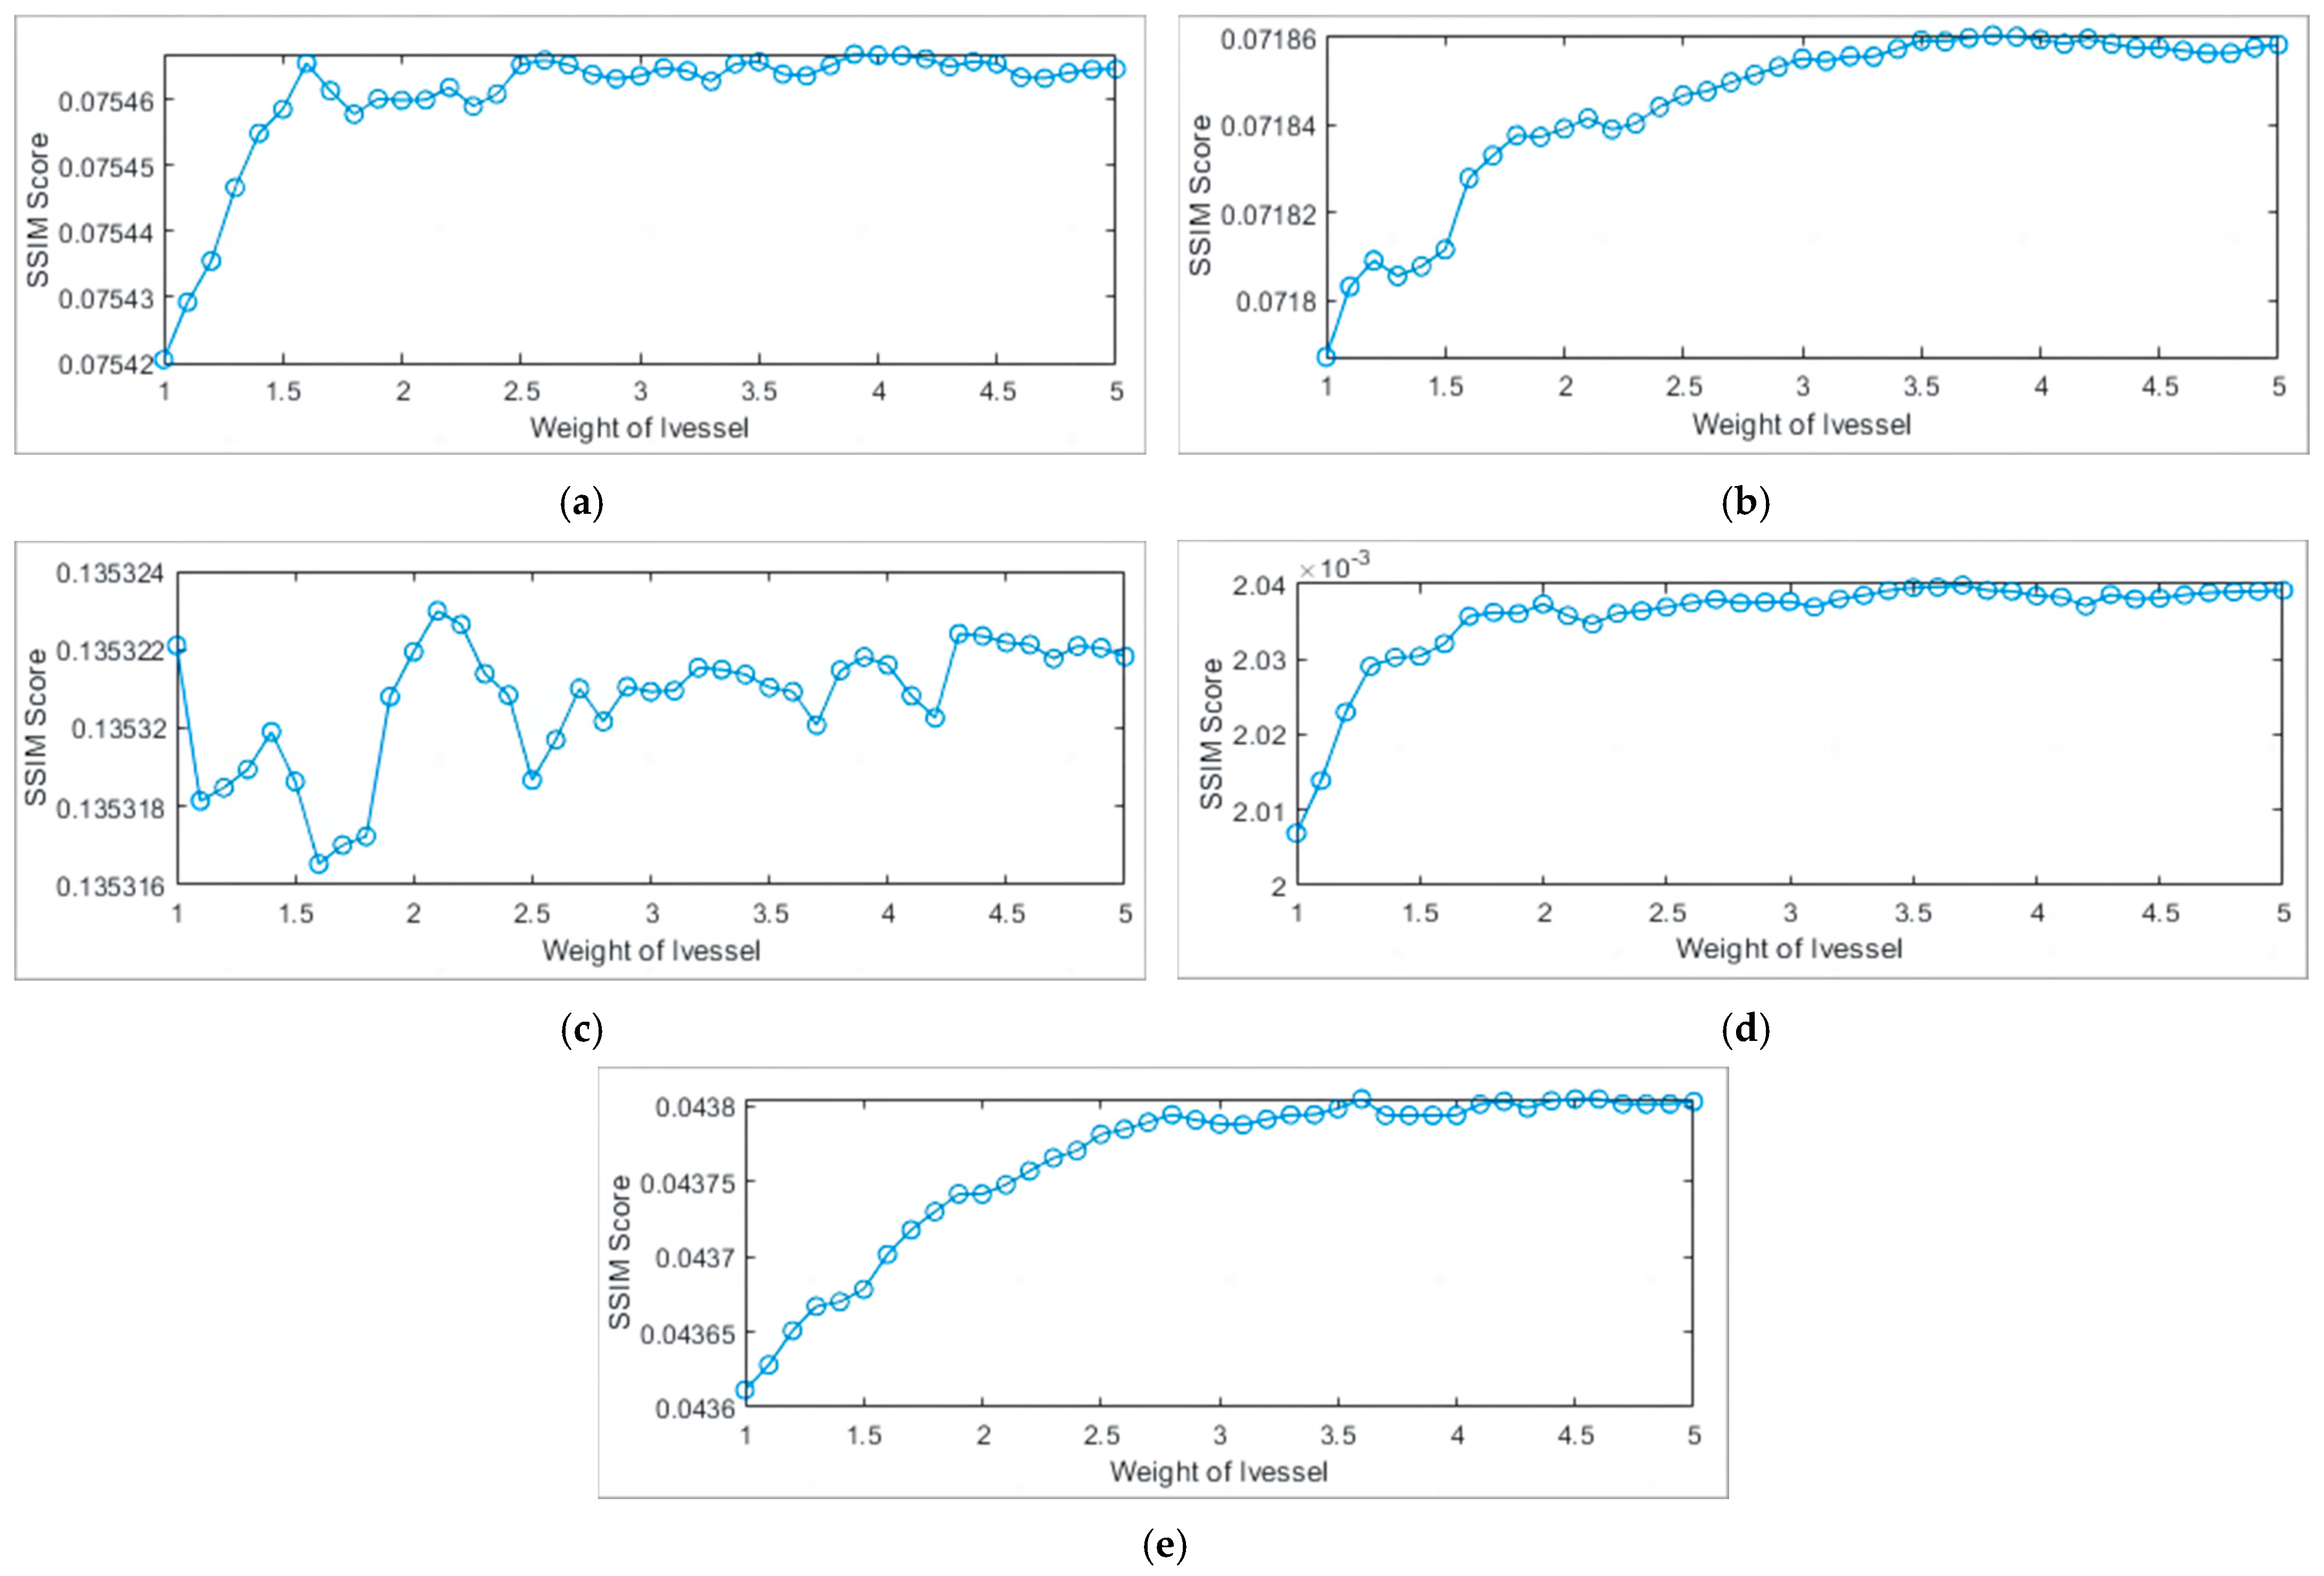
The Gaussian function has a higher weight near the center, and as the distance from the center increases, the weight gradually decreases. This paper combines two enhancement results by constructing a Gaussian weighting function to achieve compensation. The vascular enhancement result after Gaussian weighted fusion, denoted as
Ivessel, is shown in Equation (22)
Among them, w is the Gaussian weight; IFrangi and IMFAT are the Frangi enhancement results and MFAT enhancement results, respectively; and μ is the parameter that controls the shape of the Gaussian function. Considering that there is no gold standard for the structure of the lumen blood vessels, the optimal weights for different types of images are obtained based on SSIM, which refers to the parameter with the best score between the vascular structure and the lumen image, thereby improving the generalization of fused image applications.
Blood vessels have a certain width, and the multipixel vascular features used for the vascular structure cannot accurately locate branch points and segments. Therefore, single-pixel vascular centerlines can be used to replace the original vascular morphology. Analyze the grayscale gradient changes of all pixels in the width direction of blood vessels, and use weighted operations to calculate the
Iridge of the vessel centerline, as shown in Equation (25)
where ∇ is the gradient operator,
and
ε = 1.0 is the pixel width. However, most of the blood vessel width obtained are two pixels. In order to obtain a more accurate single-pixel width ridge, it is necessary to obtain the local maximum value of each centerline pixel in the direction of the feature vector
, as shown in Equation (26)
where
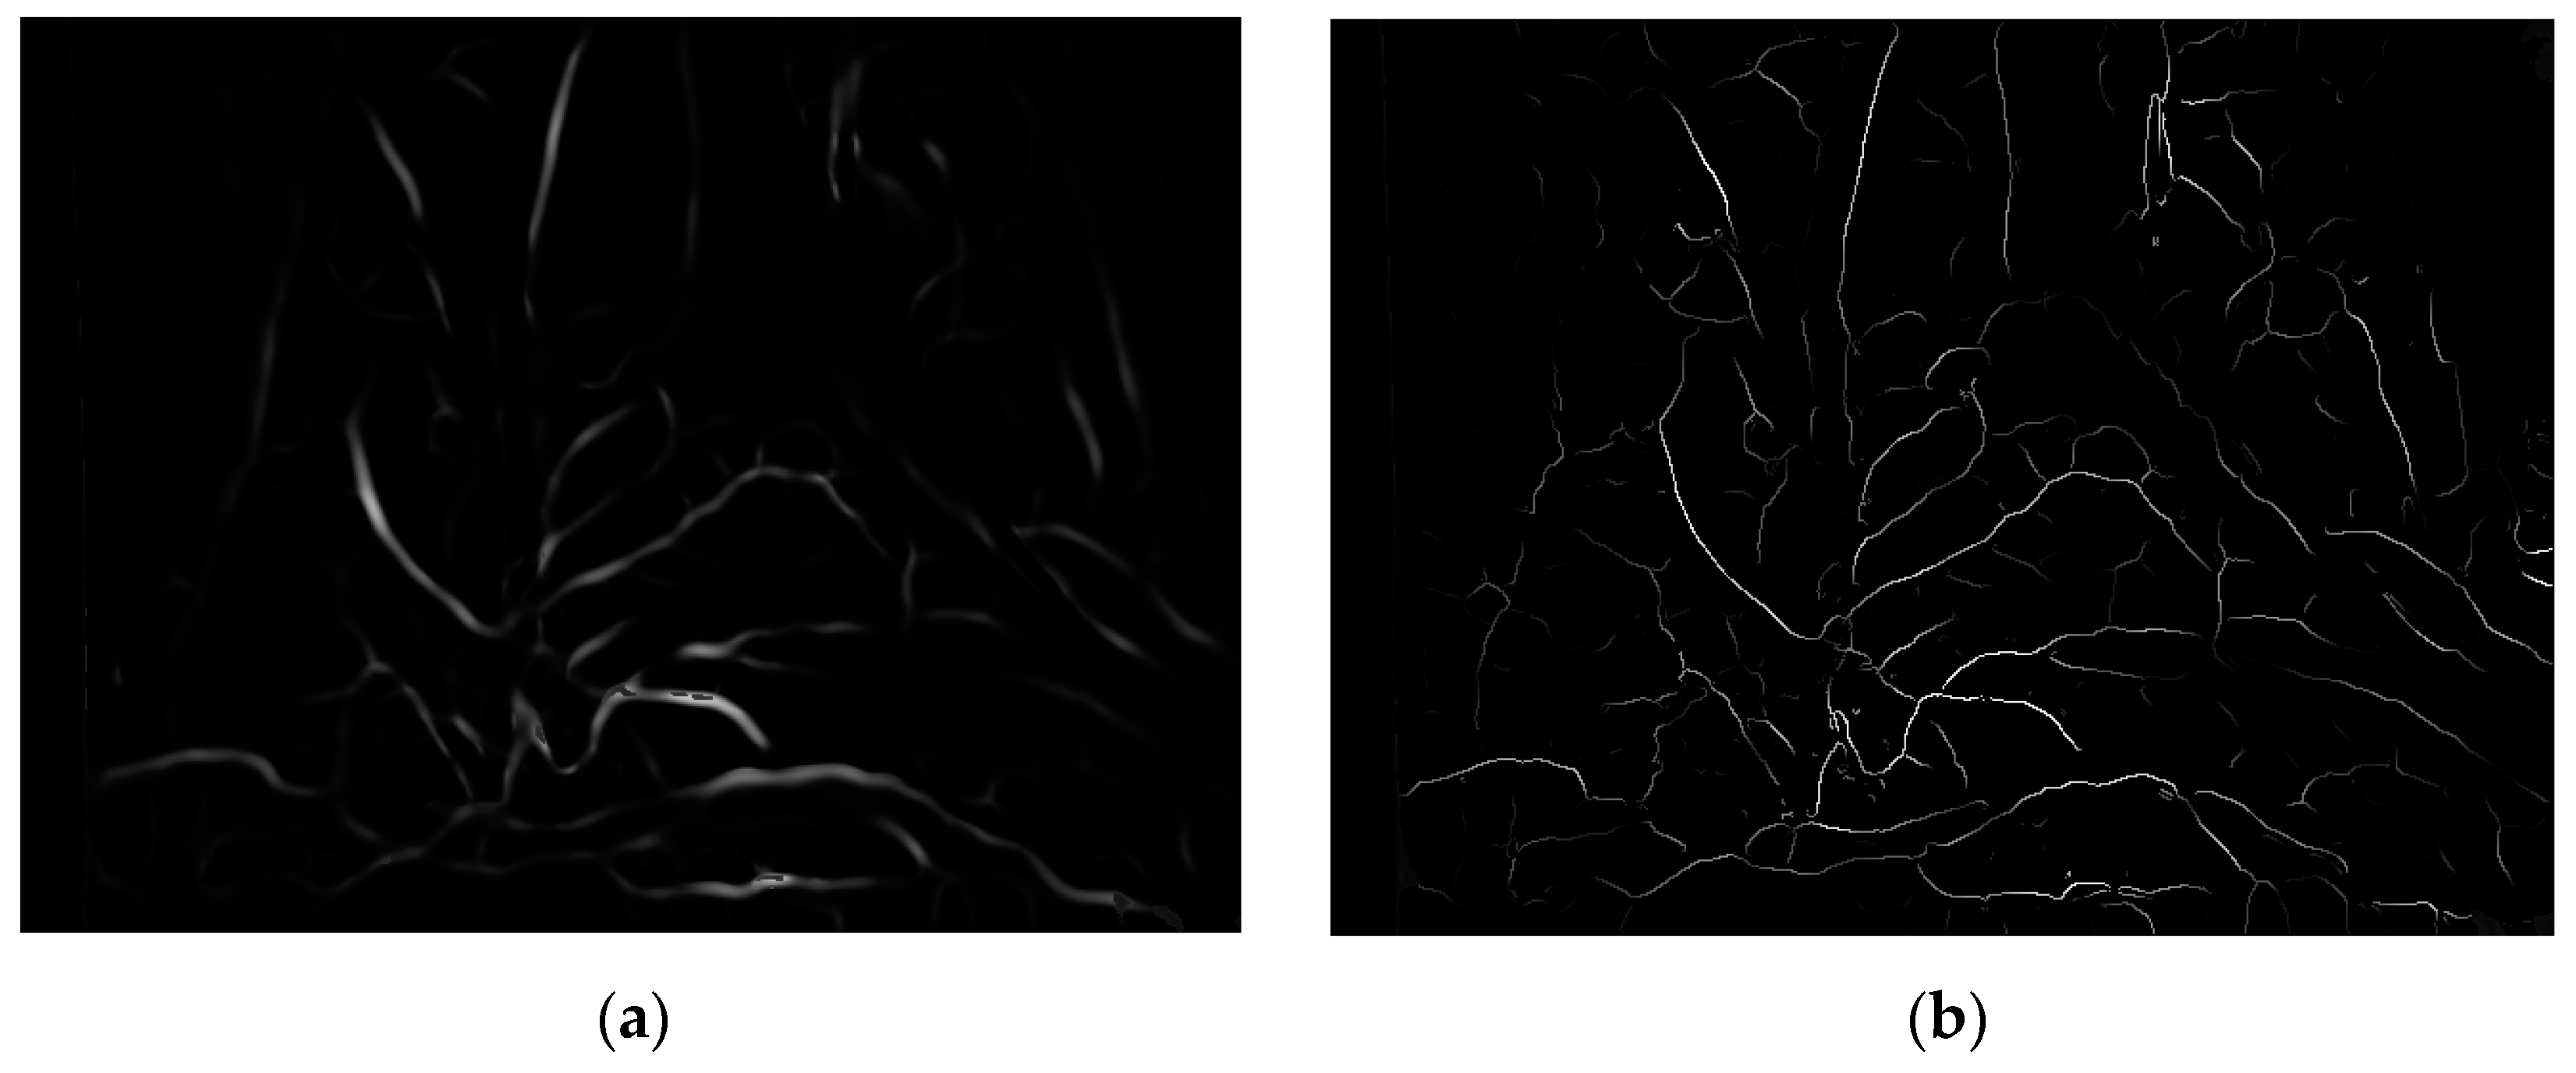
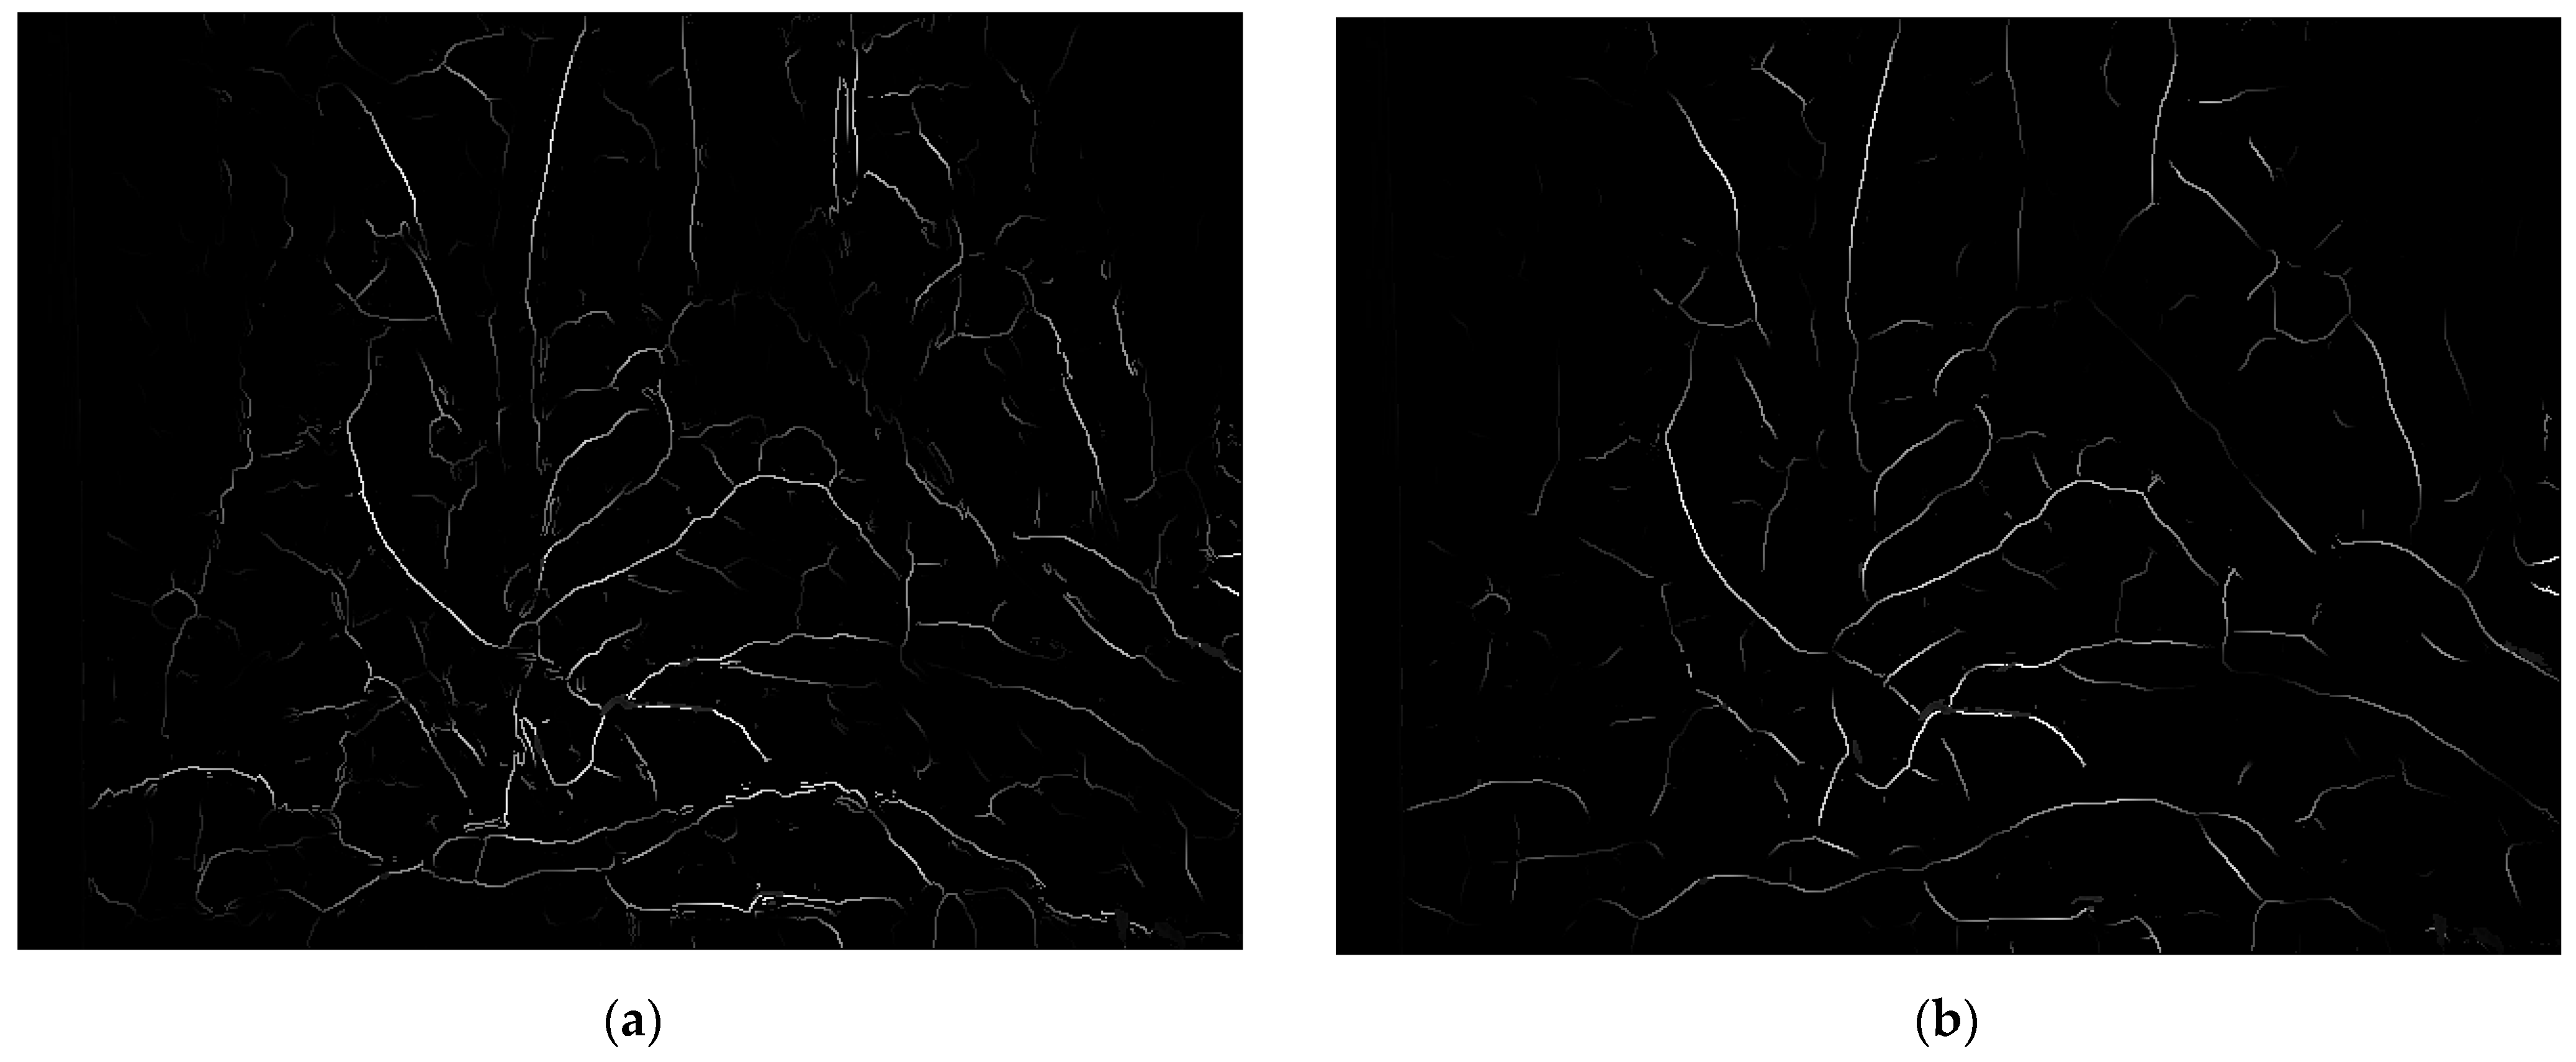
Iridge represents ridge degree. As shown in
Figure 6, (a) is the enhancement result of the Frangi enhancement method, and (b) is enhancement result of this paper method. The blood vessels after single-pixel transformation are thinner and have clearer branches compared to the original method blood vessel images in the human lumen.
Algorithm 1 describes a Gaussian weighted fusion of dual-branch Frangi measures and MFAT for single-pixel enhancement of vascular structures.
| Algorithm 1 |
Input: Inner cavity image I, preprocessed inner cavity image Ipre, masked image Imask
Output: Single-pixel vascular image Iridge- 1:
Branch 1 uses a blood vessel enhancement algorithm based on Frangi measure filtering on Ipre - 2:
for each pixel p ϵ Ipre do - 3:
for each scale σ do - 4:
Calculate the Hessian matrix and its eigenvalues (λ1, λ2) and eigenvectors (Ix, Iy) - 5:
Calculate Direction, RB, and S based on eigenvalues and eigenvectors - 6:
At scale σ Calculate the Frangi measure filtering result F(σ) - 7:
end for - 8:
Extract the maximum response and corresponding filtering result max(F(σ)) - 9:
end for - 10:
Combining Imask to generate Frangi measure vascular enhancement images IFrangi, Direction - 11:
Branch 2 using MFAT based vascular enhancement on Ipre - 12:
for each pixel p ϵ Ipre do - 13:
for each scale σ do - 14:
Calculate the Hessian matrix and its eigenvalues (λ1,λ2) and Direction - 15:
Set λ3 = λ2. Construct new eigenvalues based on the eigenvalues λp1, λp2, and calculate - 16:
At scale σ calculate and update MFAT results - 17:
end for - 18:
Remove pixels < 1 × 10⁻² - 19:
Extract the maximum response and corresponding scale filtering result max(σ)) - 20:
end for - 21:
for every steps μϵ (2, 4) do - 22:
Establish a Gaussian model and calculate weights w1 and w2 - 23:
Weighted fusion of IFrangi and IMFAT to generate binary image Ivessel - 24:
Using single-pixel algorithm based on I, Ivessel, and Direction - 25:
Gaussian Filter Smoothing Image I - 26:
Generate grid coordinate matrix [X, Y] - 27:
for each coordinate (x, y) ϵ [X, Y] do - 28:
Calculate the feature direction gradient ∇ and inner product - 29:
If there is a sign change in the gradient along the direction of maximum curvature, it is considered as a vascular ridge line mask_ridge - 30:
Multiply the ridge mask with the vascular image to obtain the vascular centerline image Iridege - 31:
if the single-pixel detection flag for blood vessels is true - 32:
Interpolate and shift vascular images to obtain IRshift1 and IRshift2 - 33:
Compare to obtain a single-pixel ridge mask_ridge2 and its application - 34:
end if - 35:
end for - 36:
Generate a single-pixel vascular image Iridge - 37:
Calculate the SSIM score between I and Iridge - 38:
end for - 39:
Select the corresponding optimal parameter μ based on the maximum SSIM score - 40:
Calculate the optimal weights w1 and w2 - 41:
Weighted fusion of IFrangi and IMFAT to generate binary image Ivessel - 42:
Generate a single-pixel vascular image IFrangi using a single-pixel algorithm based on I, Ivessel, and Direction
|
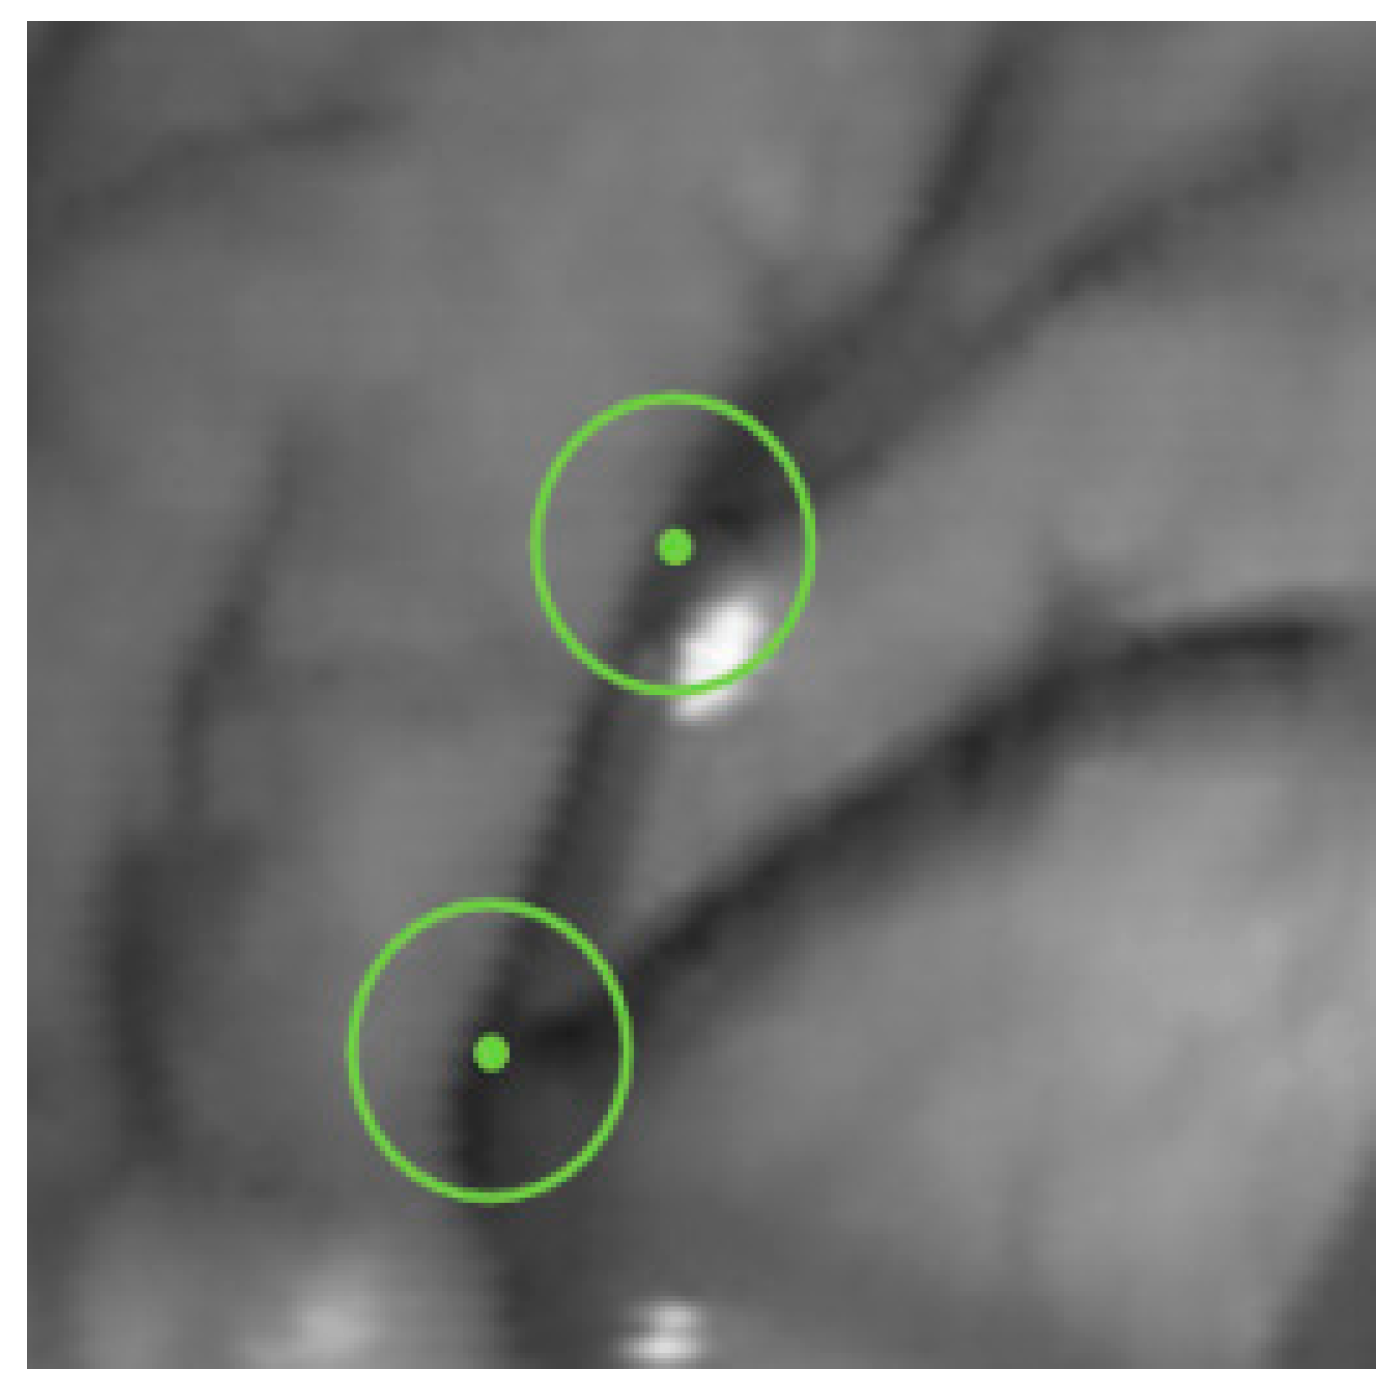
2.3. Circle Detection of Vascular Branches
A vascular branch point is a feature point with three or more vascular branch segments centered on it. Due to rotation and scaling, the vascular branch points can still be detected in intracavitary vessels with a single texture feature and strong robustness. Based on this definition and the principles of the FAST algorithm, a single-pixel wide blood vessel image that has undergone image preprocessing is defined as a blood vessel branch point when there are three or more identical pixel values between the center candidate point and the point on the circumference. This method is called the circle detection of vascular branches (CDVB), and the intersection of the circumference with three or more blood vessels will cause a black and white change in the color of the pixels on the circumference, as shown in
Figure 7.
Although blood vessels have been pixelated, there is still a possibility of multiple pixels at the intersection of blood vessels and circles in the CDVB algorithm. In order to determine the accurate position of the intersection pixels, all pixel values along the circumference are counted, and the peak coordinates are taken as the intersection coordinates. Set a threshold to determine feature points, as shown in Equation (27)
where
P is a candidate detection target point with a pixel value of
IP, and
r is the radius of the circle. Set a threshold
, and subtract the pixel values on the circle from the pixel values at point
P to obtain
IP −
Ix. Compare this value with threshold
. If there are
N consecutive pixels with a difference greater than
from
IP, then the candidate point will be judged as a feature point.
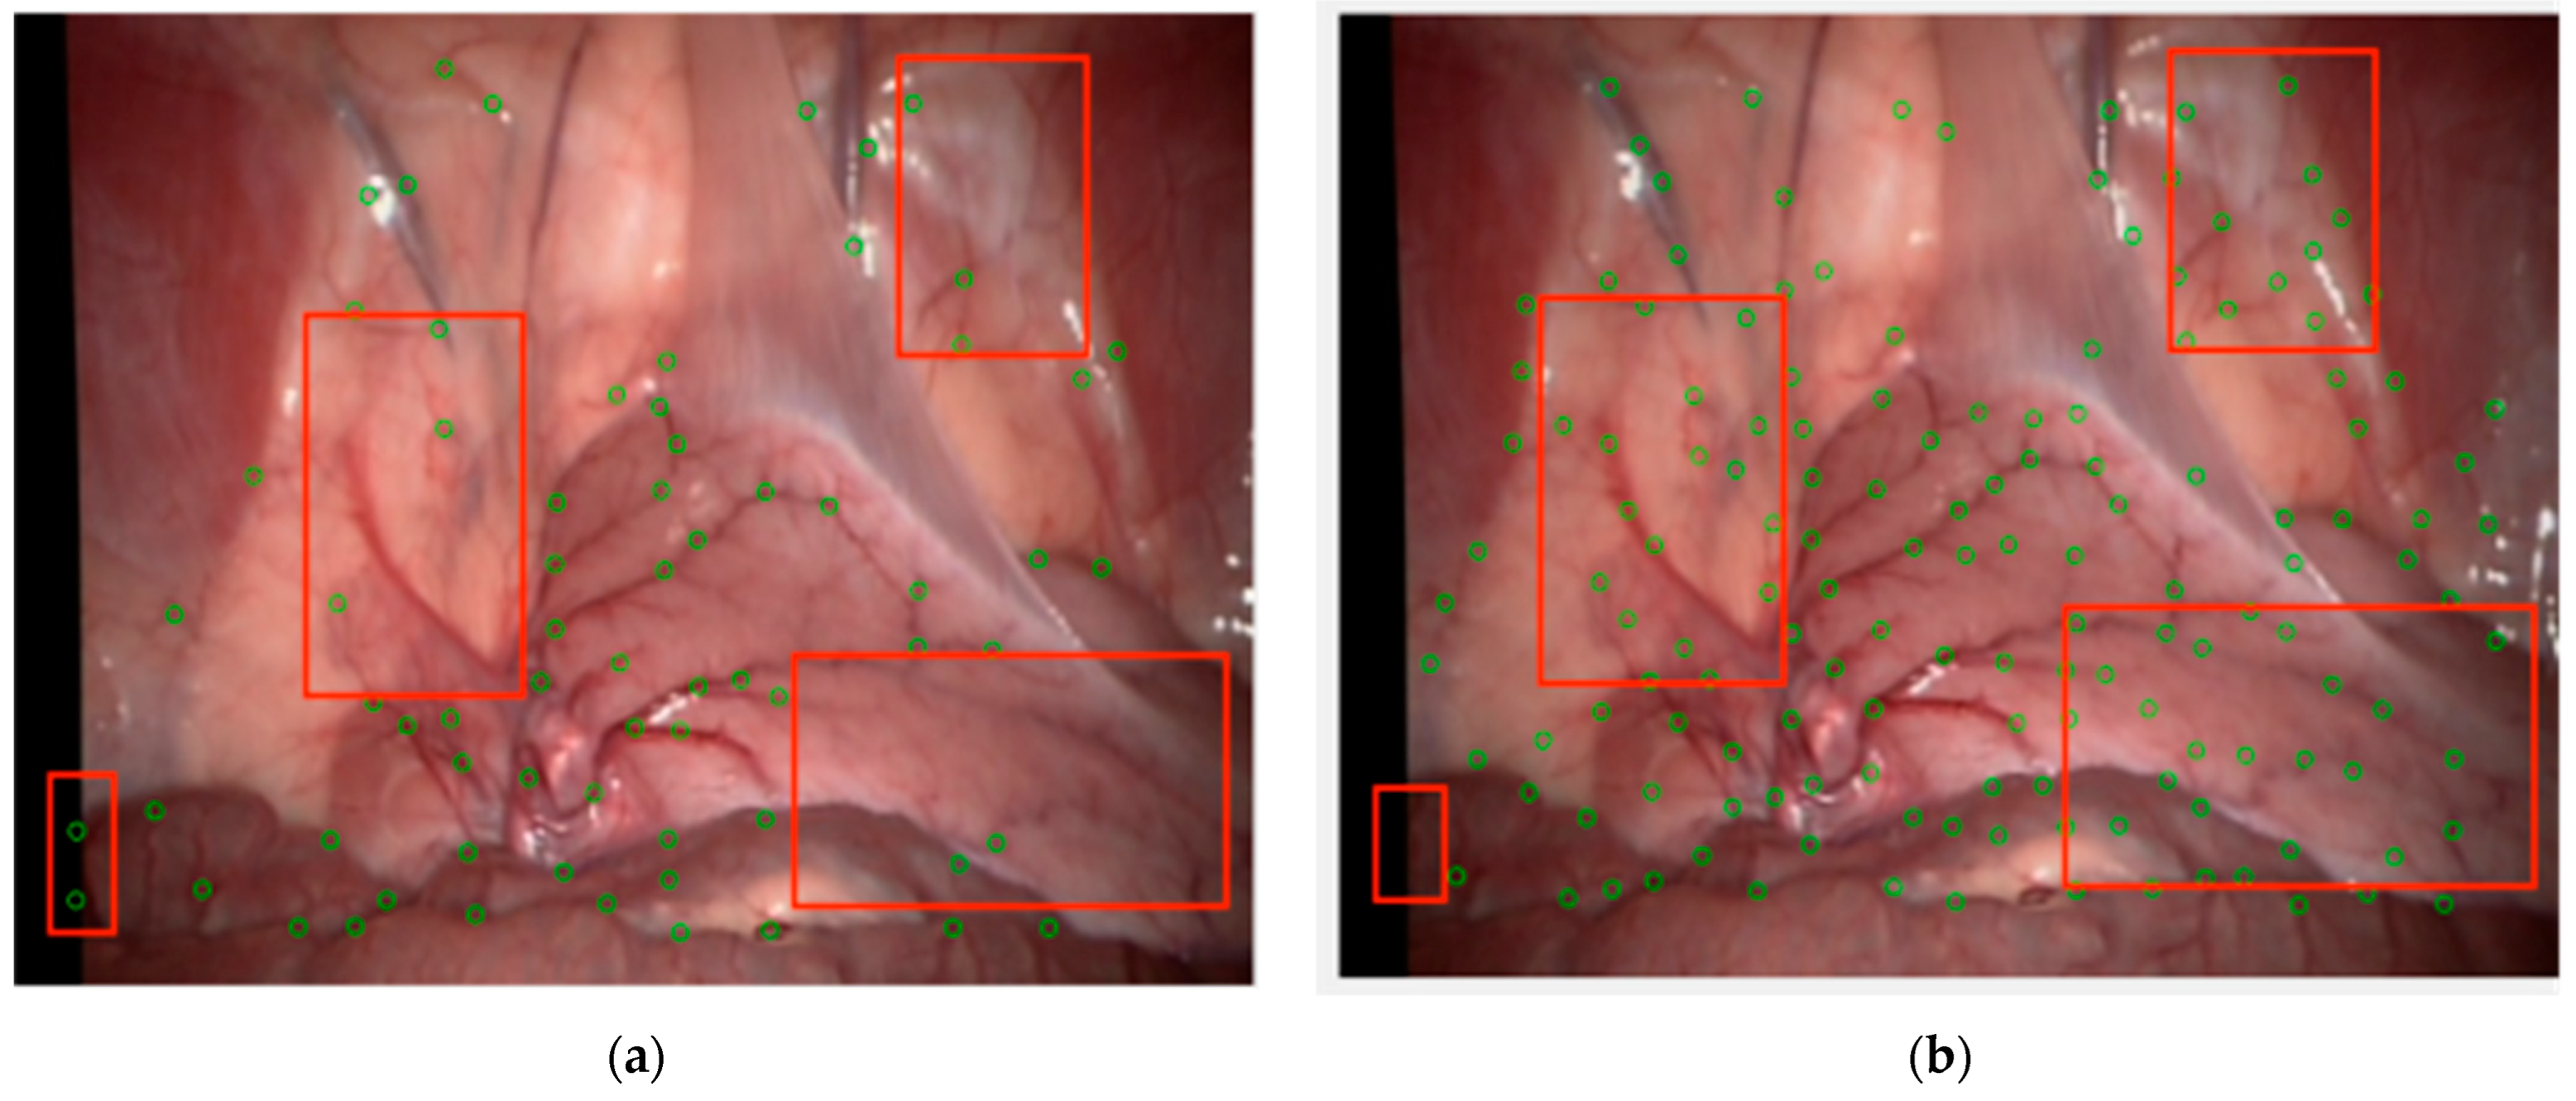
In order to enhance the recognition ability of microvascular branching points, reduce false detections, and enhance algorithm adaptability and flexibility, set different radius double circles on the candidate points for judgment. If one of the circles is successfully judged, it will be marked as a feature point and its coordinates and peak points will be recorded.
This method can accurately detect the branching points of blood vessels in the human lumen. However, there still exists uneven distribution of feature points, especially the accumulation of local feature points. There are two reasons for this type of accumulation: first, there are multiple effective corner points in a small area, and second, due to the width of blood vessels, it is highly possible to detect multiple feature points in a single effective corner area, with all but one being redundant. This situation not only increases the computational burden, but also poses a risk of reducing the accuracy of feature point matching.
For the above situations, NMS is introduced to solve the problem of uneven distribution of feature points [
41]. Perform connectivity analysis based on the peak point of feature point
P in the neighborhood, and obtain the score value of the score function
V for the connected component calculation. If
P is the point with the highest score value in the neighborhood, it is kept:
where
V represents the score,
IT represents the pixel value of the template point,
b is the bright spot, and
d is the dark spot.
2.4. Neighborhood Block Branch Point Matching Based on ZSSD
Based on the feature point neighborhood block matching algorithm in PTAM, the sum of squared errors is calculated within the neighborhood range of the matching points, and the matching point pairs are determined by the value of the sum of squared errors. In the prematching graph S, take a small rectangular graph in S with an area of
M ×
N. The starting coordinate of the rectangular graph is the coordinate of the upper left corner (
i,
j). The template that matches the small rectangular graph is found through the traversal method. Whether it matches or not needs to be determined by calculating the value of the sum of squared errors as follows:
Among them S(x, y) is the search image of size M × N, and T(x, y) is the template image of M × N. m − M + 1, n − N + 1. The smaller the average absolute difference D(i, j), the more similar it is. Therefore, just find the smallest D(i, j) to determine the position that can match the block.
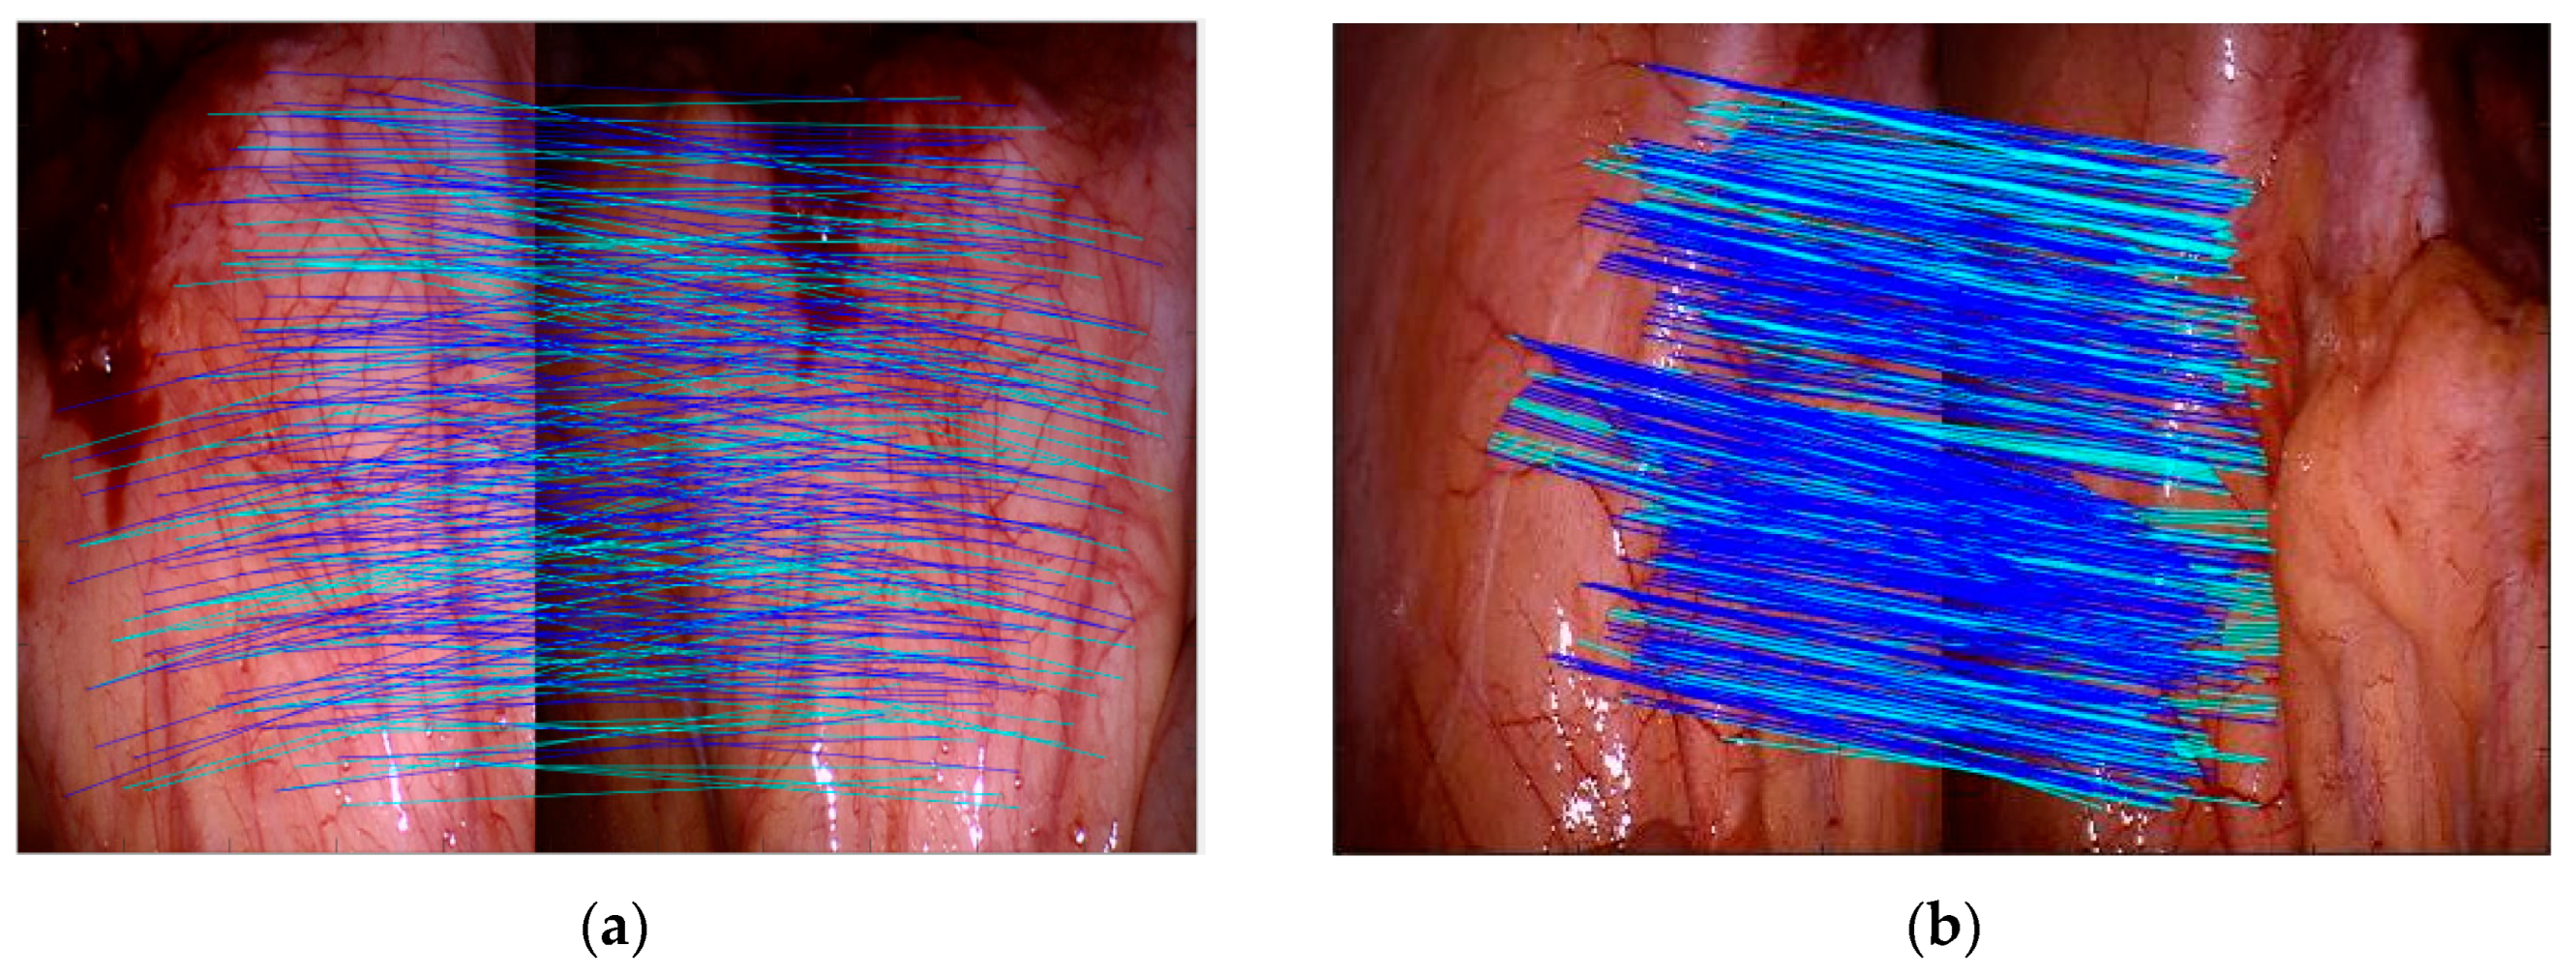
Based on the block search process, the information from previous frames is first saved by defining a search area for each map point in the current frame. For each P point saved in the frame, its corresponding point Q in the current frame can be obtained through homography mapping. The search area of P is a circular area centered on Q, with a radius of 1/20 of the image width. Second, select the feature points located within the neighborhood in the current frame, which are called neighboring points. Compare the 21 × 21-sized neighborhood blocks of each neighboring point with the same-sized neighborhood blocks of point P. Apply the affine warping obtained from the ground truth homography mapping to the local blocks of point P to accommodate changes in viewpoints, and calculate the ZSSD for each block. Finally, if the ZSSD value of a neighboring point is the minimum and is less than the predefined threshold of 0.02, it is considered to be matched. The condition for determining the correct pair of corresponding points is 3.5 pixel.
4. Discussions
The prerequisite for reconstruction technology is accurate feature tracking, which is a well-researched topic in computer vision. Existing research indicates that there are significant issues in directly applying commonly used visual techniques to MIS due to the involvement of large-scale, free-form tissue deformation and constantly changing surgical scenes that are influenced by complex factors. In this case, the accuracy and efficiency of tracking largely depend on the detection of visual features, which need to exhibit high repeatability under image transformation and robustness under scene changes. This paper analyzes the differences between MIS images and images of the retina, neurons, etc., in response to the lack of robust and uniformly distributed features in the inner cavity space. For MIS images containing rich specular reflections, uneven lighting areas, smoke, and other factors, further research and design were conducted on a method for detecting and associating vascular features based on dual-branch weighted fusion vascular structure enhancement.
The preprocessing process analyzes the factors that lead to incorrect extraction of branch points in different internal cavity environments. The self-adaptive threshold is used to generate binary mask images and introduce them into the fusion processing stage. The threshold judgment and FMM method are used for highlight repair to suppress the influence of boundary and highlight regions. The visual effect of the experimental results shows the effectiveness of the method proposed in this paper.
The enhancement process combines the advantages of two enhancement algorithms to design a Gaussian weighted fusion of dual-branch Frangi measure and MFAT for single-pixel enhancement of the vascular structure. The process introduced SSIM indicators as self-adaptive standards to improve algorithm accuracy and reliability, analyzed indicators to determine the weight parameter range applicable (2, 4) to the inner cavity environment, and improved the algorithm speed.
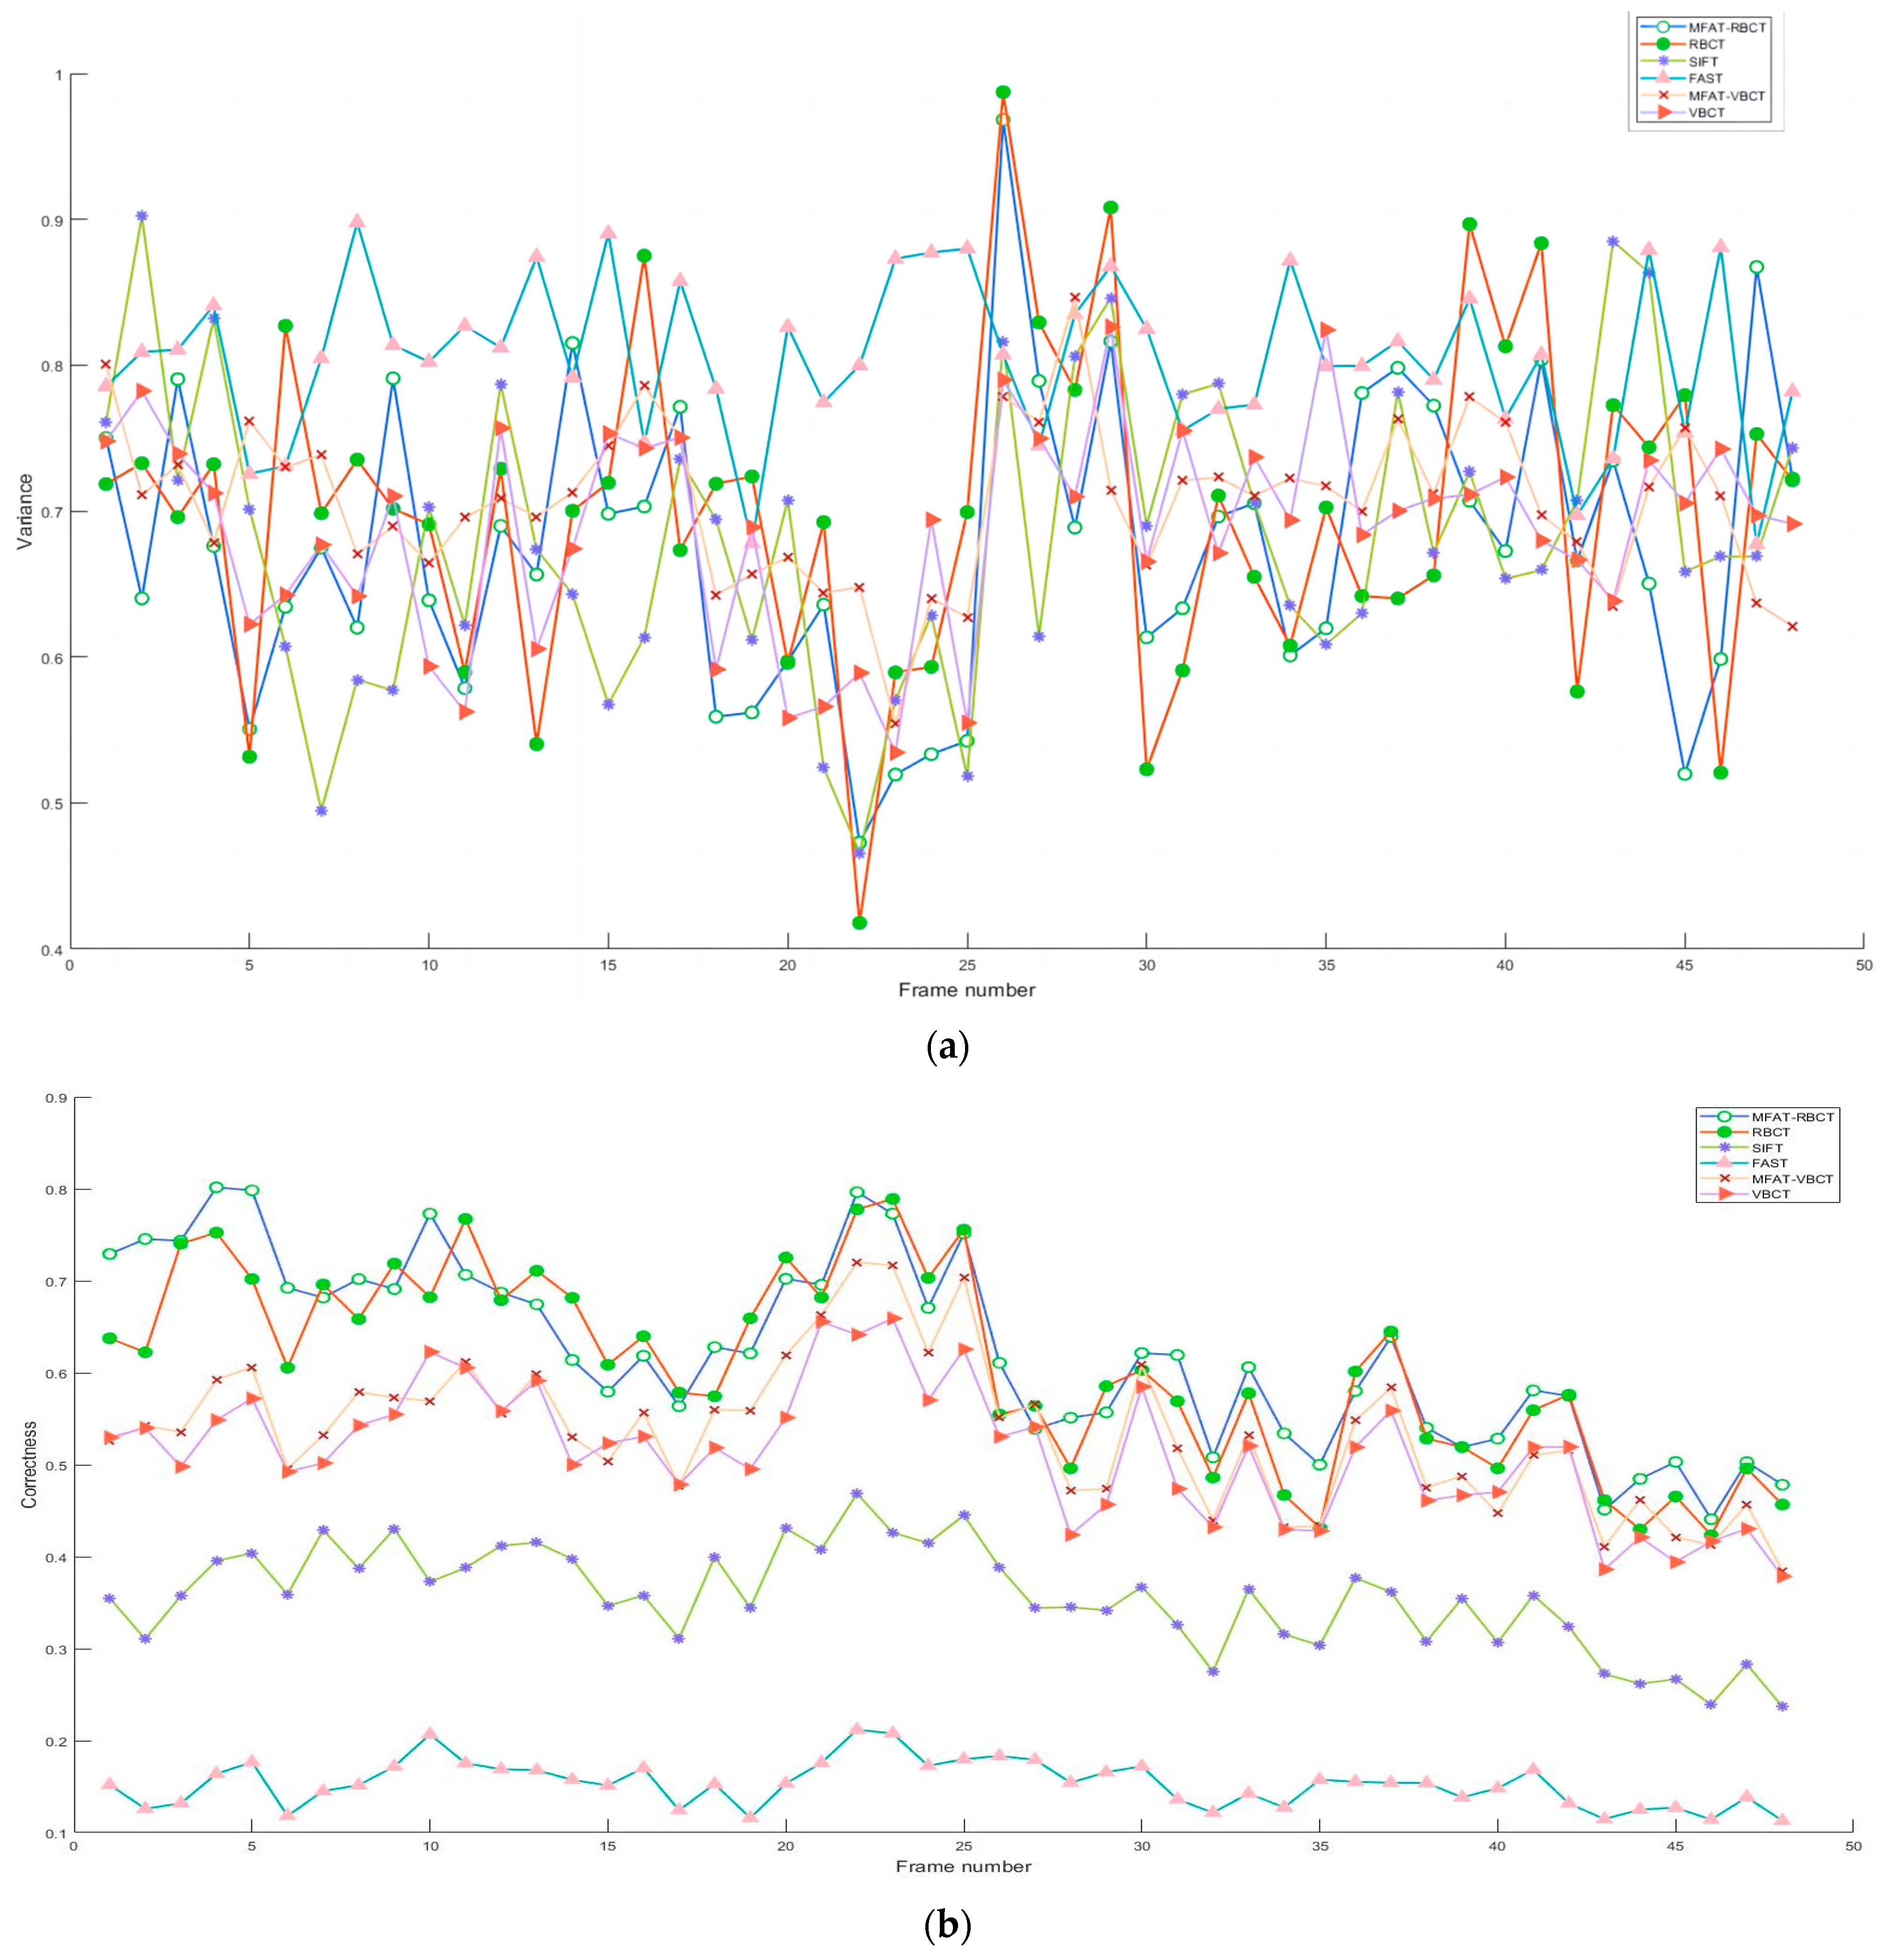
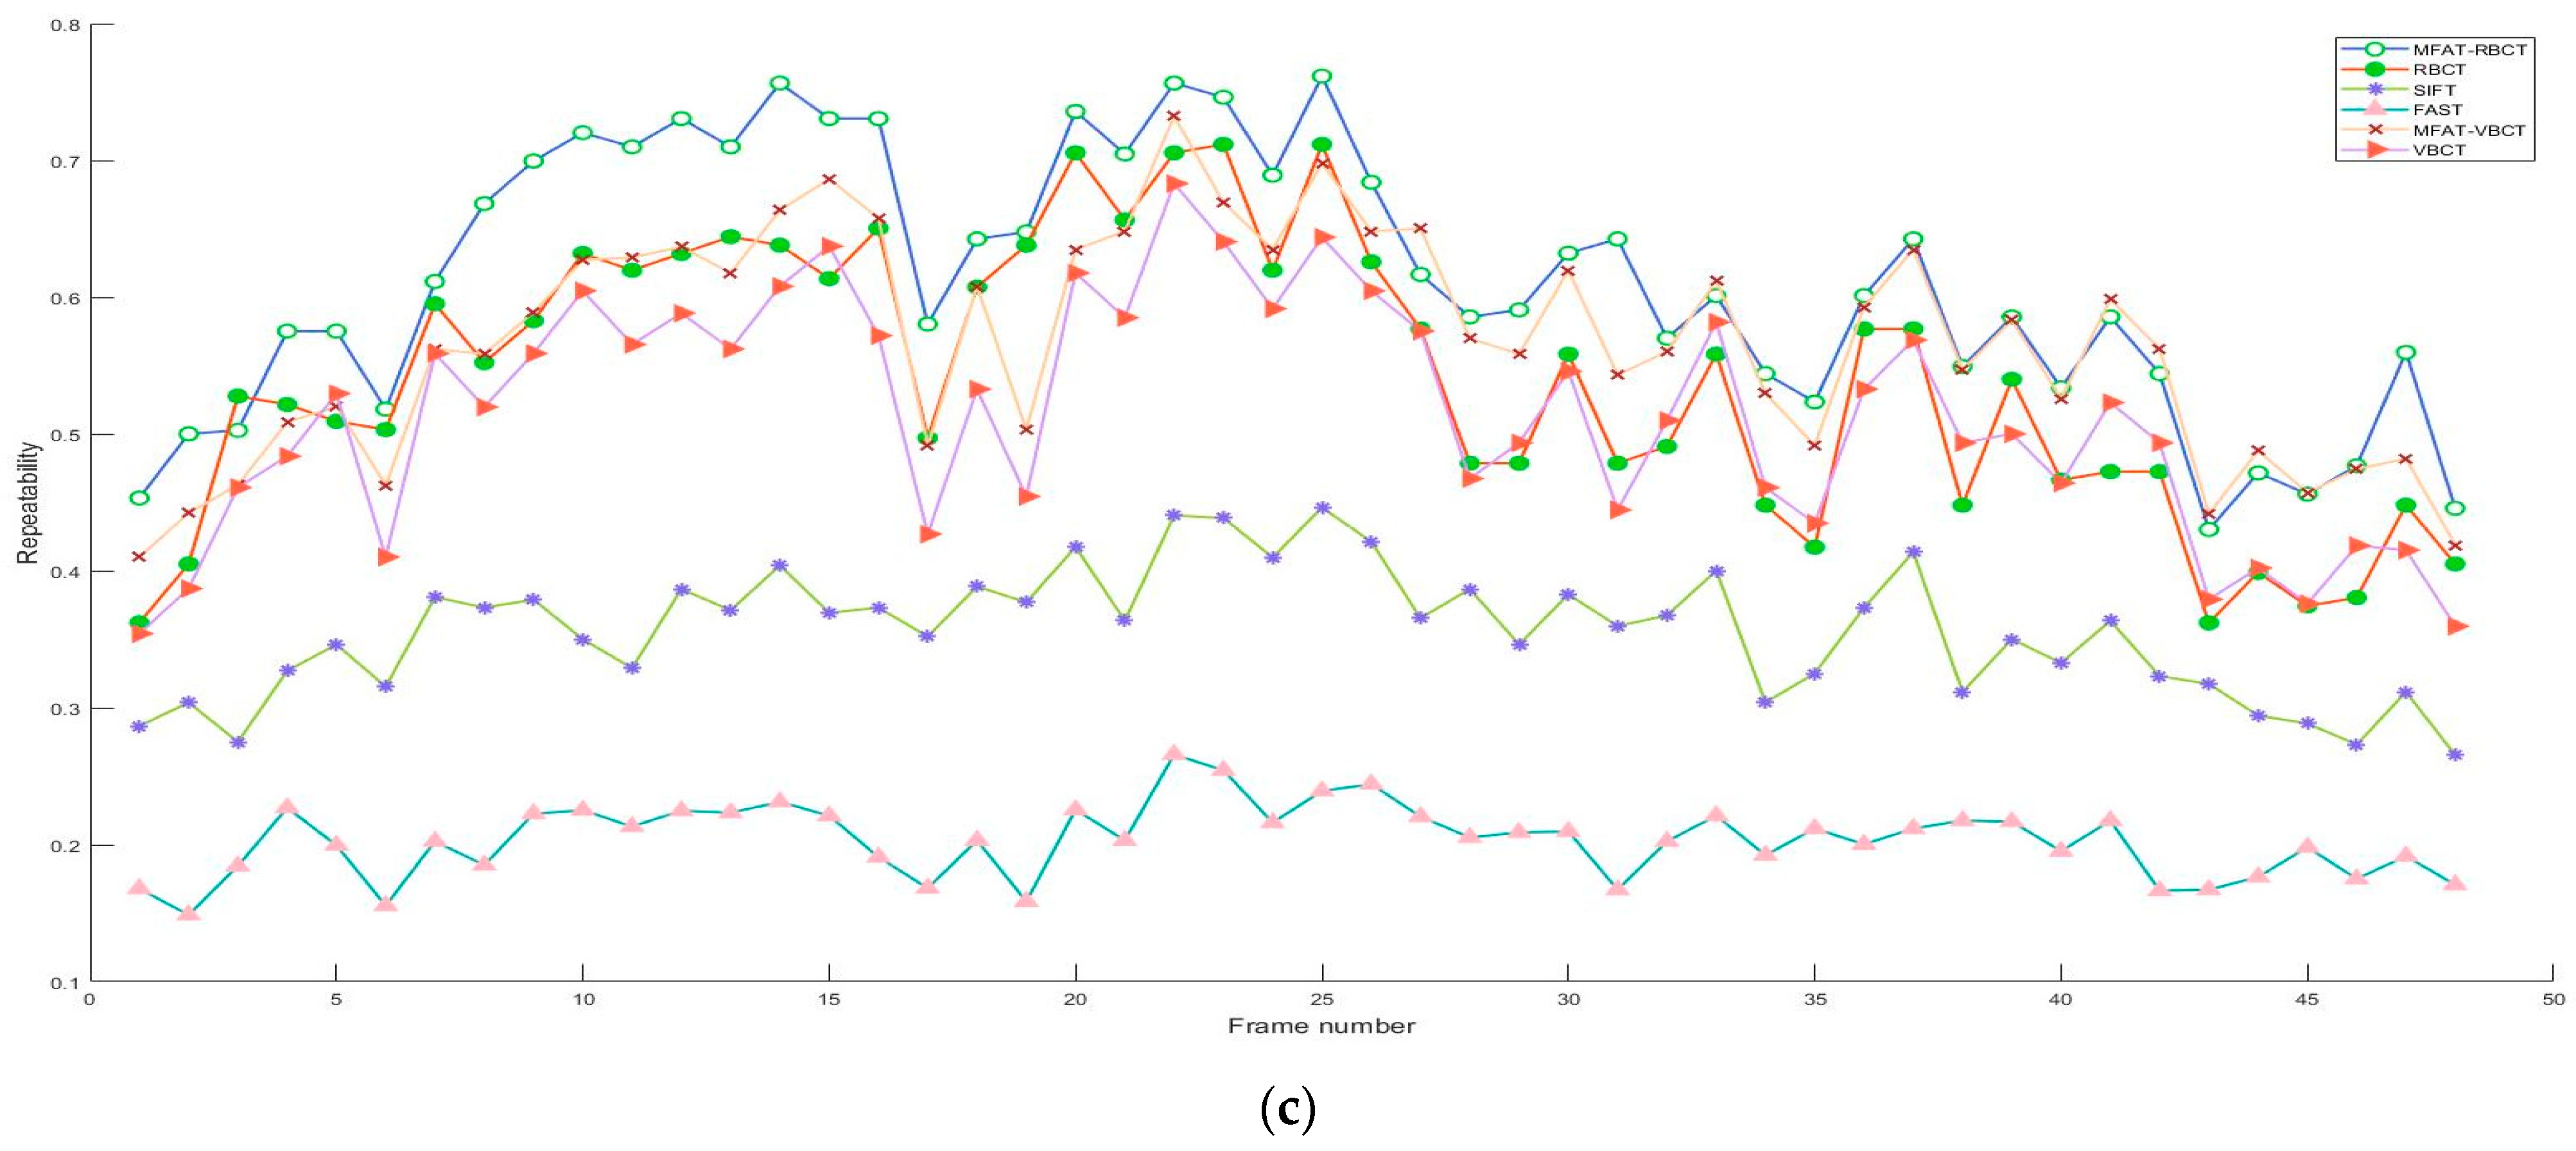
The feature extraction and associating process set up dual-circumference detection combined with the NMS algorithm to extract vascular feature points, and calculated ZSSD for branch point matching based on the feature point neighborhood block matching algorithm. Subjectively, the experimental results indicated that the algorithm proposed in this paper compensated for the structural measurement differences and uneven responses of the Frangi enhancement method to venous vessels and microvessels, providing effective structural information for later vascular feature extraction. Objectively, a detailed analysis was conducted on the methods proposed in this paper (MFAT-RBCT, MFAT-VBCT), and classical algorithms RBCT, SIFT, FAST, and VBCT. VBCT did not perform single-pixel processing on the vascular structure during the processing. The experiment is divided into frame rate analysis for all data sets and overall analysis for a single data set. As shown in
Figure 12a, b, c, respectively, this study analyzed the variance, matching accuracy, and repeatability of six methods for all frame rates in data set clip1. The accuracy and repeatability of single-frame matching have been improved compared to RBCT and VBCT, and are significantly better than FAST and SIFT.
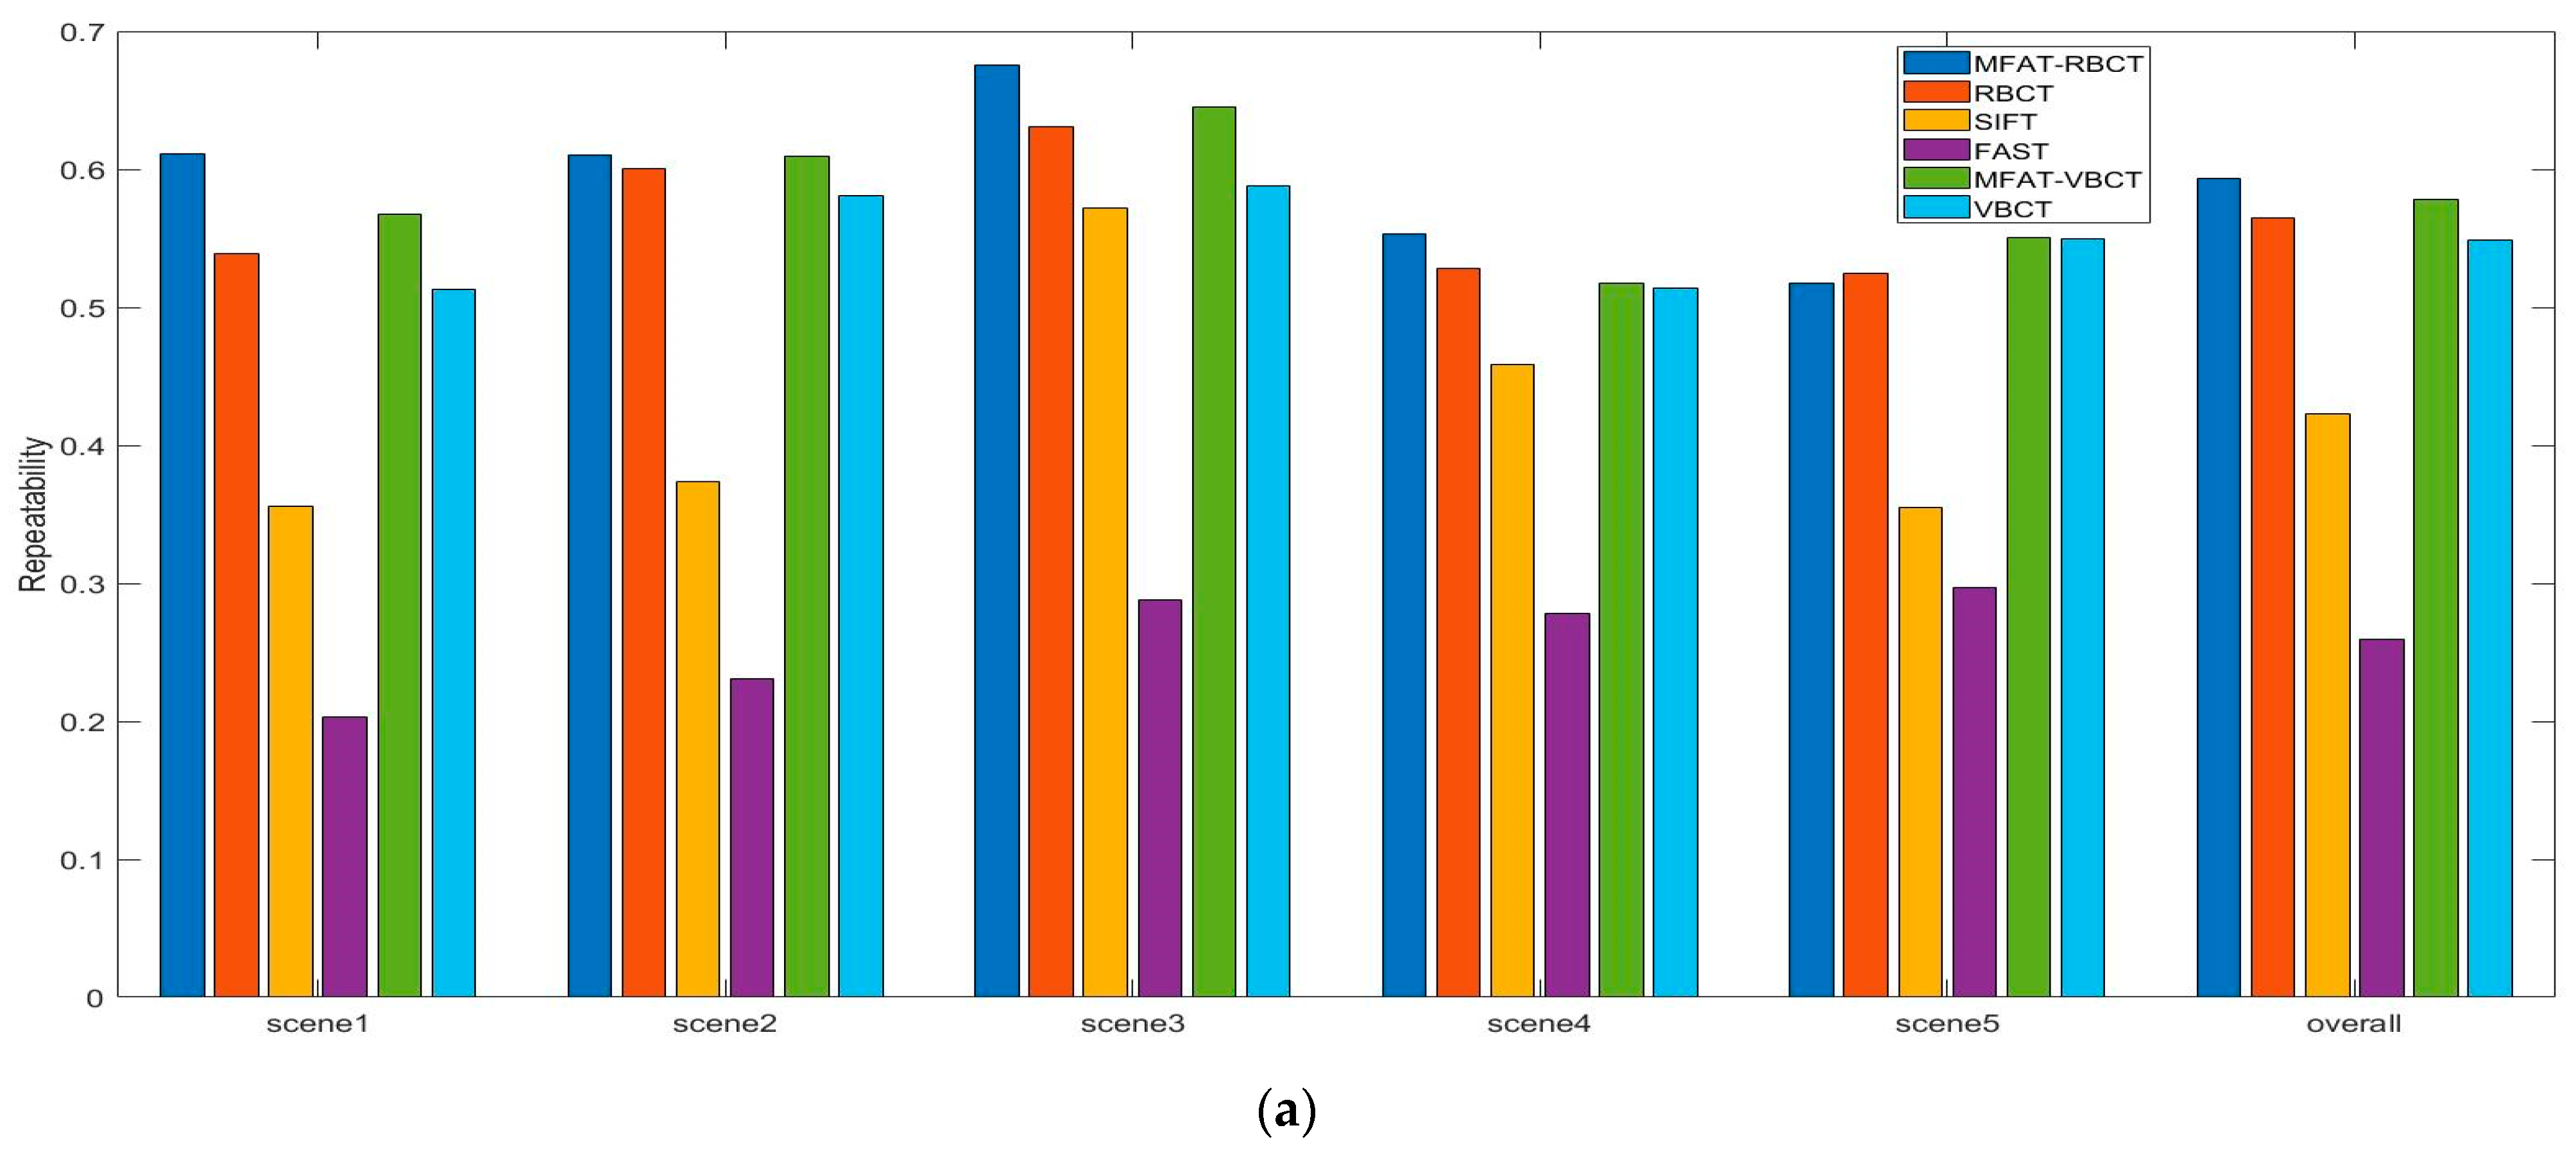
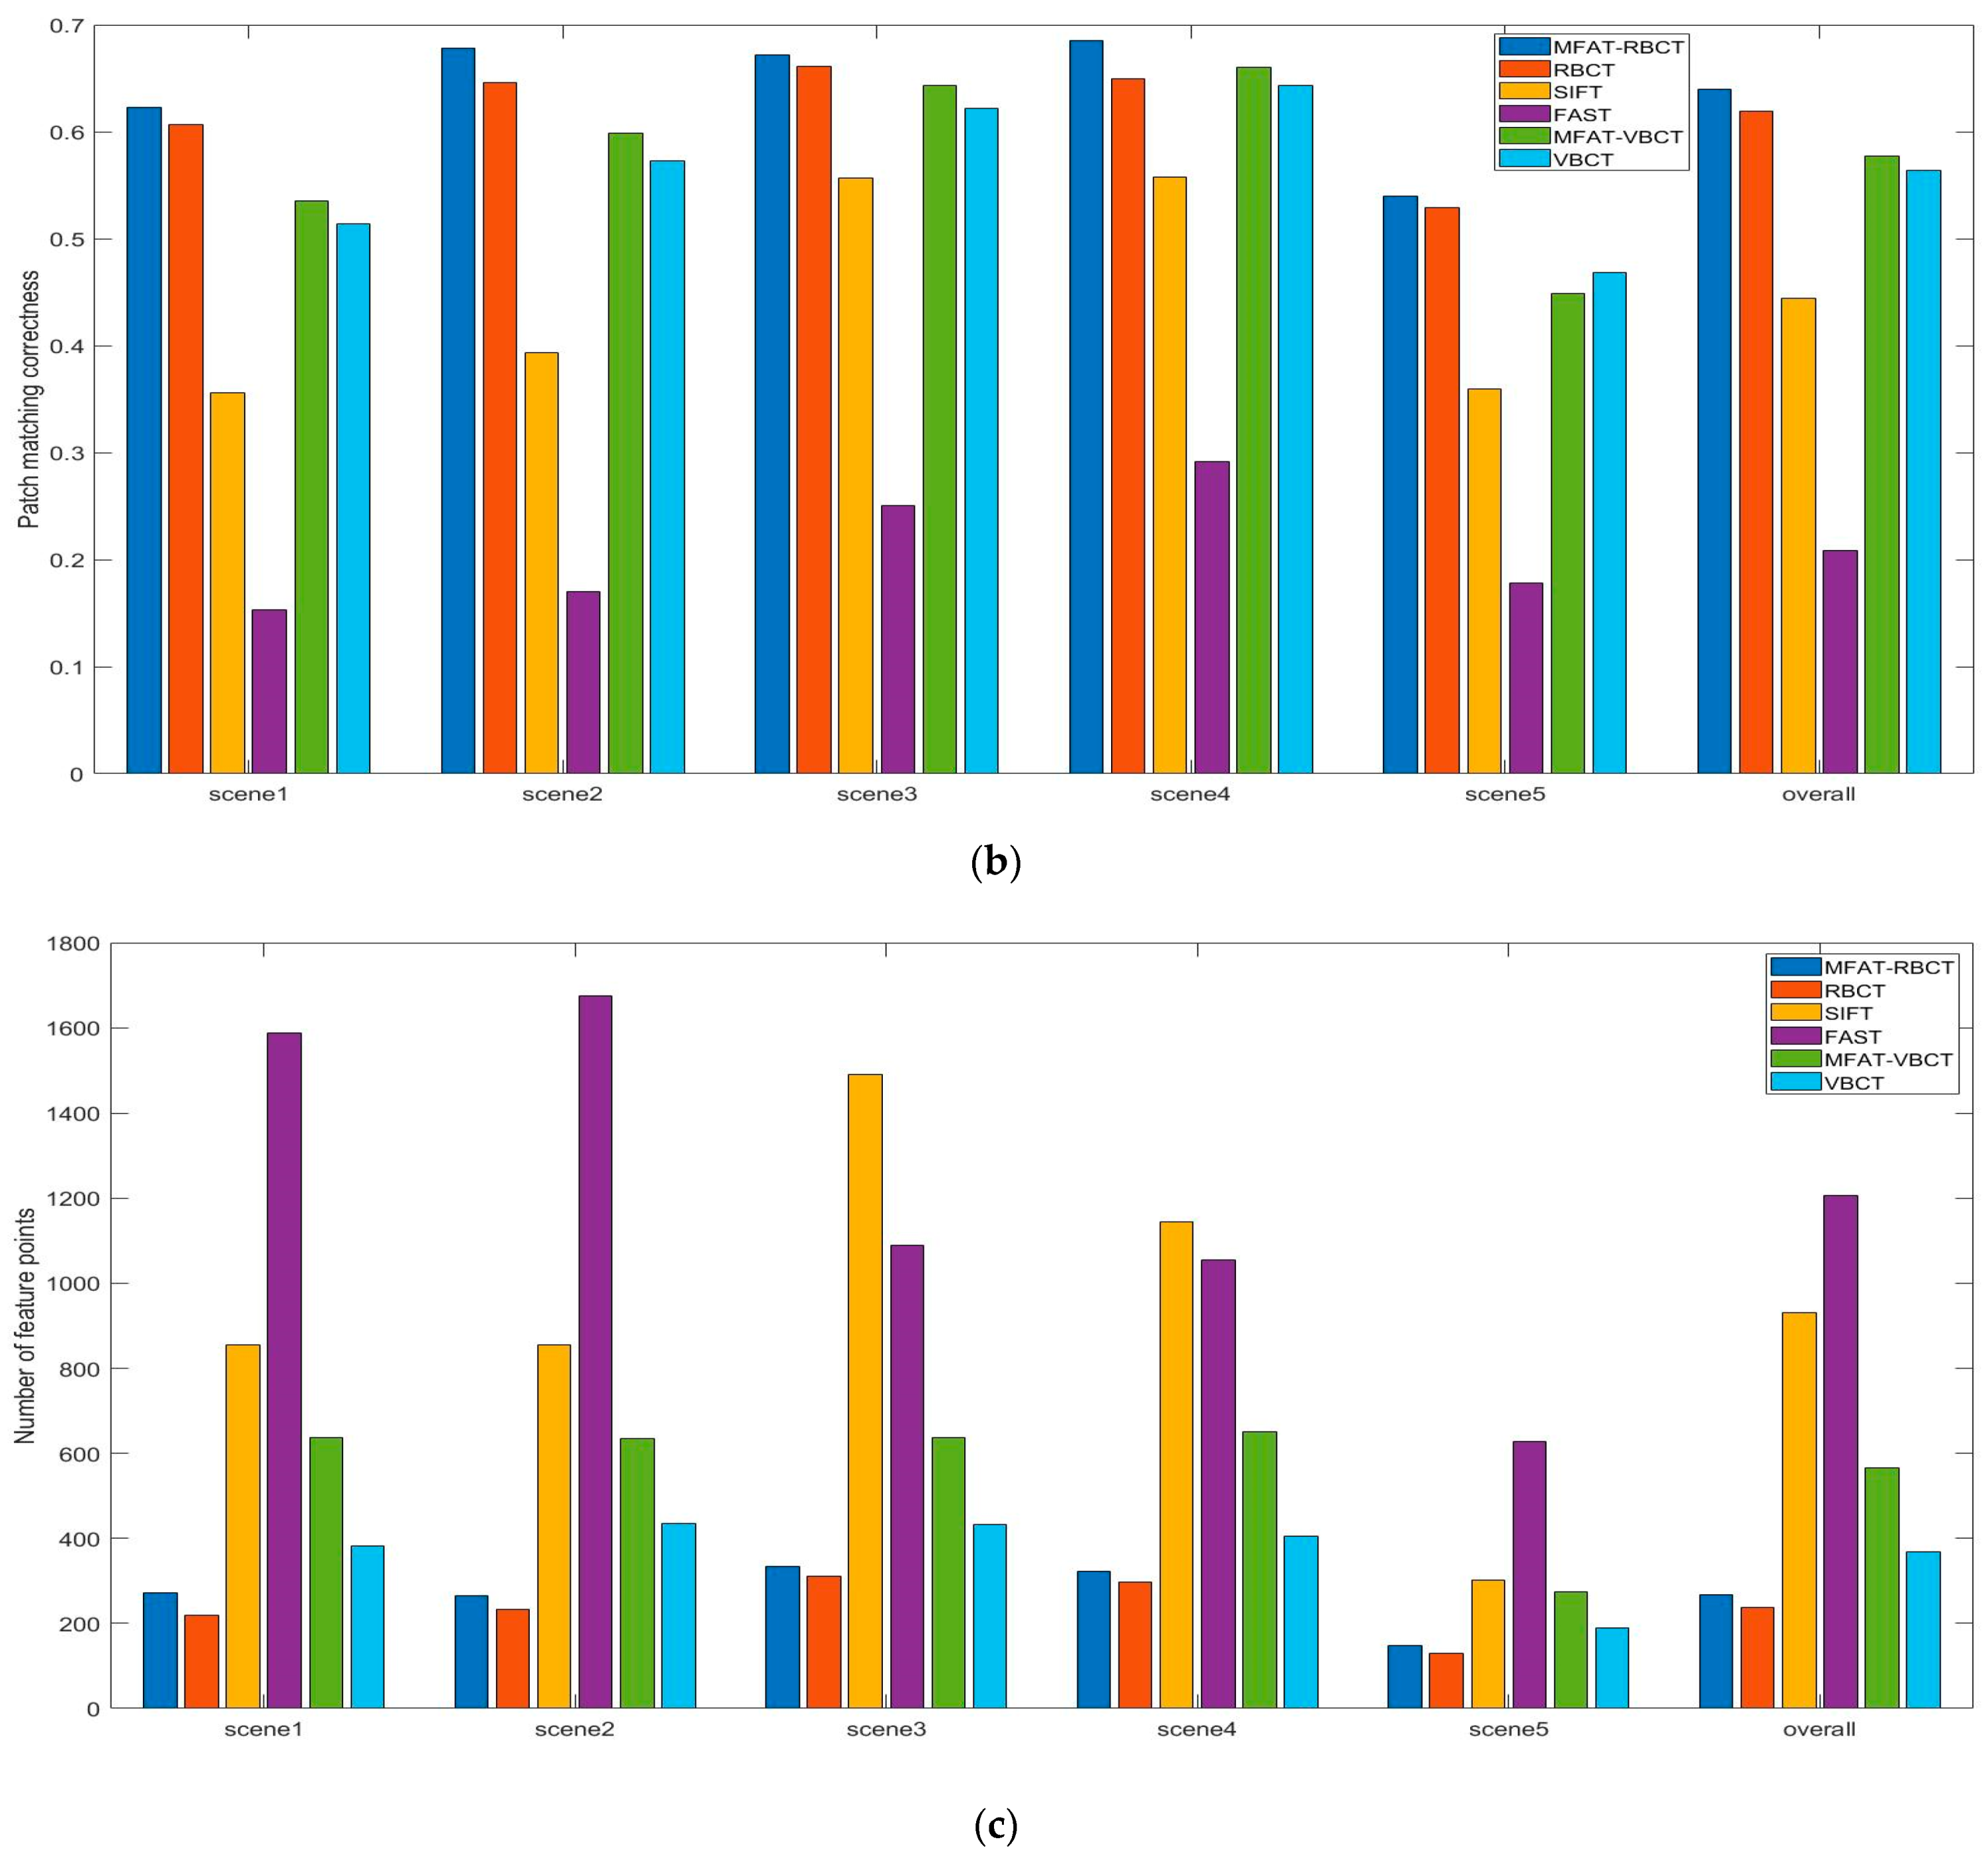
As shown in
Figure 13a, b, and c, respectively, this study calculated the repeatability, matching accuracy, and number of branch points for five data sets and their synthesis. In the first four data sets, there was a significant improvement in repeatability, matching accuracy, and the number of branch points compared to RBCT and VBCT. Data set clip5 showed similar results to RBCT and VBCT due to poor image quality indicators. The results showed that compared with RBCT, the overall matching accuracy improved by 3.23%, the number of branch point detections increased by 13.08%, and the repeatability improved by 4.91%, which meant that our method has achieved good performance on five data sets, proving its generalization and robustness.


