Abstract
Dimetridazole (DMZ), a nitroimidazole derivative, is a notable antibiotic that has garnered growing interest in the medical community owing to its noteworthy pharmacological and toxicological properties. Increasing interest is being directed toward developing high-performance sensors for continuous monitoring of DMZ in food samples. This research investigated an electrochemical sensor-based nano-sized ErVO4 attached to a sheet-like g-CN-coated glassy carbon electrode to determine dimetridazole (DMZ). The chemical structure and morphological characterization of synthesized ErVO4@g-CN were analyzed with XRD, FTIR, TEM, and EDS. Irregular shapes of ErVO4 nanoparticles are approximately 15 nm. Cyclic voltammetry (CV) and differential pulse voltammetry (DPV) were followed to examine the electrochemical performance in pH 7 phosphate buffer solution for higher performance. This electrochemical sensor showed a low detection limit (LOD) of 1 nM over a wide linear range of 0.5 to 863.5 µM. Also, selectivity, stability, repeatability, and reproducibility studies were investigated. Furthermore, this electrochemical sensor was applied to real-time milk sample analysis for the detection of analytes.
1. Introduction
1,2-Dimethyl-5-nitro imidazole (dimetridazole or dimet or DMZ) is a nitroimidazole-type veterinary drug used for bacterial and protozoal infections in animals, and it is used as a growth promoter in meat production to enhance efficiency in feeding. DMZ is banned in food processing in many countries because the residue of DMZ leads to mutagenicity, carcinogenicity, and genotoxicity in the human body. While the United States, Canada, Japan, and China have already banned DMZ, the United States and the European Union have also established a maximum residue limit of biological samples such as meat and milk. Among different biological matrices, milk has a lower maximum residue limit, and the detection limit is required to be ≤2 μg/kg [1,2,3,4,5].
DMZ can be determined by electrochemical methods, immunoassay, thin-layer chromatography (TLC), gas chromatography (GC), gas chromatography–mass spectrometry (GC–MS), high-performance liquid chromatography (HPLC), and liquid chromatography–mass spectrometry (LC–MS). Among these methods, GC and GC–MS need derivatized analytes, and HPLC needs a large sample volume, a long elution time, and is of high cost [6,7]. Because of these drawbacks in chromatography methods, the electrochemical method with a low detection limit becomes compatible with detecting DMZ in different environments. The advantages of electrochemical methods are low cost, high sensitivity, and detection of a wide range of target analytes. Cyclic voltammetry is a successive electrochemical method to analyze the oxidation and reduction reaction of a substance [8]. Coating nanomaterials can increase sensitivity, absorption, adsorption, and efficiency of application. Large specific surface areas of nanomaterials help to develop better limits of detection (LOD) and sensitivity [9].
Oxide-based materials are frequently used in electrochemical applications. Rare earth elements have gotten more attention in recent years because rare earth oxides are used in photocatalysis, thin film phosphors, and magnetics technologies. Among these oxides is rare earth orthovanadate (RVO4), which has unique chemical and physical properties. Moreover, rare earth orthovanadate structure exists in monoclinic monazite-type and a tetragonal zircon-type polymorphous compounds [10]. Erbium (Er) is the 11th atom of REE, attracting attention in recent doping photocatalyst applications [11]. Vanadium has oxidation states of +5, +4, +3, and +2 [12]. Diverse oxidation numbers of vanadium can be mixed with varied chemical elements, opening access to use in many applications. The study of the electrocatalytic behavior of erbium vanadate (ErVO4) is promising due to the compound’s high stability and excellent repeatability value. Moreover, RVO4; R = La, Ce, Nd, Sm, Eu, and Gd are the frequently used elements in electrochemical sensor applications and there are fewer electrochemical studies have been reported on ErVO4 [13,14].
Hydrothermal, solvothermal, sol-gel, Pechini, co-precipitation, and ion exchange methods can synthesize nano-sized materials. Furthermore, chemical methods have more advantages than mechanical methods. Even high-temperature methods are available, but some nanomaterials are unstable at elevated temperatures, which is a disadvantage for commercial usage [15,16]. The hydrothermal method uses a temperature range of 60–200 °C and controls the nucleation and crystal growth of RVO4. Therefore, effective nano-sized powder with a high surface area of ErVO4 can be easily prepared from the hydrothermal method for sensor application; catalytic performance depends on particle size and surface area [17,18,19].
Carbon-based materials are widely studied due to the advantages of structural chemical properties and electrical characteristics. Many researchers have proven that doping heteroatoms, such as nitrogen, sulfur, boron, and iodine, with carbon can enhance electrochemical performance. Among previously mentioned heteroatoms, nitrogen attached to carbon studies show excellent catalytic activity. Graphitic nitride-based nanocomposites are low cost, have low toxicity, are highly thermal durable, and can be applied in photocatalytic applications, biomedical applications, and hydrogen generation for the reasons mentioned previously. Thermal treatment with melamine, dicyanamide, and cyanamide can be applied in order to synthesize g-CN; melamine is prominent for having a large g-CN surface area. High electrical conductivity due to a lone pair of nitrogen atoms attached to carbon band gap of ~2.7 eV is beneficial to electrochemical sensor usage as carbon support with ErVO4. Furthermore, the overall detecting properties are improved by molecular-level interactions and size confinement effects as a result of the improved synergistic effects between g-CN and ErVO4 as well as the significantly altered active surface area of the ErVO4@g-CN nanocomposite [20,21,22,23,24,25,26,27,28,29,30,31].
In this research work, erbium vanadate attached to a graphitic carbon (ErVO4@g-CN) heterostructure was prepared by sonication, and optimization for the electrochemical detection of DMZ was carried out. The proposed ErVO4@g-CN/GCE-modified electrode enhanced the electrochemical behaviors on DMZ determination with a wide linear range and low detection limit. Furthermore, the ErVO4@g-CN/GCE-modified electrode revealed good selectivity, stability, repeatability, and reproducibility with a less than ±5% relative standard deviation. Furthermore, the practicability of the proposed sensor was applied to spiked milk samples. Finally, the above-discussed electrochemical sensor is a promising candidate for electrochemical monitoring of DMZ in real-world samples.
2. Experimental Section
2.1. Materials and Reagents
Erbium (III) nitrate pentahydrate (ErH10N3O14), ammonium metavanadate (NH4VO3 ≥ 99% purity), and urea (CH4N2O) were purchased from Sigma Aldrich, China and Showa Chemical Co. Ltd., Tokyo, Japan. Potassium chloride (KCl), Potassium ferricyanide (K3Fe(CN)6), and Potassium ferrocyanide (K4Fe (CN)6.3H2O) were obtained from Showa Chemical Co. Ltd., Tokyo, Japan. Sodium phosphate dibasic and sodium dihydrogen phosphate (Na2HPO4 and NaH2PO4) were utilized to prepare 0.1 M (pH 7) PBS (phosphate buffer solution). All the electrochemical experiments were carried out using 0.1 M PBS (pH 7) as the supporting electrolyte. Milk samples were brought in from a nearby convenience store. These samples were centrifuged and diluted before further experiment. Prepared samples were spiked with known concentrations to use for the detection of DMZ separately.
All analytical grade chemicals were used as received without further purification in these experiments. Details regarding materials characterization instruments are given in supporting information.
2.2. Intruments
XRD analysis was performed using a Bruker, Rigaku D/maxB, DMX-2200 instrument, Taiwan. The morphology and elemental mapping of sample was analyzed using a high-resolution (HR) transmission electron microscope (TEM) (JEOL JEM-2100F (HR)) operating at 200 kV and by energy-dispersive X-ray spectroscopy using EDAX AMETEK Inc., DigitalMicrograph® software. Fourier transform infrared spectra (FTIR) were tested using Nicolet 6700 (Thermo Fisher Scientific, USA). Electrochemical impedance spectroscopy and electrochemical measurements were carried out with Ω-metrohm auto lab (AUT51770, 100–240 V~75 VA50/60 Hz) instrument, Taiwan (Nova 2.1 software) and CHI 1211c electrochemical workstation (Taiwan). A glassy carbon electrode (surface area = 0.072 cm2), Ag/AgCl, and a Pt wire were the working, reference, and counter electrodes, respectively in this electrochemical analysis.
2.3. Synthesis of ErVO4
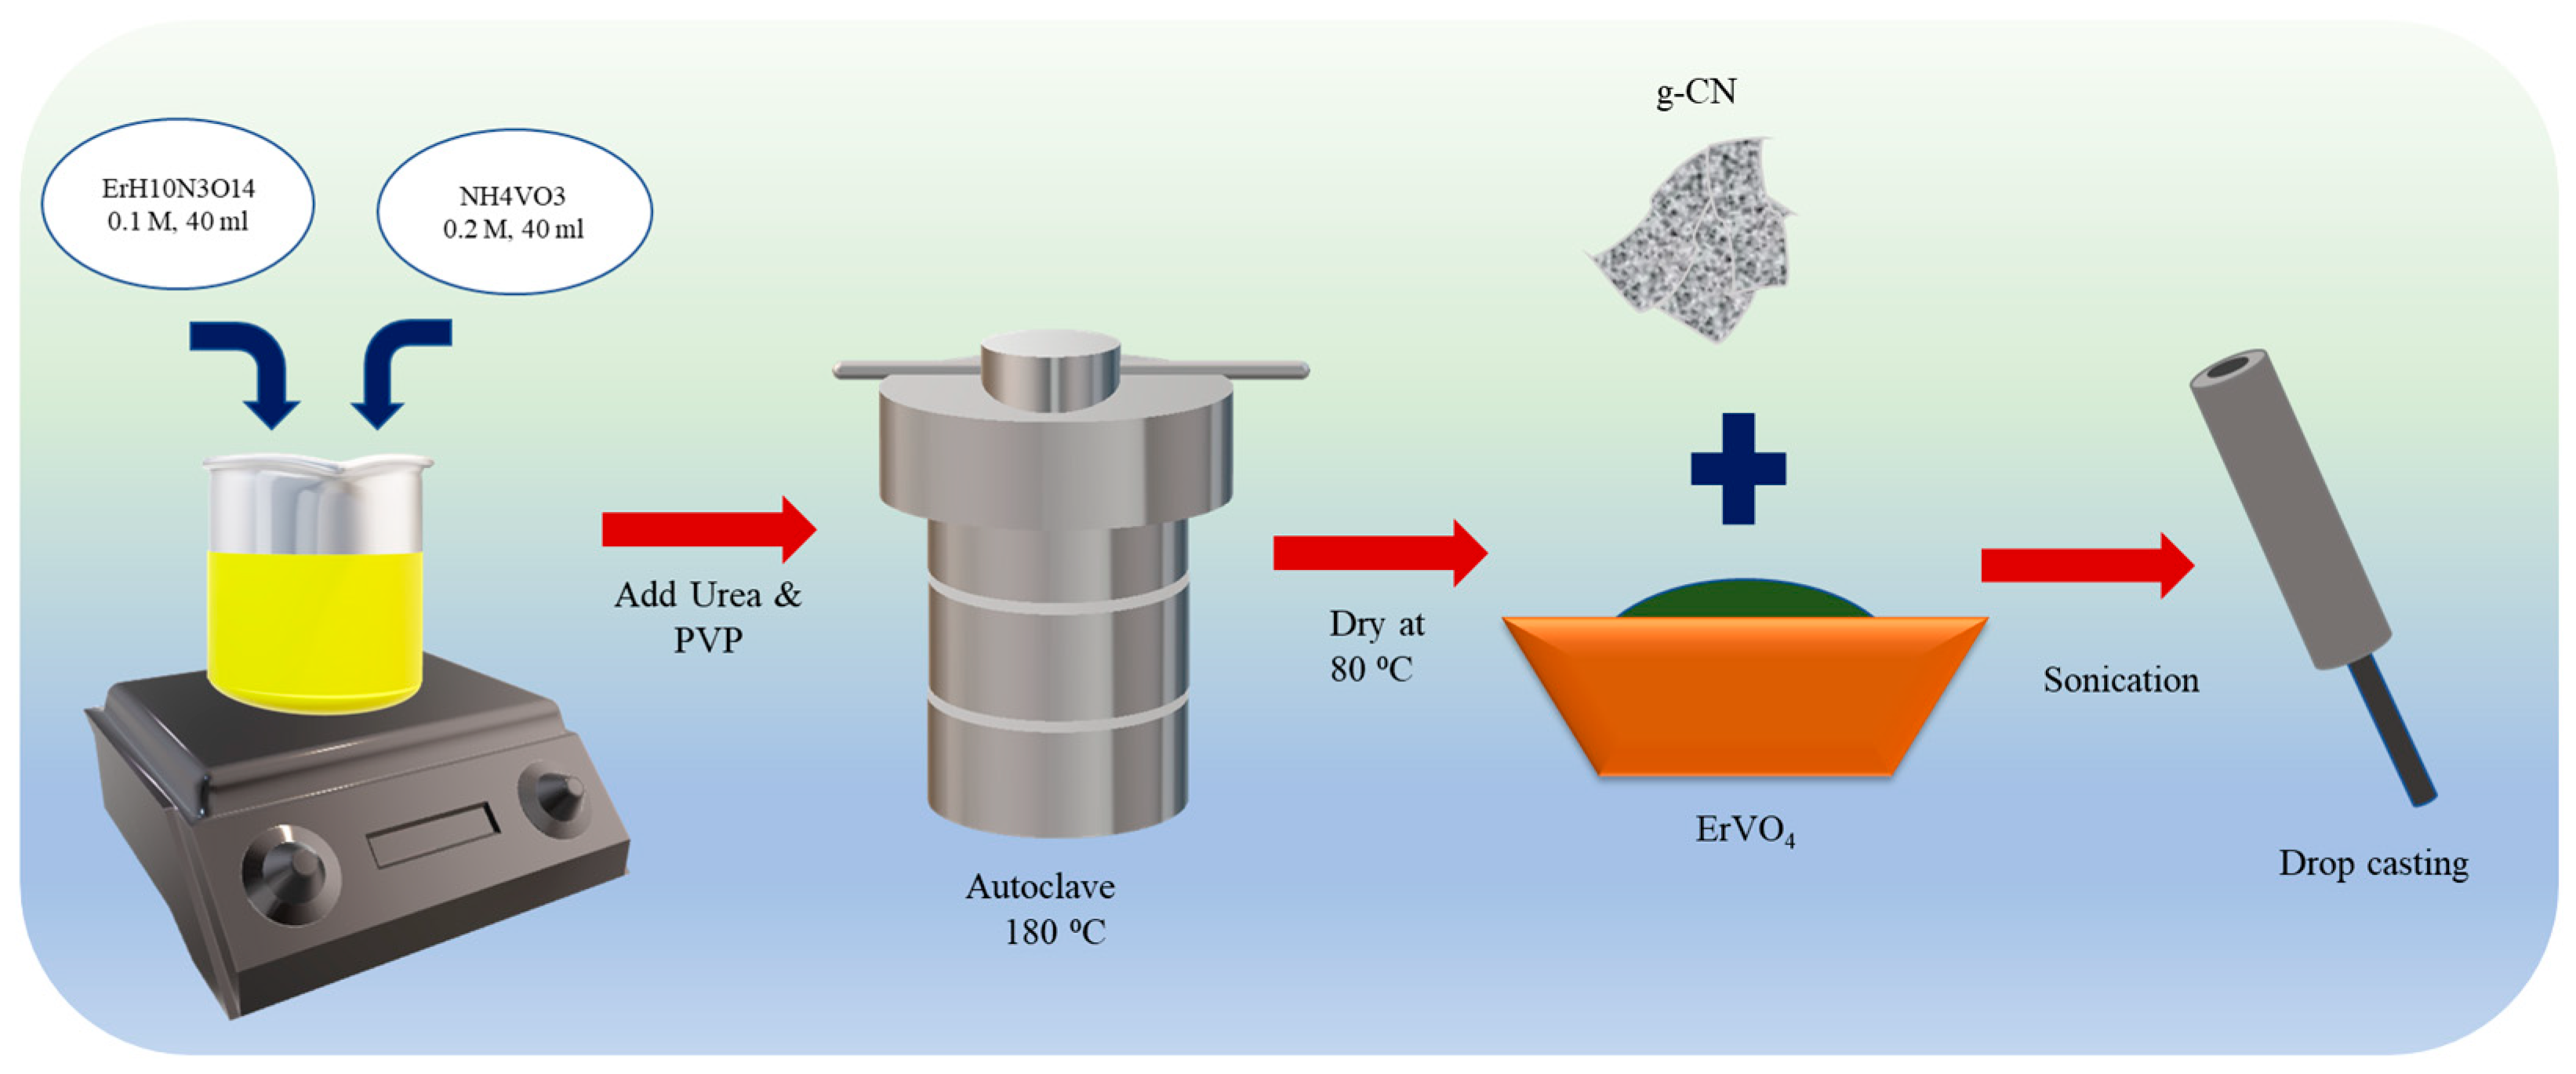
The hydrothermal process was followed in synthesizing ErVO4 in order to obtain nanocrystalline material. Erbium (III) nitrate pentahydrate (ErH10N3O14) and ammonium metavanadate (NH4VO3) were added in a stoichiometric ratio of 1:2 to the 40 mL of distilled water in a small beaker and then stirred. Next, 0.03 g of urea was added to the solution, and the resultant solution was transferred to a Teflon autoclave after 2 h of stirring and heated at 180 °C for 18 h. The resultant green-colored product was centrifuged with water/ethanol and washed several times. Finally, ErVO4 was dried at 80 °C for 24 h to be used for further experiments (Scheme 1).
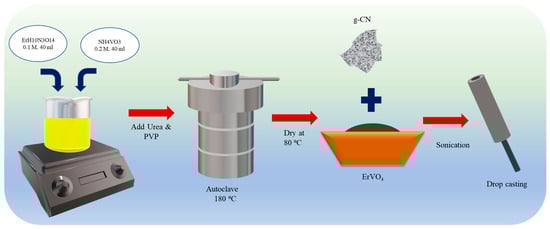
Scheme 1.
Preparation of ErVO4 nanoparticles.
2.4. Synthesis of Graphitic Carbon Nitride (g-CN)
The thermal treatment method was followed for preparation. A quantity of 5 g of g-CN of melamine was added to 25 mL distilled water and stirred at 90 °C, and the resultant precipitate of melamine–cyanuric acid (MCA) was dried until there was no moisture in the sample. Then, it was transferred to N2 inserted tubular furnace, and calcined at 550 °C for 3 h. Yellow powder was collected for the preparation of a composite [32].
2.5. Preparation of ErVO4@g-CN-Modified GCE
A composite was prepared by changing the weight ratio of ErVO4 and g-CN in H2O, followed by sonication for 15 min. For fabrication, the glassy carbon electrode (GCE) was polished using alumina slurry and cleaned with water/ethanol to remove contamination. Then, this well-prepared GCE was kept for drying at room temperature for further usage. The optimized composite (weight ratio of 3:1, ErVO4: g-CN in H2O) was coated onto the GCE using the drop-casting method, which was then kept in a laboratory oven at 60 °C for drying [33].
3. Results and Discussion
3.1. Characterization of ErVO4@g-CN
Synthesized g-CN, ErVO4, and ErVO4@g-CN were analyzed with an X-ray diffractometer (XRD) as shown in Figure 1a. Peaks in the XRD spectrum of crystalline ErVO4 exhibit diffraction patterns at 2 theta values of 25.07° as well as at values of 31.56°, 33.67°, 35.75°, 40.72°, 45.17°, 48.42°, 49.92°, 51.46°, 58.07°, 62.91°, 64.96°, 70.80°, and 74.52°, which correspond to the (200), (211), (112), (220), (202), (301), (103), (321), (312), (400), (420), (332), (204), (224), and (512) planes, respectively (JCPDS 01-072-0860). The g-CN shows an amorphous nature in XRD, which can be seen in the composite of the ErVO4@g-CN/GCE pattern near the 2θ values of 27°. These results confirm the formation of a crystalline ErVO4 nanocomposite.
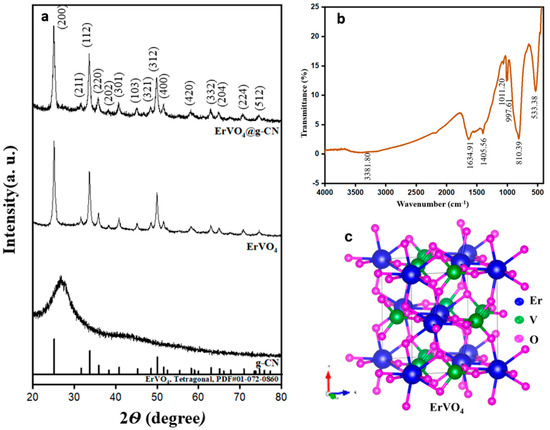
Figure 1.
(a) XRD of g-CN, ErVO4, and ErVO4@g-CN. (b) FTIR of ErVO4@g-CN. (c) Crystal structure of tetragonal ErVO4.
The ErVO4@g-CN compound was further analyzed with FTIR for bond formation details, as shown in Figure 1b. The sharp peak at 533.38 cm−1 describes the Er-O stretching vibrations, and the V-O is represented by the stretching vibrations at 997.61 cm−1. The peak at 1011.20 cm−1 corresponds to the stretching vibration of (V=O). The peaks at 1401.56 cm−1 and 1634.91 cm−1 are due to the stretching vibrations of (C-N) and C=N in g-CN. The stretching vibrations of (N-H) in −NH2 and =N−H can be defined from the broad peak at 3381.80 cm−1. The confirmed s-triazine ring of the bending vibration is at 810.39 cm−1 [34,35,36,37]. The tetragonal crystal system with a 141/amd space group of ErVO4 is shown in Figure 1c. Er3+ is attached to eight equivalent O2− atoms, and V5+ is bonded to four equivalent O2− atoms.
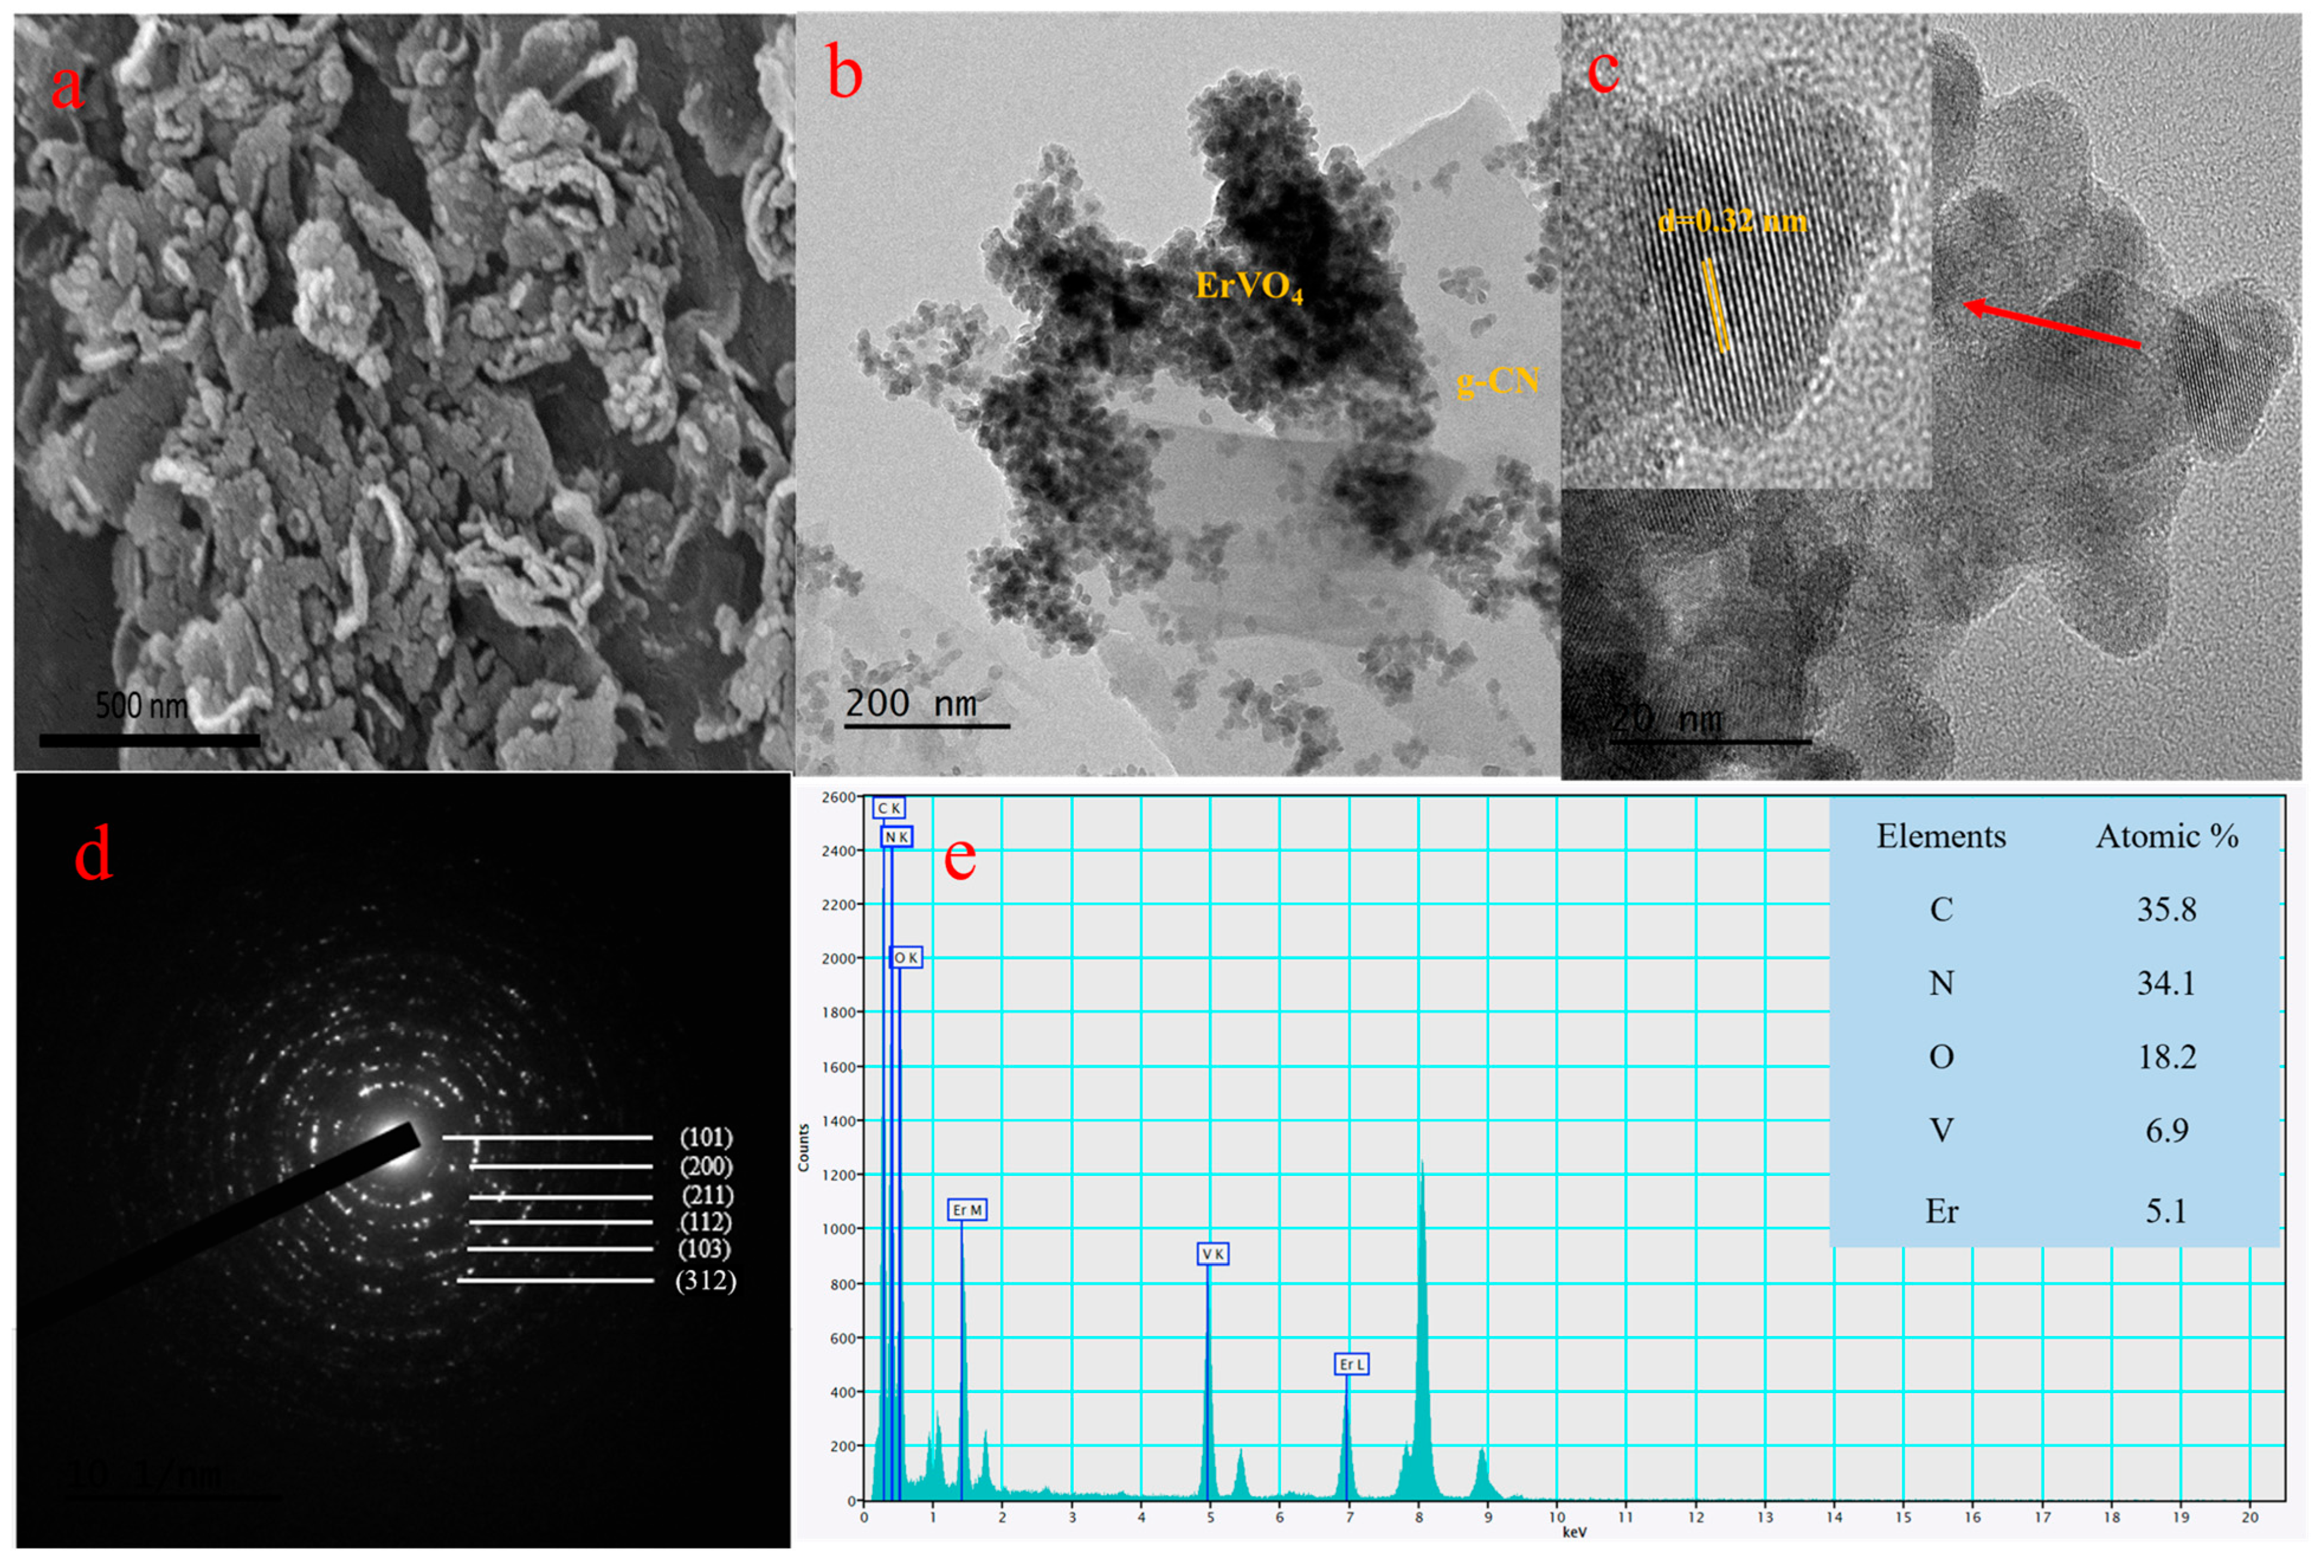
Coral patterns, such as the nano-sized ErVO4-attached g-CN, can be seen in the Figure 2a FE-SEM images. A further examined ErVO4@g-CN microstructure from the HR-TEM images is displayed in Figure 2b,c. Nano-sized ErVO4 can be seen on sheet-like g-CN from the HR-TEM images in Figure 2b; the lattice fringe with an interplanar spacing value of 0.32 nm corresponding to the (200) crystal plane of ErVO4 is exhibited in Figure 2c. Also, the SAED image of Figure 2d reflects the crystal plane from the XRD analysis. The elemental distribution of compounds from the EDS analysis was studied, and this analysis further proved the presence of elements. The atomic percentages of C, N, O, V, and Er are 35.8%, 34.1%, 18.2%, 6.9%, and 5.1%, respectively, as depicted in Figure 2e. Furthermore, EDS mapping from the TEM images confirms the presence of erbium, vanadium, oxygen, carbon, and nitrogen, as shown in Figure S2a–f.
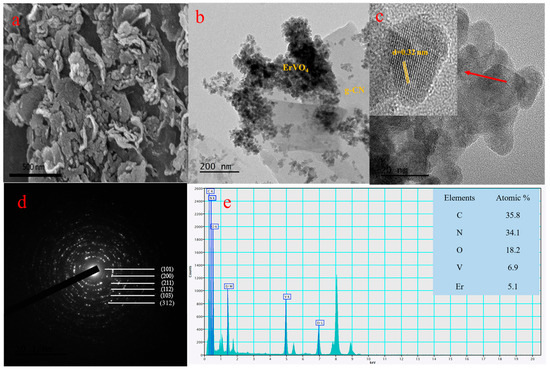
Figure 2.
(a) FE-SEM images of ErVO4@g-CN. (b) HR-TEM images of ErVO4@g-CN. (c) Lattice fringe pattern of ErVO4 and corresponding (d) SAED pattern of composite ErVO4@g-CN. (e) Atomic percentages from EDS analysis of C, N, O, V, and Er elements.
3.2. Electrochemical Analysis in [Fe (CN)6]3−/4− Solution
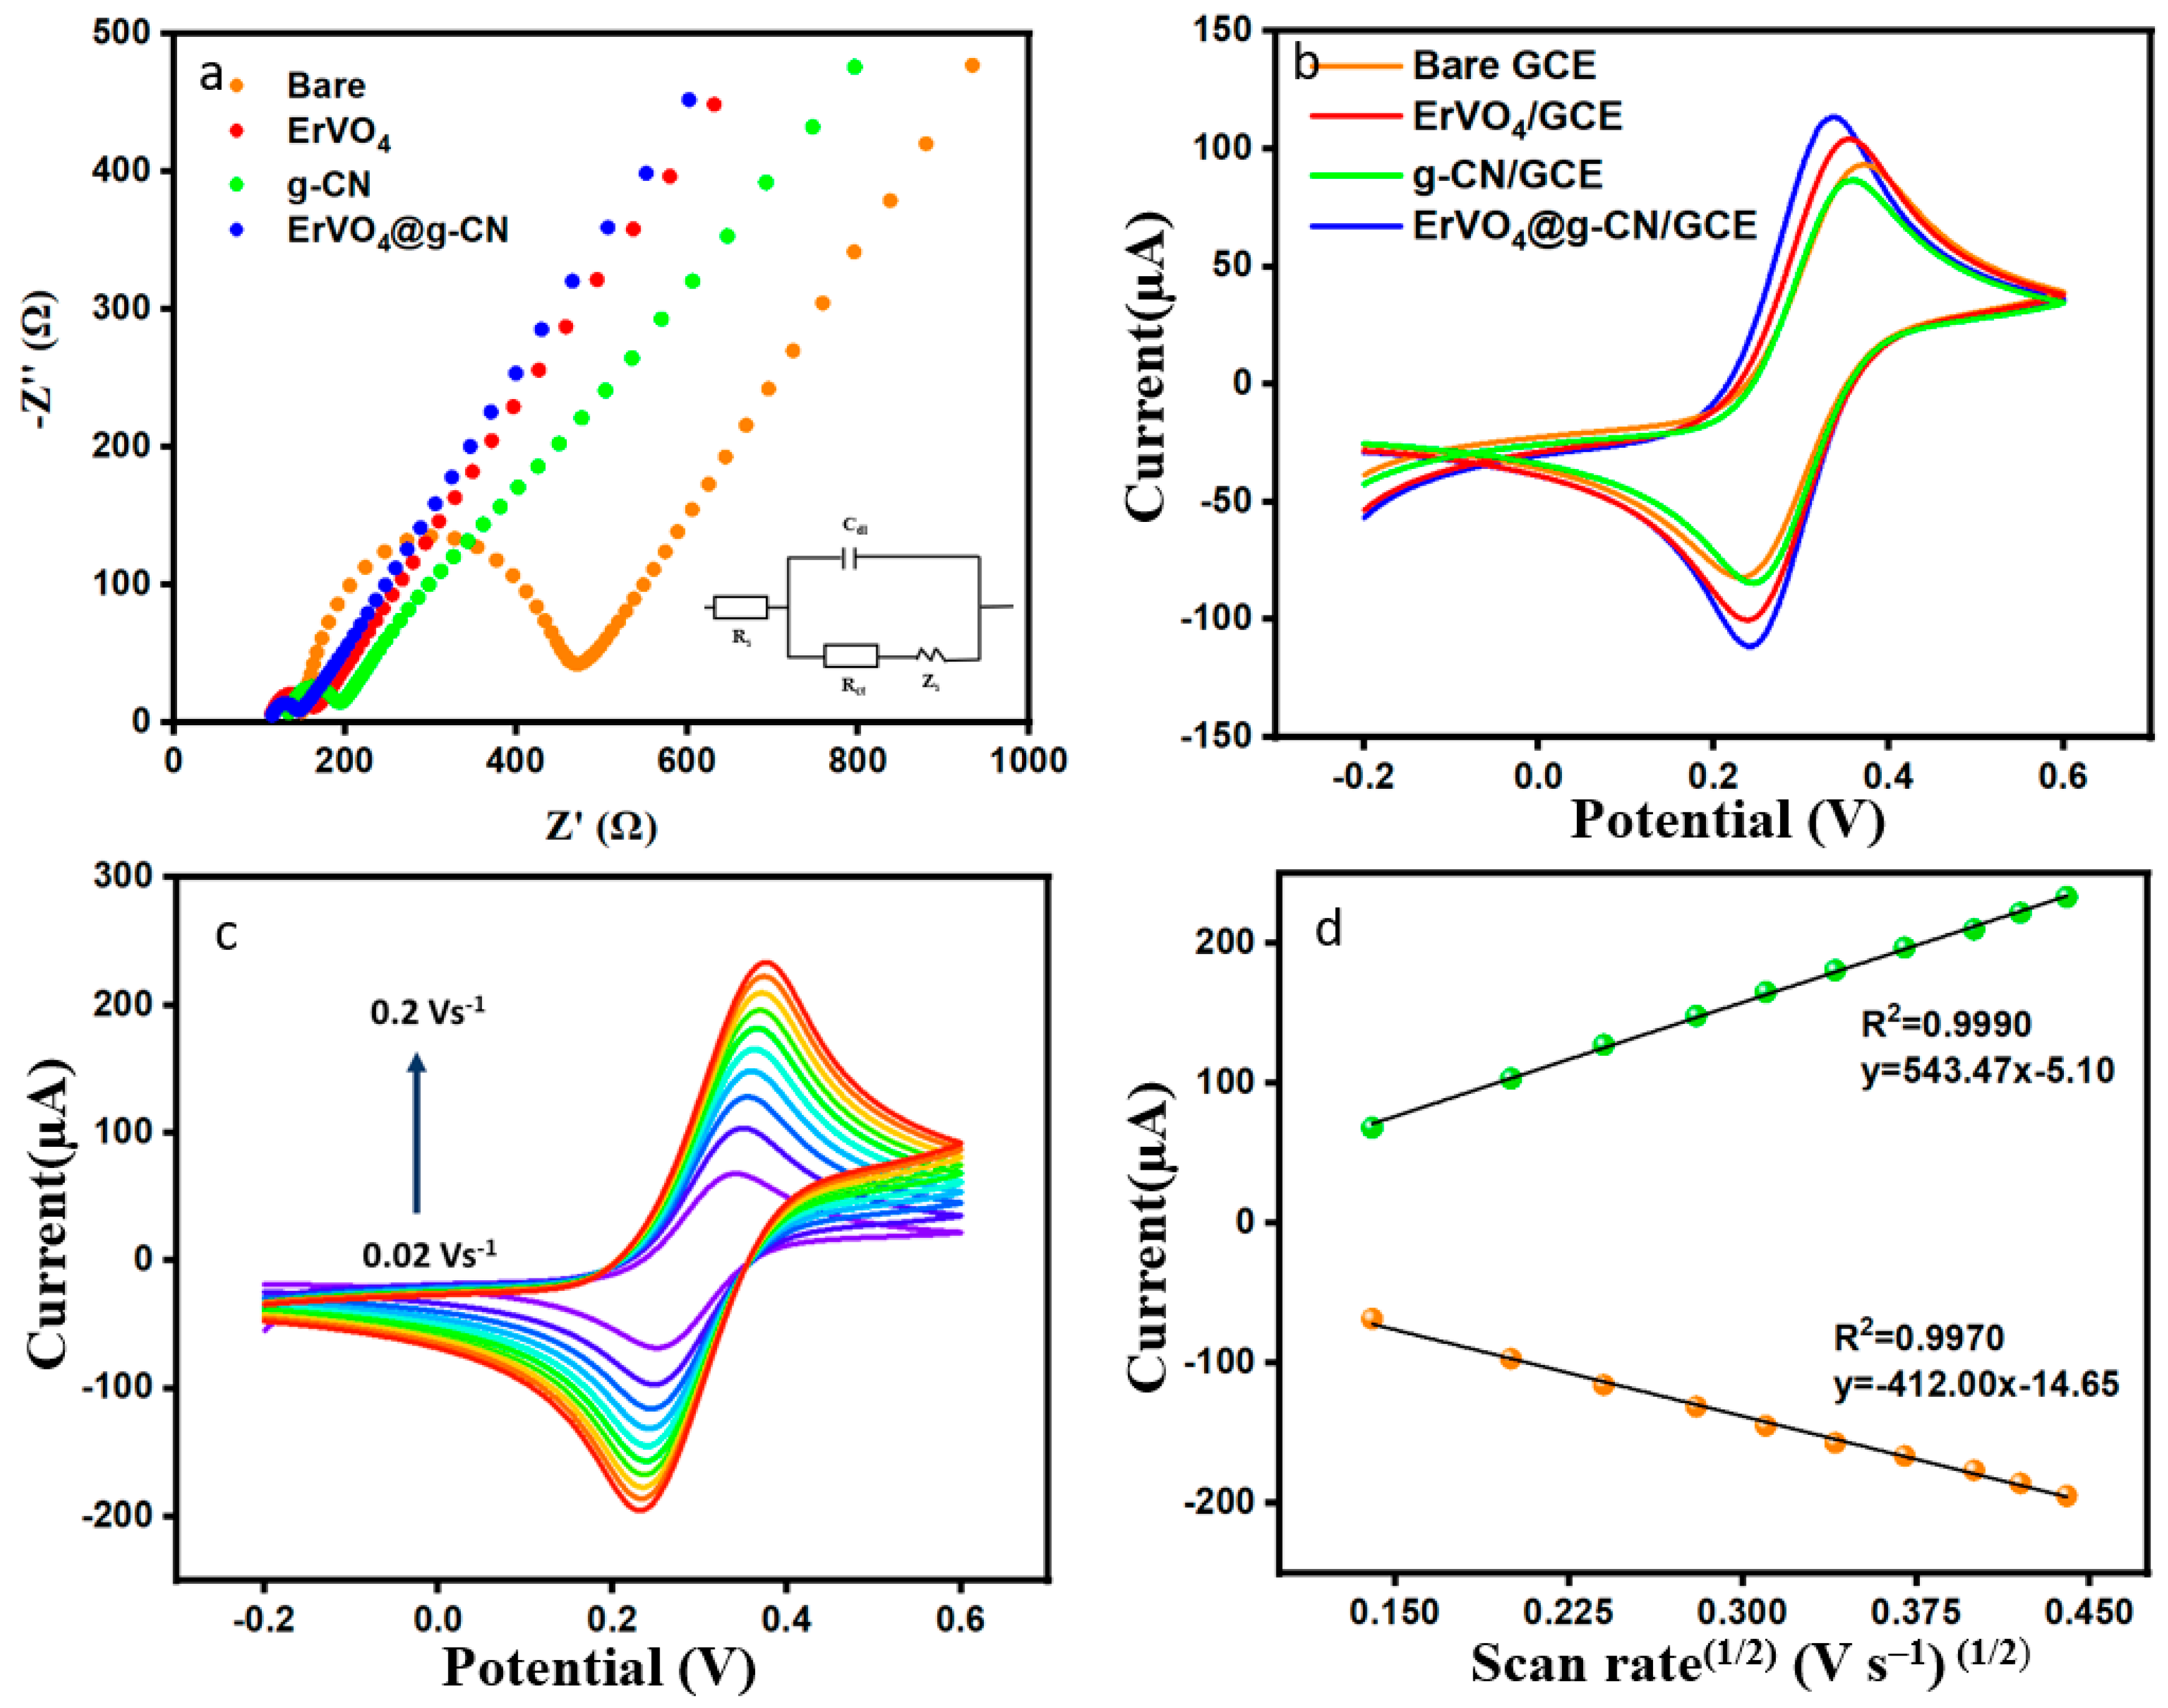
EIS can determine electrical responses between electrolytes, the interface of modified electrodes, and redox reactions, which helps us to further understand the system’s mass transfer, charge transfer, and diffusion processes. The Nyquist plot is designed with a real part (Z′) and an imaginary part (Z″). The Nyquist plot provides frequency-dependent resistance data equivalent to Randles’ circuit. Rs, Cdl, Rct, and Zw are the resistance of solution (supporting electrolyte), double layer capacitance at the electrode surface, charge transfer resistance, and the Warburg impedance in the circuit, as seen in Figure 3a. The prepared modified electrode was immersed in a solution of 0.1 M KCl containing 5.0 mmol/L of [Fe(CN)6]3−/4− with reference and counter electrodes. Resistance changes of bare GCE, ErVO4/GCE, g-CN/GCE, and ErVO4@g-CN/GCE are shown in Figure 3a, and the consecutive Rct values are 321.59 Ω, 50.31 Ω, 58.90 Ω, and 32.42 Ω. As can be seen, the composite-coated modified electrode has the smallest semicircle due to the increase in electron transfer at the electrode surface with nano ErVO4@g-CN.
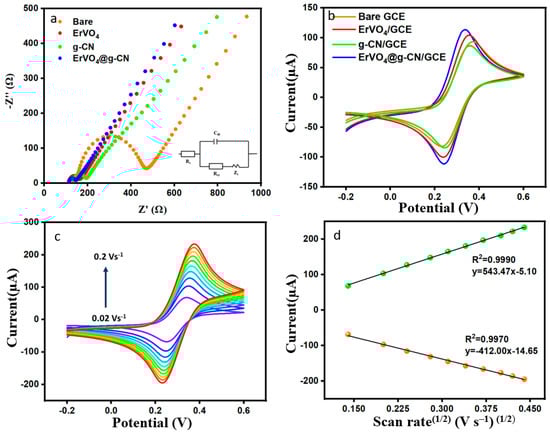
Figure 3.
(a) EIS and (b) CV measurements of bare GCE, ErVO4/GCE, g-CN/GCE, and ErVO4@g-CN/GCE. (c) Different scan rates for ErVO4@g-CN/GCE in the presence of 5 mM [Fe(CN)6]3−/4− and 0.1 M KCl and (d) Corresponding plot of current vs. square root of scan rate.
Performance of the electrochemical process was continued in order to optimize the modified electrode. Like the EIS, the experiment was carried out in 0.1 M KCl containing 5.0 mmol/L [Fe (CN)6]3−/4− at a scan rate of 0.05 V s−1 in potential between −0.2 and 0.6 V. As can be seen in Figure 3b, the anodic peak currents of bare GCE, ErVO4/GCE, g-CN/GCE, and ErVO4@g-CN/GCE were given consecutively at 92.87, 104.16, 85.65, and 114.34 µA, and the lowest potential difference of 0.09 V (peak separation, ∆Ep = Ep,a − Ep,c) was obtained for ErVO4@g-CN/GCE. Figure 3c shows the CV in different scan rates obtained from 0.02 to 0.2 V s−1 solution with 5 mM [Fe (CN)6]3−/4− in 0.1 M KCl. The peak currents increase with an increasing scan rate. Figure 3d displays a corresponding linear graph of Ip vs. (scan rate)½. The good linearity of the graph implies the diffusion control process of the electrochemical reaction. The Randles–Sevcik equation (Equation (1)) is used to calculate the electrochemically active surface area (EASA) of the electrode [38].
where,
Ip = 2.69 × 10n3/2AD1/2Cʋ1/2
Ip = Redox peak current
n = Number of electrons participating in the reaction (n = 1)
A = EASA
D = Diffusion coefficient (7.6 × 10⁻⁶ cm2 s−1)
C = Concentration of [Fe (CN)6]3−/4− (0.005 M)
ʋ = Scan rate (0.05 V s−1)
A better reversible reaction can be obtained in the presence of the ErVO4@g-CN composite, and this modified electrode can contribute an electrochemically active surface area (EASA) of 0.2 cm2 to the system.
3.3. Electrochemical Analysis
3.3.1. Electrochemical Behaviors toward DMZ Detection
Dimetridazole (DMZ) is a derivative of the nitroimidazole drug that treats bacterial infections in veterinary medicine. Thus, the need for a sensitive and effective sensor for the detection of drugs which cause allergies is essential. Carbon-based composite modified electrodes have received more attention in recent years due to their high sensitivity and selectivity. Before carrying out the experiment in the presence of DMZ, the current responses for bare GCE, ErVO4/GCE, g-CN/GCE, and ErVO4@g-CN/GCE in 0.1 M PBS (pH = 7) were analyzed (Figure S1), followed by the electrochemical responses for all electrodes toward 200 µM of DMZ and of PBS (pH 7.0) by cyclic voltammetry with a scan rate of 0.05 V s−1, as shown in Figure 4a,b. The reduction peak potential of modified ErVO4@g-CN/GCE had a highest recorded value (20.89 µA) at −0.68 V, producing a better-defined peak than the bare electrode. The efficiency of a material-coated electrode was further examined with different coating of ErVO4@g-CN/GCE (2, 4, 6, 8, and 10 µL), by dropcasting method as shown in Figure 4c,d; the 8 µL-coated electrode was modified for further electrochemical studies.
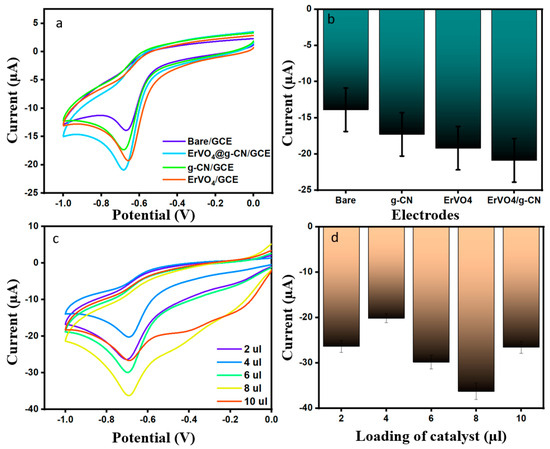
Figure 4.
(a,b) CV profiles of bare GCE, ErVO4 GCE, g-CN GCE, and ErVO4@g-CN-modified GCEs in the presence of 200 μM DMZ at a scan rate of 50 mV s−1 in 0.1 M PBS (pH 7) and corresponding bar graph (c,d) Current changes in different catalyst amounts in the presence of 200 µM DMZ and 0.1 M PBS (pH 7) and corresponding bar graph.
3.3.2. Effect of pH
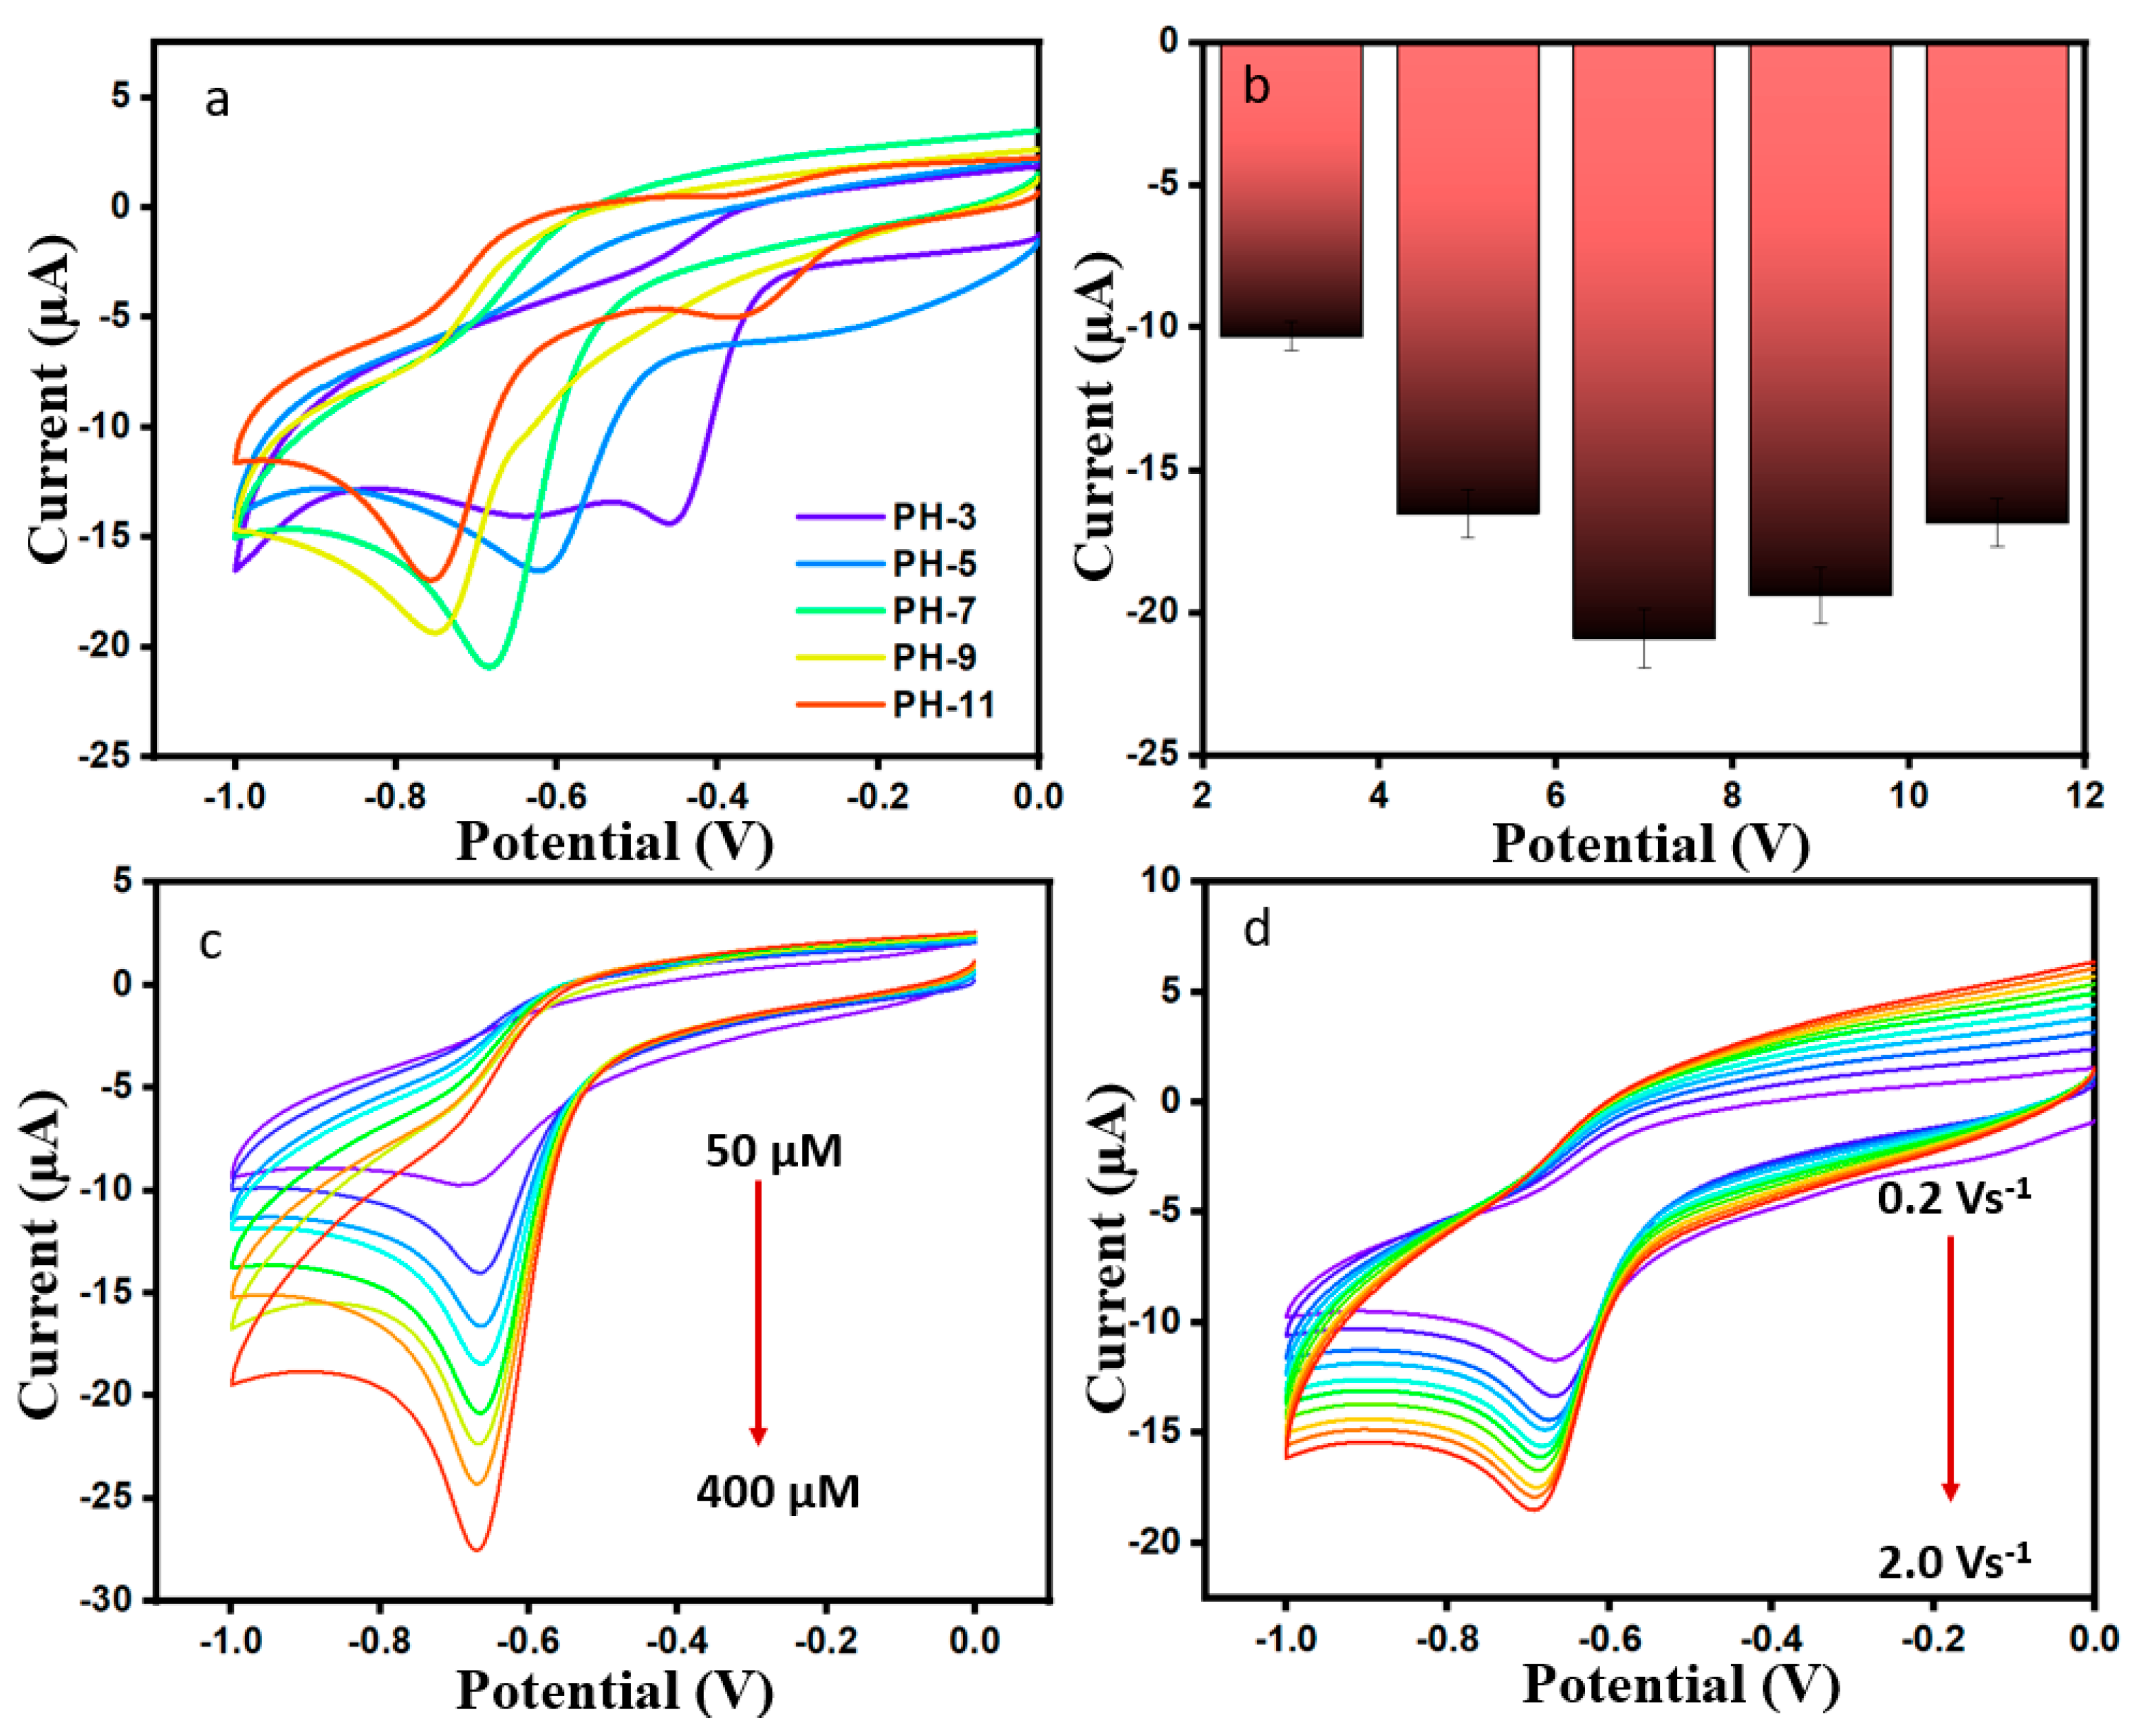
The influence of different pH values (3, 5, 7, 9, and 11) on current was investigated in the presence of 200 µM DMZ (scan rate 50 mVs−1) for ErVO4@g-CN/GCE. It can be seen in Figure 5a,b that Ip increases from pH 3 to 7 and decreases from pH 7 to 11. The data show that Epc was shifted toward a negative potential with an increasing pH (7–11) due to low current density hydrogen ions. It is shown that a maximum reduction current of −20.91 µA was obtained when pH 7 was used in the medium, as indicated by the equal numbers of proton and electron transfers in the reaction; for this reason, pH 7 can be used for any further analyses [39].
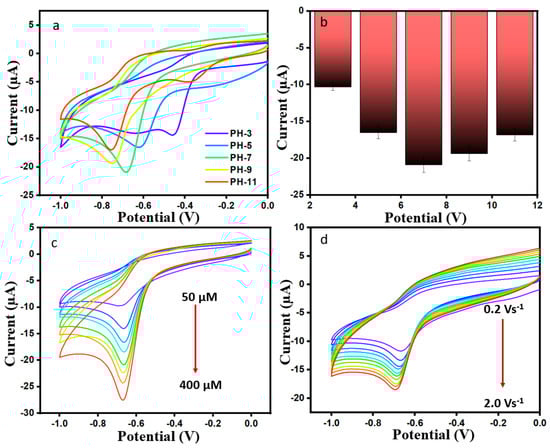
Figure 5.
(a,b) CV curves of varying pH (3–11) for ErVO4@g-CN/GCE. (c) Current responses for Er-VO4@g-CN/GCE at different concentrations of DMZ and corresponding linear plot. (d) CV curves of different scan rates in 200 µM DMZ and 0.1 M PBS and corresponding calibration plot for current vs. different (scan rate)1/2.
3.3.3. Effect of Concentration and Scan Rate
By changing concentration, performance can be optimized for further electrochemical performance. Figure 5c shows the cyclic voltammogram for a modified ErVO4@g-CN/GCE electrode current response with changes in the concentration of 50 to 400 µM of DMZ in 0.1 M PBS with pH 7 at a scan rate of 50 mV s−1. Current values increased linearly with increasing DMZ concentration as shown in Figure S3a. The linear relation of current vs. concentration is I = −0.04649C − 8.72 (R2 = 0.9831). Also, a reduction peak current was studied for different scan rates from 20 to 200 mV s−1, as shown in Figure 5d. Negative current peaks were linearly increased when analyzing the increasing scan rates, indicating a faster charge transfer. A linear regression equation of I = −0.6807C − 8.833 with R2 = 0.9941 in current vs square root of scan rate graph in Figure S3b, conveys that DMZ is under a diffusion-controlled process.
3.3.4. Differential Pulse Voltammetry (DPV) Study for Determination of DMZ and Real Sample Analysis
The DPV method has a higher accuracy of sensitivity for electrochemically active substances. This experiment used a 0.1 M PBS in potential between −0.1 V and 0 V, a pulse amplitude of 0.05 V, a pulse time of 0.5 s, and a scan rate of 50 mV s−1 throughout the addition of DMZ from 0.5 µM to 863.5 µM. Figure 6a,b show the DPV performance and corresponding calibration plot. Ipa increases linearly, and the linear regression equation is y = −0.0195 x −4.5369 (R2 = 0.9931). The limit of detection and sensitivity are calculated from using Equations (2) and (3) below [40]. Here, calculated values of the LOD and sensitivity are 0.001 µM and 2.523 µA µM−1 cm2, respectively.
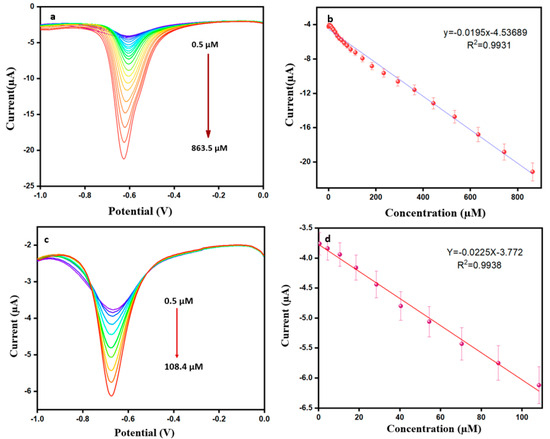
Figure 6.
(a) DPV response for modified ErVO4@g-CN/GCE toward DMZ (in pH = 7 PBS). (b) Corresponding calibration plot of current vs. concentration. (c) DPV response for milk sample toward ErVO4@g-CN/GCE. (d) Corresponding calibration plot of current vs concentration for milk sample.
The modified electrode of ErVO4@g-CN/GCE was applied in real samples for the determination of DMZ. Milk was collected from a shopping mart for the DPV analysis. Then, 10 µL of milk was injected into 10 mL of PBS and centrifuged; a known amount of 0.001 M of DMZ was then added. For further experiments, an analysis of the solution was carried out using previously optimized conditions. The resultant current response and calibration plot are shown in Figure 6c,d. The response obtained from the DPV shows that this system can detect DMZ in these real samples, providing good results at potential at −0.683 V; the LOD value was 0.008 µM for the real sample.
3.3.5. Selectivity, Reproducibility, Repeatability and Stability
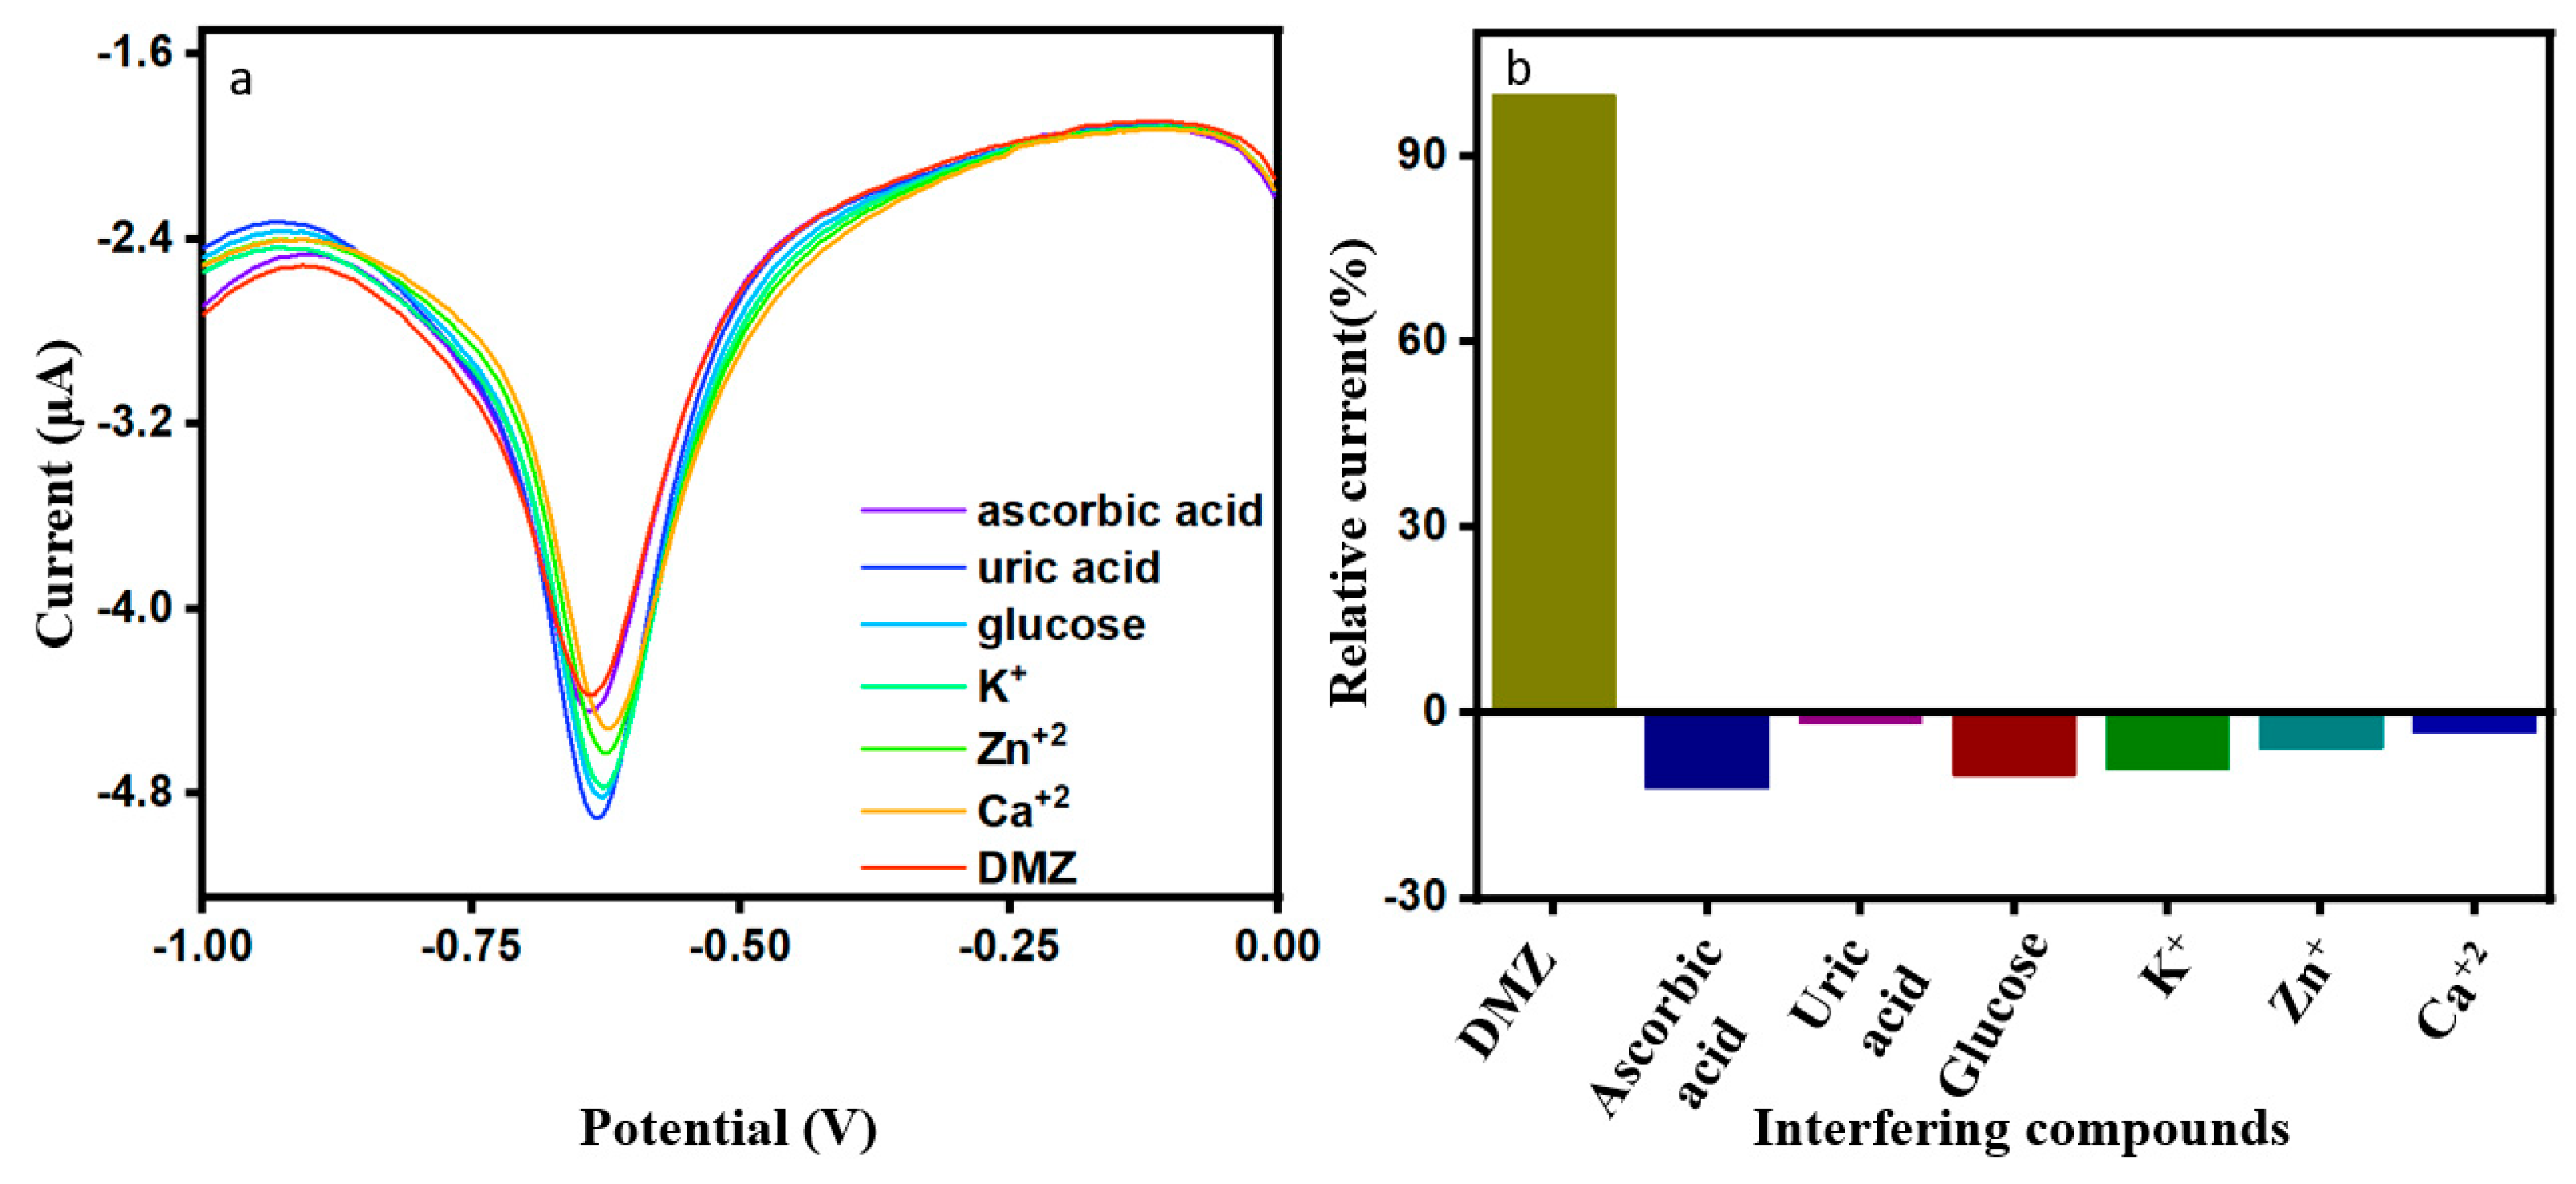
We studied the interference of co-existing substances in the DMZ sample and inspected for selectivity of the modified electrode. Current response to the addition of interference compounds is presented in Figure 7a as well as in the relative bar diagram of Figure 7b. The studies for the ErVO4@g-CN/GCE electrode was performed by adding 20 µM of ascorbic acid, uric acid, glucose, K+, Zn+2, and Ca+2 each in the presence of 0.01 M DMZ. It was observed that the ErVO4@g-CN/GCE-modified electrode showed good current response toward DMZ and had no significant interferences from co-interfering compounds.
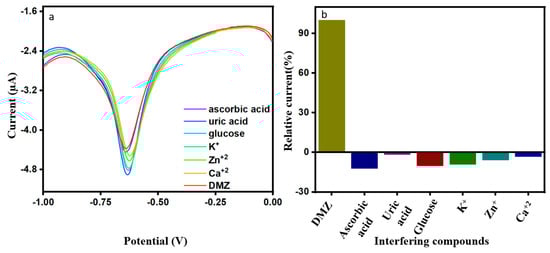
Figure 7.
(a,b) DPV response of 20 µM of DMZ in the presence of co-interfering compounds; and the corresponding bar graph.
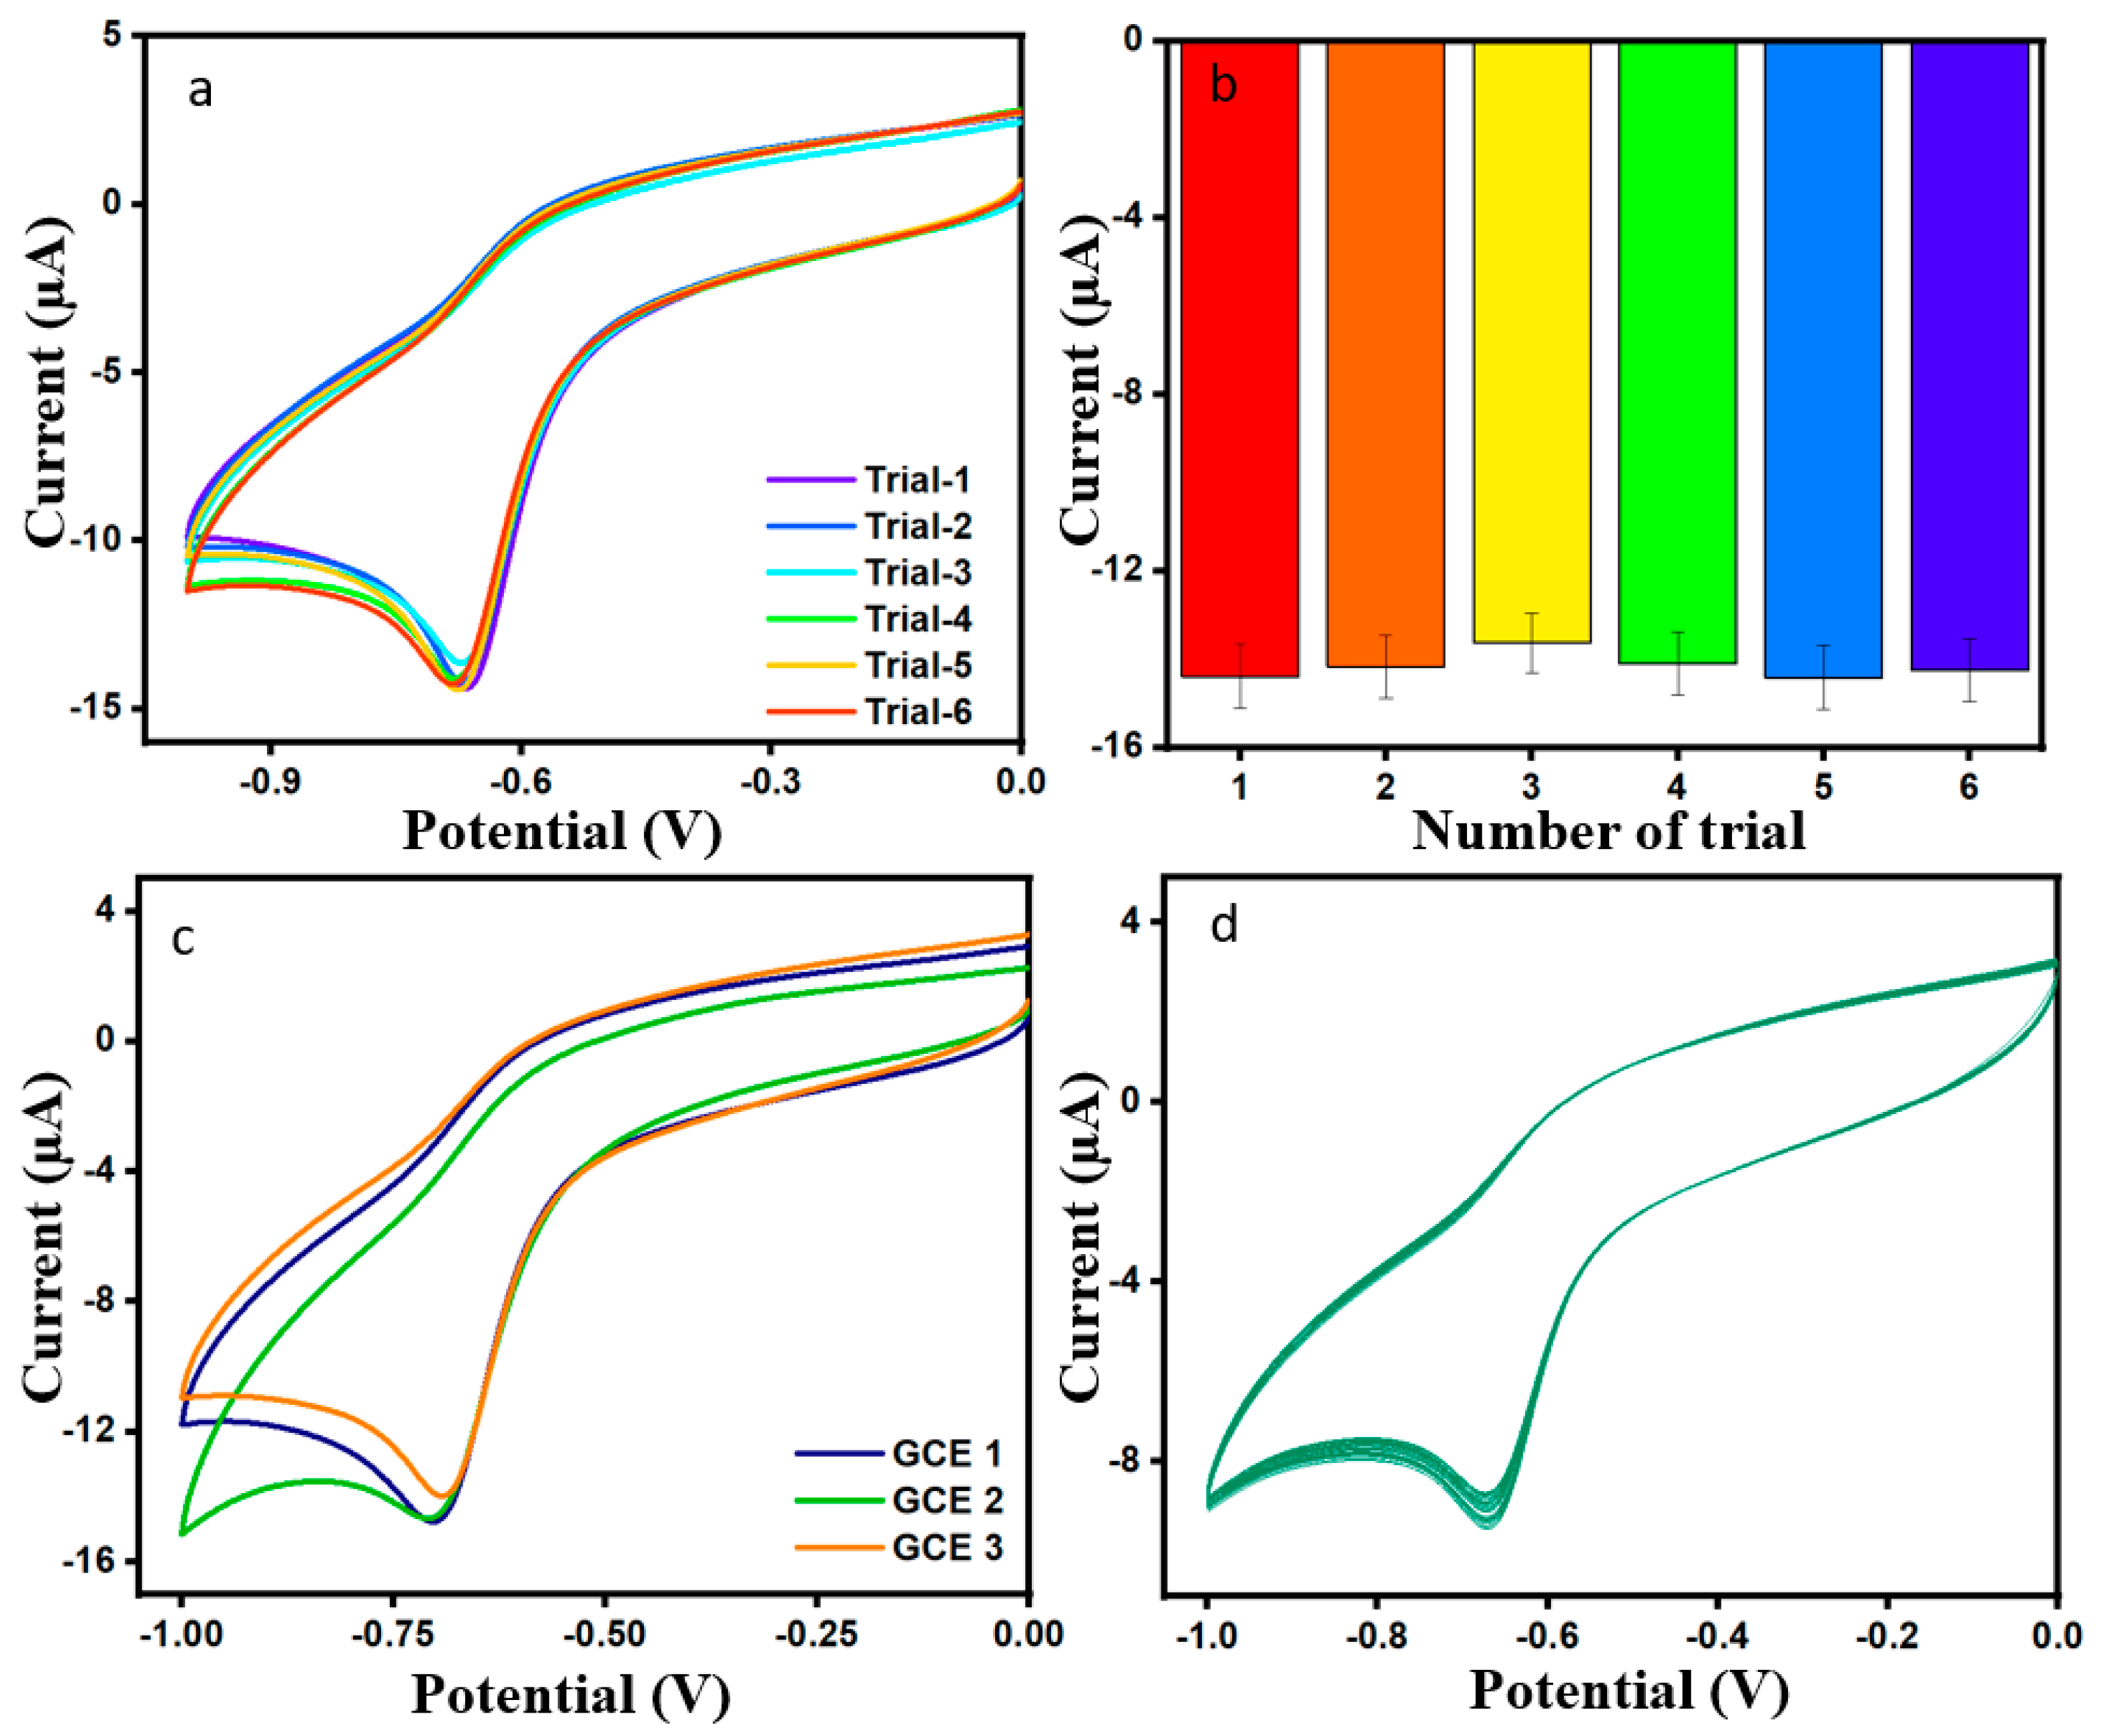
The experiment of repeatability and the respective bar diagram for the modified electrode in DMZ was used six times, as can be seen in Figure 8a,b, and in the same condition as before; the RSD value for the six trials is 2.01%. The reproducibility of ErVO4@g-CN/GCE was investigated for three different electrodes in 0.01 M of 100 µL DMZ, as shown in Figure 8c; the corresponding bar diagram is shown in Figure S4. The above-mentioned test gave a relative standard deviation (RSD) of 2.97% and, thereby, along with the obtained RSD values of reproducibility and repeatability, indicates a good performance for the DMZ sensor. Furthermore, the stability of DMZ was evaluated for 60 cycles in the presence of 0.01 M of DMZ and pH 7 phosphate buffer solution; Figure 8d displays the result. The current response of modified ErVO4@g-CN/GCE has good stability in the DMZ environment [41,42].

Figure 8.
(a,b) Plot of repeatability in the presence of DMZ 100 µM and correlated bar graph. (c) CV plot of reproducibility in the presence of DMZ 100 µL and pH = 7 PBS. (d) CV plot of cycle stability for 60 cycles in the presence of DMZ (100 µM) and pH = 7 PBS.
4. Conclusions
In this research study, we successfully developed nano-sized ErVO4 via the hydrothermal method for a modified ErVO4@g-CN/GCE-based electrochemical sensor for detecting DMZ. The composite was examined with XRD, EDS, and HR-TEM, and the confirmed crystal structure was discussed. The rare earth metal vanadate with a two-dimensional structure modified electrode contributed modified electrodes that revealed excellent electrocatalytic activity with respect to individual and bare electrodes. Furthermore, ErVO4@g-CN/GCE resulted in a lower limit of detection of 0.001 µM toward DMZ in the wide working range of 0.5 to 863.5 µM by the differential pulse voltammetry method. This ErVO4@g-CN-coated modified electrode system reported a highly active surface area, high conductivity, and less charge transfer resistance. Furthermore, the proposed ErVO4@g-CN/GCE sensor showed good selectivity toward DMZ compared with six different interfering compounds (ascorbic acid, uric acid, glucose, K+, Zn+2, and Ca+2) from DPV electrochemical analysis, and good cycle stability was also observed for 60 cycles. Finally, it was found that the above-discussed electrochemical sensor shows promise in being able to recognize DMZ in actual samples.
Supplementary Materials
The following supporting information can be downloaded at: https://www.mdpi.com/article/10.3390/s24061808/s1, Chemicals and reagents; Figure S1. CV measurements of bare GCE, ErVO4/GCE, g-CN/GCE, and ErVO4@g-CN/GCE of composite in PBS (pH = 7); Figure S2. (a) HR-TEM image of ErVO4@g-CN composite. (b–f) Elemental mapping of Er, V, O, C, and N; Figure S3. (a) Corresponding linear plot (for Figure 5c) of current vs concentration. (b) corresponding calibration plot for (Figure 5d) of current vs. different (scan rate)1/2; Figure S4. Corresponding bar graph for reproducibility in the presence of DMZ 100 µL and pH = 7 PBS.
Author Contributions
U.G.A.S.: Conceptualization, Writing—original draft, Writing—review & editing, Methodology, Data curation, Visualization, Formal Analysis; S.-F.W.: Supervision, Funding acquisition, Investigation, Validation, Resources. All authors have read and agreed to the published version of the manuscript.
Funding
This research received no external funding.
Institutional Review Board Statement
Not applicable.
Informed Consent Statement
Informed consent was obtained from all subjects involved in the study.
Data Availability Statement
Data is contained within the article or Supplementary Materials.
Acknowledgments
This work was financially supported by the National Taipei University of Technology (NTUT).
Conflicts of Interest
The authors declare no conflicts of interest.
References
- Connolly, L.; Thompson, C.S.; Haughey, S.A.; Traynor, I.M.; Tittlemeier, S.; Elliott, C.T. The development of a multi-nitroimidazole residue analysis assay by optical biosensor via a proof of concept project to develop and assess a prototype test kit. Anal. Chim. Acta 2007, 598, 155–161. [Google Scholar] [CrossRef] [PubMed]
- Hu, C.; Deng, J.; Xiao, X.; Zhan, X.; Huang, K.; Xiao, N.; Ju, S. Determination of dimetridazole using carbon paste electrode modified with aluminum doped surface molecularly imprinted siloxane. Electrochim. Acta 2015, 158, 298–305. [Google Scholar] [CrossRef]
- Available online: https://www.obrnutafaza.hr/pdf/uct/aplikacije/Veterinary.pdf (accessed on 26 February 2024).
- Quinlivan, P.J.; Upmacis, R.K. Crystal structure of di-μ-chlorido-bis [chloridobis (1, 2-dimethyl-5-nitro-1H-imidazole-κN3) copper (II)] acetonitrile disolvate. Acta Crystallogr. Sect. E Crystallogr. Commun. 2016, 72, 1633–1636. [Google Scholar] [CrossRef] [PubMed]
- Zoubir, J.; Elkhotfi, Y.; Radaa, C.; Bougdour, N.; Idlahcen, A.; Bakas, I.; Assabbane, A. Electrocatalytic detection of dimetridazole using an electrochemical sensor Ag@ CPE. Analytical application. Milk, tomato juice and human urine. Sens. Int. 2021, 2, 100105. [Google Scholar] [CrossRef]
- Granja, R.H.; Nino, A.M.; Reche, K.V.; Giannotti, F.M.; de Lima, A.C.; Wanschel, A.C.; Salerno, A.G. Determination and confirmation of metronidazole, dimetridazole, ronidazole and their metabolites in bovine muscle by LC-MS/MS. Food Addit. Contam. Part A 2013, 30, 970–976. [Google Scholar] [CrossRef]
- Lin, Y.; Su, Y.; Liao, X.; Yang, N.; Yang, X.; Choi, M.M. Determination of five nitroimidazole residues in artificial porcine muscle tissue samples by capillary electrophoresis. Talanta 2012, 88, 646–652. [Google Scholar] [CrossRef]
- Guth, U.; Vonau, W.; Zosel, J. Recent developments in electrochemical sensor application and technology—A review. Meas. Sci. Technol. 2009, 20, 042002. [Google Scholar] [CrossRef]
- Tian, J.; Xu, J.; Zhu, F.; Lu, T.; Su, C.; Ouyang, G. Application of nanomaterials in sample preparation. J. Chromatogr. A 2013, 1300, 2–16. [Google Scholar] [CrossRef]
- Oka, Y.; Yao, T.; Yamamoto, N. Hydrothermal synthesis of lanthanum vanadates: Synthesis and crystal structures of zircon-type LaVO4 and a new compound LaV3O9. J. Solid State Chem. 2000, 152, 486–491. [Google Scholar] [CrossRef]
- Polman, A. Erbium as a probe of everything? Phys. B Condens. Matter 2001, 300, 78–90. [Google Scholar] [CrossRef]
- Cortese, A.J.; Smith, M.D.; Zur Loye, H.C. Crystal growth, structure, and properties, of a new oxovanadium (IV) phosphate material, [H2en]4 [V7P8O35 (OH)6 (H2O)]· 3H2O prepared via a mild one step hydrothermal route. Solid State Sci. 2016, 60, 59–64. [Google Scholar] [CrossRef]
- Liu, X.; He, J.-H.; Sakthivel, R.; Chung, R.-J. Rare earth erbium molybdate nanoflakes decorated functionalized carbon nanofibers: An affordable and potential catalytic platform for the electrooxidation of phenothiazine. Electrochim. Acta 2020, 358, 136885. [Google Scholar] [CrossRef]
- Selvan, R.K.; Gedanken, A.; Anilkumar, P.; Manikandan, G.; Karunakaran, C. Synthesis and characterization of rare earth orthovanadate (RVO4; R = La, Ce, Nd, Sm, Eu & Gd) nanorods/nanocrystals/Nanospindles by a facile sonochemical method and their catalytic properties. J. Clust. Sci. 2008, 20, 291–305. [Google Scholar] [CrossRef]
- Devaraju, M.K.; Honma, I. Hydrothermal and solvothermal process towards development of LiMPO4 (M= Fe, Mn) nanomaterials for lithium-ion batteries. Adv. Energy Mater. 2012, 2, 284–297. [Google Scholar] [CrossRef]
- Gan, Y.X.; Jayatissa, A.H.; Yu, Z.; Chen, X.; Li, M. Hydrothermal synthesis of nanomaterials. J. Nanomater. 2020, 2020, 8917013. [Google Scholar] [CrossRef]
- Kogularasu, S.; Lee, Y.Y.; Sriram, B.; Wang, S.F.; George, M.; Chang-Chien, G.P.; Sheu, J.K. Unlocking Catalytic Potential: Exploring the Impact of Thermal Treatment on Enhanced Electrocatalysis of Nanomaterials. Angew. Chem. 2023, 136, e202311806. [Google Scholar] [CrossRef]
- Huang, X.; Zhang, G.; Dong, F.; Tang, Z. The remarkable promotional effect of Sn on CeVO4 catalyst for wide temperature NH3-SCR process by citric acid-assisted solvothermal synthesis and post-hydrothermal treatment. Catal. Sci. Technol. 2018, 8, 5604–5615. [Google Scholar] [CrossRef]
- Kesavan, G.; Vinothkumar, V.; Chen, S.-M.; Thangadurai, T.D. Construction of metal-free oxygen-doped graphitic carbon nitride as an electrochemical sensing platform for determination of antimicrobial drug metronidazole. Appl. Surf. Sci. 2021, 556, 149814. [Google Scholar] [CrossRef]
- Sharma, T.S.K.; Ganguly, A.; Santhan, A.; Hwa, K.-Y. Gadolinium oxide nanorods anchored on g-C3N4 nanosheets for dual-mode electrochemical determination of clioquinol in real-time analysis. ACS Appl. Nano Mater. 2022, 5, 5208–5222. [Google Scholar] [CrossRef]
- Bharathi, P.; Wang, S.-F. Synchronous activation of praseodymium vanadate/graphitic carbon nitride nanocomposite: A promising electrode material for detection of flavonoid–Quercetin. Food Chem. 2024, 441, 138405. [Google Scholar] [CrossRef]
- Kokulnathan, T.; Chen, S.-M. Praseodymium vanadate-decorated sulfur-doped carbon nitride hybrid nanocomposite: The role of a synergistic electrocatalyst for the detection of metronidazole. ACS Appl. Mater. Interfaces 2019, 11, 7893–7905. [Google Scholar] [CrossRef] [PubMed]
- Vinoth, S.; Wang, S.-F. Modification of glassy carbon electrode with manganese cobalt oxide-cubic like structures incorporated graphitic carbon nitride sheets for the voltammetric determination of 2,4,6-trichlorophenol. Microchim. Acta 2022, 189, 205. [Google Scholar] [CrossRef] [PubMed]
- Tseng, T.-W.; Chen, T.-W.; Chen, S.-M.; Kokulnathan, T.; Ahmed, F.; Hasan, P.; Bilgrami, A.L.; Kumar, S. Construction of strontium phosphate/graphitic-carbon nitride: A flexible and disposable strip for acetaminophen detection. J. Hazard. Mater. 2020, 410, 124542. [Google Scholar] [CrossRef]
- Alkorbi, A.S.; Kumar, K.Y.; Prashanth, M.; Parashuram, L.; Abate, A.; Alharti, F.A.; Jeon, B.-H.; Raghu, M. Samarium vanadate affixed sulfur self doped g-C3N4 heterojunction; photocatalytic, photoelectrocatalytic hydrogen evolution and dye degradation. Int. J. Hydrogen Energy 2022, 47, 12988–13003. [Google Scholar] [CrossRef]
- Sha, H.; Zhang, Y.; Wang, Y.; Ke, H.; Xiong, X.; Jia, N. Electrochemiluminescence resonance energy transfer biosensor between the glucose functionalized MnO2 and g-C3N4 nanocomposites for ultrasensitive detection of concanavalin A. Biosens. Bioelec-Tron. 2019, 124, 59–65. [Google Scholar] [CrossRef]
- Kokulnathan, T.; Wang, T.-J.; Kumar, E.A.; Duraisamy, N.; Lee, A.-T. An electrochemical platform based on yttrium oxide/boron nitride nanocomposite for the detection of dopamine. Sens. Actuators B Chem. 2021, 349, 130787. [Google Scholar] [CrossRef]
- Koventhan, C.; Vinothkumar, V.; Chen, S.-M. Development of an electrochemical sensor based on a cobalt oxide/tin oxide composite for determination of antibiotic drug ornidazole. N. J. Chem. 2021, 45, 12593–12605. [Google Scholar] [CrossRef]
- Sharma, T.S.K.; Jana, J.; Bhamu, K.; Song, J.; Sivaselvam, S.; Van Tam, T.; Kang, S.G.; Chung, J.S.; Hur, S.H.; Choi, W.M. Rational synthesis of alkaline earth metal vanadates: Structural origin of MgVO3 honeycomb lattice system and its electrochemical analysis for the detection of sulfadiazine. Chem. Eng. J. 2023, 464, 142673. [Google Scholar] [CrossRef]
- Priscillal, I.J.D.; Wang, S.-F. Fergusonite-type rare earth niobates ANbO4 (A = Nd, Sm, and Eu) as electrode modifiers: Deep insights into A site variations towards bifunctional electrochemical sensing applications. Nanoscale 2023, 15, 8693–8705. [Google Scholar] [CrossRef]
- Sharma, T.S.K.; Hwa, K.Y. Architecting hierarchal Zn3V2O8/P-rGO nanostructure: Electrochemical determination of anti-viral drug azithromycin in biological samples using SPCE. Chem. Eng. J. 2022, 439, 135591. [Google Scholar] [CrossRef]
- Rajaji, U.; Selvi, S.V.; Chen, S.M.; Chinnapaiyan, S.; Chen, T.W.; Govindasamy, M. A nanocomposite consisting of cuprous oxide supported on graphitic carbon nitride nanosheets for non-enzymatic electrochemical sensing of 8-hydroxy-2′-deoxyguanosine. Microchim. Acta 2020, 187, 459. [Google Scholar] [CrossRef] [PubMed]
- Sriram, B.; Baby, J.N.; Hsu, Y.-F.; Wang, S.-F.; Joseph, X.B.; George, M.; Veerakumar, P.; Lin, K.C. MnCo2O4 Microflowers Anchored on P-Doped g-C3N4 Nanosheets as an Electrocatalyst for Voltammetric Determination of the Antibiotic Drug Sulfadiazine. ACS Appl. Electron. Mater. 2021, 3, 3915–3926. [Google Scholar] [CrossRef]
- Khoobi, A.; Shahdost-fard, F.; Arbabi, M.; Akbari, M.; Mirzaei, H.; Nejati, M.; Lotfinia, M.; Sobhani-Nasab, A.; Banafshe, H.R. Sonochemical synthesis of ErVO4/MnWO4 heterostructures: Application as a novel nanostructured surface for electrochemical determination of tyrosine in biological samples. Polyhedron 2020, 177, 114302. [Google Scholar] [CrossRef]
- Wu, L.; Dai, P.; Wen, D. New structural design strategy: Optical center VO4-activated broadband yellow phosphate phosphors for high-color-rendering WLEDs. ACS Sustain. Chem. Eng. 2022, 10, 3757–3765. [Google Scholar] [CrossRef]
- Kogularasu, S.; Sriram, B.; Wang, S.-F.; Sheu, J.-K. Sea-urchin-like Bi2S3 microstructures decorated with graphitic carbon nitride nanosheets for use in food preservation. ACS Appl. Nano Mater. 2022, 5, 2375–2384. [Google Scholar] [CrossRef]
- She, X.; Xu, H.; Xu, Y.; Yan, J.; Xia, J.; Xu, L.; Song, Y.; Jiang, Y.; Zhang, Q.; Li, H. Exfoliated graphene-like carbon nitride in organic solvents: Enhanced photocatalytic activity and highly selective and sensitive sensor for the detection of trace amounts of Cu2+. J. Mater. Chem. A 2013, 2, 2563–2570. [Google Scholar] [CrossRef]
- Alagarsamy, S.; Mariappan, K.; Chen, S.-M.; Sakthinathan, S. Hexagonally close-packed three-dimensional nano-flower entrapped on a heteroatom doped carbon sheets: A sensitive electro-catalyst to determine sulfonamide in environmental samples. Food Chem. 2023, 429, 136826. [Google Scholar] [CrossRef] [PubMed]
- Sharma, K.; Kumar, A.; Sharma, S.; Tripathi, C.S.P.; Guin, D. Covalent functionalization of graphene oxide with l-lysine for highly sensitive and selective simultaneous electrochemical detection of rifampicin and acetaminophen. J. Appl. Electrochem. 2023, 1–17. [Google Scholar] [CrossRef]
- Sriram, B.; Baby, J.N.; Wang, S.-F.; George, M.; Joseph, X.B.; Tsai, J.-T. Surface engineering of three-dimensional-like hybrid AB2O4 (AB = Zn, Co, and Mn) wrapped on sulfur-doped reduced graphene oxide: Investigation of the role of an Electrocatalyst for Clioquinol detection. ACS Appl. Electron. Mater. 2020, 3, 362–372. [Google Scholar] [CrossRef]
- Anupriya, J.; Karuppusamy, N.; Chen, S.-M.; Lin, K.-Y. Synergistically improved electrochemical performance by the assembly of nanosized praseodymium tungstate on reduced graphene oxide for the detection of dimetridazole in biological and aquatic samples. J. Environ. Chem. Eng. 2022, 10, 108800. [Google Scholar] [CrossRef]
- Mufeeda, M.; Vaishag, P.V.; Ankitha, M.; Rasheed, P.A. Unveiling the capability of graphitic carbon nitride- rhenium disulfide nanocomposite as an electrochemical sensing platform for the detection of dimetridazole from human serum samples. Mater. Adv. 2023, 4, 4159–4167. [Google Scholar] [CrossRef]


Disclaimer/Publisher’s Note: The statements, opinions and data contained in all publications are solely those of the individual author(s) and contributor(s) and not of MDPI and/or the editor(s). MDPI and/or the editor(s) disclaim responsibility for any injury to people or property resulting from any ideas, methods, instructions or products referred to in the content. |
© 2024 by the authors. Licensee MDPI, Basel, Switzerland. This article is an open access article distributed under the terms and conditions of the Creative Commons Attribution (CC BY) license (https://creativecommons.org/licenses/by/4.0/).