

Data Augmentation Techniques for Accurate Action Classification in Stroke Patients with Hemiparesis


Abstract
1. Introduction
2. Materials and Methods
2.1. Dataset
2.2. Preprocessing
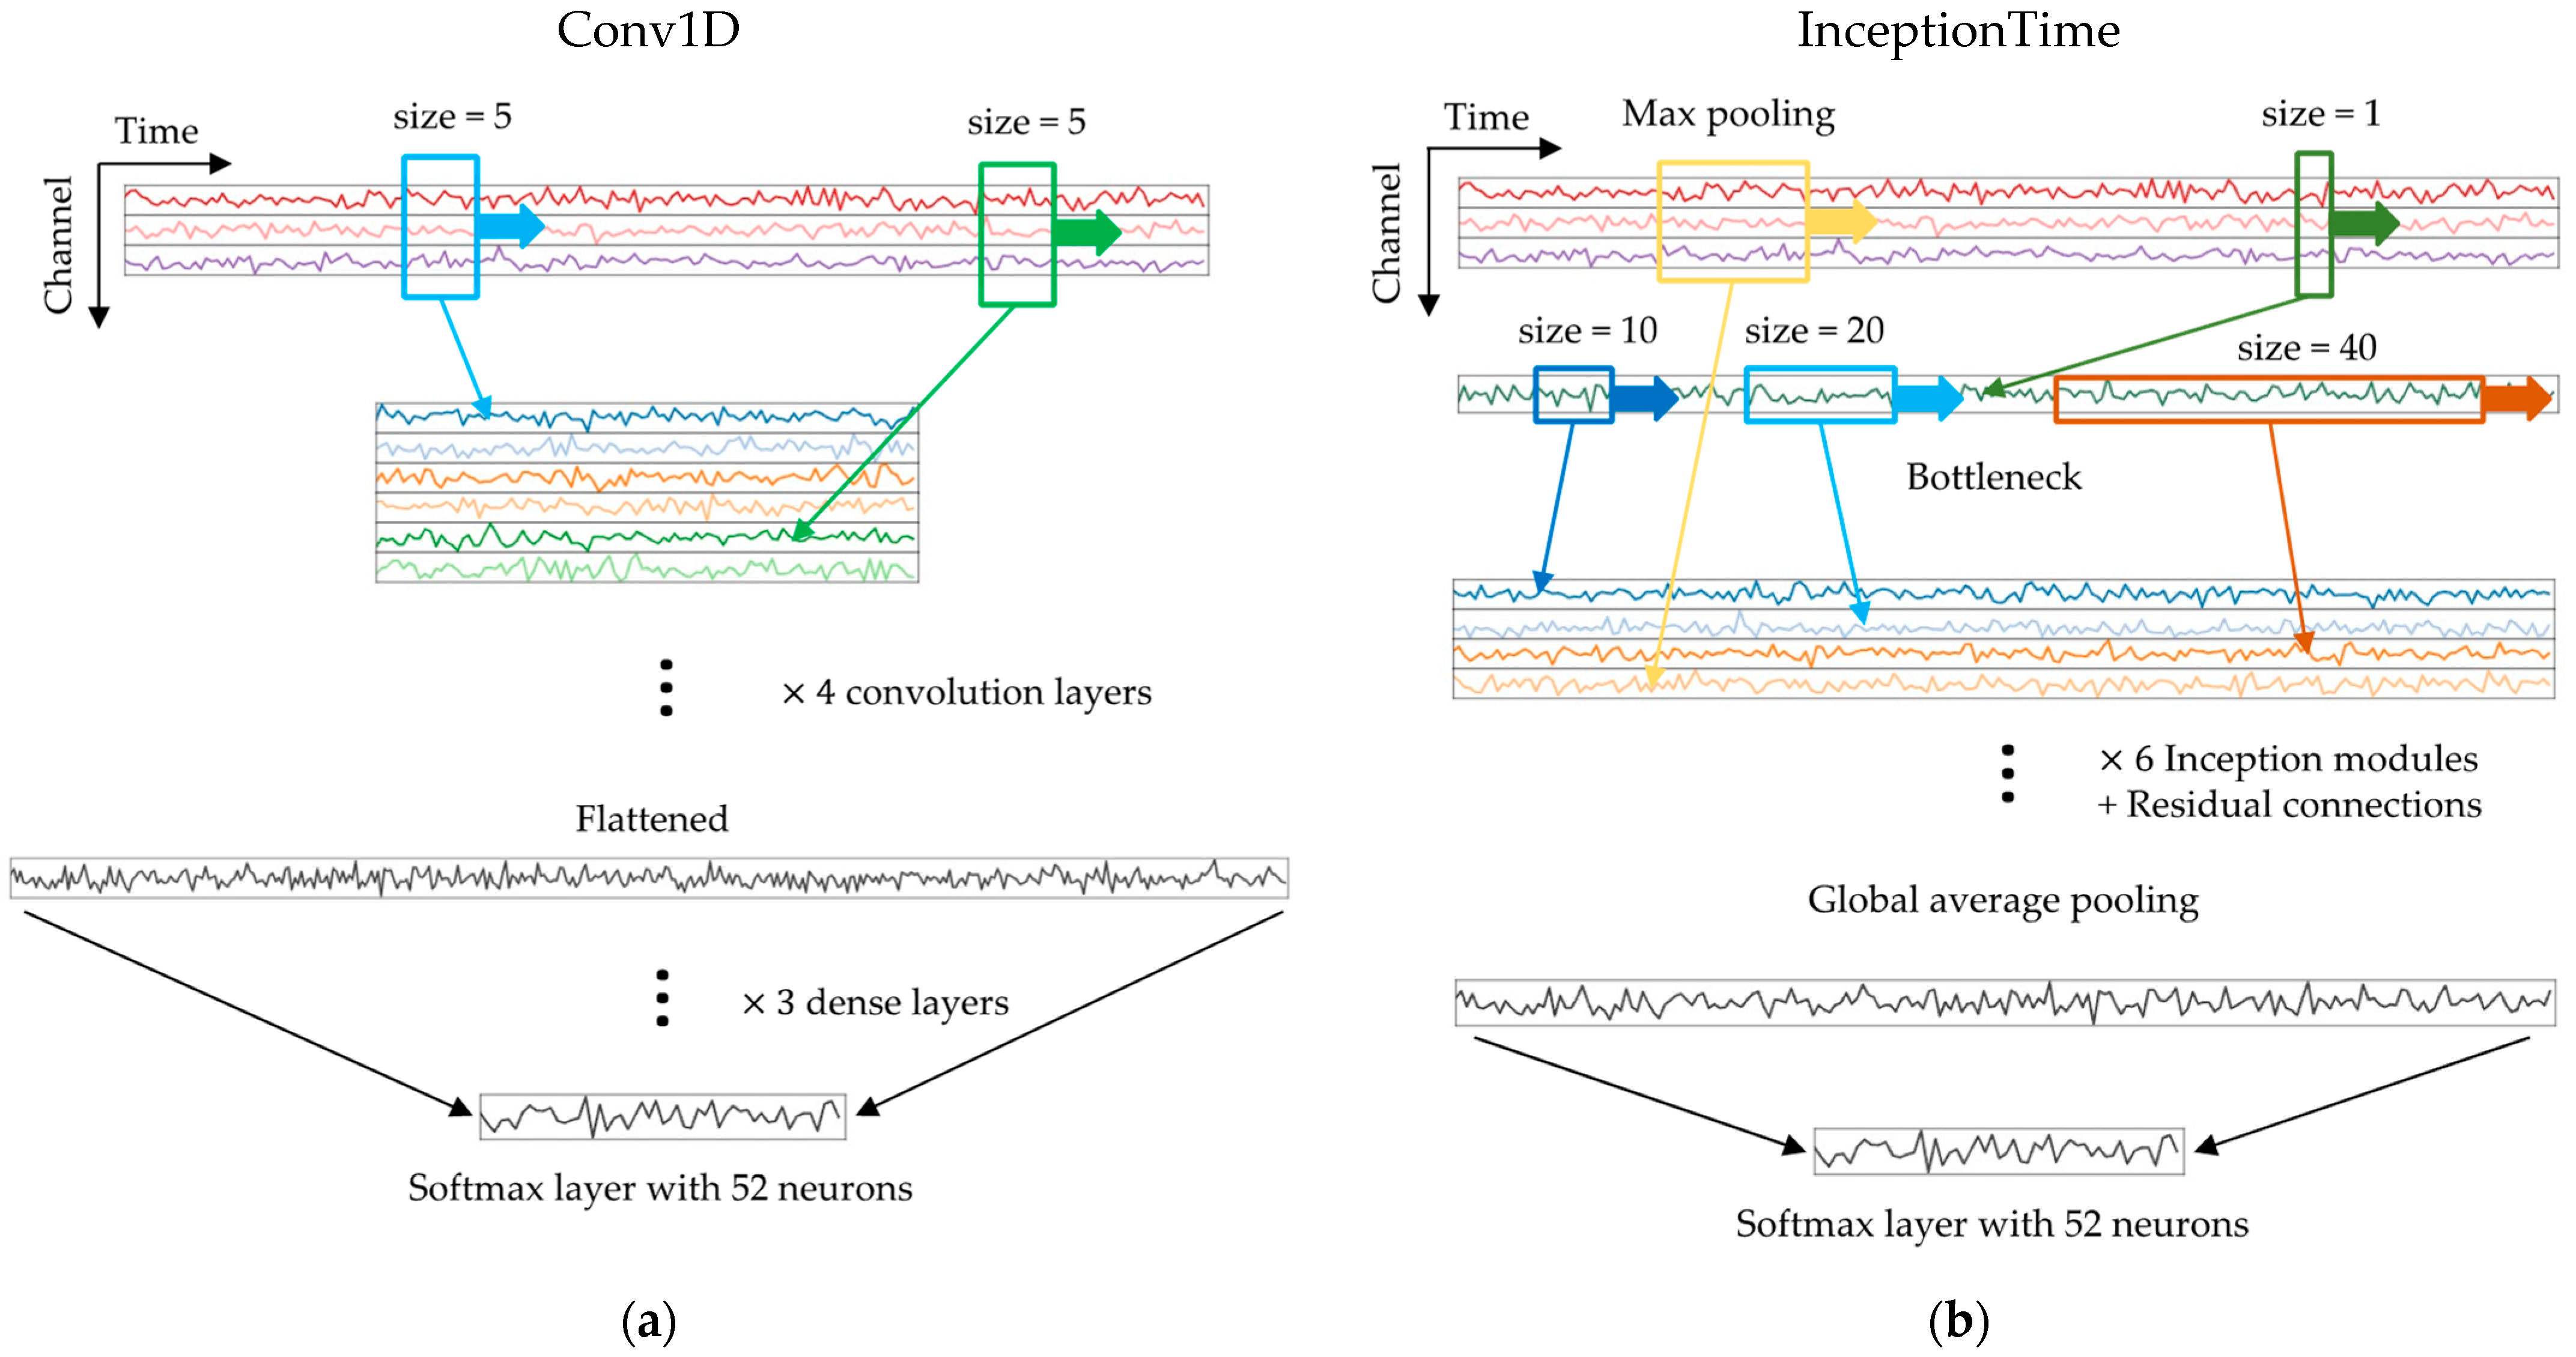
2.3. Models
2.4. Data Augmentation
2.5. Training and Evaluation
2.5.1. Leave-One-Subject-Out Cross-Validation (LOSOCV)
2.5.2. Training with the Stroke Subsets
2.5.3. InceptionTime and Transfer Learning
2.5.4. Optimization
2.6. UMAP
2.7. The OPPORTUNITY Dataset
3. Results
3.1. Data Exploration
3.2. Training Results
3.2.1. Baseline Results
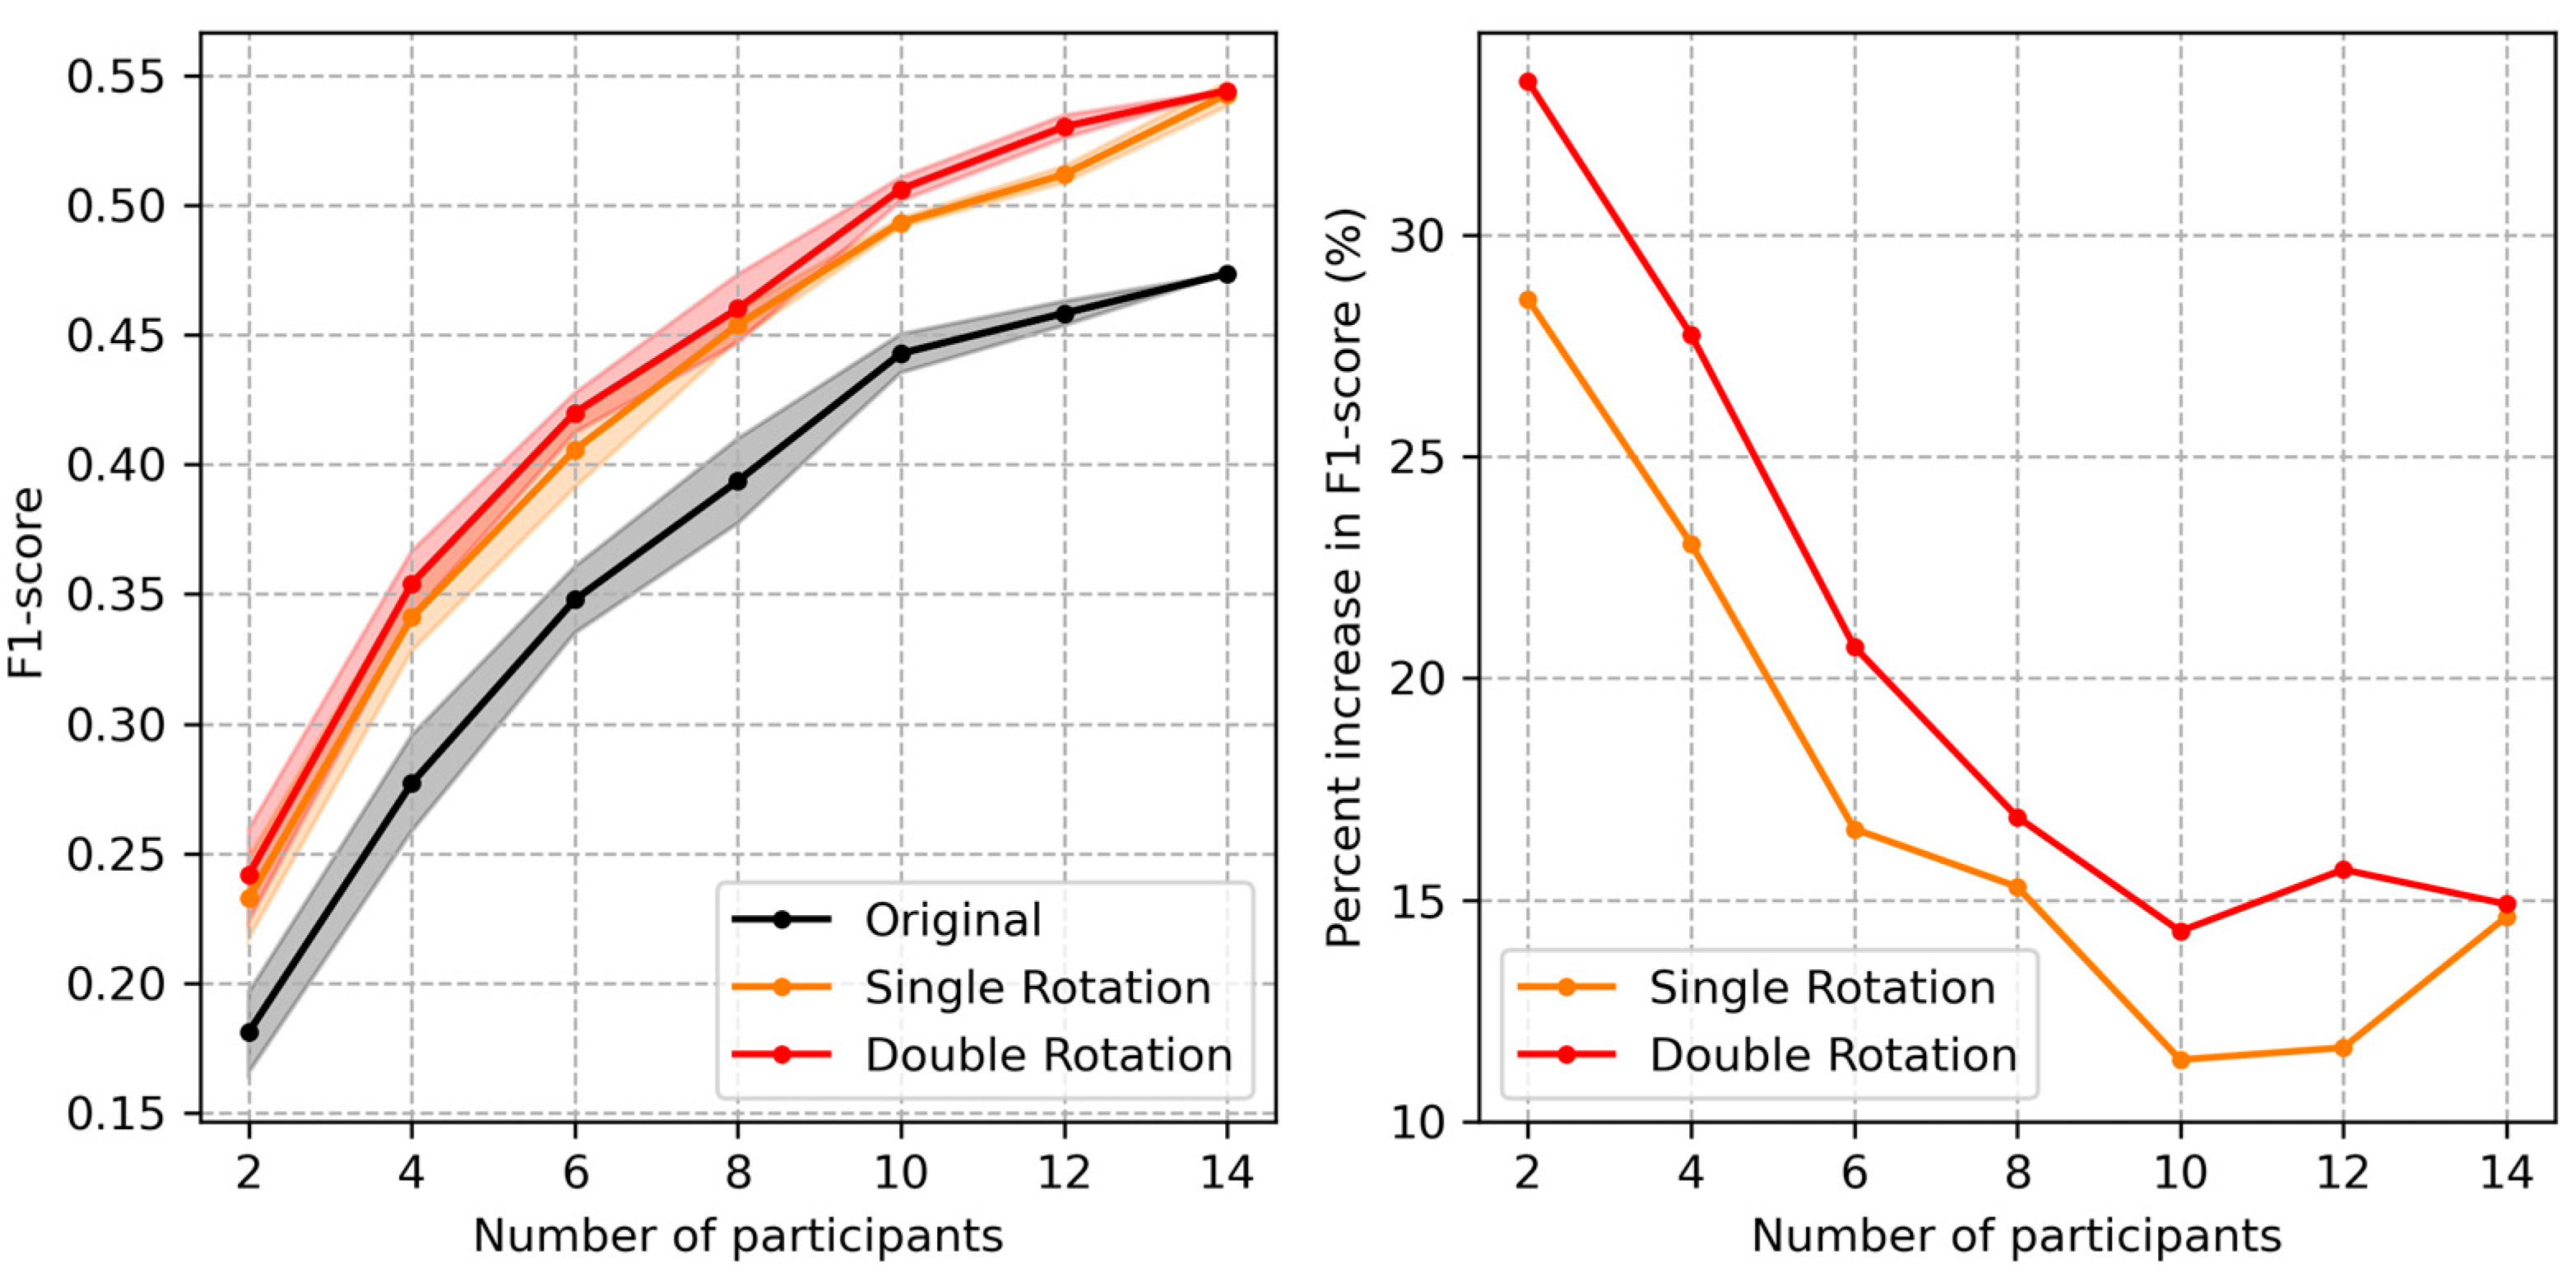
3.2.2. Data Augmentation
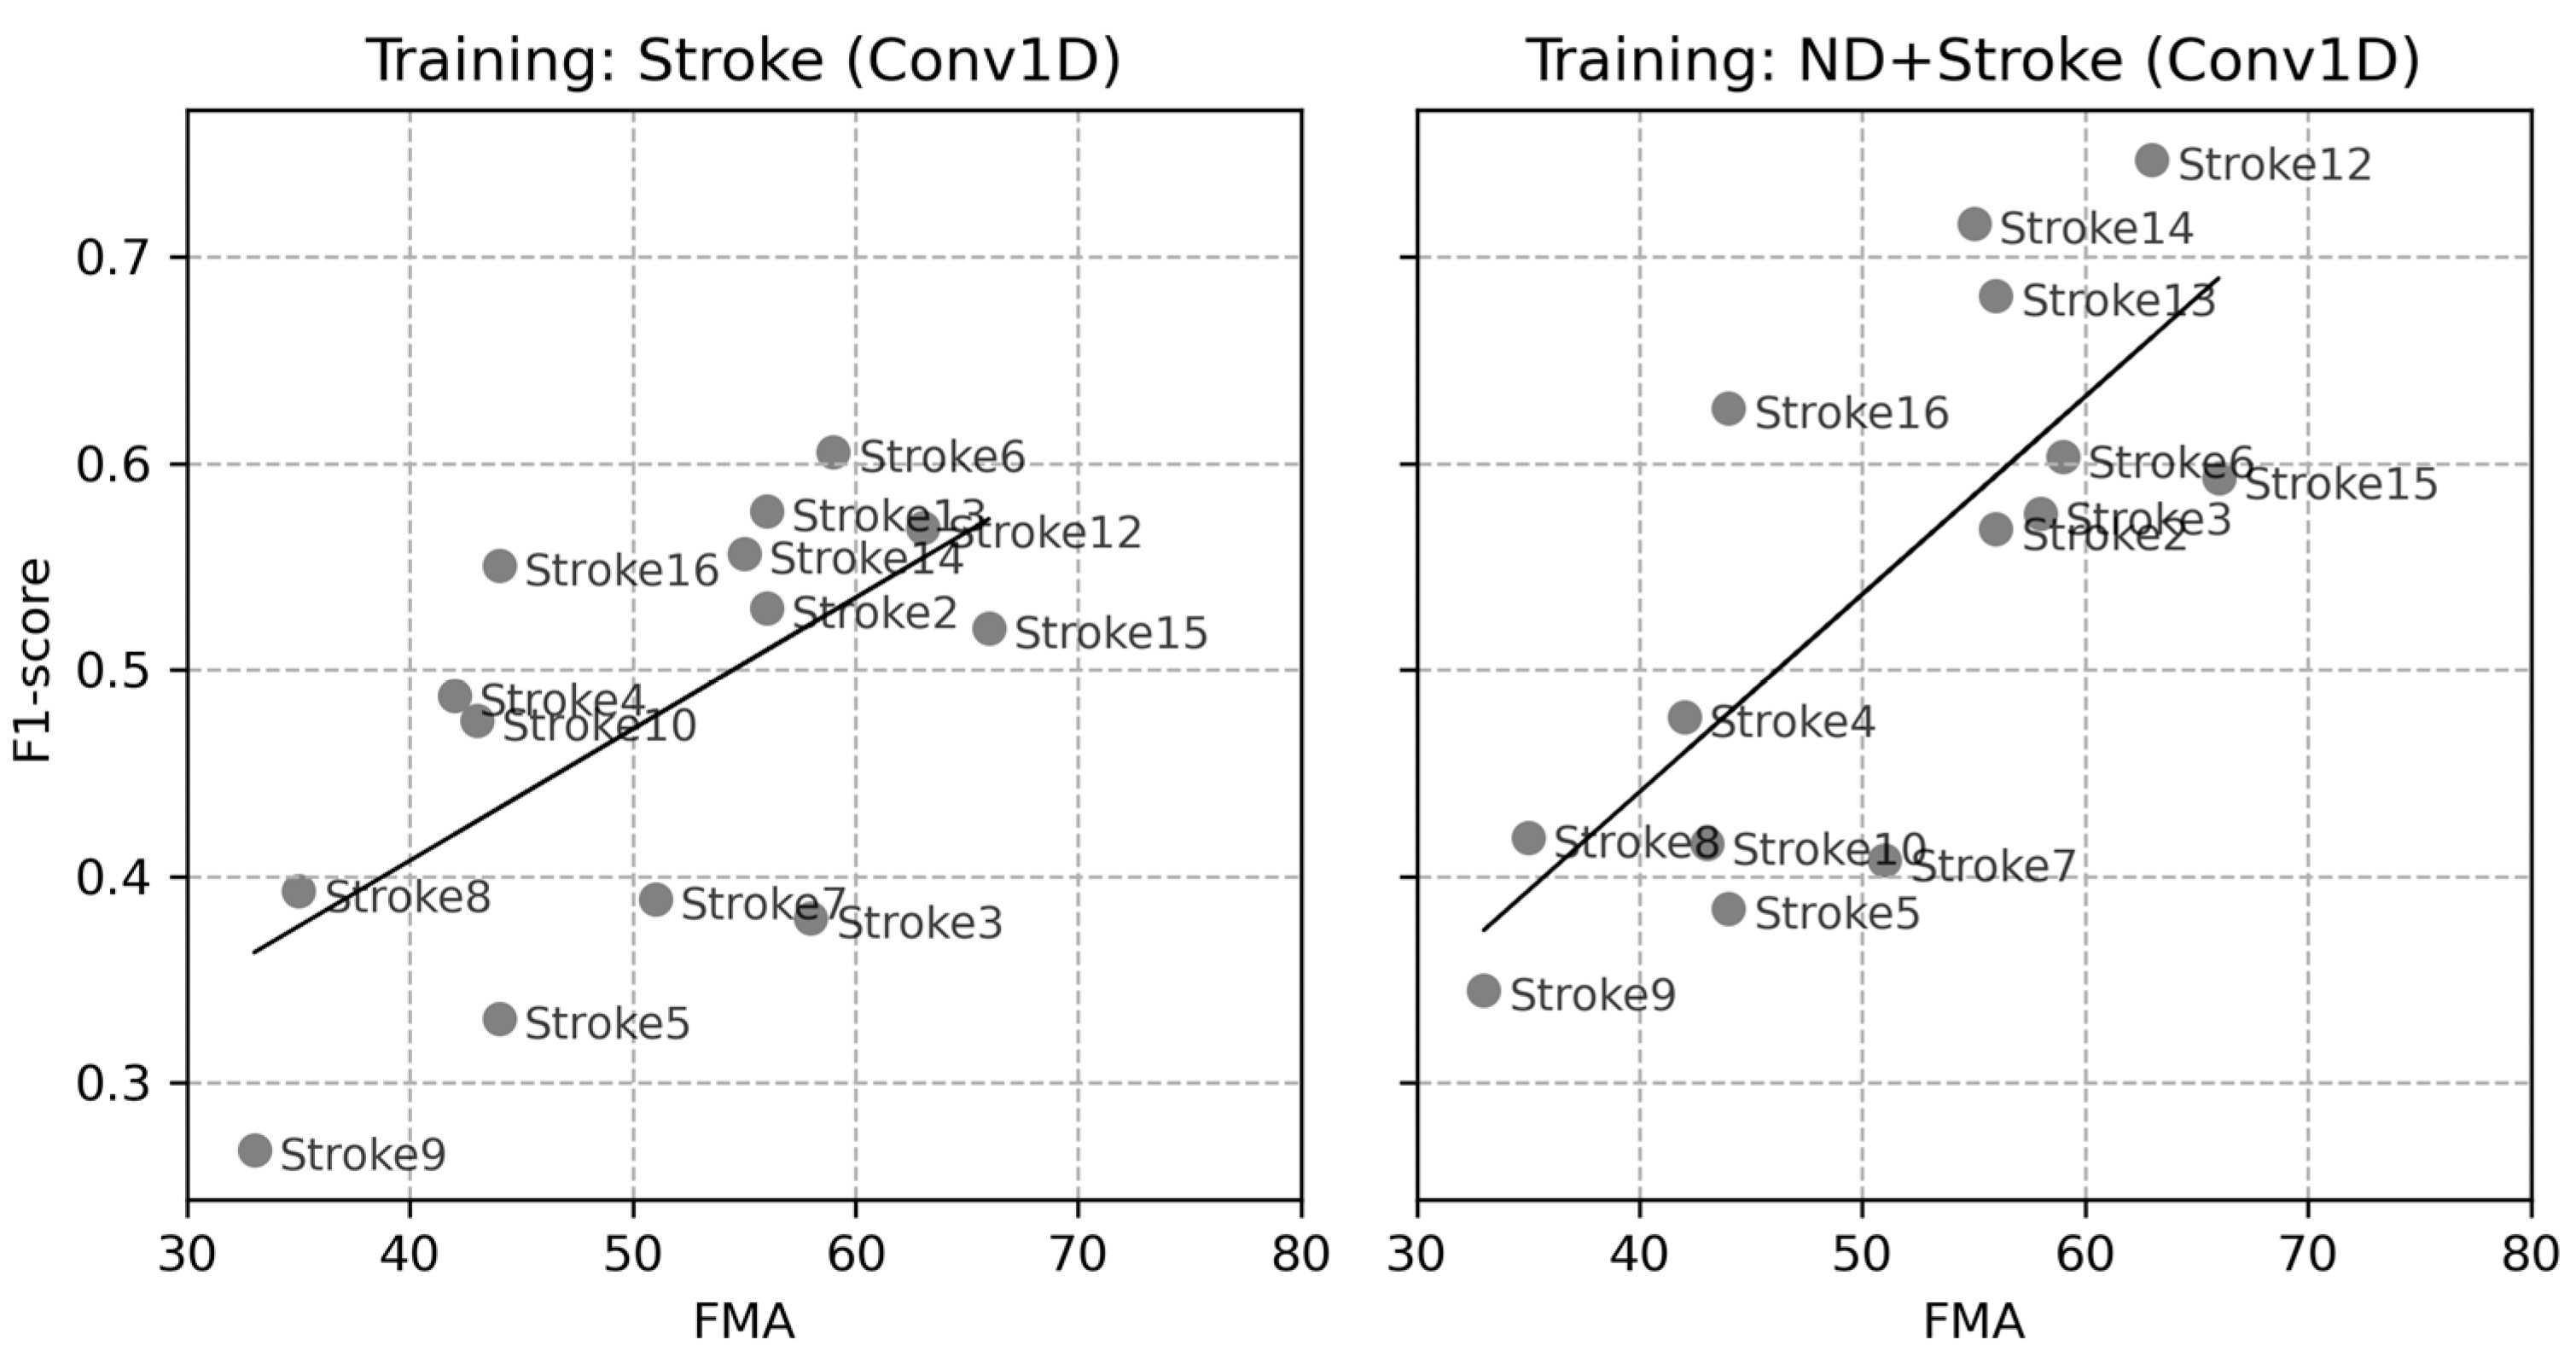
3.2.3. Correlations of Individual Data
3.2.4. Training on Subsets
3.2.5. Dimension Reduction
3.2.6. The OPPORTUNITY Dataset
4. Discussion
5. Conclusions
Funding
Institutional Review Board Statement
Informed Consent Statement
Data Availability Statement
Conflicts of Interest
References
- Uswatte, G.; Taub, E.; Morris, D.; Light, K.; Thompson, P.A. The Motor Activity Log-28: Assessing daily use of the hemiparetic arm after stroke. Neurology 2006, 67, 1189–1194. [Google Scholar] [CrossRef]
- Kwakkel, G.; Kollen, B.J.; Van der Grond, J.V.; Prevo, A.J.H. Probability of regaining dexterity in the flaccid upper limb: Impact of severity of paresis and time since onset in acute stroke. Stroke 2003, 34, 2181–2186. [Google Scholar] [CrossRef] [PubMed]
- Hidaka, Y.; Han, C.E.; Wolf, S.L.; Winstein, C.J.; Schweighofer, N. Use it and improve it or lose it: Interactions between arm function and use in humans post-stroke. PLoS Comput. Biol. 2012, 8, e1002343. [Google Scholar] [CrossRef] [PubMed]
- Taub, E.; Uswatte, G.; Mark, V.W.; Morris, D.M. The learned nonuse phenomenon: Implications for rehabilitation. Eura Medicophys. 2006, 42, 241–256. [Google Scholar] [PubMed]
- Lee, S.I.; Adans-Dester, C.P.; Grimaldi, M.; Dowling, A.V.; Horak, P.C.; Black-Schaffer, R.M.; Bonato, P.; Gwin, J.T. Enabling stroke rehabilitation in home and community settings: A wearable sensor-based approach for upper-limb motor training. IEEE J. Transl. Eng. Health Med. 2018, 6, 2100411. [Google Scholar] [CrossRef] [PubMed]
- Chen, K.; Zhang, D.; Yao, L.; Guo, B.; Yu, Z.; Liu, Y. Deep learning for sensor-based human activity recognition: Overview, challenges, and opportunities. ACM Comput. Surv. 2021, 54, 77. [Google Scholar] [CrossRef]
- Zhang, S.; Li, Y.; Zhang, S.; Shahabi, F.; Xia, S.; Deng, Y.; Alshurafa, N. Deep learning in human activity recognition with wearable sensors: A review on advances. Sensors 2022, 22, 1476. [Google Scholar] [CrossRef]
- MacEira-Elvira, P.; Popa, T.; Schmid, A.C.; Hummel, F.C. Wearable technology in stroke rehabilitation: Towards improved diagnosis and treatment of upper-limb motor impairment. J. Neuroeng. Rehabil. 2019, 16, 142. [Google Scholar] [CrossRef]
- Rahman, S.; Sarker, S.; Haque, A.K.M.N.; Uttsha, M.M.; Islam, M.F.; Deb, S. AI-driven stroke rehabilitation systems and assessment: A systematic review. IEEE Trans. Neural Syst. Rehabil. Eng. 2023, 31, 192–207. [Google Scholar] [CrossRef]
- O’Brien, M.K.; Shawen, N.; Mummidisetty, C.K.; Kaur, S.; Bo, X.; Poellabauer, C.; Kording, K.; Jayaraman, A. Activity recognition for persons with stroke using mobile phone technology: Toward improved performance in a home setting. J. Med. Internet Res. 2017, 19, e184. [Google Scholar] [CrossRef]
- Meng, L.; Zhang, A.; Chen, C.; Wang, X.; Jiang, X.; Tao, L.; Fan, J.; Wu, X.; Dai, C.; Zhang, Y.; et al. Exploration of human activity recognition using a single sensor for stroke survivors and able-bodied people. Sensors 2021, 21, 799. [Google Scholar] [CrossRef] [PubMed]
- Um, T.T.; Pfister, F.M.J.; Pichler, D.; Endo, S.; Lang, M.; Hirche, S.; Fietzek, U.; Kulić, D. Data Augmentation of wearable sensor data for Parkinson’s disease monitoring using convolutional neural networks. In Proceedings of the 19th ACM International Conference on Multimodal Interaction, ICMI ‘17, Glasgow, UK, 13–17 November 2017; Association for Computing Machinery: New York, NY, USA, 2017; pp. 216–220. [Google Scholar] [CrossRef]
- Celik, Y.; Aslan, M.F.; Sabanci, K.; Stuart, S.; Woo, W.L.; Godfrey, A. Improving inertial sensor-based activity recognition in neurological populations. Sensors 2022, 22, 9891. [Google Scholar] [CrossRef] [PubMed]
- Oh, Y.; Choi, S.-A.; Shin, Y.; Jeong, Y.; Lim, J.; Kim, S. Investigating activity recognition for hemiparetic stroke patients using wearable sensors: A deep learning approach with data augmentation. Sensors 2023, 24, 210. [Google Scholar] [CrossRef] [PubMed]
- Ismail Fawaz, H.; Lucas, B.; Forestier, G.; Pelletier, C.; Schmidt, D.F.; Weber, J.; Webb, G.I.; Idoumghar, L.; Muller, P.-A.; Petitjean, F. InceptionTime: Finding AlexNet for time series classification. Data Min. Knowl. Discov. 2020, 34, 1936–1962. [Google Scholar] [CrossRef]
- Le, Q.V.; Jaitly, N.; Hinton, G.E. A simple way to initialize recurrent networks of rectified linear units. arXiv 2015, arXiv:1504.00941. [Google Scholar]
- Srivastava, N.; Hinton, G.; Krizhevsky, A.; Salakhutdinov, R. Dropout: A simple way to prevent neural networks from overfitting. J. Mach. Learn. Res. 2014, 15, 1929–1958. [Google Scholar]
- Esteban, C.; Hyland, S.L.; Rätsch, G. Real-valued (Medical) Time Series Generation with Recurrent Conditional GANs. arXiv 2017, arXiv:1706.02633. [Google Scholar]
- Loshchilov, I.; Hutter, F. Decoupled weight decay regularization. arXiv 2017, arXiv:1711.05101. [Google Scholar]
- Mcinnes, L.; Healy, J.; Melville, J. UMAP: Uniform manifold approximation and projection for dimension reduction. arXiv 2020, arXiv:1802.03426. [Google Scholar]
- Van Der Maaten, L.; Hinton, G. Visualizing data using t-SNE. J. Mach. Learn. Res. 2008, 9, 2579–2605. [Google Scholar]
- Chavarriaga, R.; Sagha, H.; Calatroni, A.; Digumarti, S.T.; Tröster, G.; Millán, J.D.R.; Roggen, D. The Opportunity challenge: A benchmark database for on-body sensor-based activity recognition. Pattern Recognit. Lett. 2013, 34, 2033–2042. [Google Scholar] [CrossRef]
- Gao, W.; Zhang, L.; Teng, Q.; He, J.; Wu, H. DanHAR: Dual Attention Network for Multimodal Human Activity Recognition Using Wearable Sensors. Appl. Soft Comput. 2021, 111, 107728. [Google Scholar] [CrossRef]
- Iglesias, G.; Talavera, E.; González-Prieto, Á.; Mozo, A.; Gómez-Canaval, S. Data Augmentation techniques in time series domain: A survey and taxonomy. Neural Comput. Appl. 2023, 35, 10123–10145. [Google Scholar] [CrossRef]
- Brophy, E.; Wang, Z.; She, Q.; Ward, T. Generative adversarial networks in time series: A systematic literature review. ACM Comput. Surv. 2023, 55, 199. [Google Scholar] [CrossRef]
- Lin, L.; Li, Z.; Li, R.; Li, X.; Gao, J. Diffusion Models for Time Series Applications: A Survey. Front. Inf. Technol. Electron. Eng. 2023, 25, 19–41. [Google Scholar] [CrossRef]


| Training Group | Evaluation Group | |||
|---|---|---|---|---|
| ND | Stroke | StrokeRH | StrokeLH | |
| Trained using Stroke data | – | 47.3 ± 10.4% * | 47.2 ± 11.6% | 47.6 ± 9.1% |
| Trained using ND + Stroke | 90.5 ± 4.6% | 54.0 ± 13.1% | 56.9 ± 14.2% | 48.7 ± 10.1% |
| Augmentation Type | Amount of Augmented Data | |||||
|---|---|---|---|---|---|---|
| Stroke | Stroke + Single Augmentation | Stroke + Double Augmentation | ND + Stroke | ND + Stroke + Single Augmentation | ND + Stroke + Double Augmentation | |
| Rotation | 47.3% | 53.9 ± 0.5% * | 54.9 ± 0.5% | 54.0% | 60.3 ± 0.6% | 60.9 ± 0.7% |
| Time-warping | 50.5 ± 0.4% | 51.0 ± 0.5% | 55.7 ± 0.6% | 55.8 ± 0.7% | ||
| Permutation | 48.3 ± 1.0% | 47.5 ± 0.7% | 54.7 ± 0.5% | 54.4 ± 0.4% | ||
| Training Data | |||
|---|---|---|---|
| Original (Stroke) | Rotation | Permutation | Time Warping |
| 47.3% | 49.8 ± 0.5% * | 47.7 ± 0.7% | 49.2 ± 0.8% |
| Training Method | Amount of Augmented Data | ||
|---|---|---|---|
| Original | Single-Rotation | Double-Rotation | |
| Stroke (Conv1D) | 47.4% | 53.9 ± 0.5% * | 54.9 ± 0.5% |
| NDpre + Stroke (Conv1D) | 52.8% | 58.8 ± 0.4% | 60.3 ± 0.4% |
| ND + Stroke (Conv1D) | 54.0% | 60.3 ± 0.6% | 60.9 ± 0.7% |
| ND + Stroke (InceptionTime) | 62.8% | 66.0 ± 0.4% | 67.2 ± 0.4% |
| Model | Data Augmentation | |||
|---|---|---|---|---|
| Original | Rotation | Permutation | Time Warping | |
| DanHAR | 60.5% | 59.4 ± 0.7% * | 61.7 ± 0.6% | 65.0 ± 1.0% |
| InceptionTime | 60.0% | 56.2 ± 0.6% | 59.4 ± 1.2% | 62.9 ± 1.3% |
Disclaimer/Publisher’s Note: The statements, opinions and data contained in all publications are solely those of the individual author(s) and contributor(s) and not of MDPI and/or the editor(s). MDPI and/or the editor(s) disclaim responsibility for any injury to people or property resulting from any ideas, methods, instructions or products referred to in the content. |
© 2024 by the author. Licensee MDPI, Basel, Switzerland. This article is an open access article distributed under the terms and conditions of the Creative Commons Attribution (CC BY) license (https://creativecommons.org/licenses/by/4.0/).
Share and Cite
Oh, Y. Data Augmentation Techniques for Accurate Action Classification in Stroke Patients with Hemiparesis. Sensors 2024, 24, 1618. https://doi.org/10.3390/s24051618
Oh Y. Data Augmentation Techniques for Accurate Action Classification in Stroke Patients with Hemiparesis. Sensors. 2024; 24(5):1618. https://doi.org/10.3390/s24051618
Chicago/Turabian StyleOh, Youngmin. 2024. "Data Augmentation Techniques for Accurate Action Classification in Stroke Patients with Hemiparesis" Sensors 24, no. 5: 1618. https://doi.org/10.3390/s24051618
APA StyleOh, Y. (2024). Data Augmentation Techniques for Accurate Action Classification in Stroke Patients with Hemiparesis. Sensors, 24(5), 1618. https://doi.org/10.3390/s24051618