
Exploring the Possibility of Photoplethysmography-Based Human Activity Recognition Using Convolutional Neural Networks


Abstract
1. Introduction
2. Related Work
3. Method
3.1. Data Description
- Sleeping: Subjects laid on a mat with their eyes closed for 10 min with minimal movement.
- Sitting (working): This activity was included to replicate sitting at a desk and working. Subjects sat still in a chair and performed work-related tasks, such as using a computer or reading a book, for 5 min.
- Ascending and descending stairs: Subjects walked up and down stairs for 5 min, without any restrictions on speed of step or arm movements.
- Walking: Subjects walked on a treadmill for 5 min at approximately 5–6 km/h without any restrictions on arm movements. This speed was chosen based on [35], which examined the walking and running speeds of 230 people ages 20–79.
- Running: Subjects ran on a treadmill for 5 min at approximately 8 km/h without any restrictions on arm movements. This speed was also selected based on [35]. The subjects were instructed to include a flight phase (the time in the running gait cycle when both feet are in the air and the body is no longer in contact with the ground) during the run to distinguish it from walking. Participants were given sufficient breaks after each session to stabilize their heart rate.
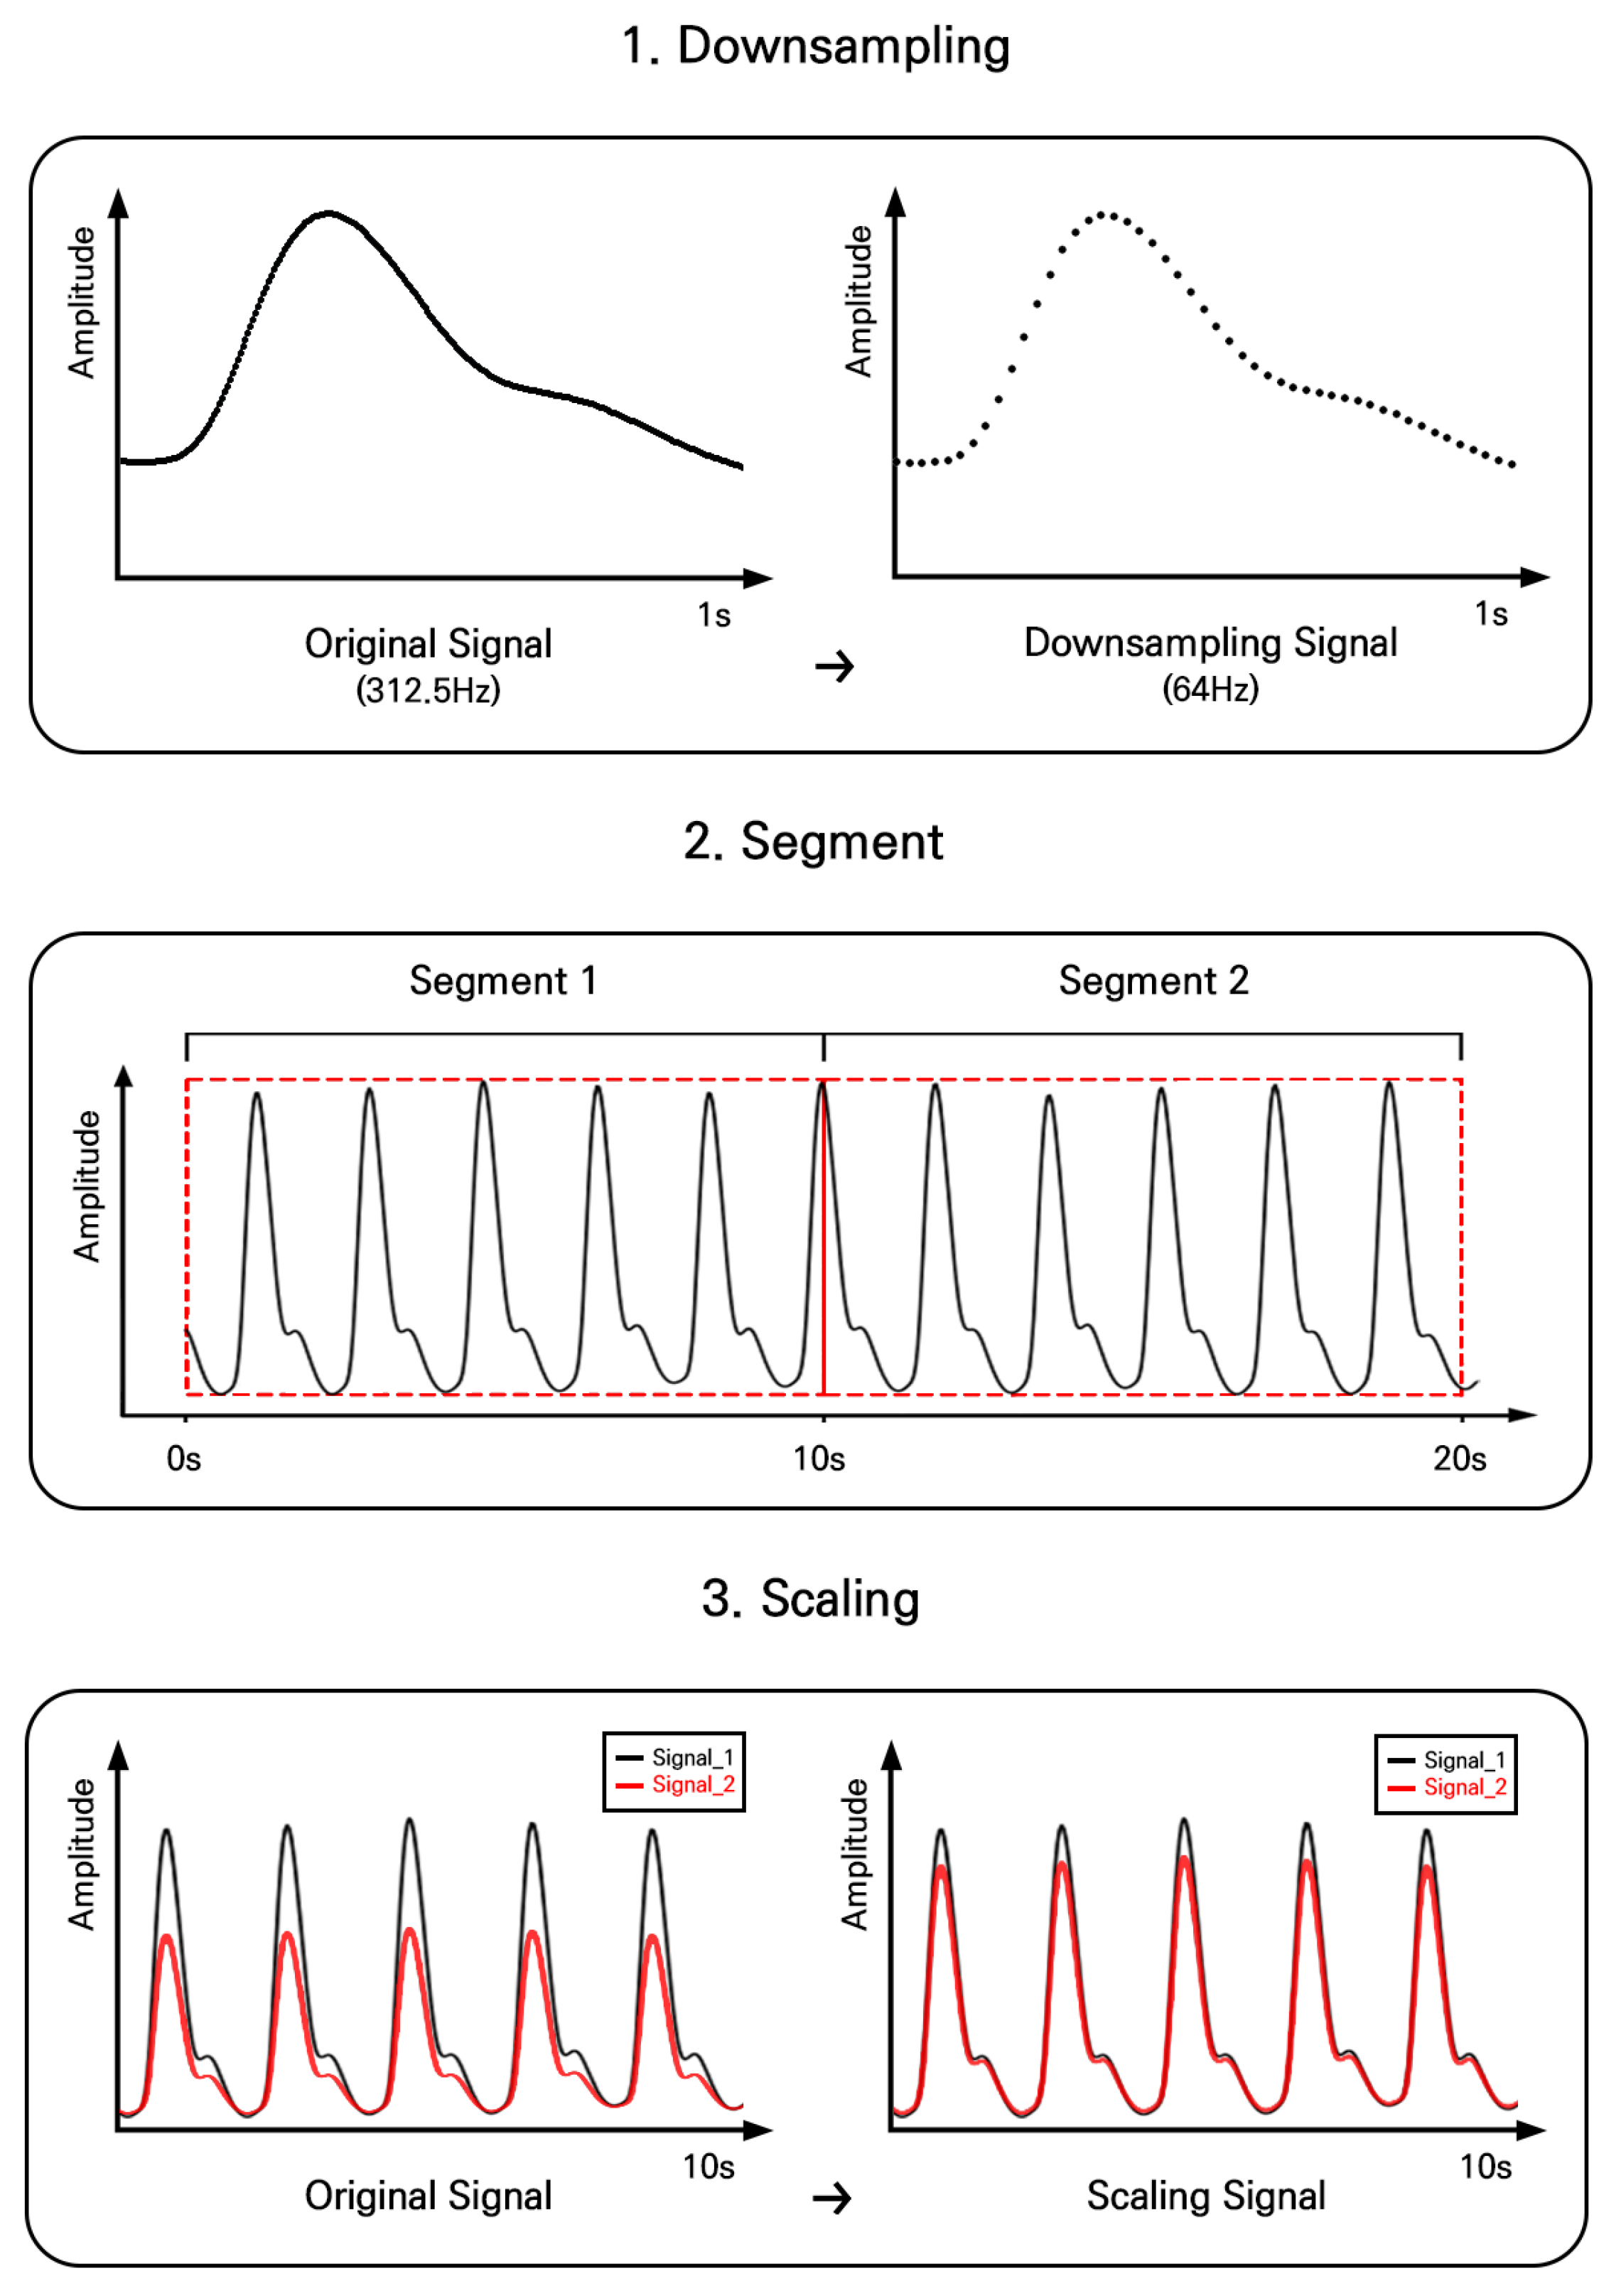
3.2. Pre-Processing
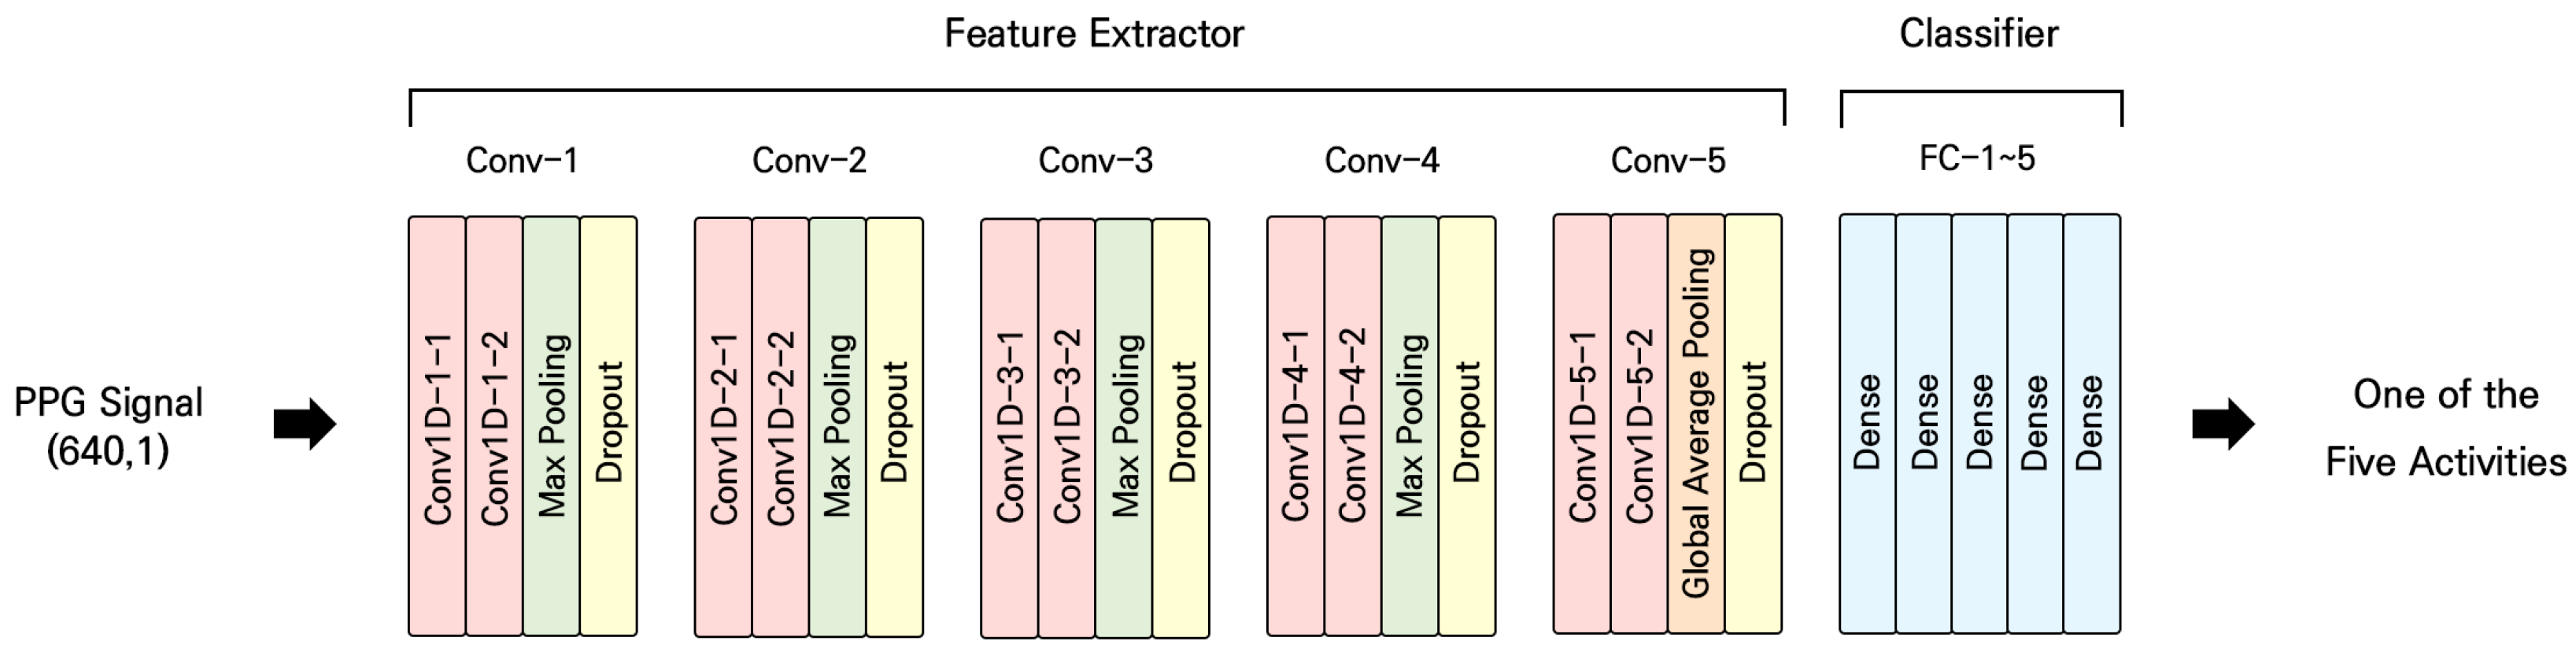
3.3. Model
3.4. Experiment
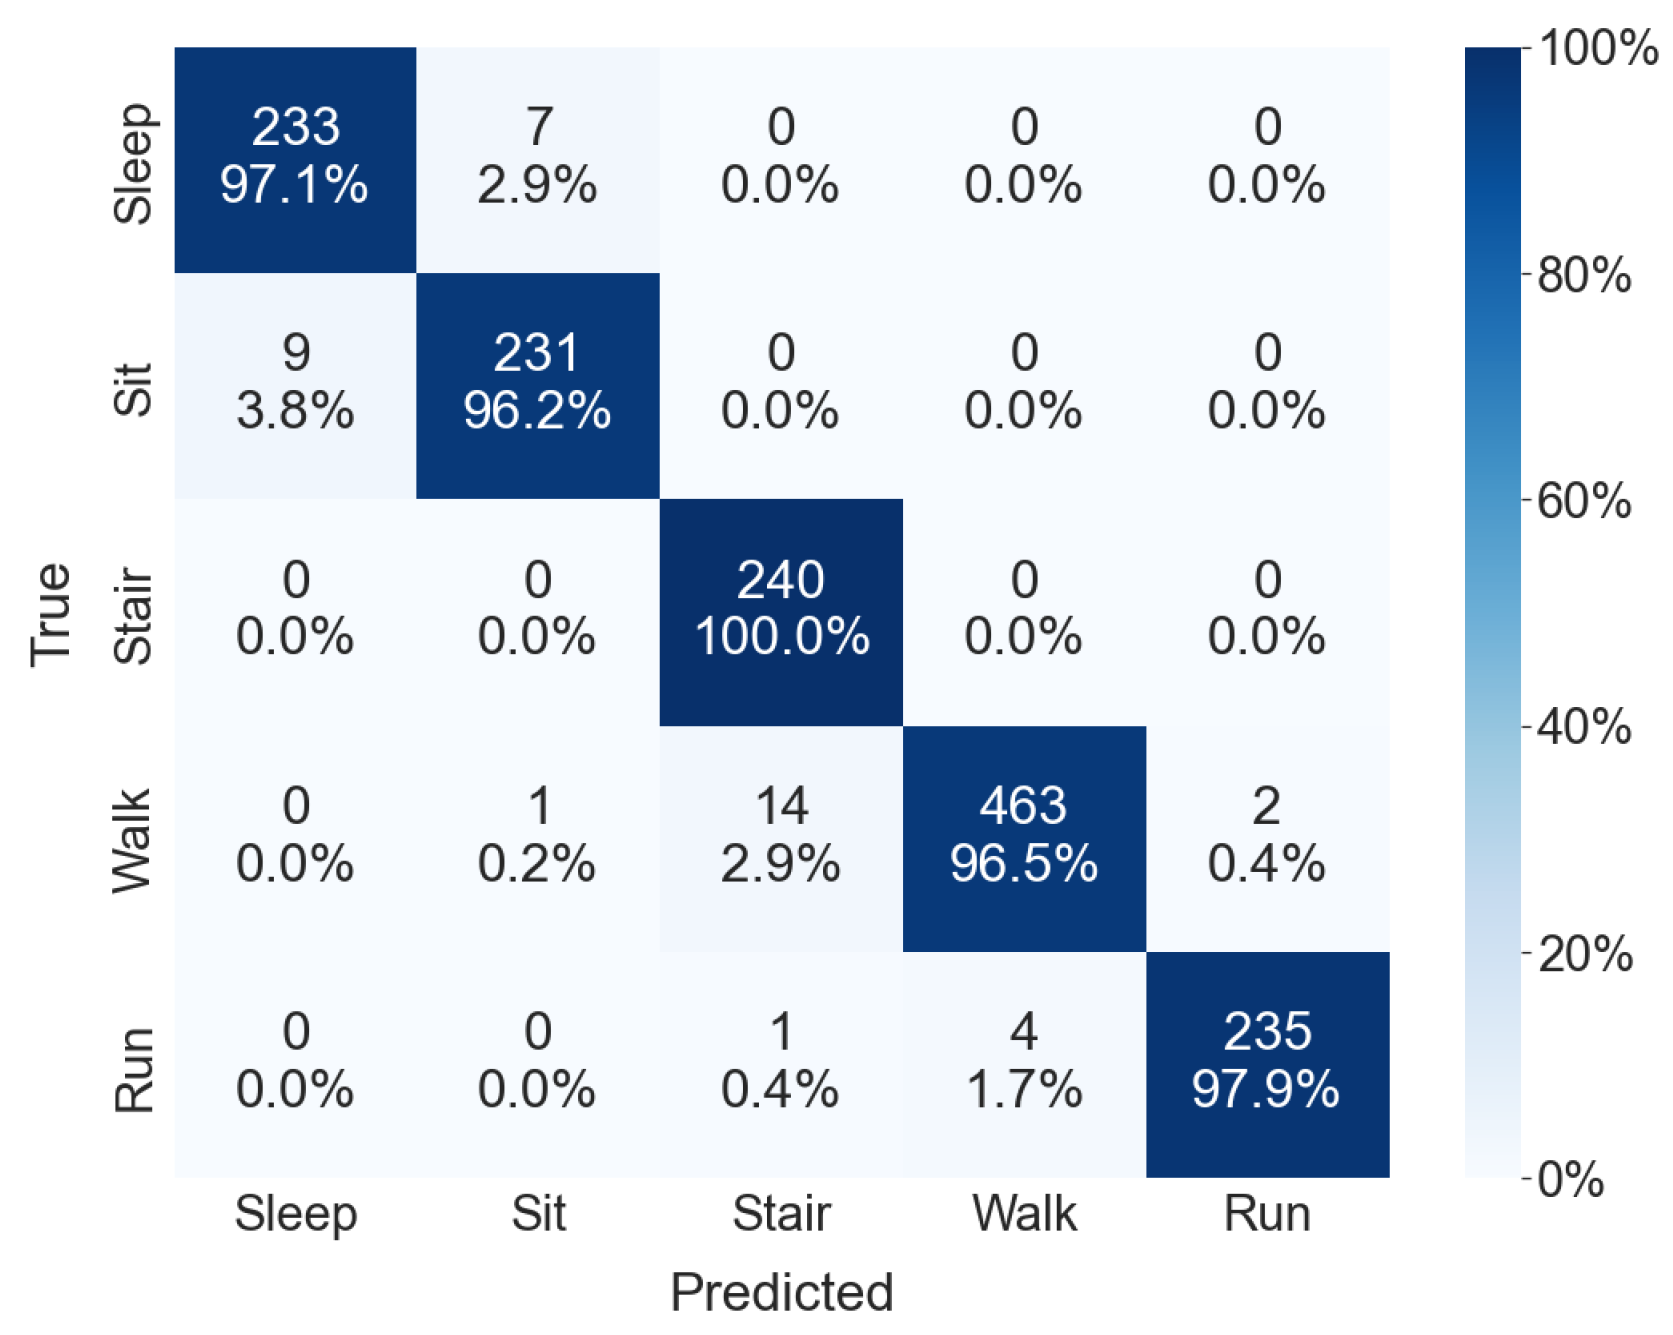
4. Results
5. Discussion
5.1. General Discussion
5.2. Limitations and Future Work
6. Conclusions
Author Contributions
Funding
Institutional Review Board Statement
Informed Consent Statement
Data Availability Statement
Conflicts of Interest
Abbreviations
| HAR | human activity recognition |
| IMU | inertial measurement unit |
| EGM | electrogoniometers |
| EMGs | electromyograms |
| GSR | galvanic skin response |
| EDA | electrodermal activity |
| ECG | electrocardiogram |
| PPG | photoplethysmogram |
| ABP | ambulatory blood pressure |
| 1D CNN | one-dimensional convolutional neural network |
| LSTM | long short-term memory |
| Leaky ReLU | leaky rectified linear unit |
| SD | standard deviation |
| CV | cross-validation |
References
- Ramasamy Ramamurthy, S.; Roy, N. Recent trends in machine learning for human activity recognition—A survey. Wiley Interdiscip. Rev. Data Min. Knowl. Discov. 2018, 8, e1254. [Google Scholar] [CrossRef]
- Jannat, M.K.A.; Islam, M.S.; Yang, S.H.; Liu, H. Efficient Wi-Fi-Based Human Activity Recognition Using Adaptive Antenna Elimination. IEEE Access 2023, 11, 105440–105454. [Google Scholar] [CrossRef]
- Ke, S.R.; Thuc, H.L.U.; Lee, Y.J.; Hwang, J.N.; Yoo, J.H.; Choi, K.H. A review on video-based human activity recognition. Computers 2013, 2, 88–131. [Google Scholar] [CrossRef]
- Wu, X.; Chu, Z.; Yang, P.; Xiang, C.; Zheng, X.; Huang, W. TW-See: Human activity recognition through the wall with commodity Wi-Fi devices. IEEE Trans. Veh. Technol. 2018, 68, 306–319. [Google Scholar] [CrossRef]
- Demrozi, F.; Pravadelli, G.; Bihorac, A.; Rashidi, P. Human activity recognition using inertial, physiological and environmental sensors: A comprehensive survey. IEEE Access 2020, 8, 210816–210836. [Google Scholar] [CrossRef]
- Mukhopadhyay, B.; Anchal, S.; Kar, S. Detection of an intruder and prediction of his state of motion by using seismic sensor. IEEE Sens. J. 2017, 18, 703–712. [Google Scholar] [CrossRef]
- Azar, S.M.; Atigh, M.G.; Nickabadi, A.; Alahi, A. Convolutional relational machine for group activity recognition. In Proceedings of the IEEE/CVF Conference on Computer Vision and Pattern Recognition, Long Beach, CA, USA, 15–20 June 2019; pp. 7892–7901. [Google Scholar]
- Yadav, S.K.; Tiwari, K.; Pandey, H.M.; Akbar, S.A. Skeleton-based human activity recognition using ConvLSTM and guided feature learning. Soft Comput. 2022, 26, 877–890. [Google Scholar] [CrossRef]
- Hussain, A.; Hussain, T.; Ullah, W.; Baik, S.W. Vision transformer and deep sequence learning for human activity recognition in surveillance videos. Comput. Intell. Neurosci. 2022, 2022, 3454167. [Google Scholar] [CrossRef]
- Chen, K.; Zhang, D.; Yao, L.; Guo, B.; Yu, Z.; Liu, Y. Deep learning for sensor-based human activity recognition: Overview, challenges, and opportunities. ACM Comput. Surv. (CSUR) 2021, 54, 1–40. [Google Scholar] [CrossRef]
- Challa, S.K.; Kumar, A.; Semwal, V.B. A multibranch CNN-BiLSTM model for human activity recognition using wearable sensor data. Vis. Comput. 2022, 38, 4095–4109. [Google Scholar] [CrossRef]
- Bijalwan, V.; Semwal, V.B.; Gupta, V. Wearable sensor-based pattern mining for human activity recognition: Deep learning approach. Ind. Robot. Int. J. Robot. Res. Appl. 2022, 49, 21–33. [Google Scholar] [CrossRef]
- Han, C.; Zhang, L.; Tang, Y.; Huang, W.; Min, F.; He, J. Human activity recognition using wearable sensors by heterogeneous convolutional neural networks. Expert Syst. Appl. 2022, 198, 116764. [Google Scholar] [CrossRef]
- cheol Jeong, I.; Bychkov, D.; Searson, P.C. Wearable devices for precision medicine and health state monitoring. IEEE Trans. Biomed. Eng. 2018, 66, 1242–1258. [Google Scholar] [CrossRef]
- Xefteris, V.R.; Dominguez, M.; Grivolla, J.; Tsanousa, A.; Zaffanela, F.; Monego, M.; Symeonidis, S.; Diplaris, S.; Wanner, L.; Vrochidis, S.; et al. A Multimodal Late Fusion Framework for Physiological Sensor and Audio-Signal-Based Stress Detection: An Experimental Study and Public Dataset. Electronics 2023, 12, 4871. [Google Scholar] [CrossRef]
- Permatasari, J.; Connie, T.; Ong, T.S.; Teoh, A.B.J. Adaptive 1-dimensional time invariant learning for inertial sensor-based gait authentication. Neural Comput. Appl. 2023, 35, 2737–2753. [Google Scholar] [CrossRef]
- Mekruksavanich, S.; Jitpattanakul, A. Exercise activity recognition with surface electromyography sensor using machine learning approach. In Proceedings of the 2020 Joint International Conference on Digital Arts, Media and Technology with ECTI Northern Section Conference on Electrical, Electronics, Computer and Telecommunications Engineering (ECTI DAMT & NCON), Pattaya, Thailand, 11–14 March 2020; pp. 75–78. [Google Scholar]
- Ahmed, S.; Nii, M. Classification of Human Activities Using Statistical Features from Electrodermal Activity and Heart Rate Variability. Int. J. Biomed. Soft Comput. Hum. Sci. Off. J. Biomed. Fuzzy Syst. Assoc. 2022, 27, 1–12. [Google Scholar]
- Liu, H.; Hartmann, Y.; Schultz, T. CSL-SHARE: A multimodal wearable sensor-based human activity dataset. Front. Comput. Sci. 2021, 3, 759136. [Google Scholar] [CrossRef]
- Mekruksavanich, S.; Jantawong, P.; Hnoohom, N.; Jitpattanakul, A. Classification of Physical Exercise Activity from ECG, PPG and IMU Sensors using Deep Residual Network. In Proceedings of the 2022 Research, Invention, and Innovation Congress: Innovative Electricals and Electronics (RI2C), Bangkok, Thailand, 4–5 August 2022; pp. 130–134. [Google Scholar]
- Alian, A.A.; Shelley, K.H. Photoplethysmography: Analysis of the pulse oximeter waveform. In Monitoring Technologies in Acute Care Environments: A Comprehensive Guide to Patient Monitoring Technology; Springer: Berlin/Heidelberg, Germany, 2013; pp. 165–178. [Google Scholar]
- Almanifi, O.R.A.; Khairuddin, I.M.; Razman, M.A.M.; Musa, R.M.; Majeed, A.P.A. Human activity recognition based on wrist PPG via the ensemble method. ICT Express 2022, 8, 513–517. [Google Scholar] [CrossRef]
- Hnoohom, N.; Mekruksavanich, S.; Jitpattanakul, A. Physical Activity Recognition Based on Deep Learning Using Photoplethysmography and Wearable Inertial Sensors. Electronics 2023, 12, 693. [Google Scholar] [CrossRef]
- Shi, W.; Zhou, C.; Zhang, Y.; Li, K.; Ren, X.; Liu, H.; Ye, X. Hybrid modeling on reconstitution of continuous arterial blood pressure using finger photoplethysmography. Biomed. Signal Process. Control 2023, 85, 104972. [Google Scholar] [CrossRef]
- Jeong, I.; Jun, S.; Um, D.; Oh, J.; Yoon, H. Non-invasive estimation of systolic blood pressure and diastolic blood pressure using photoplethysmograph components. Yonsei Med. J. 2010, 51, 345–353. [Google Scholar] [CrossRef]
- Pesenti, M.; Invernizzi, G.; Mazzella, J.; Bocciolone, M.; Pedrocchi, A.; Gandolla, M. IMU-based human activity recognition and payload classification for low-back exoskeletons. Sci. Rep. 2023, 13, 1184. [Google Scholar] [CrossRef] [PubMed]
- Li, Y.; Wang, L. Human activity recognition based on residual network and BiLSTM. Sensors 2022, 22, 635. [Google Scholar] [CrossRef]
- Kim, Y.W.; Cho, W.H.; Kim, K.S.; Lee, S. Inertial-Measurement-Unit-Based Novel Human Activity Recognition Algorithm Using Conformer. Sensors 2022, 22, 3932. [Google Scholar] [CrossRef]
- Jaramillo, I.E.; Chola, C.; Jeong, J.G.; Oh, J.H.; Jung, H.; Lee, J.H.; Lee, W.H.; Kim, T.S. Human Activity Prediction Based on Forecasted IMU Activity Signals by Sequence-to-Sequence Deep Neural Networks. Sensors 2023, 23, 6491. [Google Scholar] [CrossRef] [PubMed]
- Challa, S.K.; Kumar, A.; Semwal, V.B.; Dua, N. An optimized deep learning model for human activity recognition using inertial measurement units. Expert Syst. 2023, 40, e13457. [Google Scholar] [CrossRef]
- Brophy, E.; Veiga, J.J.D.; Wang, Z.; Ward, T.E. A machine vision approach to human activity recognition using photoplethysmograph sensor data. In Proceedings of the 2018 29th Irish Signals and Systems Conference (ISSC), Belfast, UK, 21–22 June 2018; pp. 1–6. [Google Scholar]
- Jarchi, D.; Casson, A.J. Description of a database containing wrist PPG signals recorded during physical exercise with both accelerometer and gyroscope measures of motion. Data 2016, 2, 1. [Google Scholar] [CrossRef]
- Mahmud, T.; Akash, S.S.; Fattah, S.A.; Zhu, W.P.; Ahmad, M.O. Human activity recognition from multi-modal wearable sensor data using deep multi-stage LSTM architecture based on temporal feature aggregation. In Proceedings of the 2020 IEEE 63rd International Midwest Symposium on Circuits and Systems (MWSCAS), Springfield, MA, USA, 9–12 August 2020; pp. 249–252. [Google Scholar]
- Lee, H.T.; Cheon, H.R.; Lee, S.H.; Shim, M.; Hwang, H.J. Risk of data leakage in estimating the diagnostic performance of a deep-learning-based computer-aided system for psychiatric disorders. Sci. Rep. 2023, 13, 16633. [Google Scholar] [CrossRef]
- Bohannon, R.W. Comfortable and maximum walking speed of adults aged 20–79 years: Reference values and determinants. Age Ageing 1997, 26, 15–19. [Google Scholar] [CrossRef]
- Reiss, A.; Indlekofer, I.; Schmidt, P.; Van Laerhoven, K. Deep PPG: Large-scale heart rate estimation with convolutional neural networks. Sensors 2019, 19, 3079. [Google Scholar] [CrossRef]
- Pedregosa, F.; Varoquaux, G.; Gramfort, A.; Michel, V.; Thirion, B.; Grisel, O.; Blondel, M.; Prettenhofer, P.; Weiss, R.; Dubourg, V.; et al. Scikit-learn: Machine Learning in Python. J. Mach. Learn. Res. 2011, 12, 2825–2830. [Google Scholar]
- Yang, J.; Nguyen, M.N.; San, P.P.; Li, X.; Krishnaswamy, S. Deep convolutional neural networks on multichannel time series for human activity recognition. In Proceedings of the 24th International Joint Conference on Artificial Intelligence (IJCAI), Buenos Aires, Argentina; 2015; Volume 15, pp. 3995–4001. [Google Scholar]
- Zeng, M.; Nguyen, L.T.; Yu, B.; Mengshoel, O.J.; Zhu, J.; Wu, P.; Zhang, J. Convolutional neural networks for human activity recognition using mobile sensors. In Proceedings of the 6th International Conference on Mobile Computing, Applications and Services, Austin, TX, USA, 6–7 November 2014; pp. 197–205. [Google Scholar]
- Lee, S.M.; Yoon, S.M.; Cho, H. Human activity recognition from accelerometer data using Convolutional Neural Network. In Proceedings of the 2017 IEEE International Conference on Big Data and Smart Computing (BigComp), Jeju, Republic of Korea, 13–16 February 2017; pp. 131–134. [Google Scholar]
- Münzner, S.; Schmidt, P.; Reiss, A.; Hanselmann, M.; Stiefelhagen, R.; Dürichen, R. CNN-based sensor fusion techniques for multimodal human activity recognition. In Proceedings of the 2017 ACM International Symposium on Wearable Computers, Maui, HI, USA, 11–15 September 2017; pp. 158–165. [Google Scholar]
- Xu, Y.; Qiu, T.T. Human activity recognition and embedded application based on convolutional neural network. J. Artif. Intell. Technol. 2021, 1, 51–60. [Google Scholar] [CrossRef]
- Lee, K.S.; Chae, S.; Park, H.S. Optimal time-window derivation for human-activity recognition based on convolutional neural networks of repeated rehabilitation motions. In Proceedings of the 2019 IEEE 16th International Conference on Rehabilitation Robotics (ICORR), Toronto, ON, Canada, 24–28 June 2019; pp. 583–586. [Google Scholar]
- Afzali Arani, M.S.; Costa, D.E.; Shihab, E. Human activity recognition: A comparative study to assess the contribution level of accelerometer, ECG, and PPG signals. Sensors 2021, 21, 6997. [Google Scholar] [CrossRef] [PubMed]
- Mekruksavanich, S.; Jitpattanakul, A.; Sitthithakerngkiet, K.; Youplao, P.; Yupapin, P. Resnet-se: Channel attention-based deep residual network for complex activity recognition using wrist-worn wearable sensors. IEEE Access 2022, 10, 51142–51154. [Google Scholar] [CrossRef]
- Fida, B.; Bernabucci, I.; Bibbo, D.; Conforto, S.; Schmid, M. Varying behavior of different window sizes on the classification of static and dynamic physical activities from a single accelerometer. Med. Eng. Phys. 2015, 37, 705–711. [Google Scholar] [CrossRef]
- Kwapisz, J.R.; Weiss, G.M.; Moore, S.A. Activity recognition using cell phone accelerometers. ACM SigKDD Explor. Newsl. 2011, 12, 74–82. [Google Scholar] [CrossRef]
- Reiss, A.; Stricker, D. Introducing a new benchmarked dataset for activity monitoring. In Proceedings of the 2012 16th International Symposium on Wearable Computers, Newcastle, UK, 18–22 June 2012; pp. 108–109. [Google Scholar]
- Anguita, D.; Ghio, A.; Oneto, L.; Parra, X.; Reyes-Ortiz, J.L. A public domain dataset for human activity recognition using smartphones. In Proceedings of the ESANN 2013 Proceedings, European Symposium on Artificial Neural Networks, Computational Intelligence and Machine Learning, Bruges, Belgium, 24–26 April 2013; Volume 3, p. 3. [Google Scholar]
- Banos, O.; Villalonga, C.; Garcia, R.; Saez, A.; Damas, M.; Holgado-Terriza, J.A.; Lee, S.; Pomares, H.; Rojas, I. Design, implementation and validation of a novel open framework for agile development of mobile health applications. Biomed. Eng. Online 2015, 14, S6. [Google Scholar] [CrossRef]
- Biagetti, G.; Crippa, P.; Falaschetti, L.; Saraceni, L.; Tiranti, A.; Turchetti, C. Dataset from PPG wireless sensor for activity monitoring. Data Brief 2020, 29, 105044. [Google Scholar] [CrossRef]
- Liu, H.; Hartmann, Y.; Schultz, T. A Practical Wearable Sensor-based Human Activity Recognition Research Pipeline. In Proceedings of the 15th International Joint Conference on Biomedical Engineering Systems and Technologies (BIOSTEC 2022), Virtual Event, 9–11 February 2022; pp. 847–856. [Google Scholar]
- Hartmann, Y.; Liu, H.; Schultz, T. Feature Space Reduction for Human Activity Recognition based on Multi-channel Biosignals. In Proceedings of the 14th International Joint Conference on Biomedical Engineering Systems and Technologies (BIOSTEC 2021), Virtual Event, 11–13 February 2021; pp. 215–222. [Google Scholar]
- Hartmann, Y.; Liu, H.; Schultz, T. High-level features for human activity recognition and modeling. In Proceedings of the 15th International Joint Conference on Biomedical Engineering Systems and Technologies (BIOSTEC 2022), Virtual Event, 9–11 February; Springer: Cham, Switzerland, 2022; pp. 141–163. [Google Scholar]


| Age | Height (cm) | Weight (kg) | BMI | ||
|---|---|---|---|---|---|
| Female | Mean | 23.7 | 161.4 | 54.7 | 20.9 |
| ( n = 20) | SD | 2.5 | 5.2 | 9.2 | 2.8 |
| Male | Mean | 24.3 | 175.0 | 72.8 | 23.8 |
| (n = 20) | SD | 2.7 | 6.0 | 9.5 | 3.1 |
| ALL | Mean | 24.0 | 168.2 | 63.7 | 22.4 |
| (n = 40) | SD | 2.6 | 8.8 | 13.0 | 3.3 |
| Experiment | Fold | 1 | 2 | 3 | 4 | 5 | Mean | SD |
|---|---|---|---|---|---|---|---|---|
| Intra-subject | Accuracy | 0.98 | 0.99 | 0.99 | 0.99 | 0.98 | 0.99 | 0.005 |
| Precision | 0.98 | 0.99 | 0.99 | 0.98 | 0.98 | 0.98 | 0.005 | |
| Recall | 0.98 | 0.99 | 0.99 | 0.99 | 0.98 | 0.99 | 0.005 | |
| F-1 measure | 0.98 | 0.99 | 0.99 | 0.99 | 0.98 | 0.99 | 0.005 | |
| Cross-subject | Accuracy | 0.96 | 0.97 | 0.94 | 0.96 | 0.93 | 0.95 | 0.015 |
| Precision | 0.95 | 0.97 | 0.93 | 0.95 | 0.92 | 0.94 | 0.017 | |
| Recall | 0.96 | 0.98 | 0.94 | 0.95 | 0.92 | 0.95 | 0.020 | |
| F-1 measure | 0.96 | 0.97 | 0.94 | 0.95 | 0.92 | 0.95 | 0.017 |
| Class | Precision | Recall | F-1 Measure |
|---|---|---|---|
| Sleep | 0.96 | 0.97 | 0.97 |
| Sit | 0.97 | 0.96 | 0.96 |
| Stair | 0.94 | 1.00 | 0.97 |
| Walk | 0.99 | 0.96 | 0.98 |
| Run | 0.99 | 0.98 | 0.99 |
| Average | 0.97 | 0.97 | 0.97 |
| Signal | Paper | Data | Subject | Class | Model | Performance |
|---|---|---|---|---|---|---|
| IMU | Arani et al. [44], 2021 | PPG-DaLiA [36] | 15 | 5 | Random Forest | F1-Score 94.07% (10-fold) |
| F1-Score 83.16% (Leave-One-Subject-Out) | ||||||
| Mahmud et al. [33], 2020 | Wrist PPG During Exercise [32] | 8 | 4 | LSTM | Accuracy 74.7% | |
| Li et al. [27], 2022 | Private dataset | 5 | 6 | ResNet + BiLSTM | Accuracy 96.95% | |
| WISDM [47] | 36 | 6 | Accuracy 97.32% | |||
| PAMAP2 [48] | 9 | 18 | Accuracy 97.15% (Cross-subject) | |||
| Kim et al. [28], 2022 | WISDM [47] | 36 | 6 | Conformer | Accuracy 98.1% | |
| PAMAP2 [48] | 9 | 18 | Accuracy 99.7% | |||
| UCI-HAR [49] | 30 | 6 | Accuracy 99.3% | |||
| Jaramillo et al. [29], 2023 | PAMAP2 [48] | 9 | 5 | Bi-LSTM | Accuracy 97.96% | |
| Challa et al. [30], 2023 | PAMAP2 [48] | 9 | 18 | CNN + Bi-LSTM | Accuracy 94.91% (Cross-subject) | |
| UCI-HAR [49] | 30 | 6 | Accuracy 97.16% (Cross-subject) | |||
| MHEALTH [50] | 9 | 12 | Accuracy 99.25% (Cross-subject) | |||
| Pesenti et al. [26], 2023 | Private dataset | 12 | 5 | LSTM | F1-Score 90.8% | |
| Hnoohom et al. [23], 2023 | PPG-DaLiA [36] | 15 | 8 | PPG-NeXt | Accuracy 96.82% (10-fold) | |
| PPG-ACC [51] | 7 | 3 | Accuracy 99.11% (10-fold) | |||
| Wrist PPG During Exercise [32] | 8 | 4 | Accuracy 98.18% (10-fold) | |||
| ECG | Arani et al. [44], 2021 | PPG-DaLiA [36] | 15 | 5 | Random Forest | F1-Score 88.44% (10-fold) |
| F1-Score 60.34% (Leave-One-Subject-Out ) | ||||||
| Almanifi et al. [22], 2022 | Wrist PPG During Exercise [32] | 8 | 4 | Ensemble (Resnet50V2, MobileNetV2, Xception) | Accuracy 94.28% | |
| Hnoohom et al. [23], 2023 | PPG-DaLiA [36] | 15 | 8 | PPG-NeXt | Accuracy 94.57% (10-fold) | |
| Wrist PPG During Exercise [32] | 8 | 4 | Accuracy 97.20% (10-fold) | |||
| PPG | Arani et al. [44], 2021 | PPG-DaLiA [36] | 15 | 5 | Random Forest | F1-Score 62.65% (10-fold) |
| F1-Score 46.85% (Leave-One-Subject-Out ) | ||||||
| Mahmud et al. [33], 2020 | Wrist PPG During Exercise [32] | 8 | 4 | LSTM | Accuracy 72.1% | |
| Brophy et al. [31], 2018 | Inception-v3 | Accuracy 75.8% | ||||
| Almanifi et al. [22], 2022 | Ensemble (Resnet50V2, MobileNetV2, Xception) | Accuracy 88.91% | ||||
| Hnoohom et al. [23], 2023 | PPG-DaLiA [36] | 15 | 8 | PPG-NeXt | Accuracy 98.81% (10-fold) | |
| PPG-ACC [51] | 7 | 3 | Accuracy 92.22% (10-fold) | |||
| Wrist PPG During Exercise [32] | 8 | 4 | Accuracy 91.65% (10-fold) | |||
| Our Approach | Private dataset | 40 | 5 | CNN (proposed) | Accuracy 98.61% (5-fold) | |
| Accuracy 95.14% (5-fold, Cross-subject) | ||||||
| PPG-NeXt | Accuracy 78.03% (5-fold) | |||||
| Accuracy 70.33% (5-fold, Cross-subject) | ||||||
| LSTM | Accuracy 98.78% (5-fold) | |||||
| Accuracy 83.63% (5-fold, Cross-subject) | ||||||
| PPG-DaLiA [36] | 15 | 8 | CNN (proposed) | Accuracy 46.11% (5-fold, Cross-subject) | ||
| 5 | Accuracy 60.77% (5-fold, Cross-subject) | |||||
| Accuracy 68.00% F1-Score 62.27% (Leave-One-Subject-Out) | ||||||
| PPG-ACC [51] | 7 | 3 | Accuracy 78.67% (Leave-One-Subject-Out) | |||
| Wrist PPG During Exercise [32] | 8 | 4 | Accuracy 85.87% (Leave-One-Subject-Out) |
Disclaimer/Publisher’s Note: The statements, opinions and data contained in all publications are solely those of the individual author(s) and contributor(s) and not of MDPI and/or the editor(s). MDPI and/or the editor(s) disclaim responsibility for any injury to people or property resulting from any ideas, methods, instructions or products referred to in the content. |
© 2024 by the authors. Licensee MDPI, Basel, Switzerland. This article is an open access article distributed under the terms and conditions of the Creative Commons Attribution (CC BY) license (https://creativecommons.org/licenses/by/4.0/).
Share and Cite
Ryu, S.; Yun, S.; Lee, S.; Jeong, I.c. Exploring the Possibility of Photoplethysmography-Based Human Activity Recognition Using Convolutional Neural Networks. Sensors 2024, 24, 1610. https://doi.org/10.3390/s24051610
Ryu S, Yun S, Lee S, Jeong Ic. Exploring the Possibility of Photoplethysmography-Based Human Activity Recognition Using Convolutional Neural Networks. Sensors. 2024; 24(5):1610. https://doi.org/10.3390/s24051610
Chicago/Turabian StyleRyu, Semin, Suyeon Yun, Sunghan Lee, and In cheol Jeong. 2024. "Exploring the Possibility of Photoplethysmography-Based Human Activity Recognition Using Convolutional Neural Networks" Sensors 24, no. 5: 1610. https://doi.org/10.3390/s24051610
APA StyleRyu, S., Yun, S., Lee, S., & Jeong, I. c. (2024). Exploring the Possibility of Photoplethysmography-Based Human Activity Recognition Using Convolutional Neural Networks. Sensors, 24(5), 1610. https://doi.org/10.3390/s24051610