


First Acyclovir Determination Procedure via Electrochemically Activated Screen-Printed Carbon Electrode Coupled with Well-Conductive Base Electrolyte

Abstract
1. Introduction

| Technique (Electrode) | Linear Range (nmol L−1) | Sensitivity (nA/nmol L−1) | LOD (nmol L−1) | Analyzed Sample | Ref. |
|---|---|---|---|---|---|
| SWAdSV (β-CD/EPPGE) | 50.0–600.0 1000.0–9000.0 | 317.34 | 7.59 | Tablets, urine sample | [17] |
| DPAASV (Ag NPs/CdS NWs/RG/GCE) | 10.0–4000.0 4000.0–40,000.0 | - | 3.30 | Blood serum, tablet and topical cream samples | [18] |
| SWV (SWNT/Naf/GCE) | 10.0–30,000.0 | 15.40 | 1.80 | Urine sample | [19] |
| LCAdSV (GCE/TFM) | 90.0–530.0 | 37.00 | 1.00 | Synthetic sample that contains antiretroviral drugs or ATP and DNA | [20] |
| SWV (γ-Fe2O3-Bent/CPE) | 50.0–800.0 | 4.22 | 1.55 | Pharmaceutical and urine samples | [21] |
| DPV (GCE/CNT/ILC/RGO/MnO2) | 10.0–30,000.0 | 0.47 | 0.84 | Human serum | [22] |
| DPAdSV (RuNPs/TBA/PGE) | 3.0–30.0 30.0–3000.0 | - | 0.80 | Tablet and urine samples | [23] |
| SWAdSV (NC/GPE) | 0.05–1.0 | 14.10 | 0.20 | Pharmaceutical and biological samples | [24] |
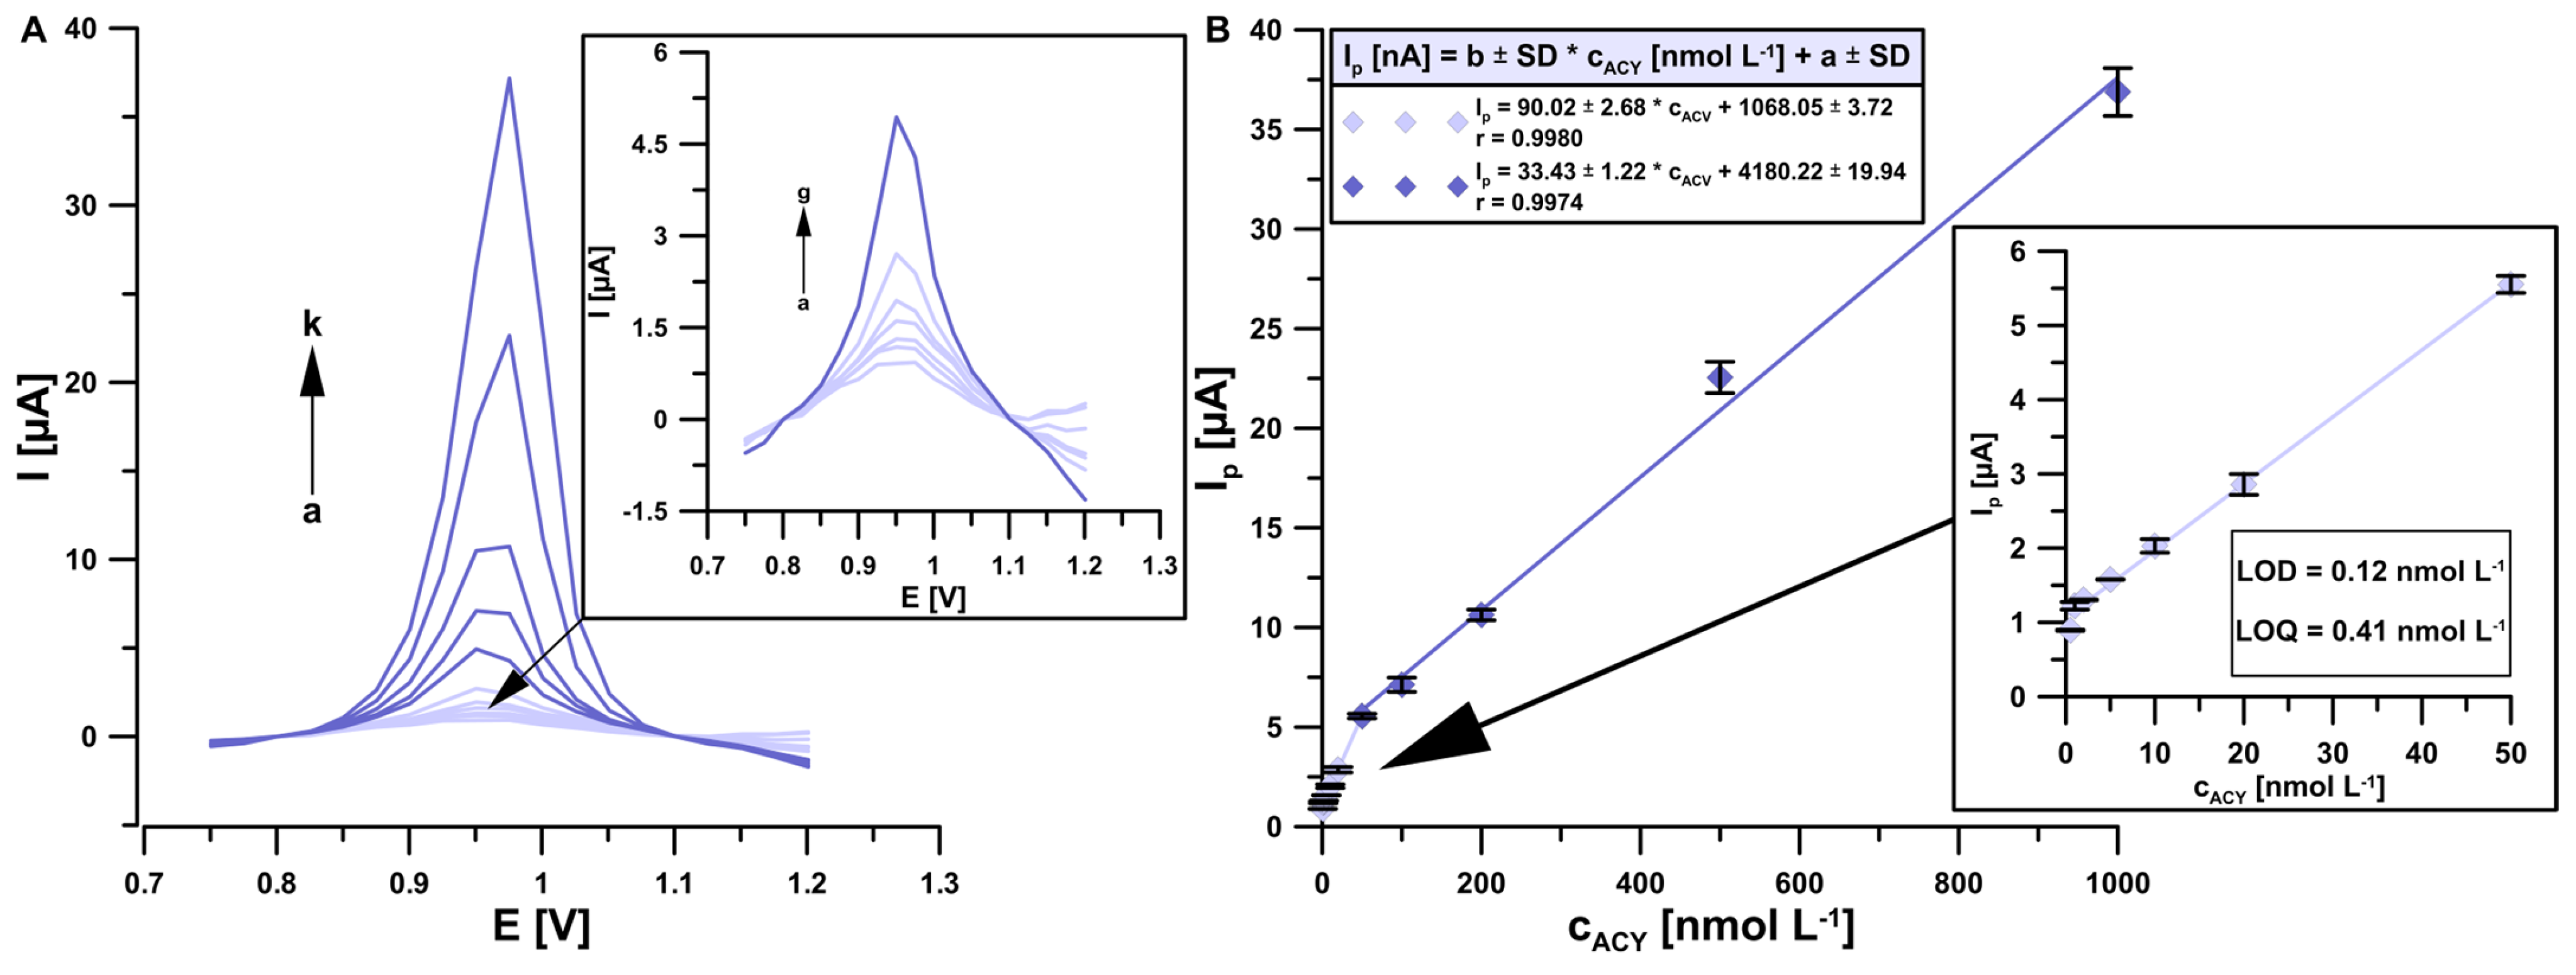
| DPAdSV (aSPCE) | 0.5–50.0 50.0–1000.0 | 90.24 | 0.12 | Tablets | This work |
2. Materials and Methods
2.1. Apparatus
2.2. SPCE Activation Procedure
2.3. Supporting Electrolyte Composition and Other Reagents
2.4. Acyclovir and Interferent Standards Preparation
2.5. Pharmaceuticals Preparation
2.6. Acyclovir DPAdSV Analysis
3. Results
3.1. Selection of the Sensor and Influence of Electrochemical Activation on ACY Signal
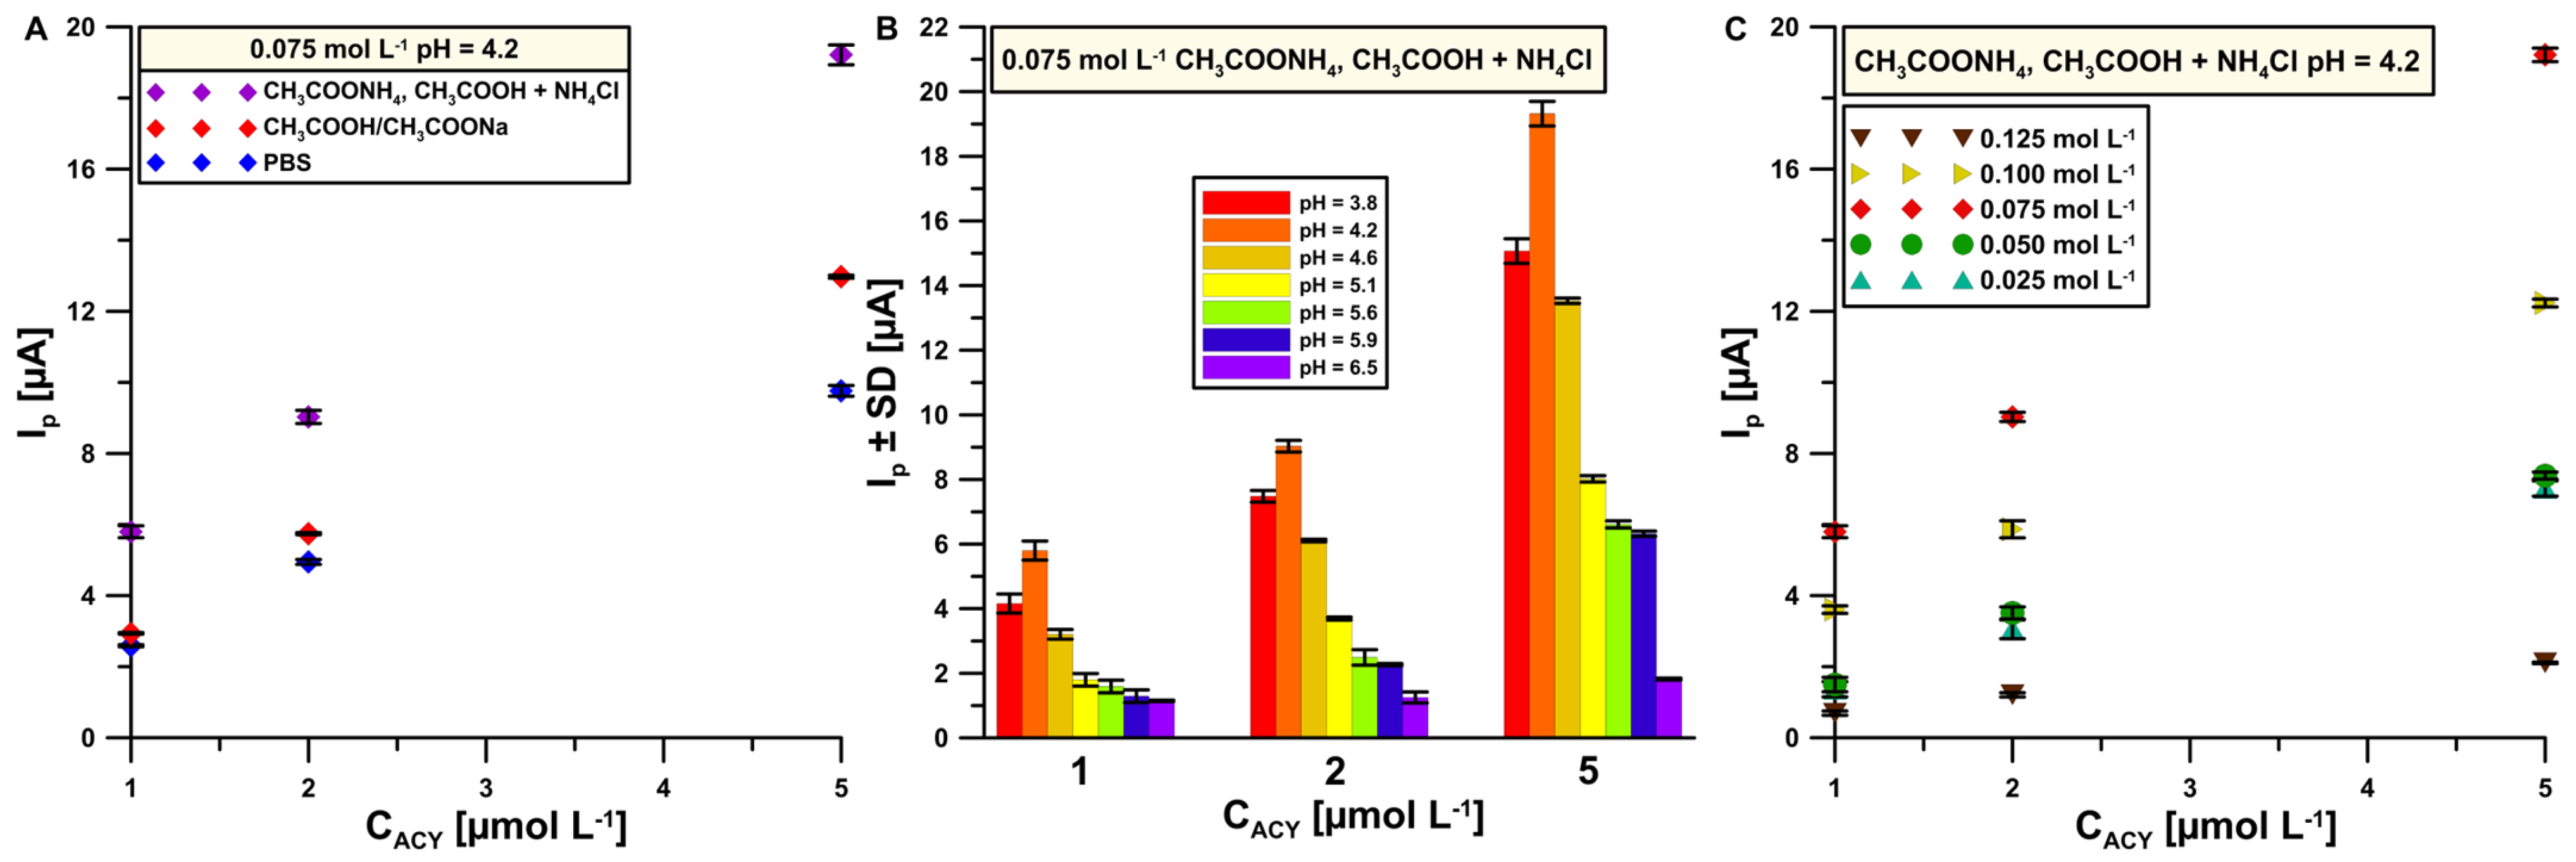
3.2. Supporting Electrolyte Composition—Impact of Concentration and pH Value
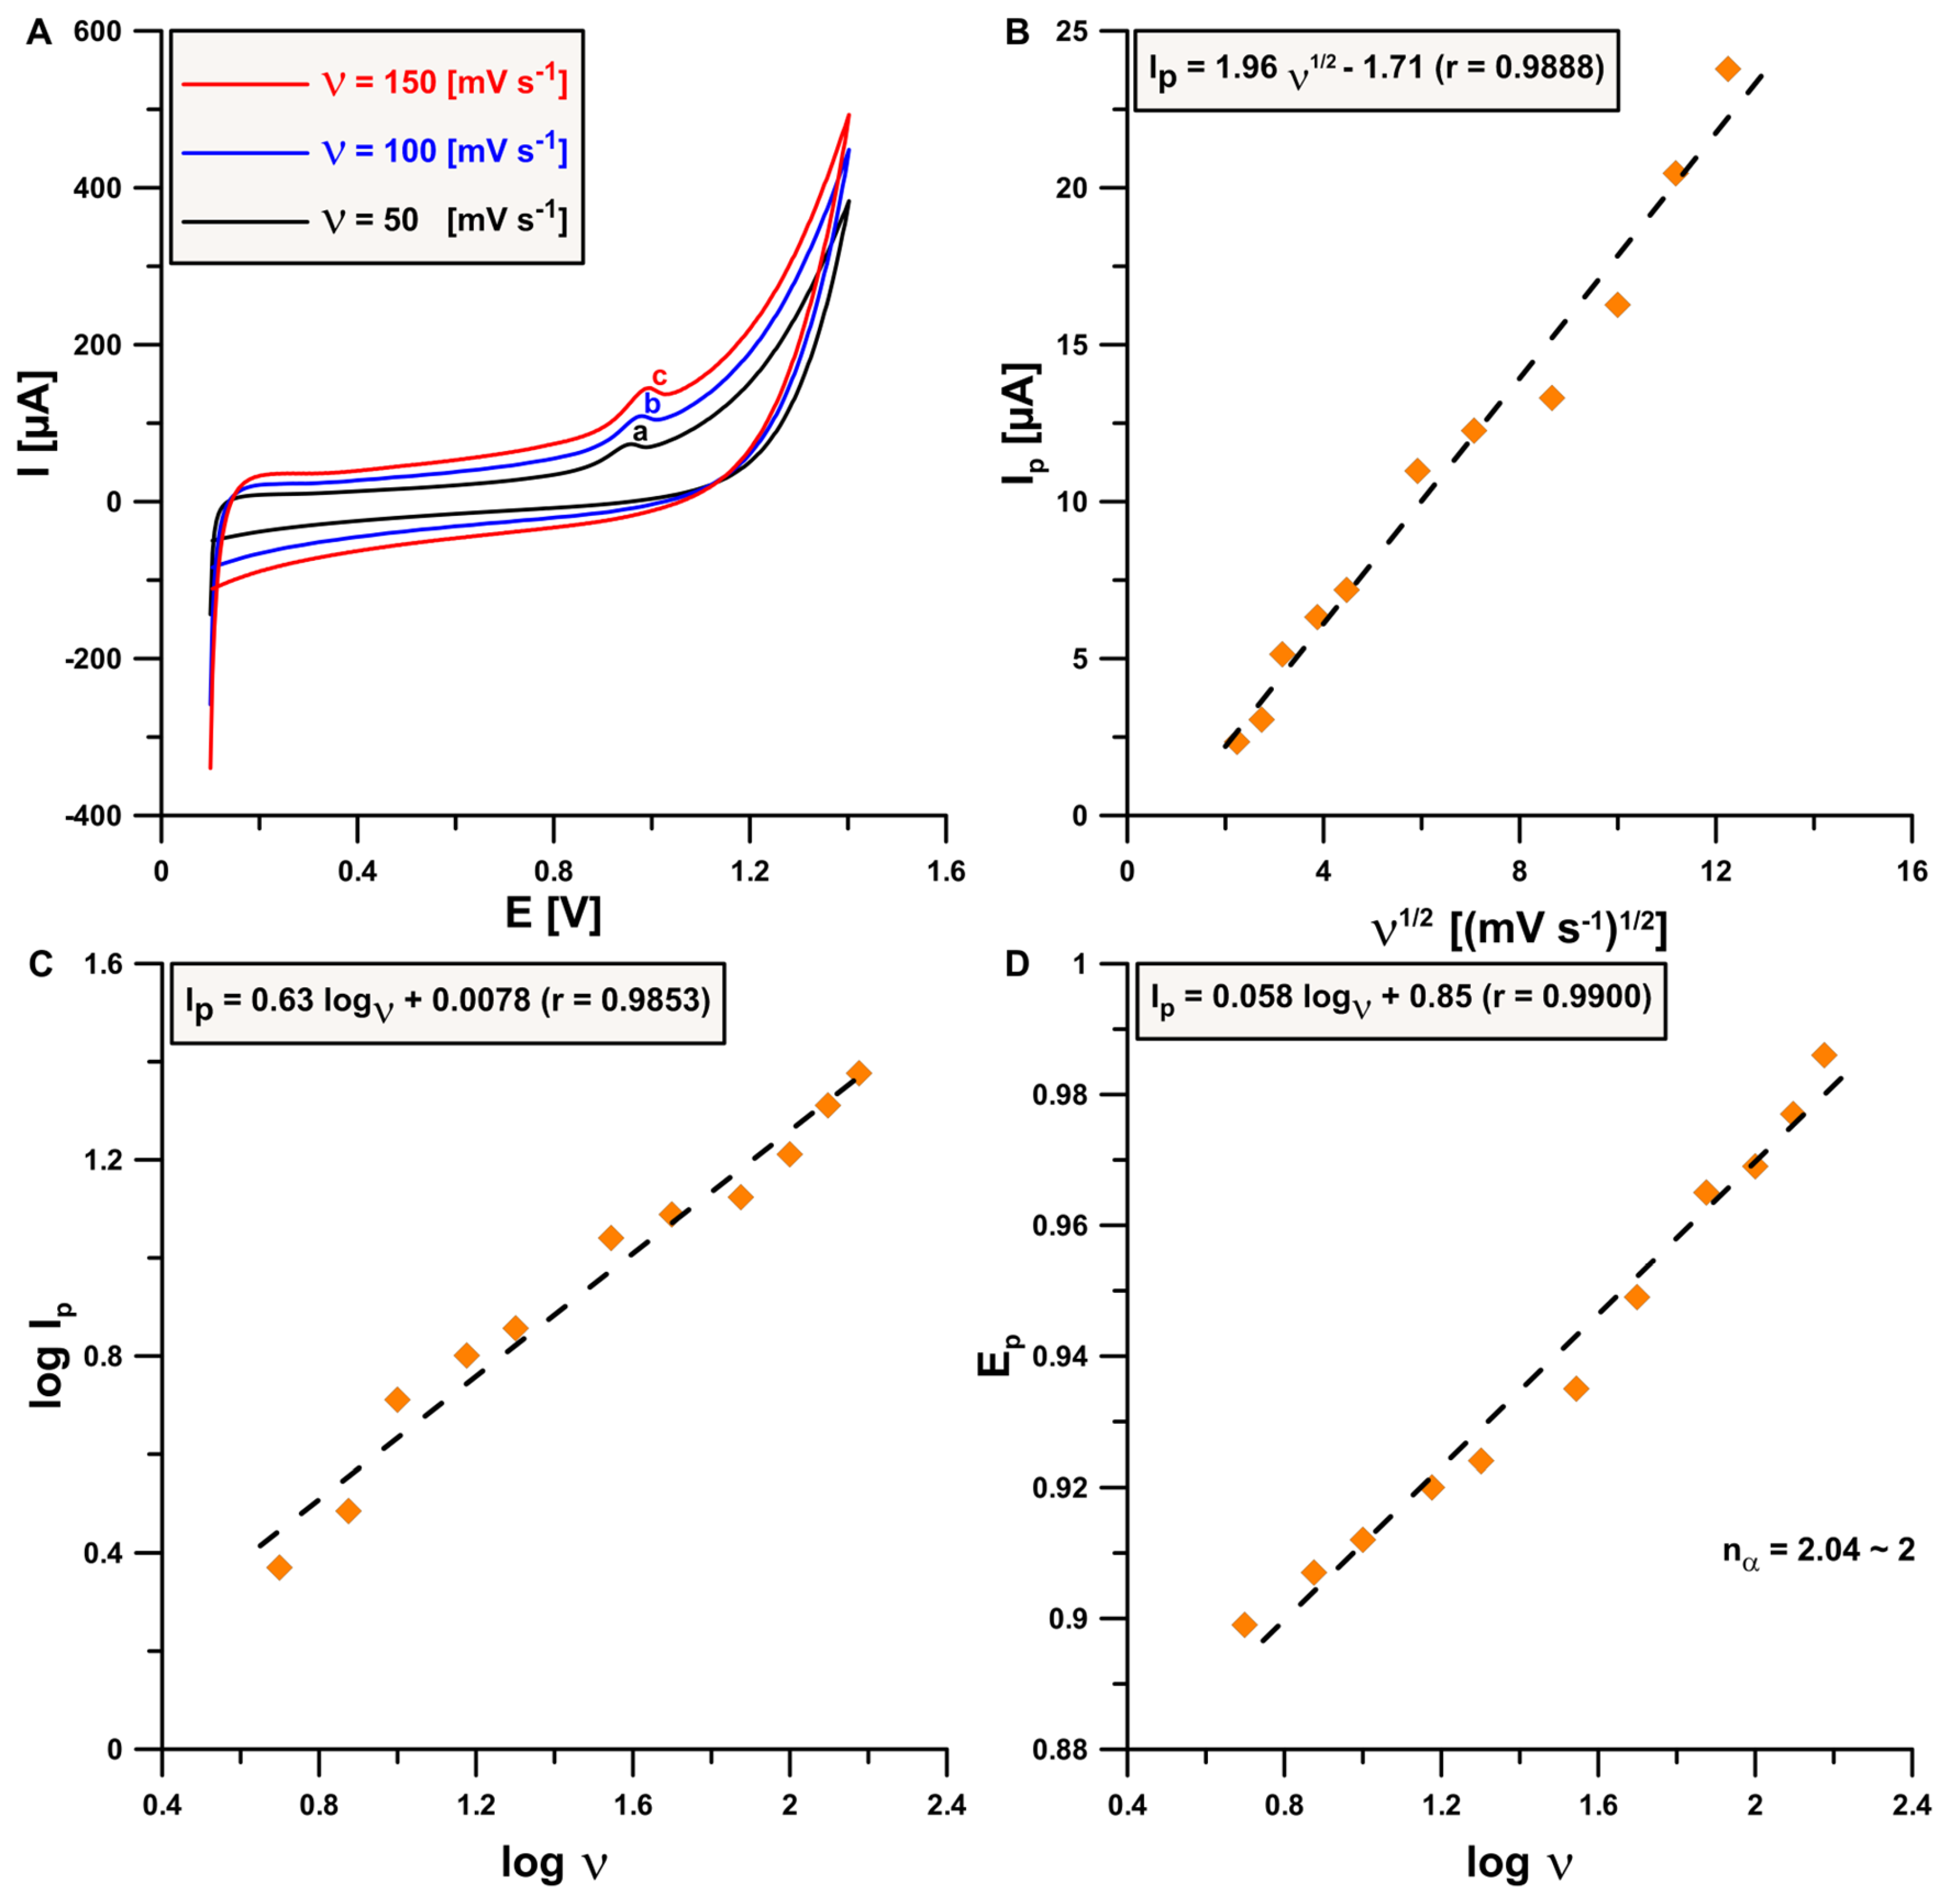
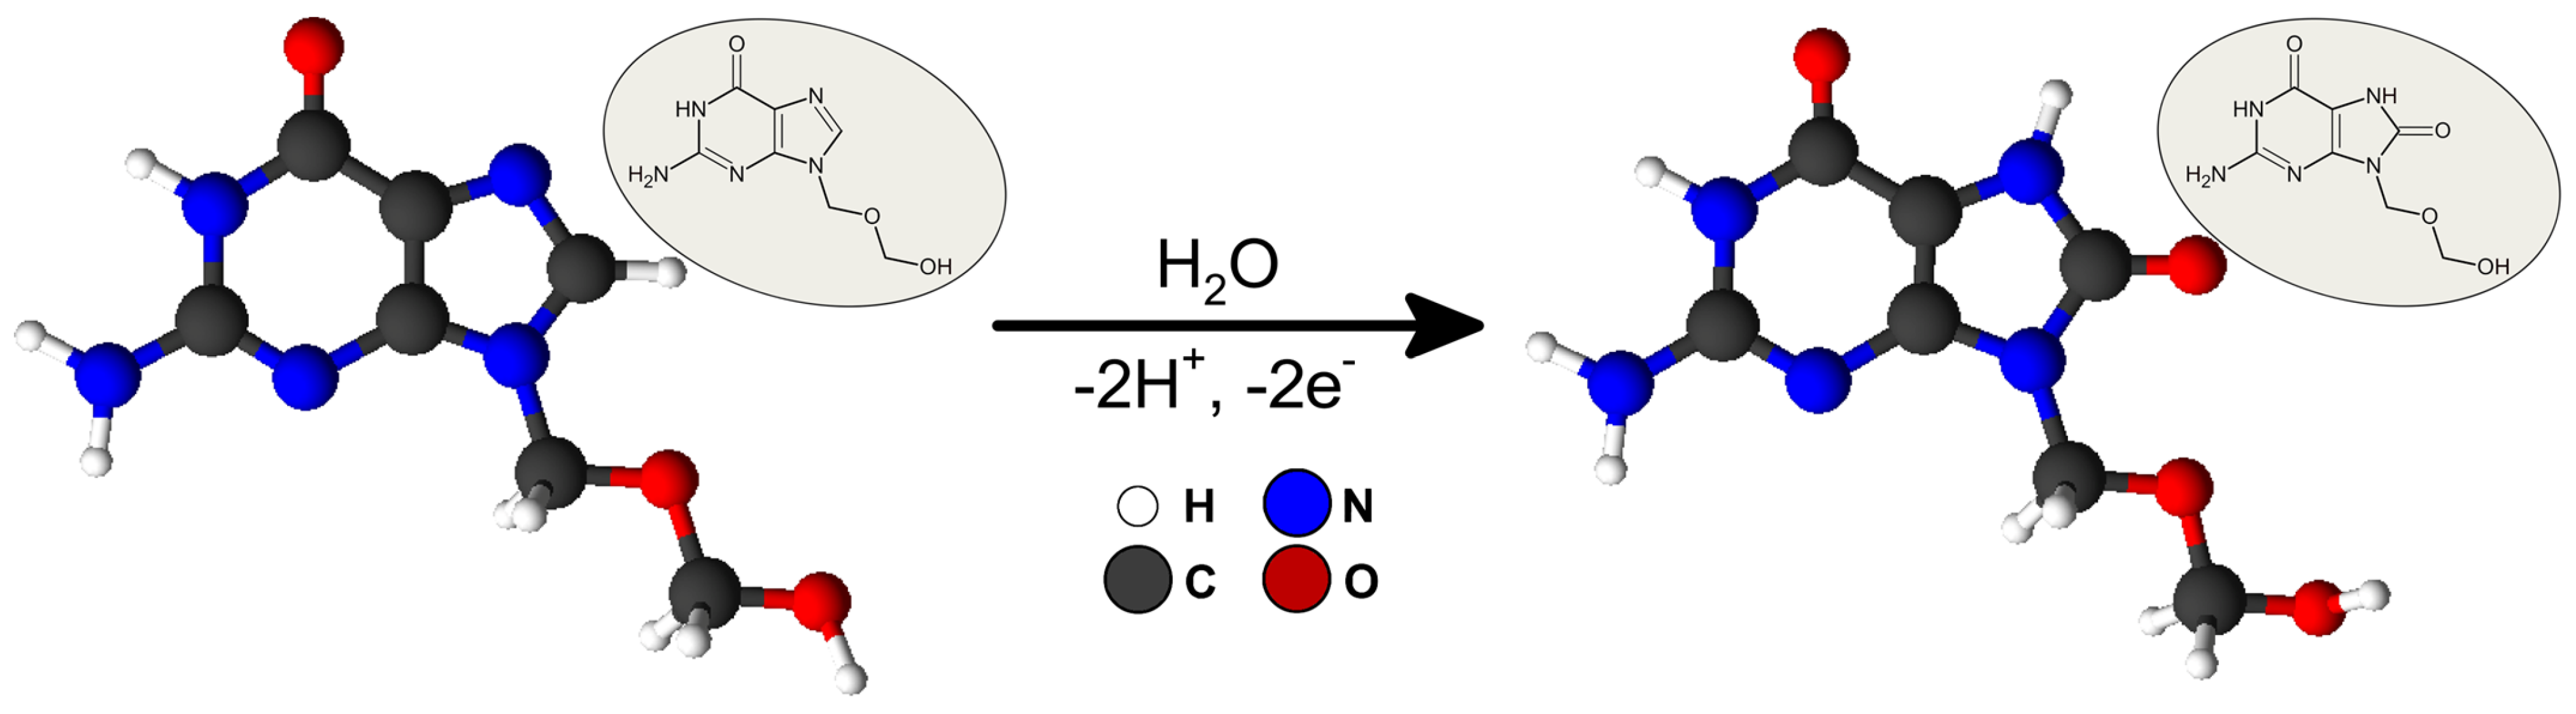
3.3. Acyclovir Electrochemical Behavior
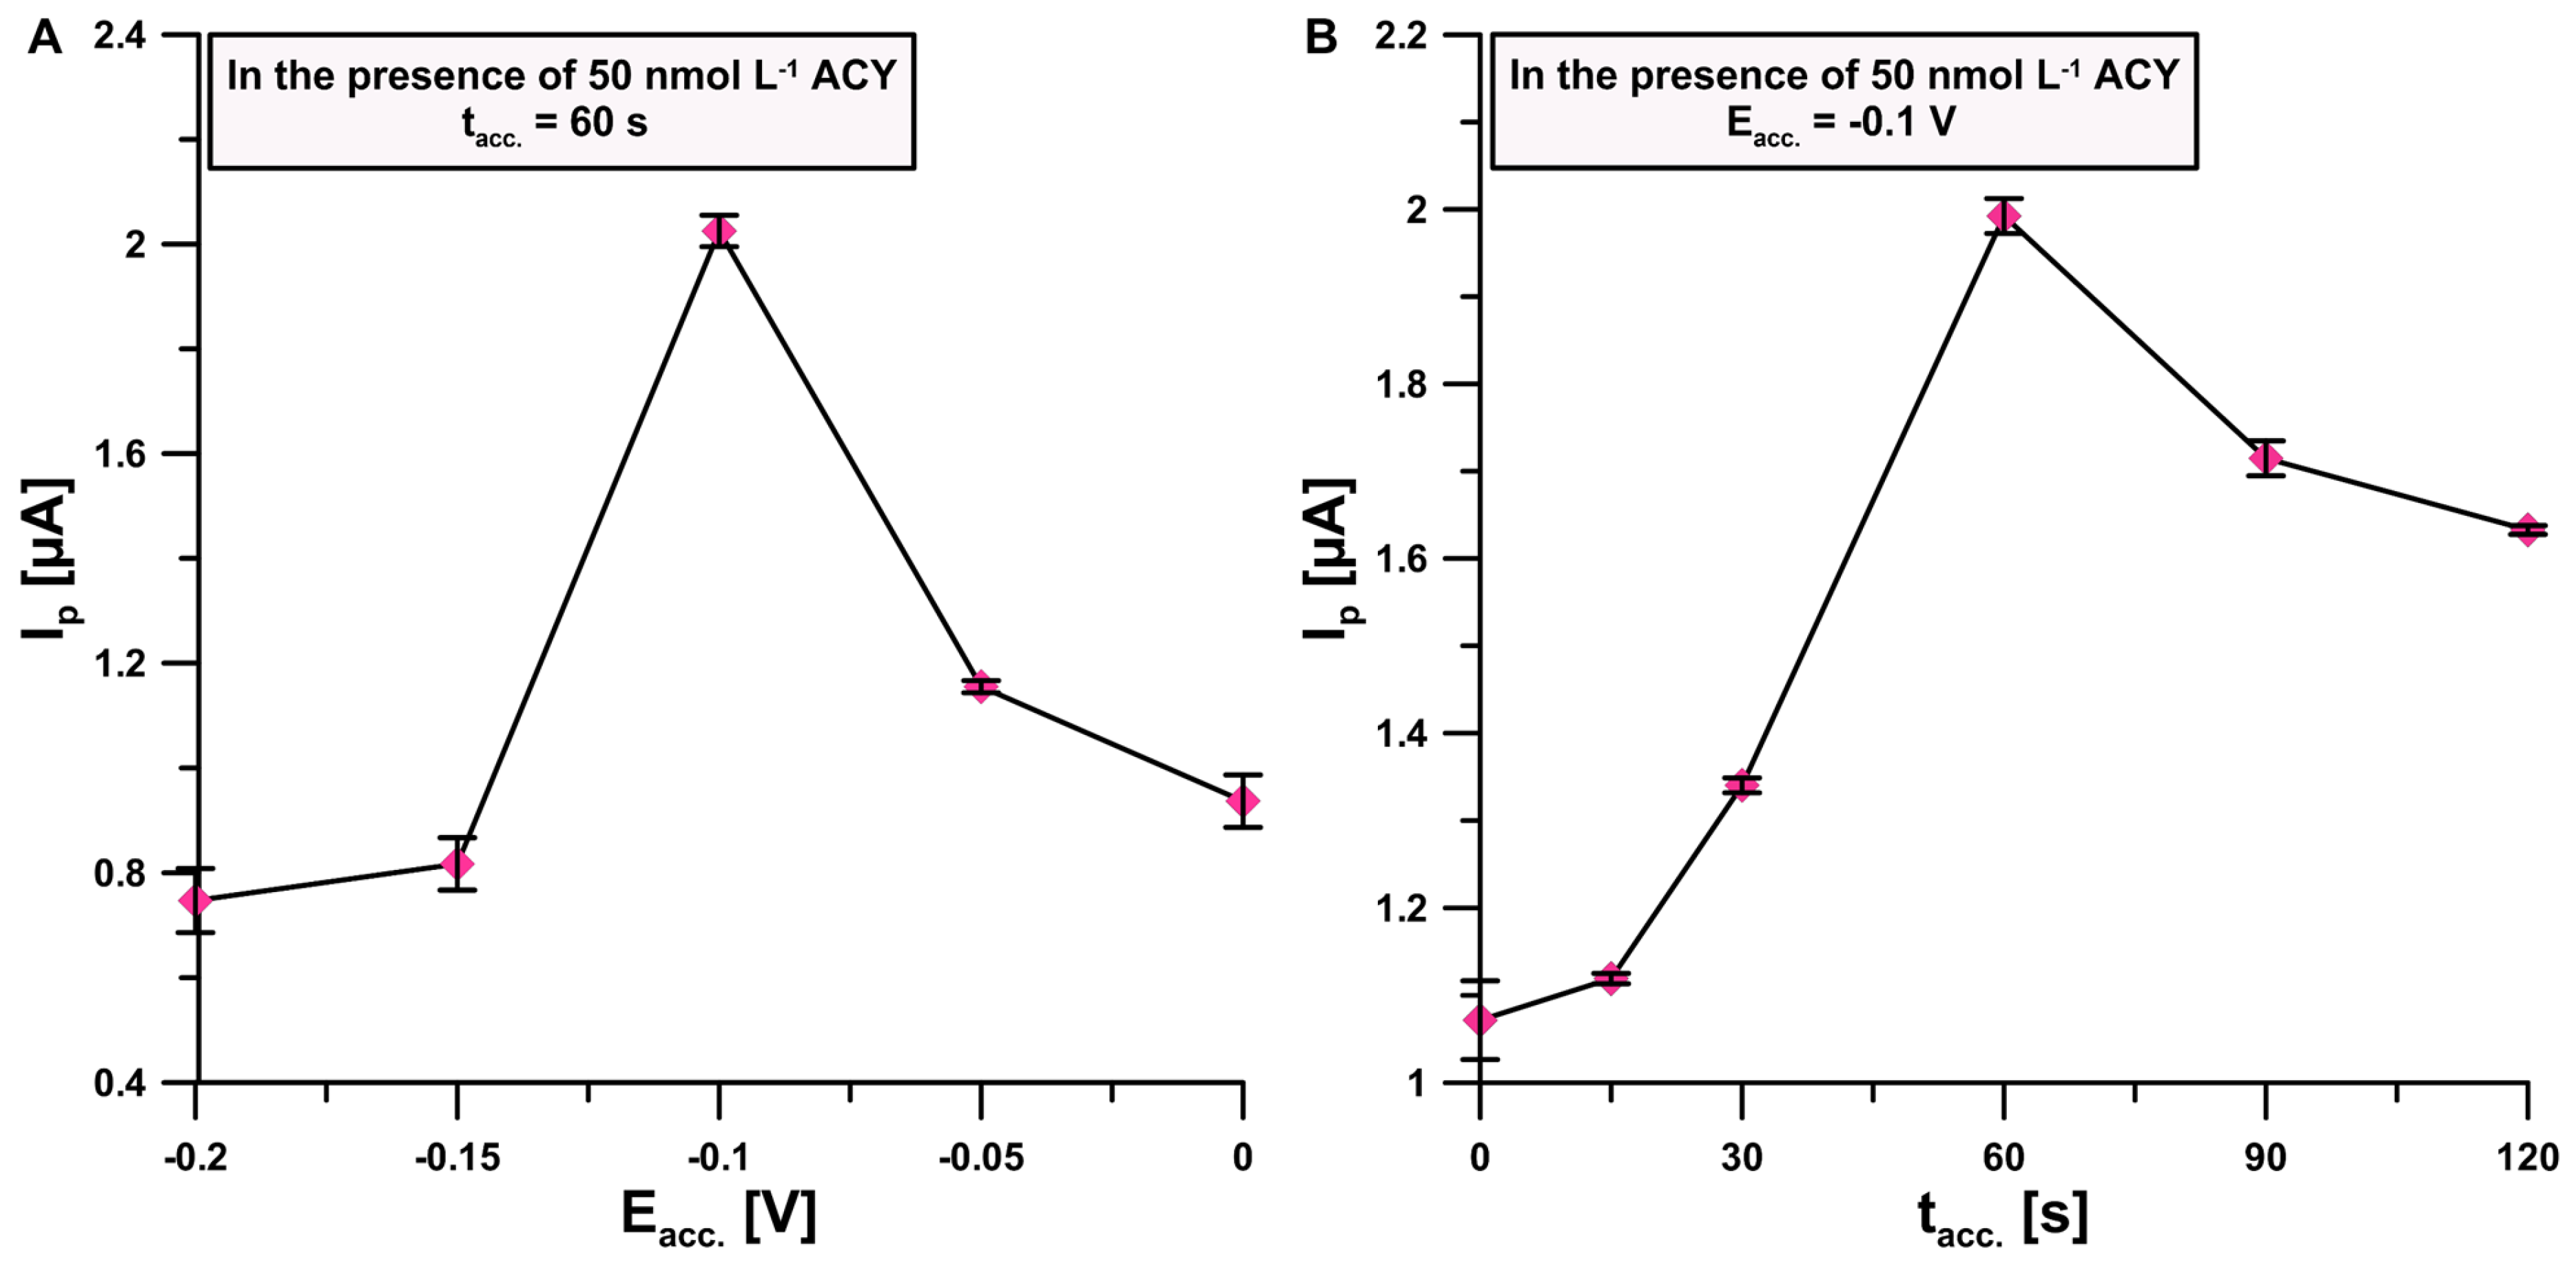
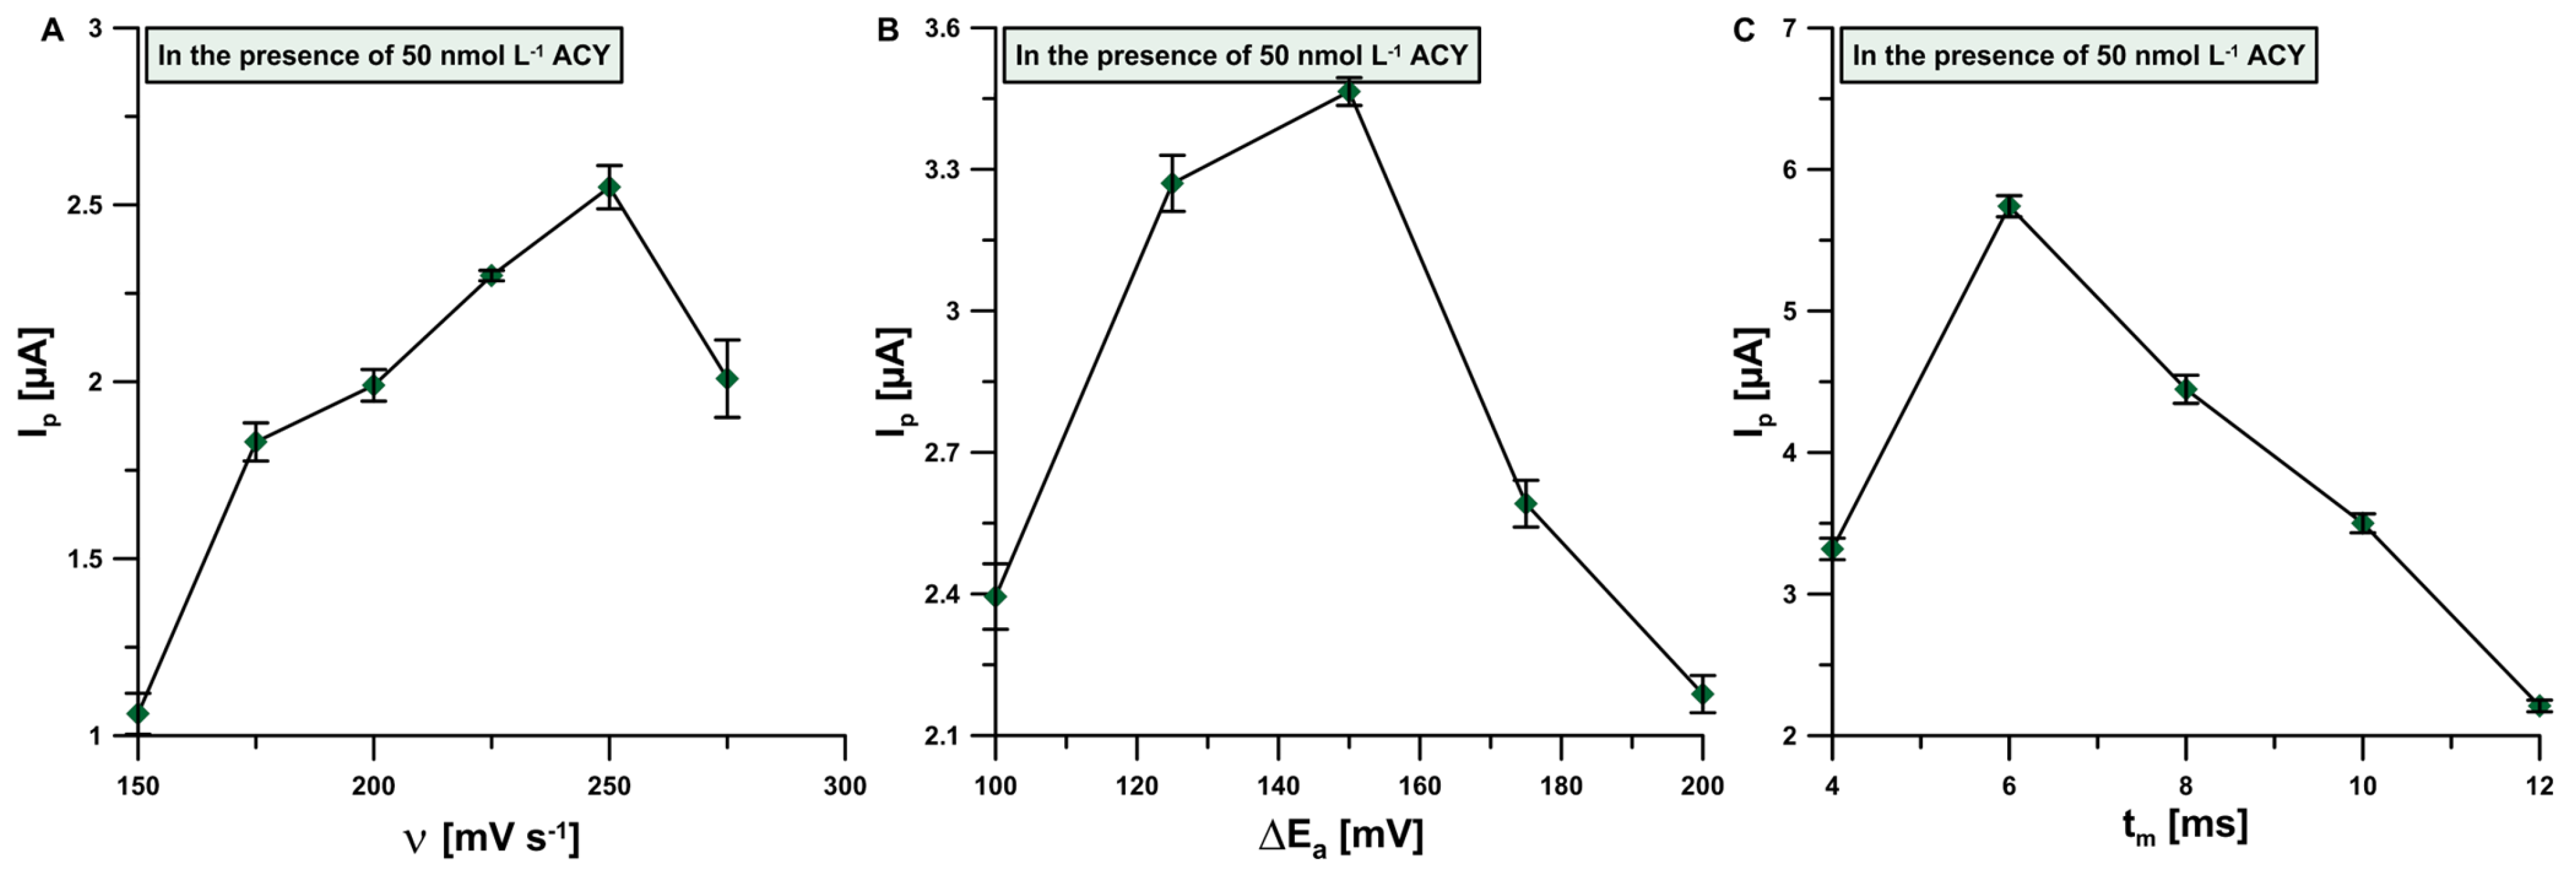
3.4. Optimization of Signal Registration Technique Parameters
3.5. Analytical Parameters and Robustness Studies
3.6. Analysis of Pharmaceuticals
4. Conclusions
Author Contributions
Funding
Institutional Review Board Statement
Informed Consent Statement
Data Availability Statement
Conflicts of Interest
References
- Schalkwijk, H.H.; Snoeck, R.; Andrei, G. Acyclovir Resistance in Herpes Simplex Viruses: Prevalence and Therapeutic Alternatives. Biochem. Pharmacol. 2022, 206, 115322. [Google Scholar] [CrossRef] [PubMed]
- Malik, S.; Sah, R.; Ahsan, O.; Muhammad, K.; Waheed, Y. Insights into the Novel Therapeutics and Vaccines against Herpes Simplex Virus. Vaccines 2023, 11, 325. [Google Scholar] [CrossRef] [PubMed]
- Suazo, P.A.; Tognarelli, E.I.; Kalergis, A.M.; González, P.A. Herpes Simplex Virus 2 Infection: Molecular Association with HIV and Novel Microbicides to Prevent Disease. Med. Microbiol. Immunol. 2015, 204, 161–176. [Google Scholar] [CrossRef] [PubMed]
- Shahrokhian, S.; Azimzadeh, M.; Amini, M.K. Modification of Glassy Carbon Electrode with a Bilayer of Multiwalled Carbon Nanotube/Tiron-Doped Polypyrrole: Application to Sensitive Voltammetric Determination of Acyclovir. Mater. Sci. Eng. C 2015, 53, 134–141. [Google Scholar] [CrossRef] [PubMed]
- Shetti, N.P.; Malode, S.J.; Nandibewoor, S.T. Electrochemical Behavior of an Antiviral Drug Acyclovir at Fullerene-C60-Modified Glassy Carbon Electrode. Bioelectrochemistry 2012, 88, 76–83. [Google Scholar] [CrossRef] [PubMed]
- Wei, Y.-P.; Yao, L.-Y.; Wu, Y.-Y.; Liu, X.; Peng, L.-H.; Tian, Y.-L.; Ding, J.-H.; Li, K.-H.; He, Q.-G. Critical Review of Synthesis, Toxicology and Detection of Acyclovir. Molecules 2021, 26, 6566. [Google Scholar] [CrossRef] [PubMed]
- Gupta, A.; Vyas, R.K.; Gupta, A.B. Occurrence of Acyclovir in the Aquatic Environment, Its Removal and Research Perspectives: A Review. J. Water Process Eng. 2021, 39, 101855. [Google Scholar] [CrossRef]
- Yu, L.; Xiang, B. Quantitative Determination of Acyclovir in Plasma by near Infrared Spectroscopy. Microchem. J. 2008, 90, 63–66. [Google Scholar] [CrossRef]
- Ayad, M.M.; Abdellatef, H.E.; El-Henawee, M.M.; El-Sayed, H.M. Spectrophotometric and Spectrofluorimetric Methods for Analysis of Acyclovir and Acebutolol Hydrochloride. Spectrochim. Acta. A Mol. Biomol. Spectrosc. 2007, 66, 106–110. [Google Scholar] [CrossRef]
- Shao, C. Quantification of Acyclovir in Human Plasma by Ultra-High-Performance Liquid Chromatography—Heated Electrospray Ionization—Tandem Mass Spectrometry for Bioequivalence Evaluation. J. Anal. Bioanal. Tech. 2012, 3, 139. [Google Scholar] [CrossRef]
- Yuan, X.; Ma, L.; Zhang, J.; Zheng, Y. Simple Pre-Treatment by Low-Level Oxygen Plasma Activates Screen-Printed Carbon Electrode: Potential for Mass Production. Appl. Surf. Sci. 2021, 544, 148760. [Google Scholar] [CrossRef]
- Kozak, J.; Tyszczuk-Rotko, K.; Wójciak, M.; Sowa, I.; Rotko, M. First Screen-Printed Sensor (Electrochemically Activated Screen-Printed Boron-Doped Diamond Electrode) for Quantitative Determination of Rifampicin by Adsorptive Stripping Voltammetry. Materials 2021, 14, 4231. [Google Scholar] [CrossRef] [PubMed]
- Kozak, J.; Tyszczuk-Rotko, K.; Gorylewski, D. A nanoporous screen-printed carbon sensor for environmental and clinical monitoring of the antibiotic ciprofloxacin. Measurement 2023, 222, 113626. [Google Scholar] [CrossRef]
- Tyszczuk-Rotko, K.; Gorylewski, D.; Kozak, J. Supporting Electrolyte Manipulation for Simple Improvement of the Sensitivity of Trace Vanadium(V) Determination at a Lead-Coated Glassy Carbon Electrode. Sensors 2022, 22, 8209. [Google Scholar] [CrossRef] [PubMed]
- Tyszczuk-Rotko, K.; Jędruchniewicz, K. Ultrasensitive Sensor for Uranium Monitoring in Water Ecosystems. J. Electrochem. Soc. 2019, 166, B837–B844. [Google Scholar] [CrossRef]
- Jędruchniewicz, K.; Tyszczuk-Rotko, K. A New Modified Screen-Printed Sensor for Monitoring of Ultratrace Concentrations of Mo(VI). J. Electroanal. Chem. 2019, 847, 113228. [Google Scholar] [CrossRef]
- Saleh, G.A.; Askal, H.F.; Refaat, I.H.; Abdel-aal, F.A.M. Adsorptive Square Wave Voltammetric Determination of Acyclovir and Its Application in a Pharmacokinetic Study Using a Novel Sensor of β-Cyclodextrin Modified Pencil Graphite Electrode. Bull. Chem. Soc. Jpn. 2015, 88, 1291–1300. [Google Scholar] [CrossRef]
- Lotfi, Z.; Gholivand, M.B.; Shamsipur, M.; Mirzaei, M. An Electrochemical Sensor Based on Ag Nanoparticles Decorated on Cadmium Sulfide Nanowires/Reduced Graphene Oxide for the Determination of Acyclovir. J. Alloys Compd. 2022, 903, 163912. [Google Scholar] [CrossRef]
- Tarlekar, P.; Khan, A.; Chatterjee, S. Nanoscale Determination of Antiviral Drug Acyclovir Engaging Bifunctionality of Single Walled Carbon Nanotubes—Nafion Film. J. Pharm. Biomed. Anal. 2018, 151, 1–9. [Google Scholar] [CrossRef]
- Castro, A.A.; Cordoves, A.I.P.; Farias, P.A.M. Determination of the Antiretroviral Drug Acyclovir in Diluted Alkaline Electrolyte by Adsorptive Stripping Voltammetry at the Mercury Film Electrode. Anal. Chem. Insights 2013, 8, ACI.S11608. [Google Scholar] [CrossRef]
- Shetti, N.P.; Malode, S.J.; Nayak, D.S.; Naik, R.R.; Kuchinad, G.T.; Reddy, K.R.; Shukla, S.S.; Aminabhavi, T.M. Hetero-Nanostructured Iron Oxide and Bentonite Clay Composite Assembly for the Determination of an Antiviral Drug Acyclovir. Microchem. J. 2020, 155, 104727. [Google Scholar] [CrossRef]
- Atta, N.F.; Galal, A.; Ahmed, Y.M. New Strategy for Determination of Anti-Viral Drugs Based on Highly Conductive Layered Composite of MnO2/Graphene/Ionic Liquid Crystal/Carbon Nanotubes. J. Electroanal. Chem. 2019, 838, 107–118. [Google Scholar] [CrossRef]
- Lalei, M.; Zarei, K. Fabrication of RuNPs/TBA/PGE and Its Application for the Electrochemical Determination of Trace Amounts of Acyclovir. Microchem. J. 2023, 190, 108667. [Google Scholar] [CrossRef]
- Shetti, N.P.; Nayak, D.S.; Malode, S.J.; Kulkarni, R.M. Nano Molar Detection of Acyclovir, an Antiviral Drug at Nanoclay Modified Carbon Paste Electrode. Sens. Bio-Sens. Res. 2017, 14, 39–46. [Google Scholar] [CrossRef]
- Gosser, D.K. Cyclic Voltammetry: Simulation and Analysis of Reaction Mechanisms; VCH: New York, NY, USA, 1993; ISBN 978-1-56081-026-1. [Google Scholar]
- Laviron, E. General Expression of the Linear Potential Sweep Voltammogram in the Case of Diffusionless Electrochemical Systems. J. Electroanal. Chem. Interfacial Electrochem. 1979, 101, 19–28. [Google Scholar] [CrossRef]
- Martínez-Rojas, F.; Del-Valle, M.A.; Isaacs, M.; Ramírez, G.; Armijo, F. Electrochemical Behaviour Study and Determination of Guanine, 6-Thioguanine, Acyclovir and Gancyclovir on Fluorine-Doped SnO2 Electrode. Application in Pharmaceutical Preparations. Electroanalysis 2017, 29, 2888–2895. [Google Scholar] [CrossRef]
- Dilgin, D.G.; Karakaya, S. Differential Pulse Voltammetric Determination of Acyclovir in Pharmaceutical Preparations Using a Pencil Graphite Electrode. Mater. Sci. Eng. C 2016, 63, 570–576. [Google Scholar] [CrossRef] [PubMed]
- Mocak, J.; Bond, A.M.; Mitchell, S.; Scollary, G. A Statistical Overview of Standard (IUPAC and ACS) and New Procedures for Determining the Limits of Detection and Quantification: Application to Voltammetric and Stripping Techniques. Pure Appl. Chem. 1997, 69, 297–328. [Google Scholar] [CrossRef]

| Parameter | Sample (Declared Value = 200 mg of Acyclovir per Tablet) |
|---|---|
| Tablet a | |
| Found ± SD (n = 3) | 187.11 ± 1.95 mg |
| Recovery | 93.56% |
| Coefficient of variation | 1.04% |
| Tablet b | |
| Found ± SD (n = 3) | 186.90 ± 5.10 mg |
| Recovery | 93.45% |
| Coefficient of variation | 2.73% |
Disclaimer/Publisher’s Note: The statements, opinions and data contained in all publications are solely those of the individual author(s) and contributor(s) and not of MDPI and/or the editor(s). MDPI and/or the editor(s) disclaim responsibility for any injury to people or property resulting from any ideas, methods, instructions or products referred to in the content. |
© 2024 by the authors. Licensee MDPI, Basel, Switzerland. This article is an open access article distributed under the terms and conditions of the Creative Commons Attribution (CC BY) license (https://creativecommons.org/licenses/by/4.0/).
Share and Cite
Tyszczuk-Rotko, K.; Staniec, K.; Gorylewski, D.; Keller, A. First Acyclovir Determination Procedure via Electrochemically Activated Screen-Printed Carbon Electrode Coupled with Well-Conductive Base Electrolyte. Sensors 2024, 24, 1125. https://doi.org/10.3390/s24041125
Tyszczuk-Rotko K, Staniec K, Gorylewski D, Keller A. First Acyclovir Determination Procedure via Electrochemically Activated Screen-Printed Carbon Electrode Coupled with Well-Conductive Base Electrolyte. Sensors. 2024; 24(4):1125. https://doi.org/10.3390/s24041125
Chicago/Turabian StyleTyszczuk-Rotko, Katarzyna, Katarzyna Staniec, Damian Gorylewski, and Aleksy Keller. 2024. "First Acyclovir Determination Procedure via Electrochemically Activated Screen-Printed Carbon Electrode Coupled with Well-Conductive Base Electrolyte" Sensors 24, no. 4: 1125. https://doi.org/10.3390/s24041125
APA StyleTyszczuk-Rotko, K., Staniec, K., Gorylewski, D., & Keller, A. (2024). First Acyclovir Determination Procedure via Electrochemically Activated Screen-Printed Carbon Electrode Coupled with Well-Conductive Base Electrolyte. Sensors, 24(4), 1125. https://doi.org/10.3390/s24041125