
Automatic Radar-Based Step Length Measurement in the Home for Older Adults Living with Frailty

 ,
,
Abstract
1. Introduction
- Introduction of the first radar-based step length measurement in an unrestricted home environment by automatically selecting optimal walk sequences within the home to measure step lengths.
- Provision of a comprehensive evaluation of the proposed in-home step length measurement for both reliability, through test–retest reliability testing, and validity, by correlating with established in-clinic step length measurements. This evaluation is conducted with frail older adults in their own homes over a two-week period.
- Presentation of a thorough in-clinic validation of step length measurement involving frail older adults undergoing five different types of walks.
2. Related Works
3. Hardware
3.1. Clinical Setup
3.2. Home Setup
4. Proposed Approach
4.1. Radar Point Cloud
4.2. Detection and Tracking
4.3. Tracks in the Clinic
4.4. Tracks in the Home
4.4.1. Track Segmentation
4.4.2. Track Filtering
4.5. Step Length Measurement
4.5.1. Torso Speed
4.5.2. Average Peak-to-Peak Distance
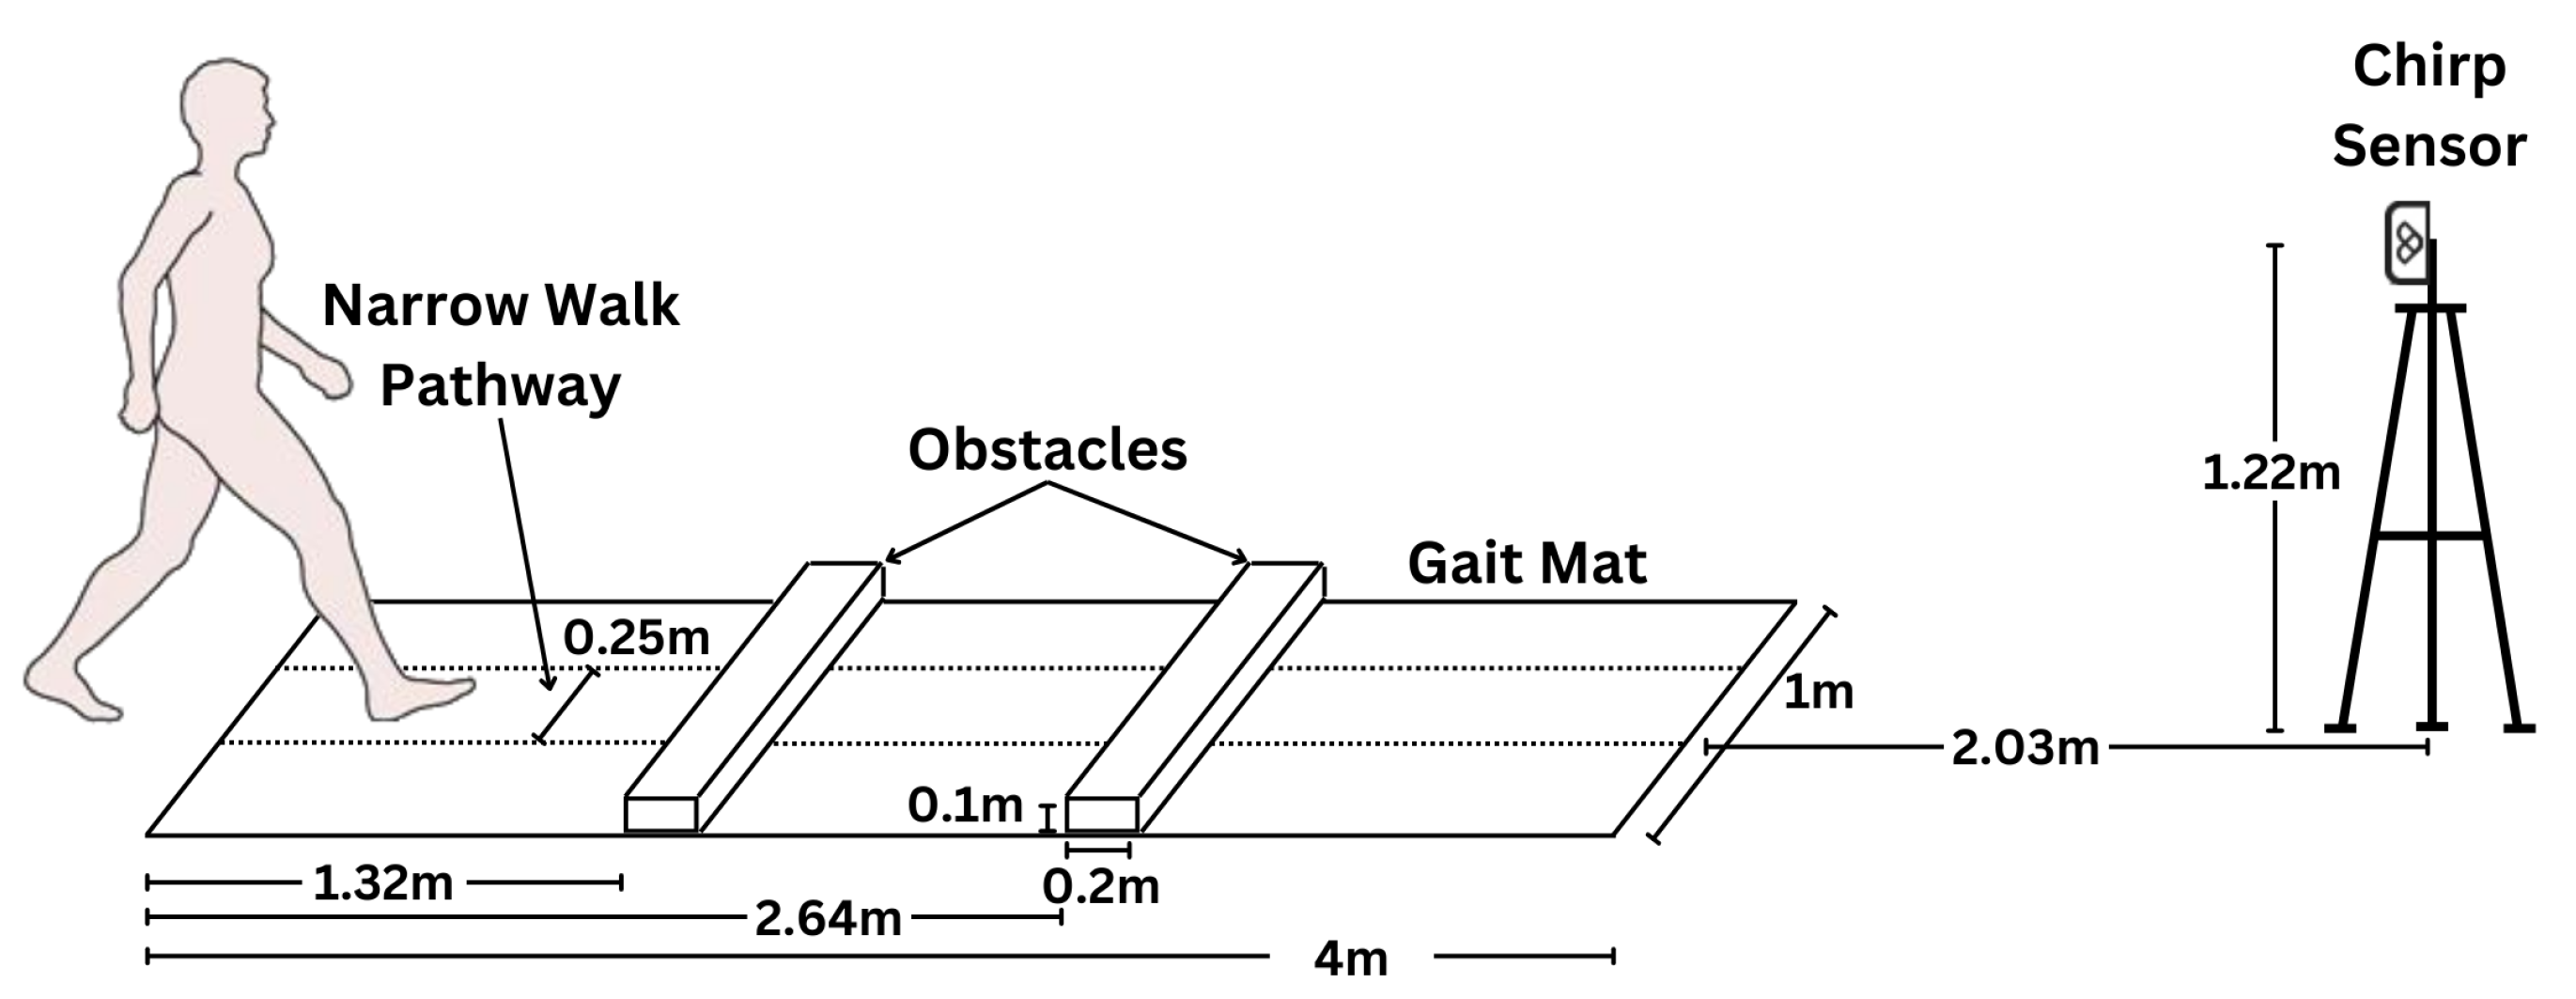
5. Experiment Setup
5.1. Clinic Setup
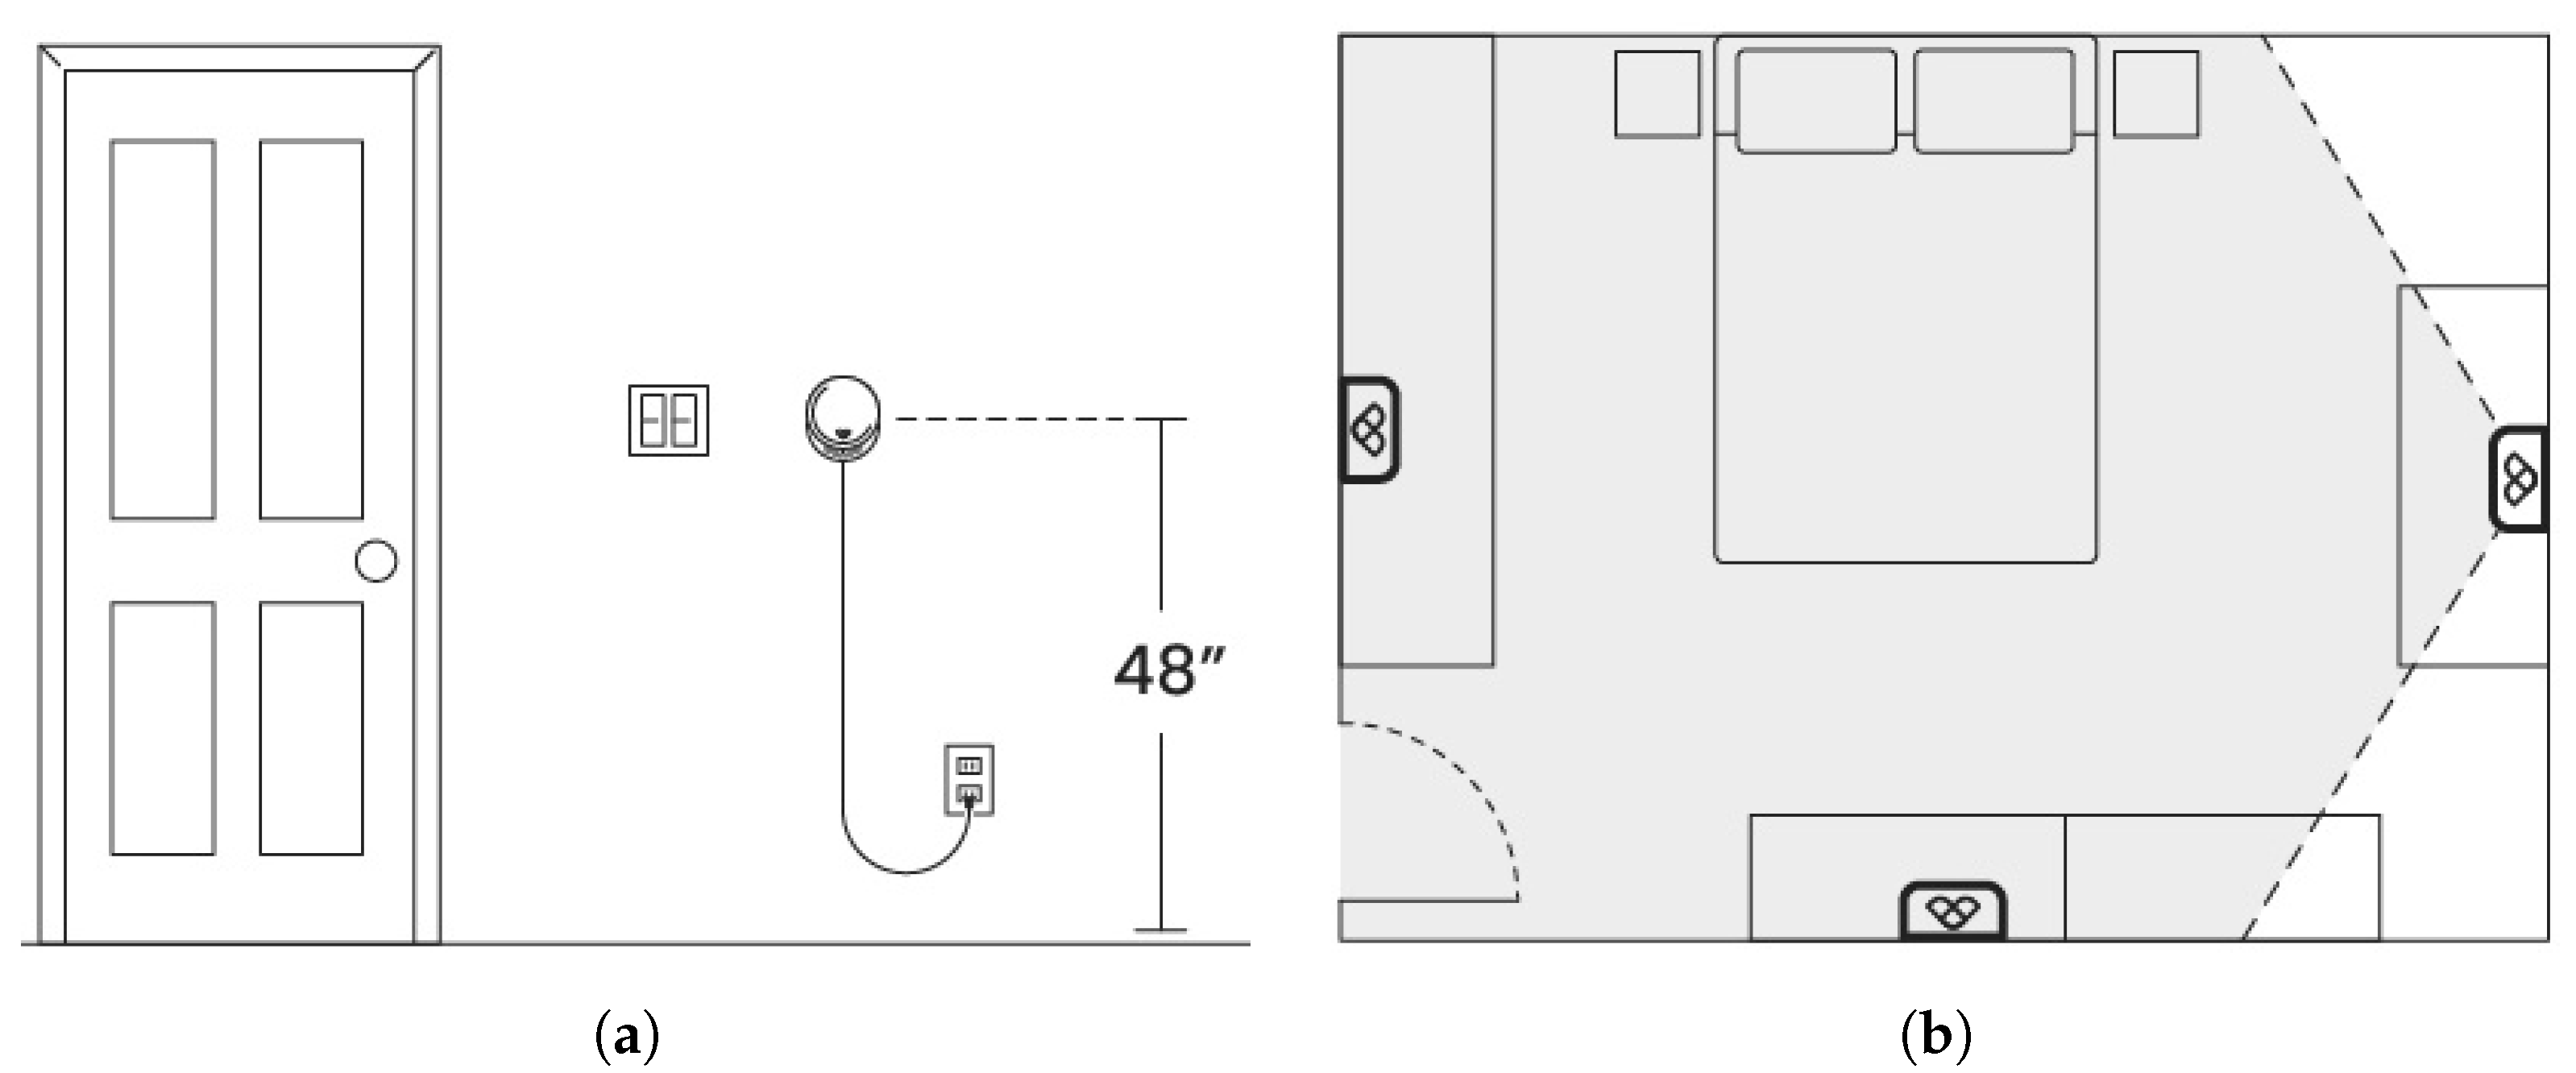
5.2. Home
6. Algorithm Parameters
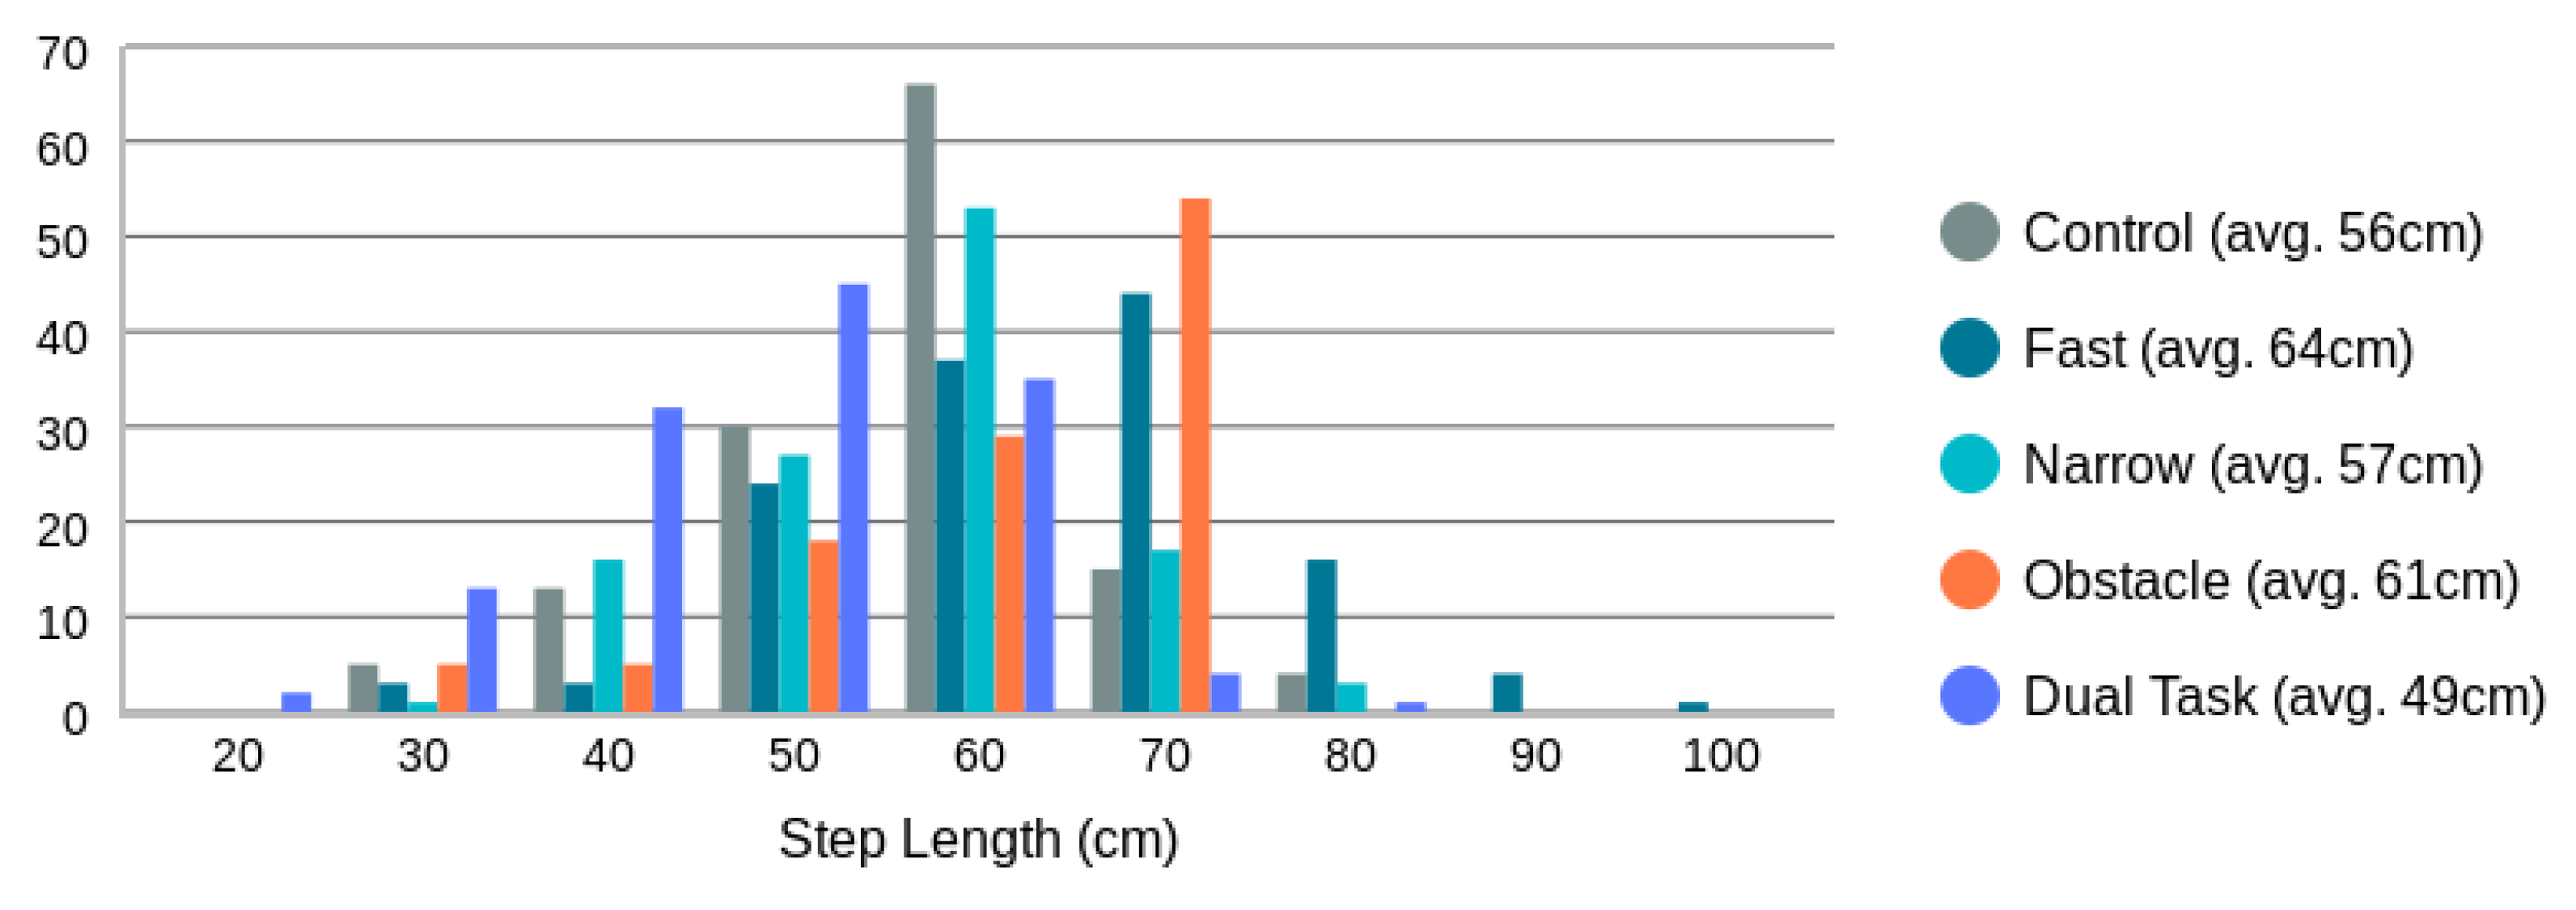
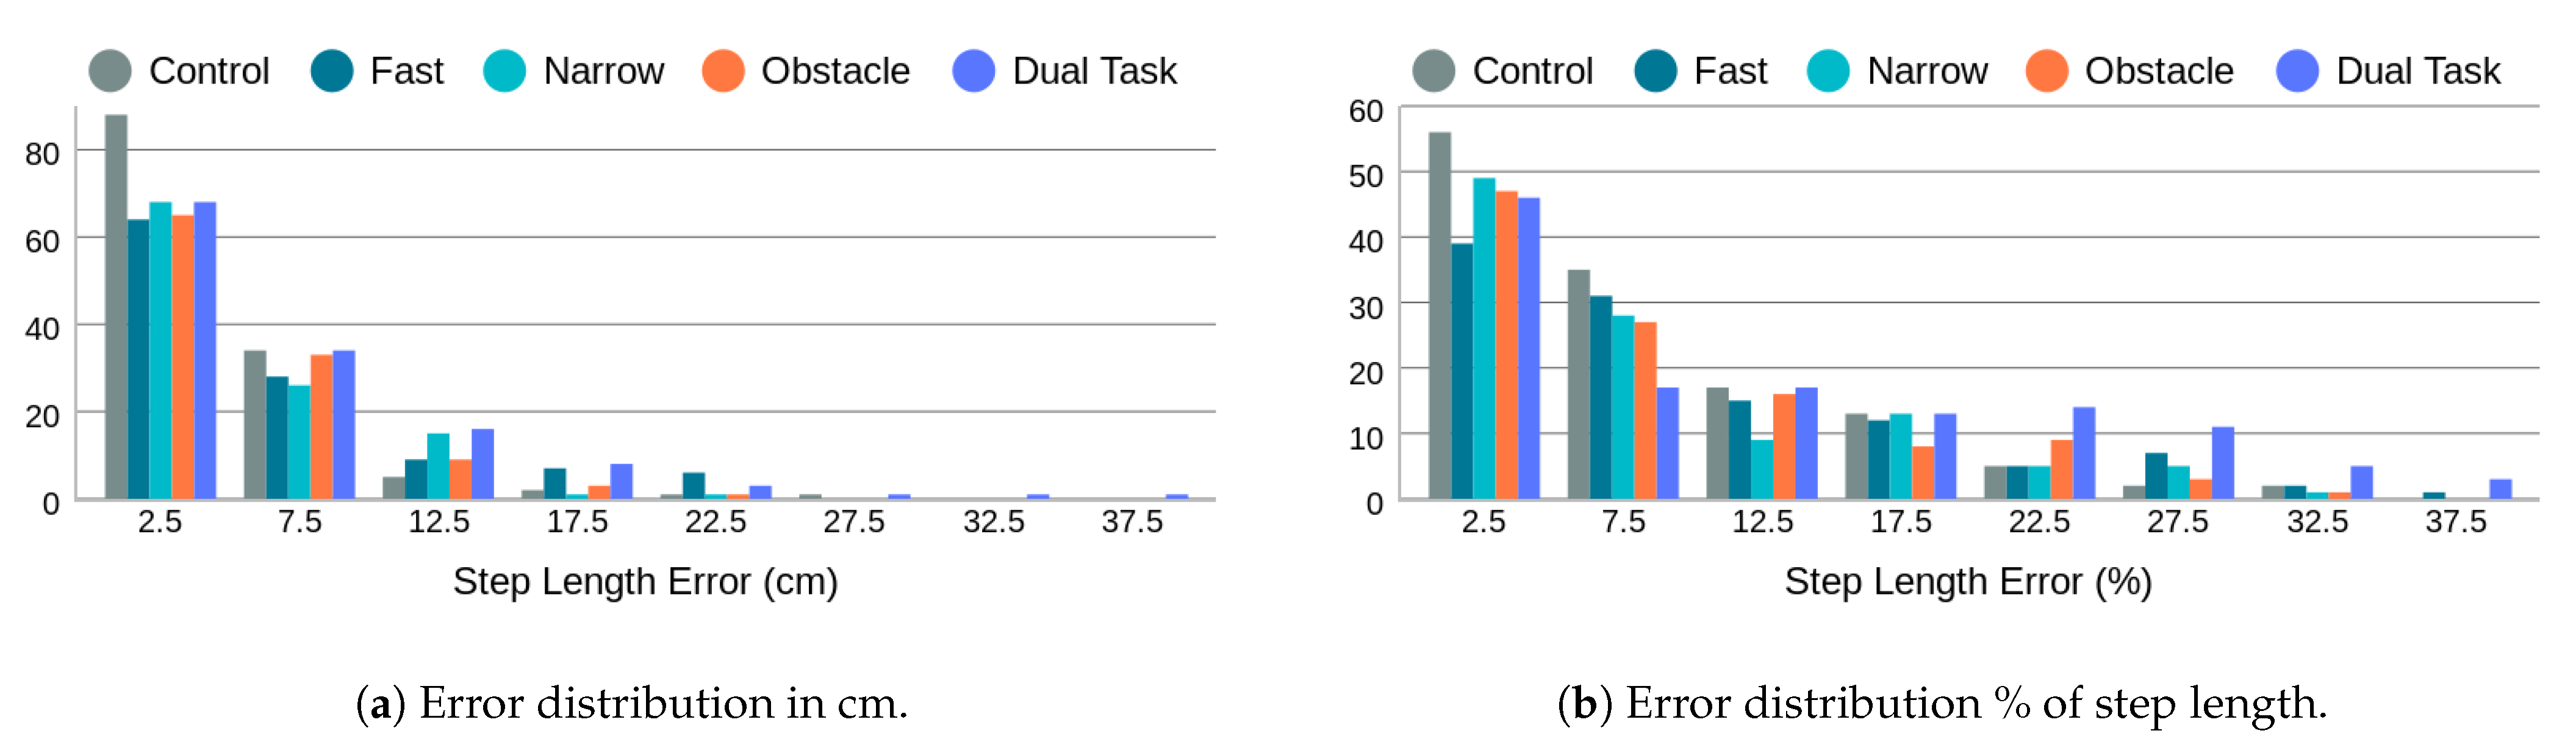
7. In-Clinic Step Length Evaluation
7.1. Step Length Detection Rate
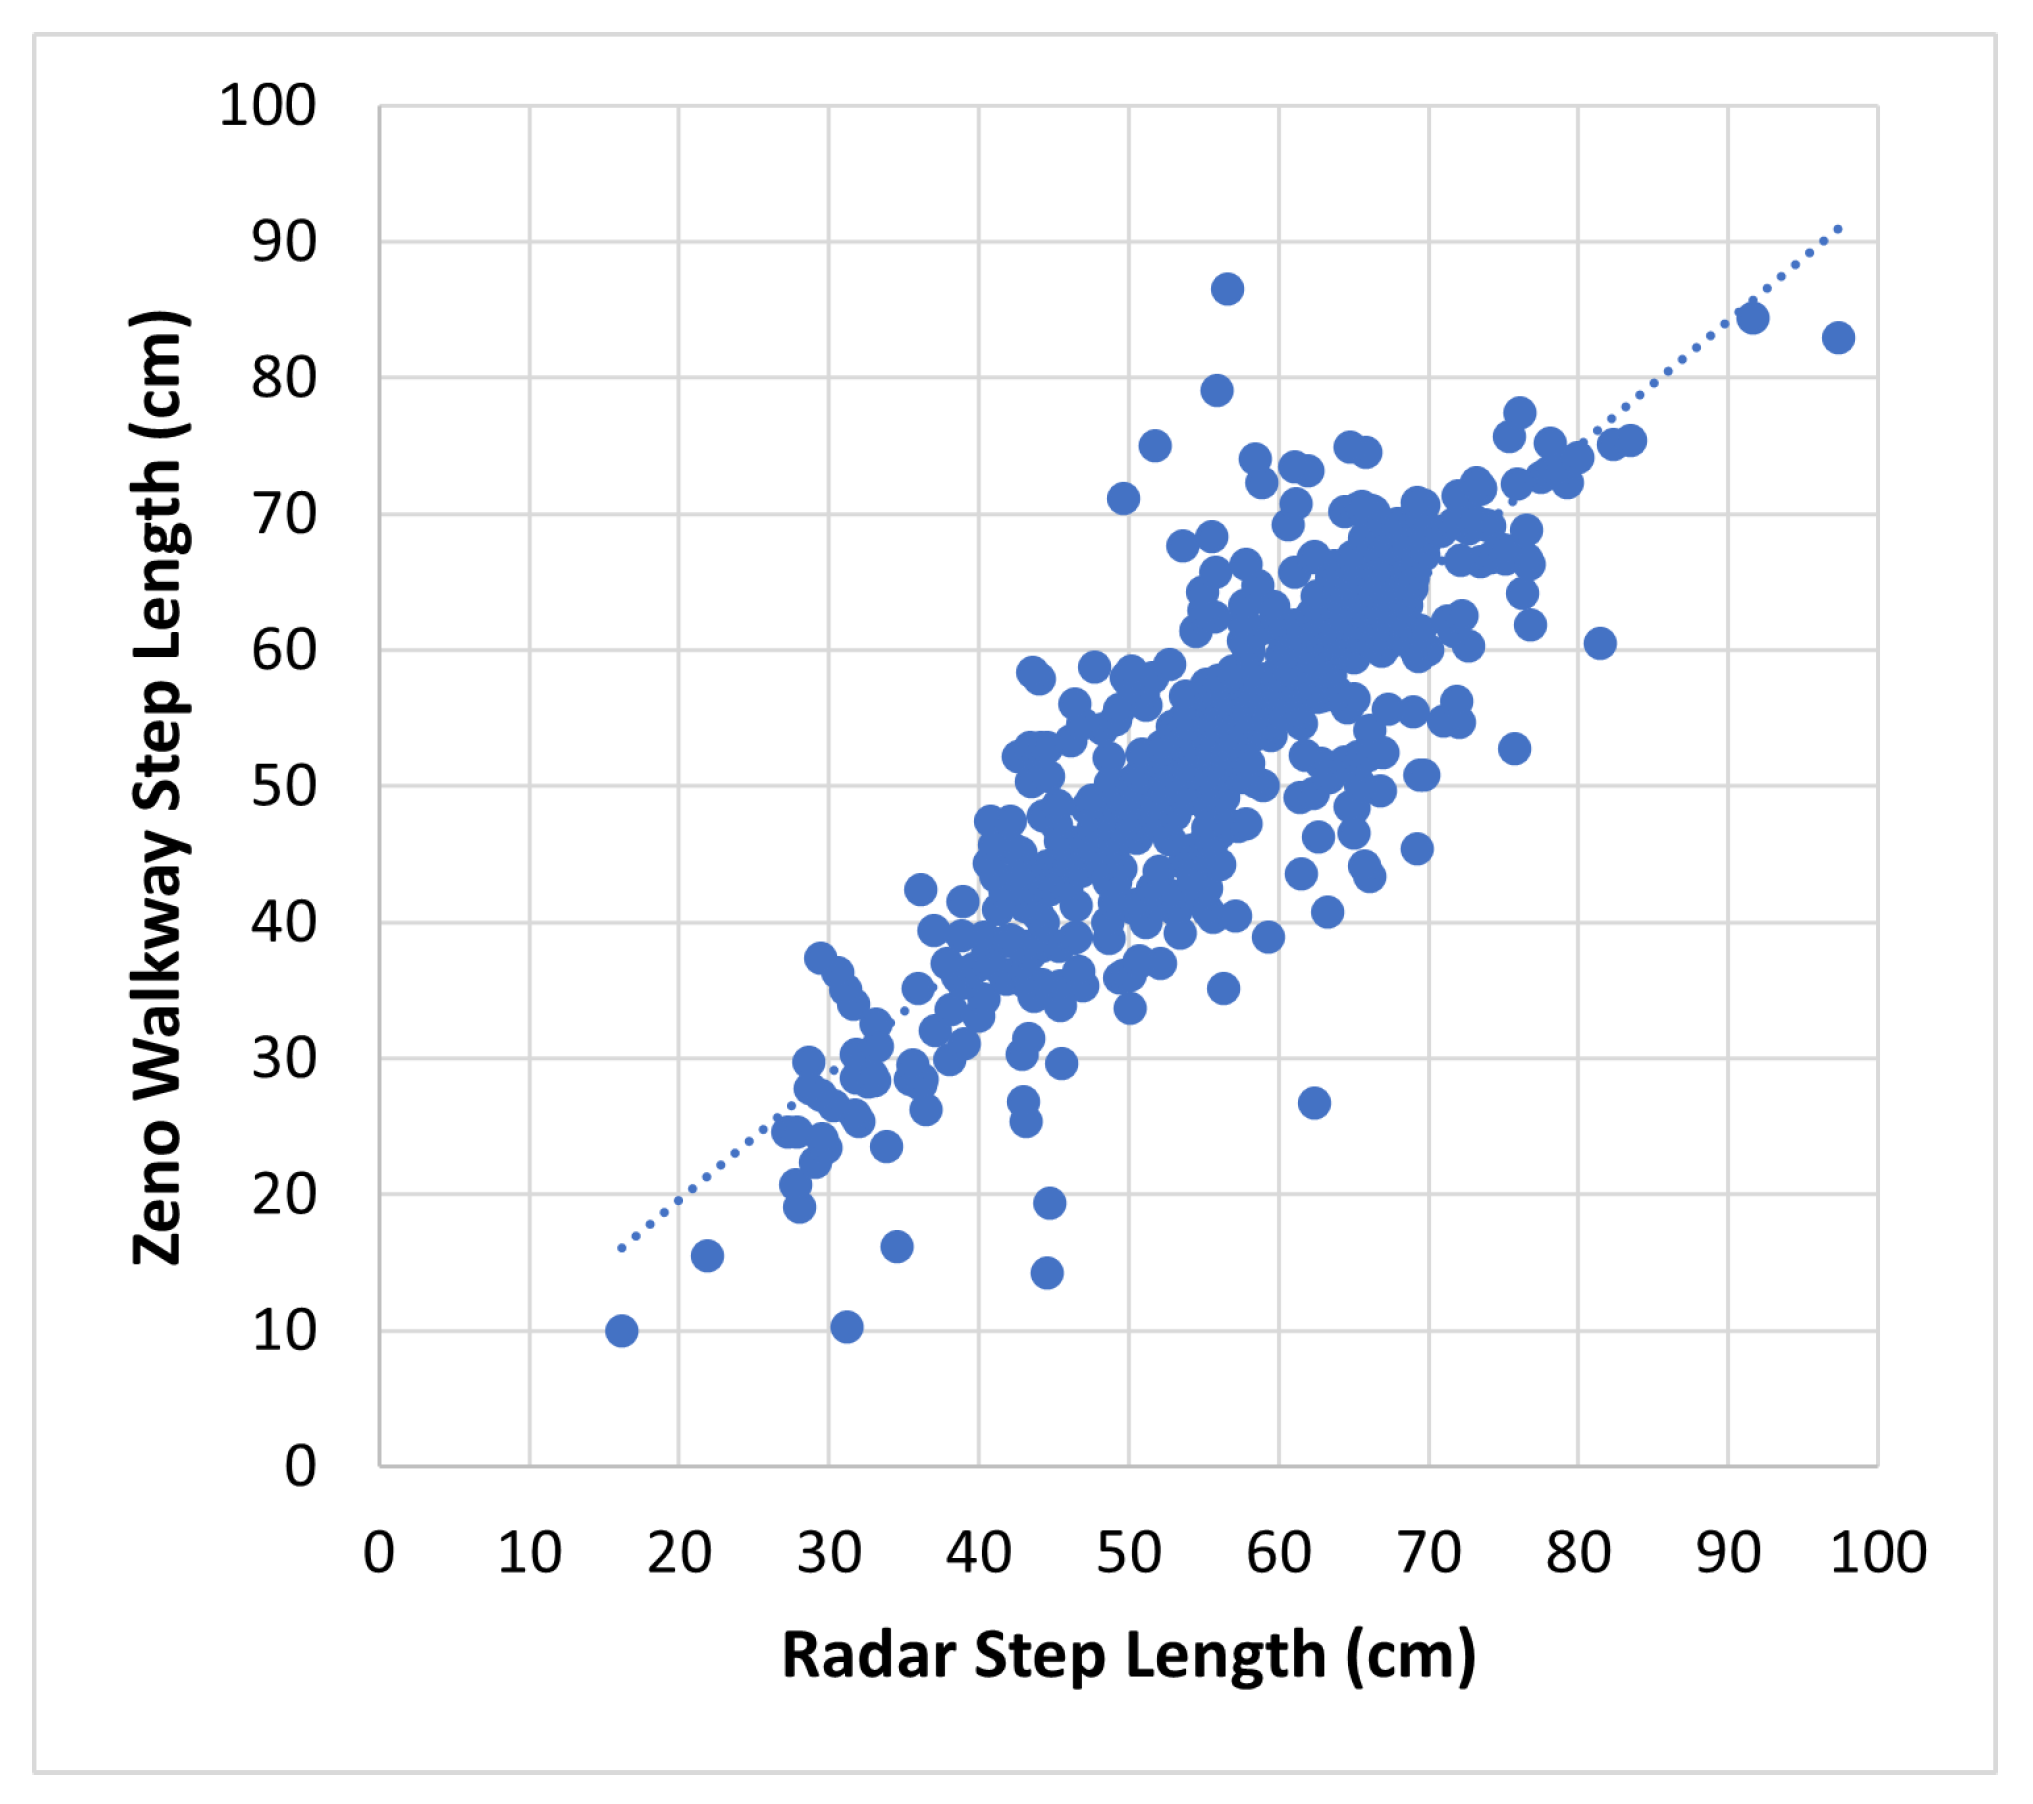
7.2. Concurrent Validity
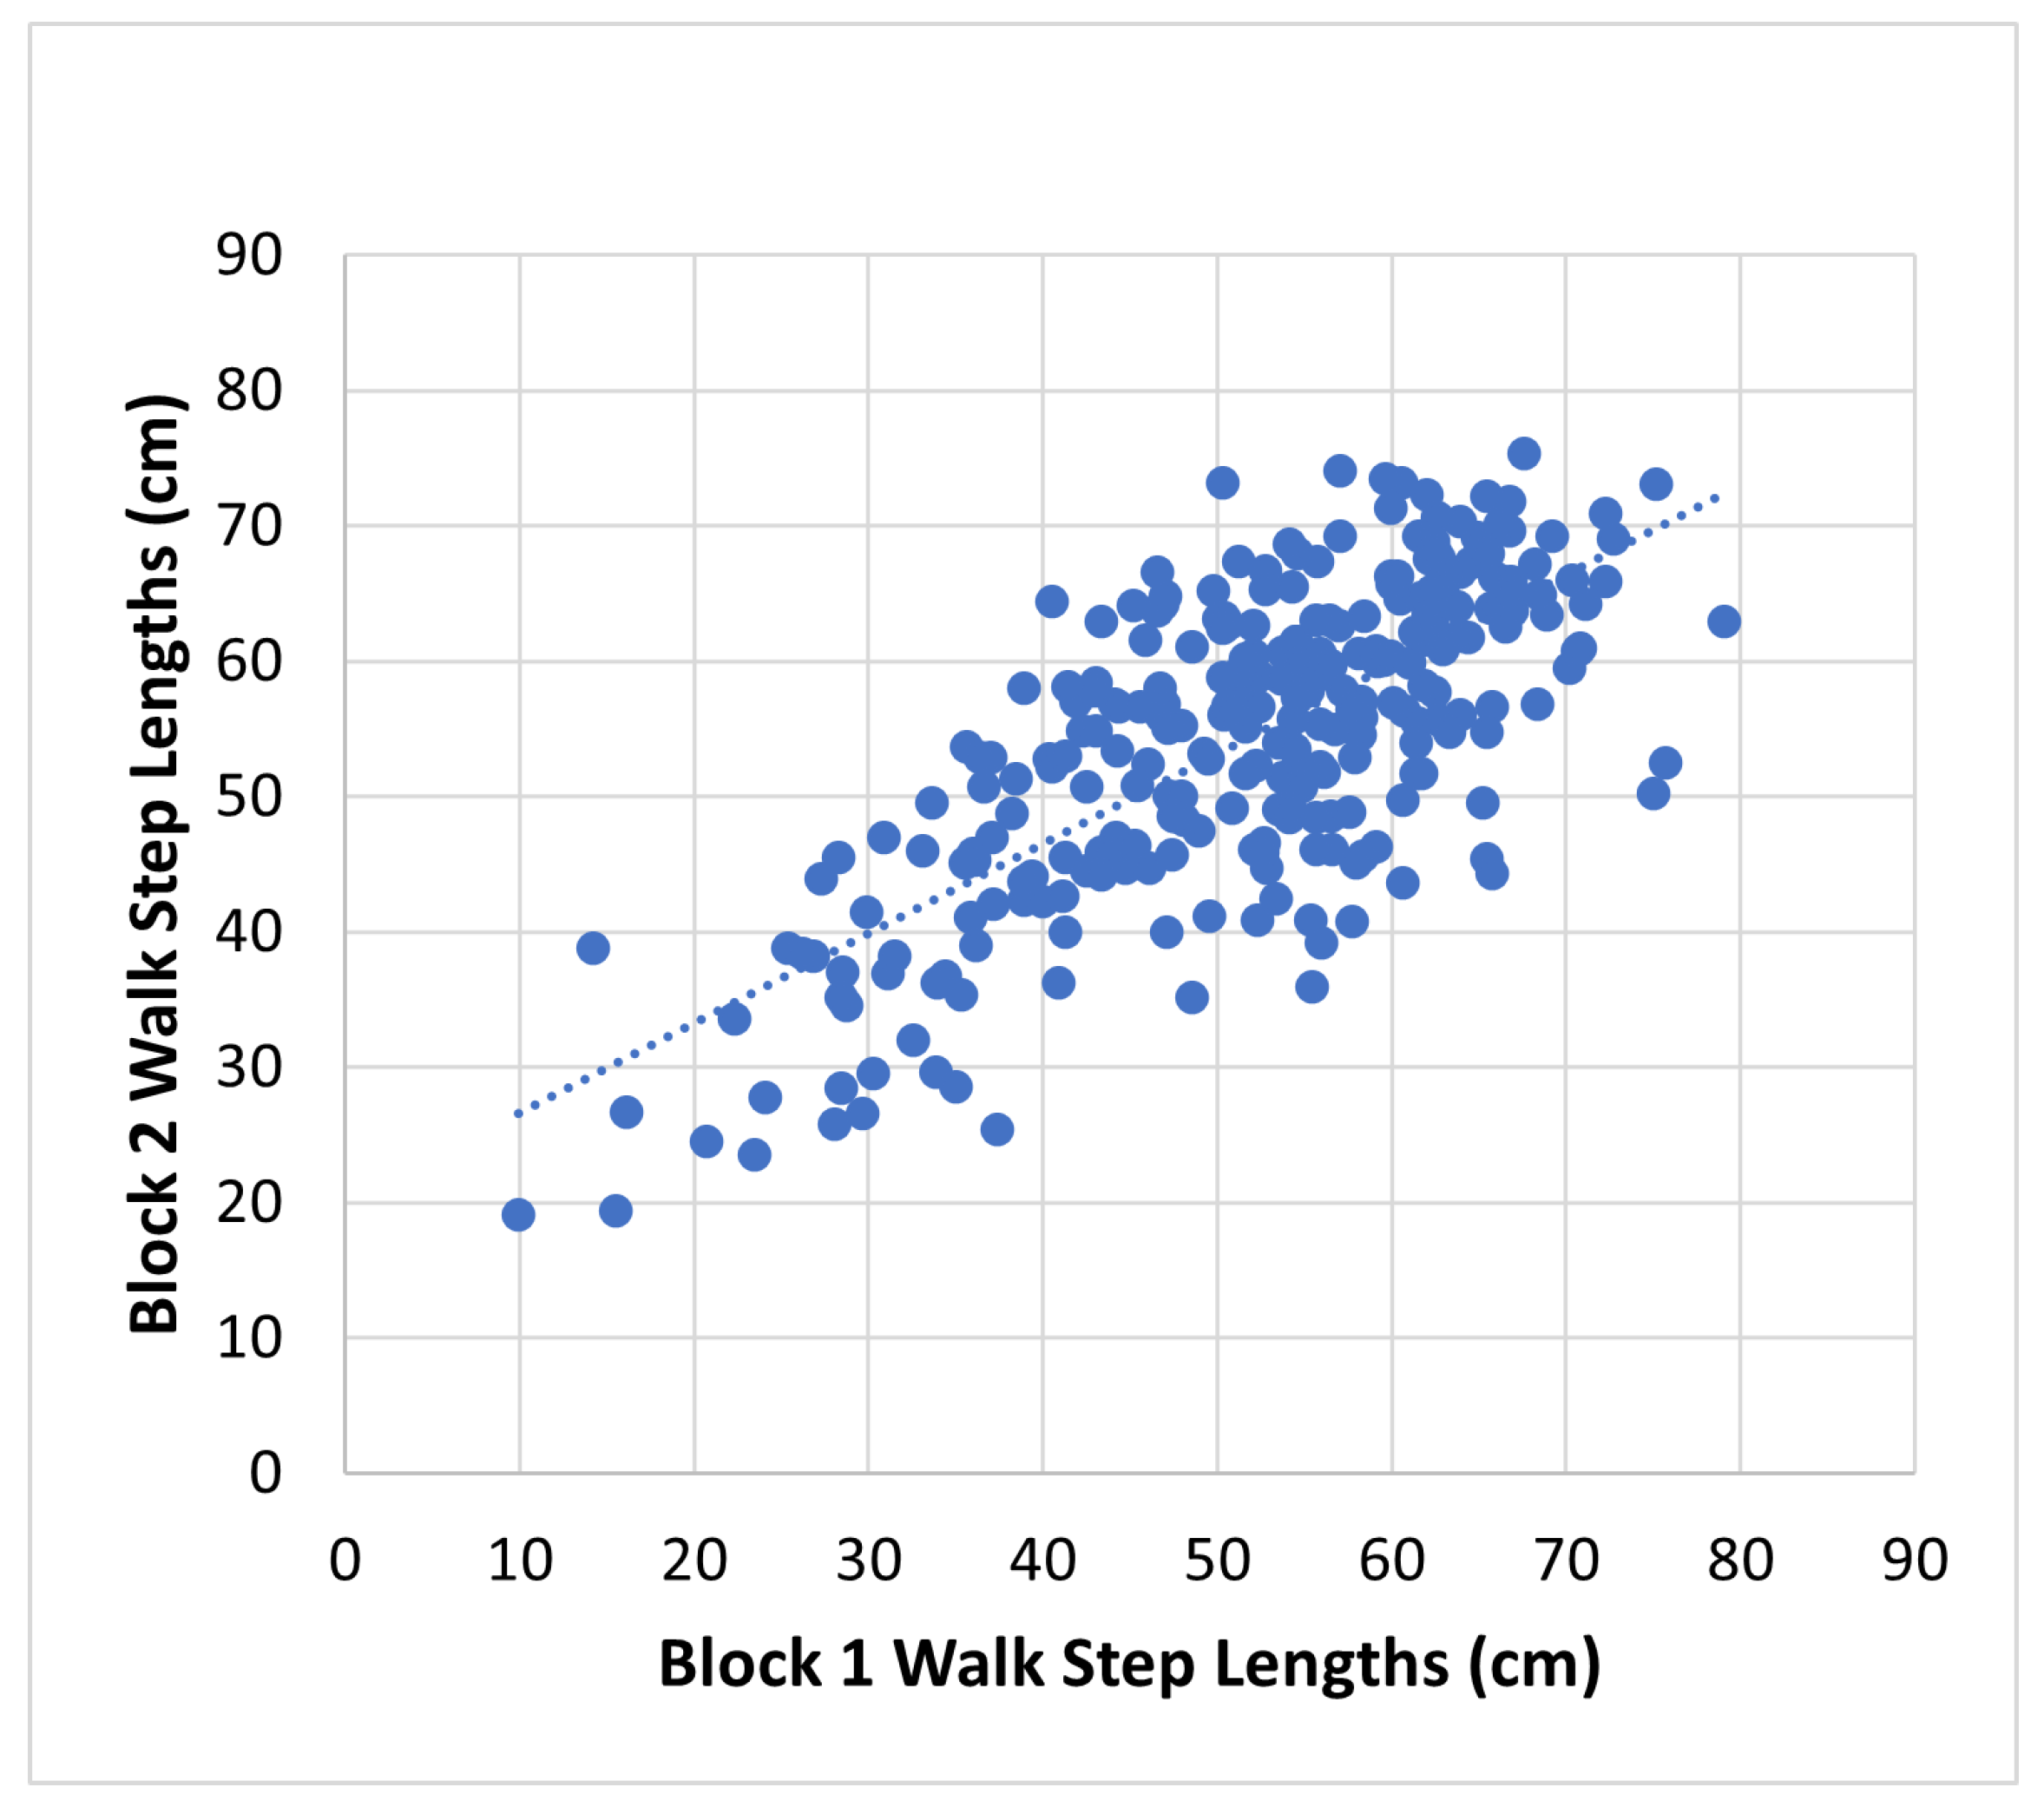
7.3. Intra-Session Reliability
7.4. Comparison to Existing Methods
8. In-Home Step Length Evaluation
8.1. Reliability
8.2. Validity
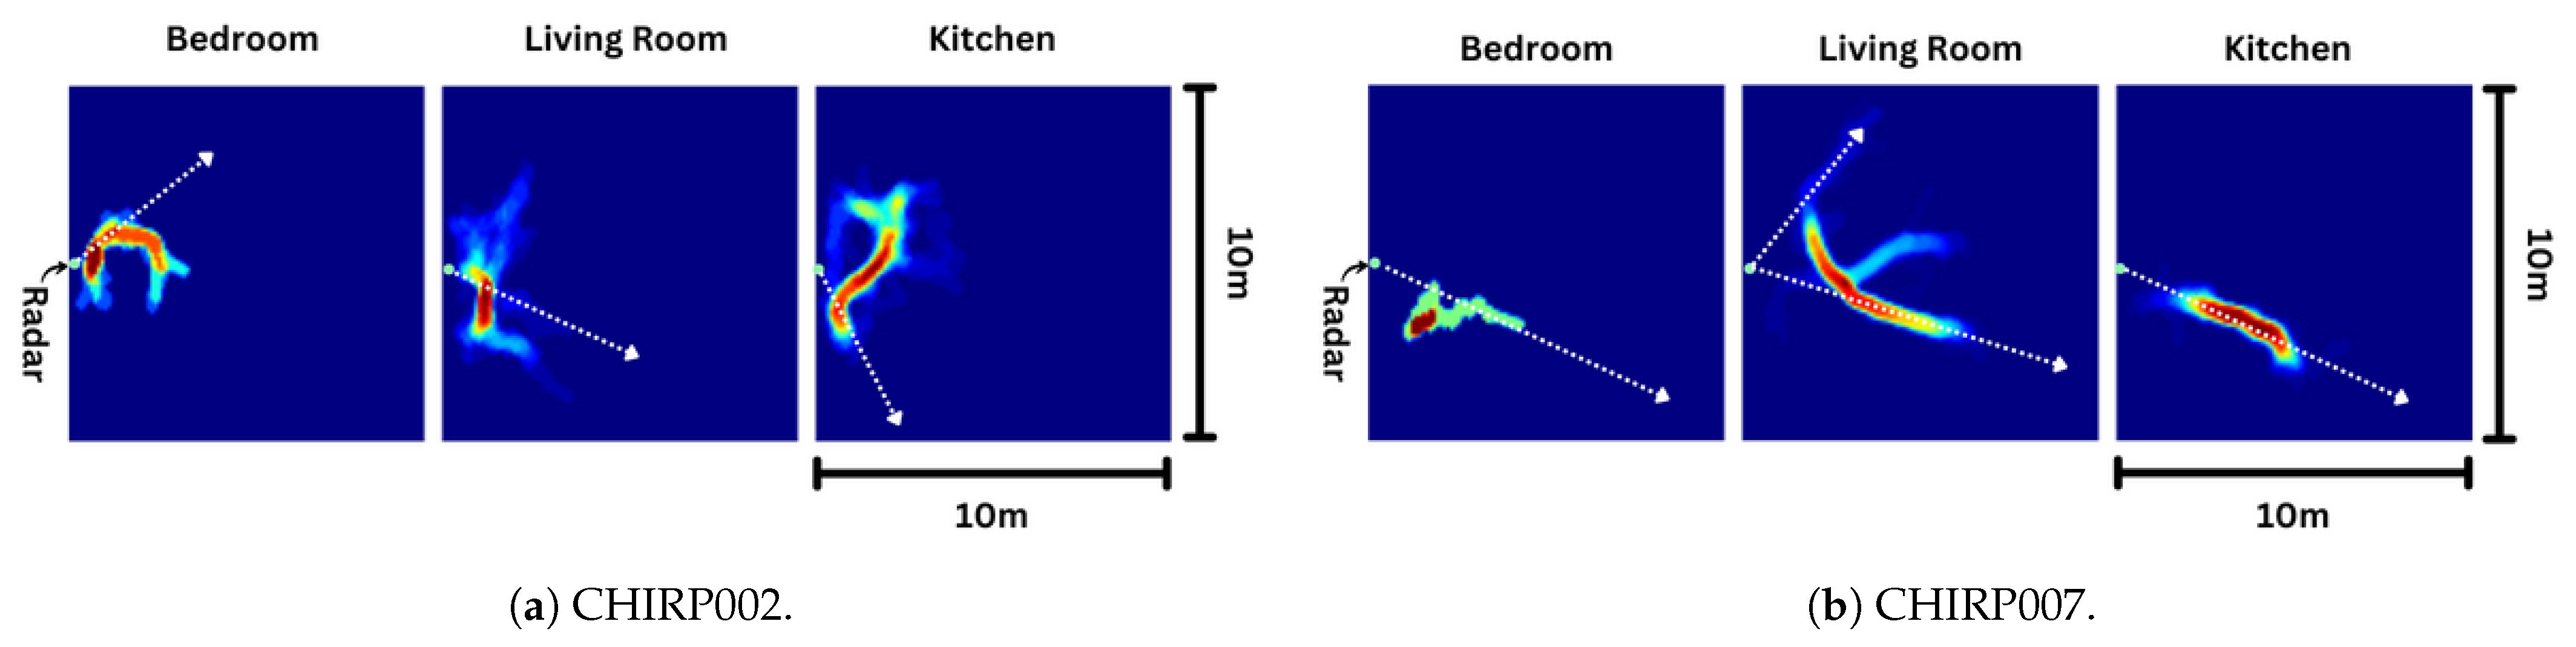
9. In-Home Tracks
10. Conclusions
Author Contributions
Funding
Institutional Review Board Statement
Informed Consent Statement
Data Availability Statement
Conflicts of Interest
Abbreviations
| CFAR | Constant False Alarm Rate |
| CI | Confidence Interval |
| DBSCAN | Density-Based Spatial Clustering of Applications with Noise |
| FES | Falls Efficacy Scale |
| FPS | Frames Per Second |
| ICC | Intra-class Correlation Coefficient |
| lidar | Light Detection and Ranging |
| MoCA | Montreal Cognitive Assessment |
| MOCAP | Motion Capture |
| NMS | Non-Maximum-Suppression |
| No. | Number |
| RDP | Ramer–Douglas–Peucker |
| SD | Standard Deviation |
| SDK | Software Development Kit |
| SNR | Signal-to-Noise Ratio |
| SPPB | Short Physical Performance Battery |
References
- Brohman, M.; ME, G.; Dixon, J.; Whittaker, R.; Fallon, L.; Lajkosz, K. Community Paramedicine Remote Patient Monitoring (CPRPM): Benefits Evaluation & Lessons Learned, 2015/17. Can. Health Infoway 2018. Available online: https://www.infoway-inforoute.ca/en/component/edocman/3542-community-paramedicine-remote-patient-monitoring-cprpm-benefits-evaluation-lessons-learned/view-document?Itemid=103 (accessed on 15 November 2023).
- Middleton, A.; Fritz, S.L.; Lusardi, M. Walking speed: The functional vital sign. J. Aging Phys. Act. 2015, 23, 314–322. [Google Scholar] [CrossRef] [PubMed]
- Fritz, S.; Lusardi, M. White paper: “walking speed: The sixth vital sign”. J. Geriatr. Phys. Ther. 2009, 32, 2–5. [Google Scholar] [CrossRef]
- Rodríguez-Molinero, A.; Herrero-Larrea, A.; Miñarro, A.; Narvaiza, L.; Gálvez-Barrón, C.; Gonzalo León, N.; Valldosera, E.; de Mingo, E.; Macho, O.; Aivar, D.; et al. The spatial parameters of gait and their association with falls, functional decline and death in older adults: A prospective study. Sci. Rep. 2019, 9, 8813. [Google Scholar] [CrossRef] [PubMed]
- Bytyçi, I.; Henein, M.Y. Stride length predicts adverse clinical events in older adults: A systematic review and meta-analysis. J. Clin. Med. 2021, 10, 2670. [Google Scholar] [CrossRef] [PubMed]
- Kwon, M.S.; Kwon, Y.R.; Park, Y.S.; Kim, J.W. Comparison of gait patterns in elderly fallers and non-fallers. Technol. Health Care 2018, 26, 427–436. [Google Scholar] [CrossRef] [PubMed]
- Kraus, M.; Saller, M.M.; Baumbach, S.F.; Neuerburg, C.; Stumpf, U.C.; Böcker, W.; Keppler, A.M. Prediction of physical frailty in orthogeriatric patients using sensor insole–based gait analysis and machine learning algorithms: Cross-sectional study. JMIR Med. Inform. 2022, 10, e32724. [Google Scholar] [CrossRef] [PubMed]
- Woo, J.; Ho, S.C.; Yu, A.L. Walking speed and stride length predicts 36 months dependency, mortality, and institutionalization in Chinese aged 70 and older. J. Am. Geriatr. Soc. 1999, 47, 1257–1260. [Google Scholar] [CrossRef]
- Kimura, A.; Paredes, W.; Pai, R.; Farooq, H.; Buttar, R.S.; Custodio, M.; Munugoti, S.; Kotwani, S.; Randhawa, L.S.; Dalezman, S.; et al. Step length and fall risk in adults with chronic kidney disease: A pilot study. BMC Nephrol. 2022, 23, 74. [Google Scholar] [CrossRef]
- Atrsaei, A.; Corrà, M.F.; Dadashi, F.; Vila-Chã, N.; Maia, L.; Mariani, B.; Maetzler, W.; Aminian, K. Gait speed in clinical and daily living assessments in Parkinson’s disease patients: Performance versus capacity. NPJ Park. Dis. 2021, 7, 24. [Google Scholar] [CrossRef]
- Piau, A.; Mattek, N.; Crissey, R.; Beattie, Z.; Dodge, H.; Kaye, J. When will my patient fall? Sensor-based in-home walking speed identifies future falls in older adults. J. Gerontol. Ser. A 2020, 75, 968–973. [Google Scholar] [CrossRef]
- Friedrich, B.; Steen, E.E.; Hellmers, S.; Bauer, J.M.; Hein, A. Estimating the gait speed of older adults in smart home environments. SN Comput. Sci. 2022, 3, 128. [Google Scholar] [CrossRef]
- Bethoux, F.; Varsanik, J.S.; Chevalier, T.W.; Halpern, E.F.; Stough, D.; Kimmel, Z.M. Walking speed measurement with an Ambient Measurement System (AMS) in patients with multiple sclerosis and walking impairment. Gait Posture 2018, 61, 393–397. [Google Scholar] [CrossRef]
- Joddrell, P.; Potter, S.; de Witte, L.P.; Hawley, M.S. Continuous in-home walking speed monitoring in older people with a low-cost ambient sensor: Results of a feasibility study. Technol. Disabil. 2021, 33, 77–85. [Google Scholar] [CrossRef]
- Liu, Y.; Zhang, G.; Tarolli, C.G.; Hristov, R.; Jensen-Roberts, S.; Waddell, E.M.; Myers, T.L.; Pawlik, M.E.; Soto, J.M.; Wilson, R.M.; et al. Monitoring gait at home with radio waves in Parkinson’s disease: A marker of severity, progression, and medication response. Sci. Transl. Med. 2022, 14, eadc9669. [Google Scholar] [CrossRef] [PubMed]
- Yagi, K.; Sugiura, Y.; Hasegawa, K.; Saito, H. Gait Measurement at Home Using A Single RGB Camera. Gait Posture 2020, 76, 136–140. [Google Scholar] [CrossRef] [PubMed]
- Botros, A.; Gyger, N.; Schütz, N.; Single, M.; Nef, T.; Gerber, S.M. Contactless gait assessment in home-like environments. Sensors 2021, 21, 6205. [Google Scholar] [CrossRef] [PubMed]
- Abedi, H.; Boger, J.; Morita, P.P.; Wong, A.; Shaker, G. Hallway Gait Monitoring Using Novel Radar Signal Processing and Unsupervised Learning. IEEE Sens. J. 2022, 22, 15133–15145. [Google Scholar] [CrossRef]
- Wang, D.; Park, J.; Kim, H.J.; Lee, K.; Cho, S.H. Noncontact Extraction of Biomechanical Parameters in Gait Analysis Using a Multi-Input and Multi-Output Radar Sensor. IEEE Access 2021, 9, 138496–138508. [Google Scholar] [CrossRef]
- Seifert, A.K.; Grimmer, M.; Zoubir, A.M. Doppler Radar for the Extraction of Biomechanical Parameters in Gait Analysis. IEEE J. Biomed. Health Inform. 2021, 25, 547–558. [Google Scholar] [CrossRef]
- Veld, R. Human Gait Model Individualized by Low Cost Radar Measurements. Master’s Thesis, University of Twente, Enschede, The Netherlands, 2023. [Google Scholar]
- Abedi, H.; Boger, J.; Morita, P.P.; Wong, A.; Shaker, G. Hallway Gait Monitoring System Using an In-Package Integrated Dielectric Lens Paired with a mm-Wave Radar. Sensors 2023, 23, 71. [Google Scholar] [CrossRef] [PubMed]
- Saho, K.; Shioiri, K.; Kudo, S.; Fujimoto, M. Estimation of Gait Parameters From Trunk Movement Measured by Doppler Radar. IEEE J. Electromagn. RF Microw. Med. Biol. 2022, 6, 461–469. [Google Scholar] [CrossRef]
- Winter, D. The Biomechanics and Motor Control of Human Gait; University of Waterloo Press: Waterloo, ON, Canada, 1987. [Google Scholar]
- Sherratt, F.; Plummer, A.; Iravani, P. Understanding LSTM Network Behaviour of IMU-Based Locomotion Mode Recognition for Applications in Prostheses and Wearables. Sensors 2021, 21, 1264. [Google Scholar] [CrossRef] [PubMed]
- Chirp Inc. Available online: https://mychirp.com/ (accessed on 15 November 2023).
- FCC ID 2A9Q4-CHIRP01T. Available online: https://fccid.io/2A9Q4-CHIRP01T (accessed on 15 November 2023).
- Koyama, S.; Narita, E.; Shimizu, Y.; Suzuki, Y.; Shiina, T.; Taki, M.; Shinohara, N.; Miyakoshi, J. Effects of long-term exposure to 60 GHz millimeter-wavelength radiation on the genotoxicity and heat shock protein (HSP) expression of cells derived from human eye. Int. J. Environ. Res. Public Health 2016, 13, 802. [Google Scholar] [CrossRef] [PubMed]
- Health Effects of mmWave Radiation. Available online: https://www.infineon.com/dgdl/Infineon-Health%20Effects%20of%20mmWave%20Radiation-PI-v01_01-EN.pdf?fileId=5546d46266a498f50166f1ada0520444 (accessed on 17 January 2024).
- TI mmwave-sdk. Available online: https://www.ti.com/tool/MMWAVE-SDK (accessed on 15 November 2023).
- Zhao, P.; Lu, C.X.; Wang, J.; Chen, C.; Wang, W.; Trigoni, N.; Markham, A. mID: Tracking and Identifying People with Millimeter Wave Radar. In Proceedings of the 2019 15th International Conference on Distributed Computing in Sensor Systems (DCOSS), Santorini, Greece, 29–31 May 2019; pp. 33–40. [Google Scholar] [CrossRef]
- Hershberger, J.; Snoeyink, J. An O (n log n) implementation of the Douglas-Peucker algorithm for line simplification. In Proceedings of the Tenth Annual Symposium on Computational Geometry, Stony Brook, NY, USA, 6–8 June 1994; pp. 383–384. [Google Scholar]
- Guralnik, J.M.; Simonsick, E.M.; Ferrucci, L.; Glynn, R.J.; Berkman, L.F.; Blazer, D.G.; Scherr, P.A.; Wallace, R.B. A Short Physical Performance Battery Assessing Lower Extremity Function: Association with Self-Reported Disability and Prediction of Mortality and Nursing Home Admission. J. Gerontol. 1994, 49, M85–M94. [Google Scholar] [CrossRef] [PubMed]
- Negm, A.M.; Kennedy, C.C.; Pritchard, J.M.; Ioannidis, G.; Vastis, V.; Marr, S.; Patterson, C.; Misiaszek, B.; Woo, T.K.W.; Thabane, L.; et al. The Short Performance Physical Battery Is Associated with One-Year Emergency Department Visits and Hospitalization. Can. J. Aging La Rev. Can. Du Vieil. 2019, 38, 507–511. [Google Scholar] [CrossRef] [PubMed]
- Yardley, L.; Beyer, N.; Hauer, K.; Kempen, G.; Piot-Ziegler, C.; Todd, C. Development and initial validation of the Falls Efficacy Scale-International (FES-I). Age Ageing 2005, 34, 614–619. [Google Scholar] [CrossRef] [PubMed]
- Nasreddine, Z.S.; Phillips, N.A.; Bédirian, V.; Charbonneau, S.; Whitehead, V.; Collin, I.; Cummings, J.L.; Chertkow, H. The Montreal Cognitive Assessment, MoCA: A brief screening tool for mild cognitive impairment. J. Am. Geriatr. Soc. 2005, 53, 695–699. [Google Scholar] [CrossRef]
- Deshpande, N.; Metter, E.J.; Guralnik, J.; Ferrucci, L. Can failure on adaptive locomotor tasks independently predict incident mobility disability? Am. J. Phys. Med. Rehabil. Assoc. Acad. Physiatr. 2013, 92, 704. [Google Scholar] [CrossRef]
- Zarrugh, M.; Todd, F.; Ralston, H. Optimization of energy expenditure during level walking. Eur. J. Appl. Physiol. Occup. Physiol. 1974, 33, 293–306. [Google Scholar] [CrossRef]
- Koo, T.K.; Li, M.Y. A guideline of selecting and reporting intraclass correlation coefficients for reliability research. J. Chiropr. Med. 2016, 15, 155–163. [Google Scholar] [CrossRef] [PubMed]
- Brach, J.S.; Perera, S.; Studenski, S.; Katz, M.; Hall, C.; Verghese, J. Meaningful change in measures of gait variability in older adults. Gait Posture 2010, 31, 175–179. [Google Scholar] [CrossRef] [PubMed]


| Method | Distance (m) | No. of Participants | Participants | Ground Truth |
|---|---|---|---|---|
| [21] | 4 | 3 | Young adults | Marker attached to shoe |
| [22] | 25.2 † | 4 | Young adults | Fixed 70 cm steps |
| [18] | 56 ‡ | 5 | Young adults | Fixed 70 cm steps |
| [23] | 10 | 10 | Young adults | MOCAP |
| Demographics | All Participants (N = 35) |
|---|---|
| Age, M (SD) | 75.49 (6.56) |
| Age, Range | 60 to 89 |
| Sex, % female | 30/35 (85.71%) |
| Education, n more than high school | 23/35 (65.71%) |
| Living arrangement, n lives alone | 35/35 (100%) |
| Physical function, SPPB total score, M (SD) | 8.53 (2.74) |
| Physical function, n SPPB < 9 | 12/34 (35.29%) |
| Fear of falling, FES-I total score, M (SD) | 24.97 (6.62) |
| Fear of falling, n FES-I moderate to high severity | 26/34 (76.47%) |
| Cognition, MoCA total score, M (SD) | 23.38 (3.64) |
| Cognition, n MoCA total score < 25 | 20/34 (58.82%) |
| Control | Fast | Narrow | Obstacle | Dual Task | All | |
|---|---|---|---|---|---|---|
| Tech. Difficulty | 6 | 4 | 6 | 5 | 7 | 28 (4.0%) |
| Unable | 1 | 4 | 17 | 24 | 1 | 47 (6.7%) |
| Collected Walks | 133 | 132 | 117 | 111 | 132 | 625 (89.3%) |
| Control | Fast | Narrow | Obstacle | Dual Task | All | |
|---|---|---|---|---|---|---|
| Alg. Missed | 2 | 18 | 6 | 0 | 0 | 26/625 (4.2%) |
| Alg. Detected | 131 | 114 | 111 | 111 | 132 | 599/625 (95.8%) |
| Control | Fast | Narrow | Obstacle | Dual Task | All | |
|---|---|---|---|---|---|---|
| cm | 4.5 (4.3) | 6.5 (5.9) | 5.0 (4.3) | 5.0 (4.4) | 6.5 (6.4) | 5.5 (5.2) |
| % | 8.3 (8.0) | 10.4 (9.3) | 9.3 (9.2) | 8.5 (7.4) | 14.3 (13.4) | 10.2 (10.1) |
Disclaimer/Publisher’s Note: The statements, opinions and data contained in all publications are solely those of the individual author(s) and contributor(s) and not of MDPI and/or the editor(s). MDPI and/or the editor(s) disclaim responsibility for any injury to people or property resulting from any ideas, methods, instructions or products referred to in the content. |
© 2024 by the authors. Licensee MDPI, Basel, Switzerland. This article is an open access article distributed under the terms and conditions of the Creative Commons Attribution (CC BY) license (https://creativecommons.org/licenses/by/4.0/).
Share and Cite
Siva, P.; Wong, A.; Hewston, P.; Ioannidis, G.; Adachi, J.; Rabinovich, A.; Lee, A.W.; Papaioannou, A. Automatic Radar-Based Step Length Measurement in the Home for Older Adults Living with Frailty. Sensors 2024, 24, 1056. https://doi.org/10.3390/s24041056
Siva P, Wong A, Hewston P, Ioannidis G, Adachi J, Rabinovich A, Lee AW, Papaioannou A. Automatic Radar-Based Step Length Measurement in the Home for Older Adults Living with Frailty. Sensors. 2024; 24(4):1056. https://doi.org/10.3390/s24041056
Chicago/Turabian StyleSiva, Parthipan, Alexander Wong, Patricia Hewston, George Ioannidis, Jonathan Adachi, Alexander Rabinovich, Andrea W. Lee, and Alexandra Papaioannou. 2024. "Automatic Radar-Based Step Length Measurement in the Home for Older Adults Living with Frailty" Sensors 24, no. 4: 1056. https://doi.org/10.3390/s24041056
APA StyleSiva, P., Wong, A., Hewston, P., Ioannidis, G., Adachi, J., Rabinovich, A., Lee, A. W., & Papaioannou, A. (2024). Automatic Radar-Based Step Length Measurement in the Home for Older Adults Living with Frailty. Sensors, 24(4), 1056. https://doi.org/10.3390/s24041056