
In-Situ Classification of Highly Deformed Corrugated Board Using Convolution Neural Networks


Abstract
1. Introduction
2. Materials and Methods
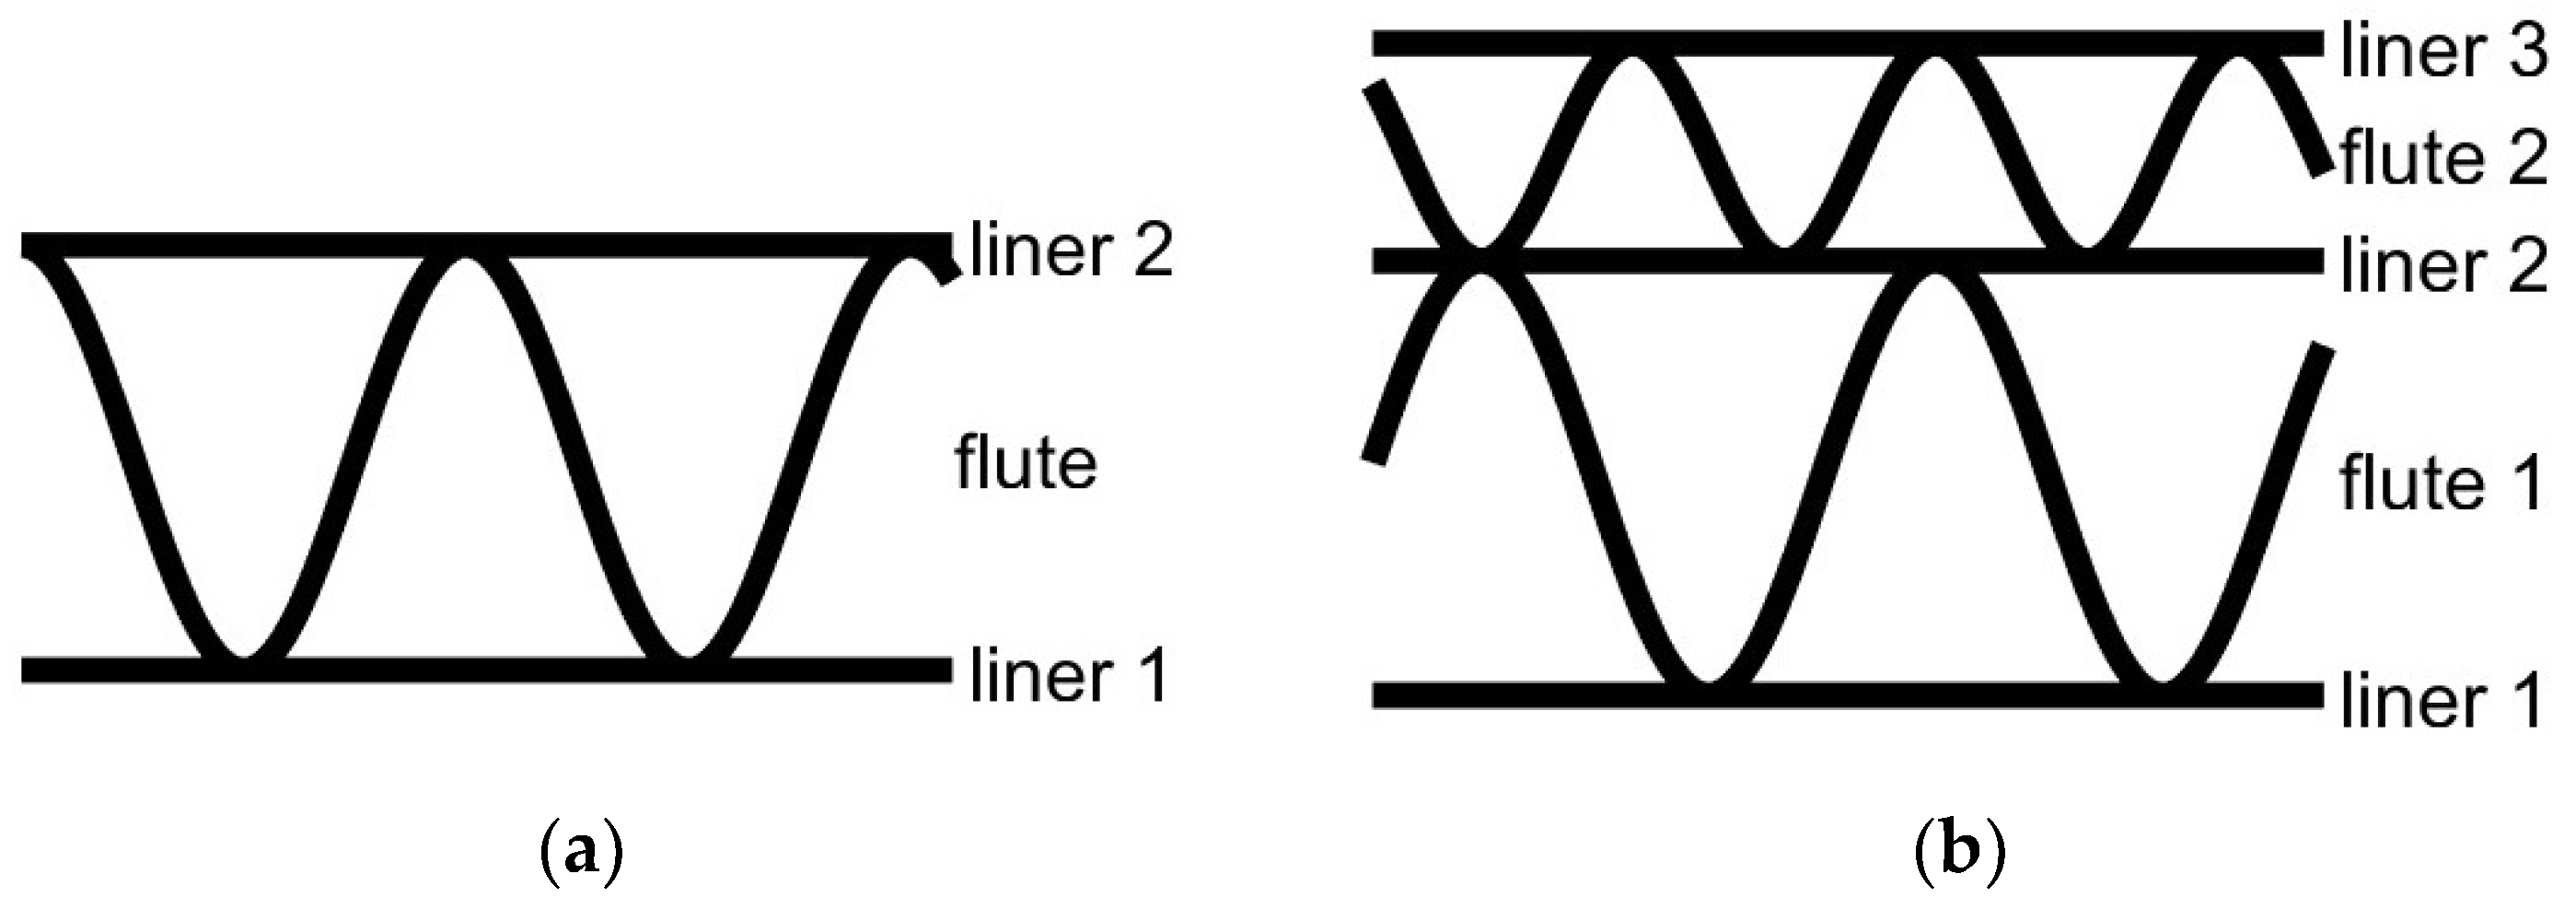
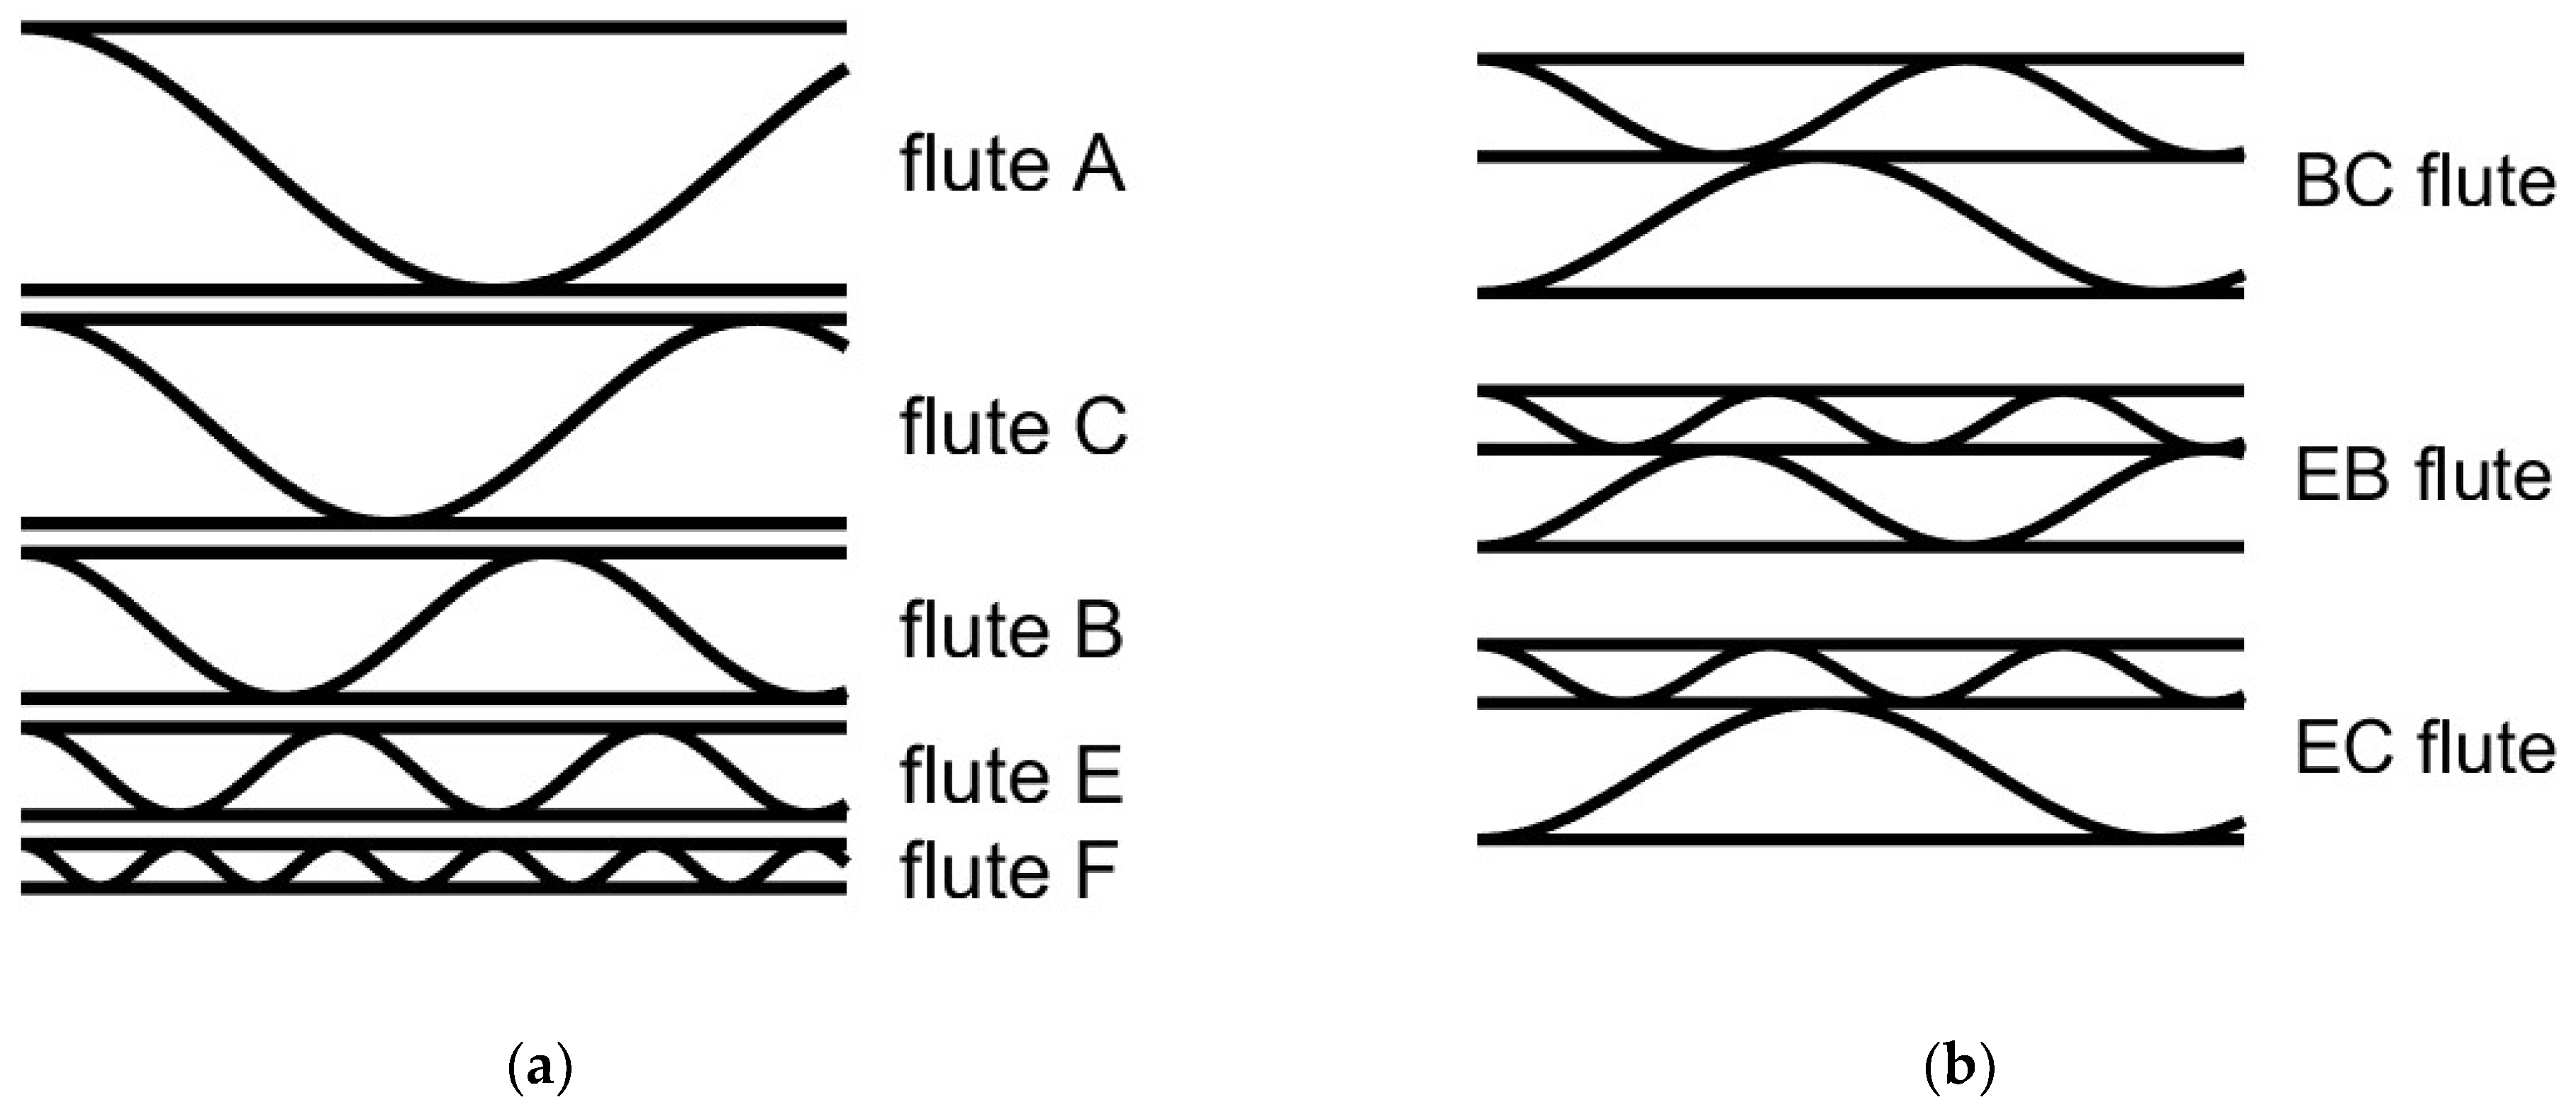
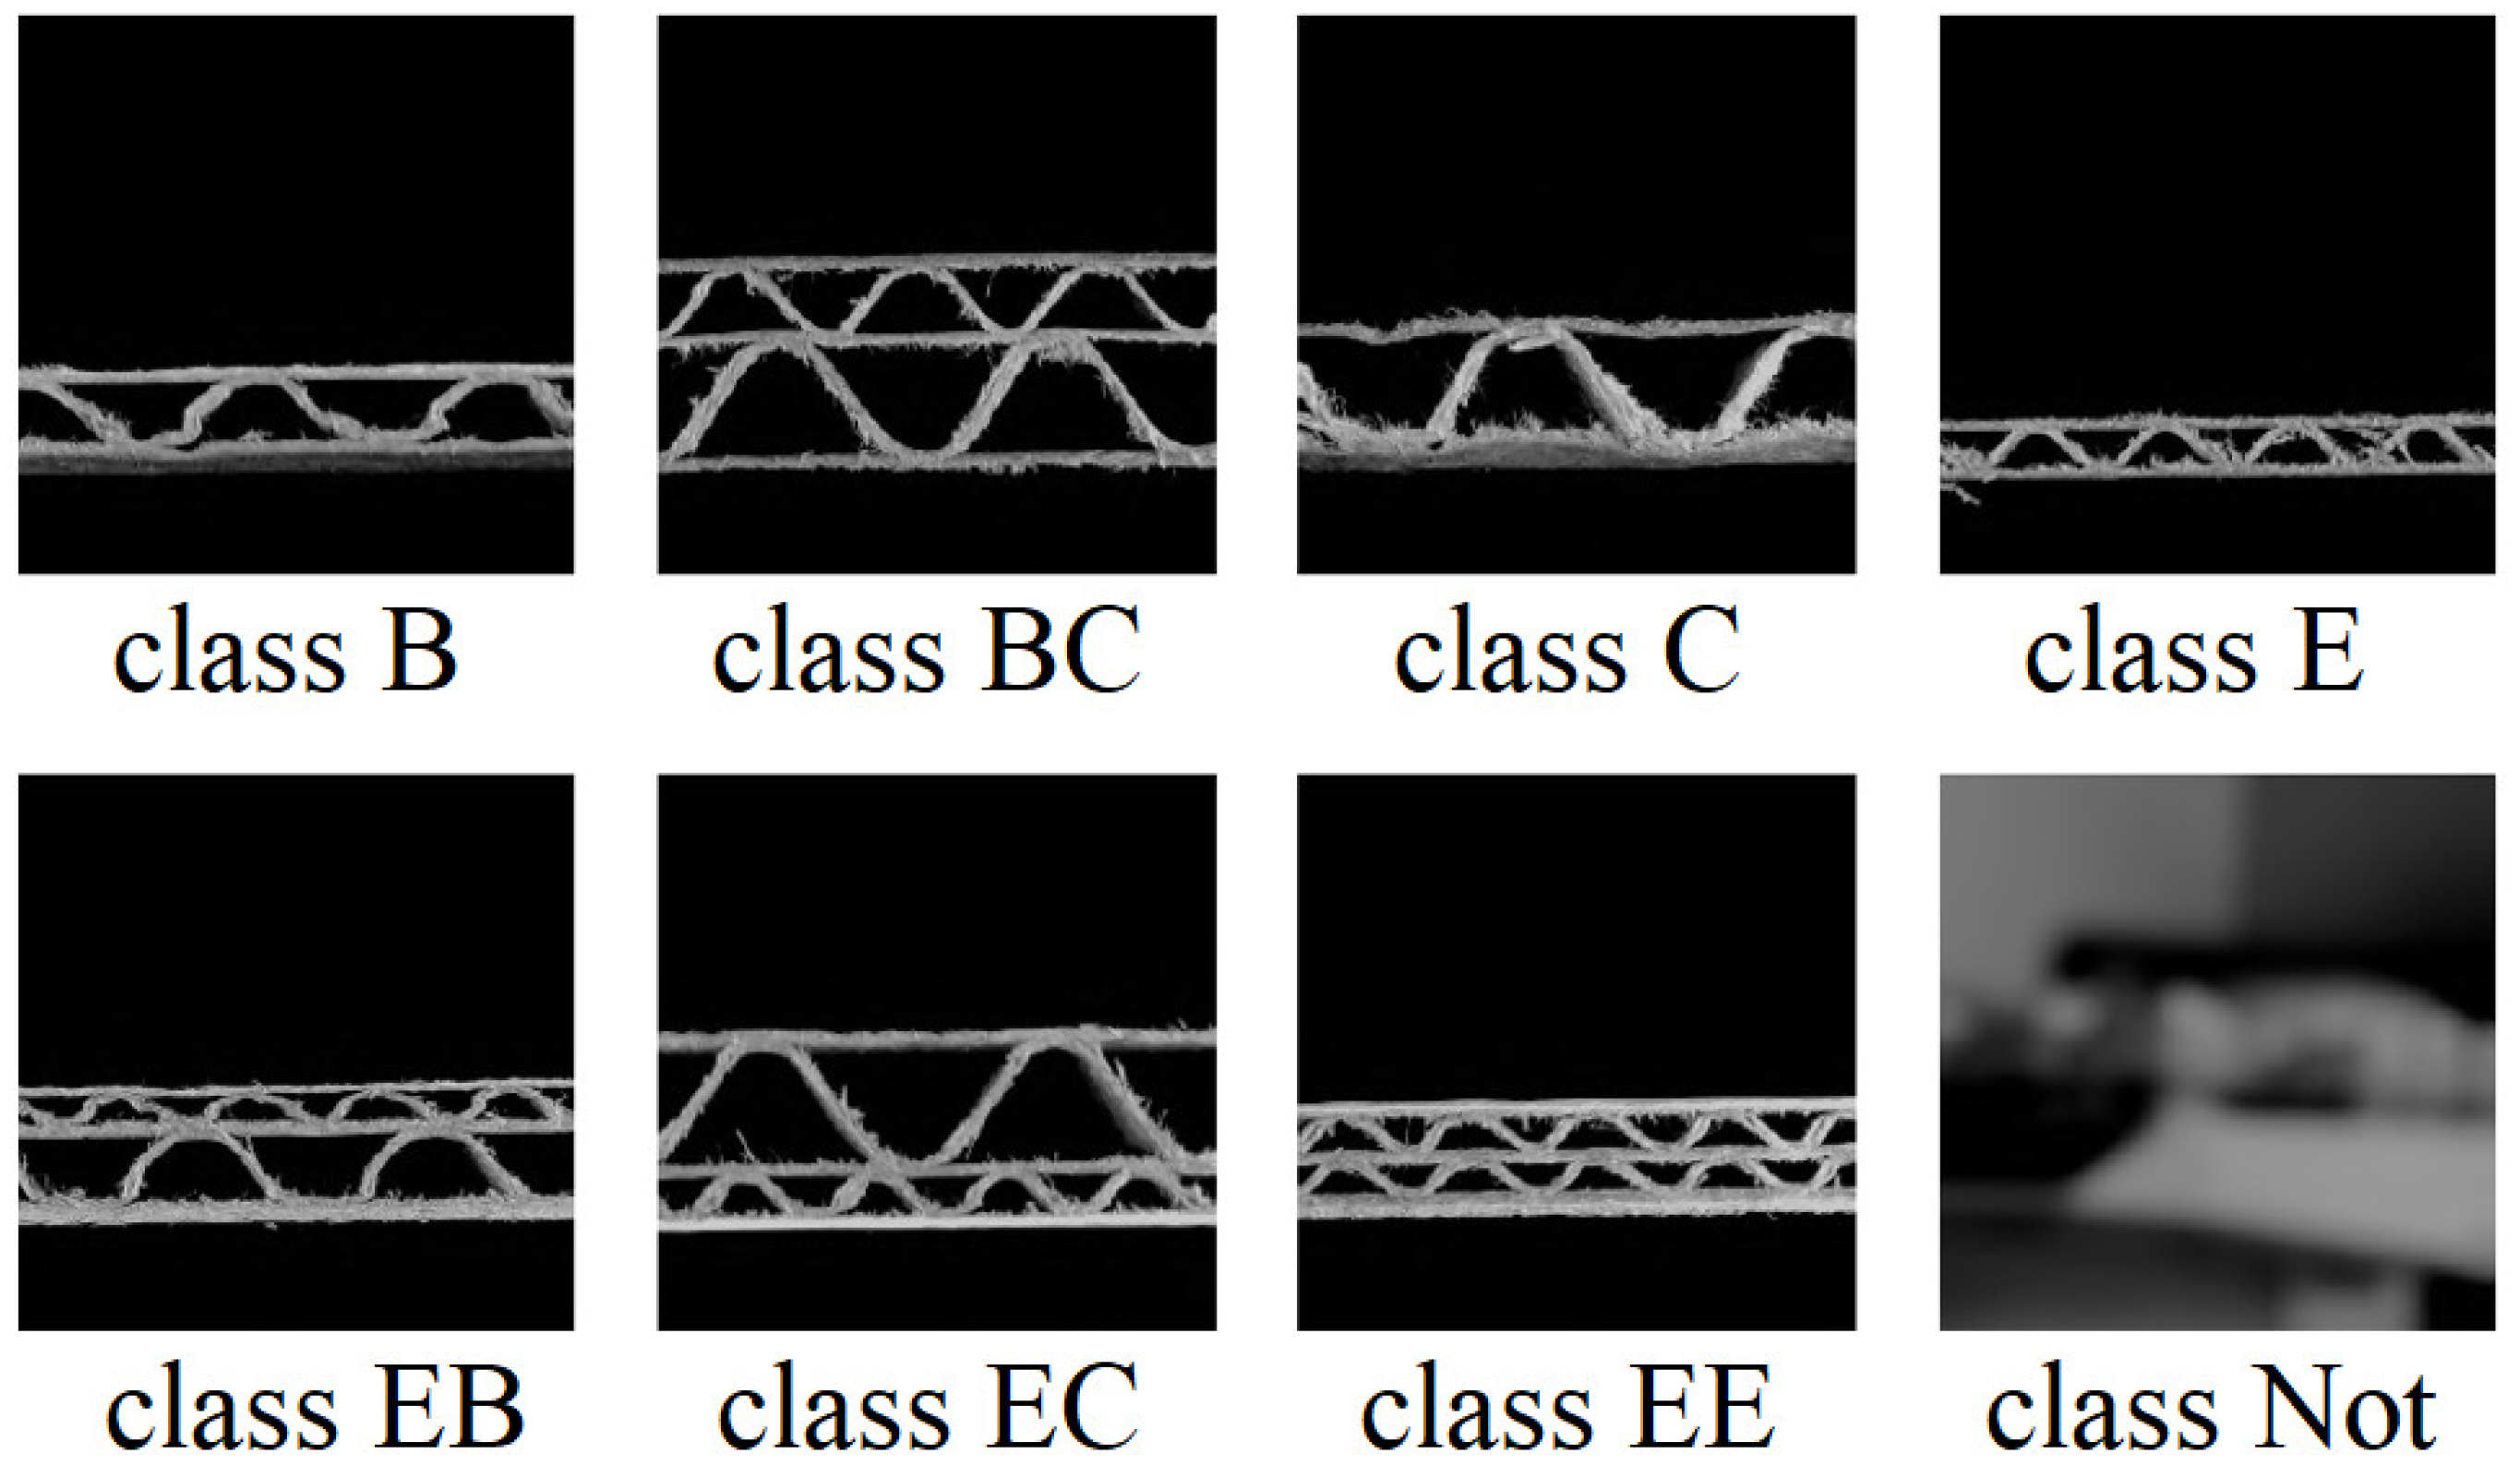
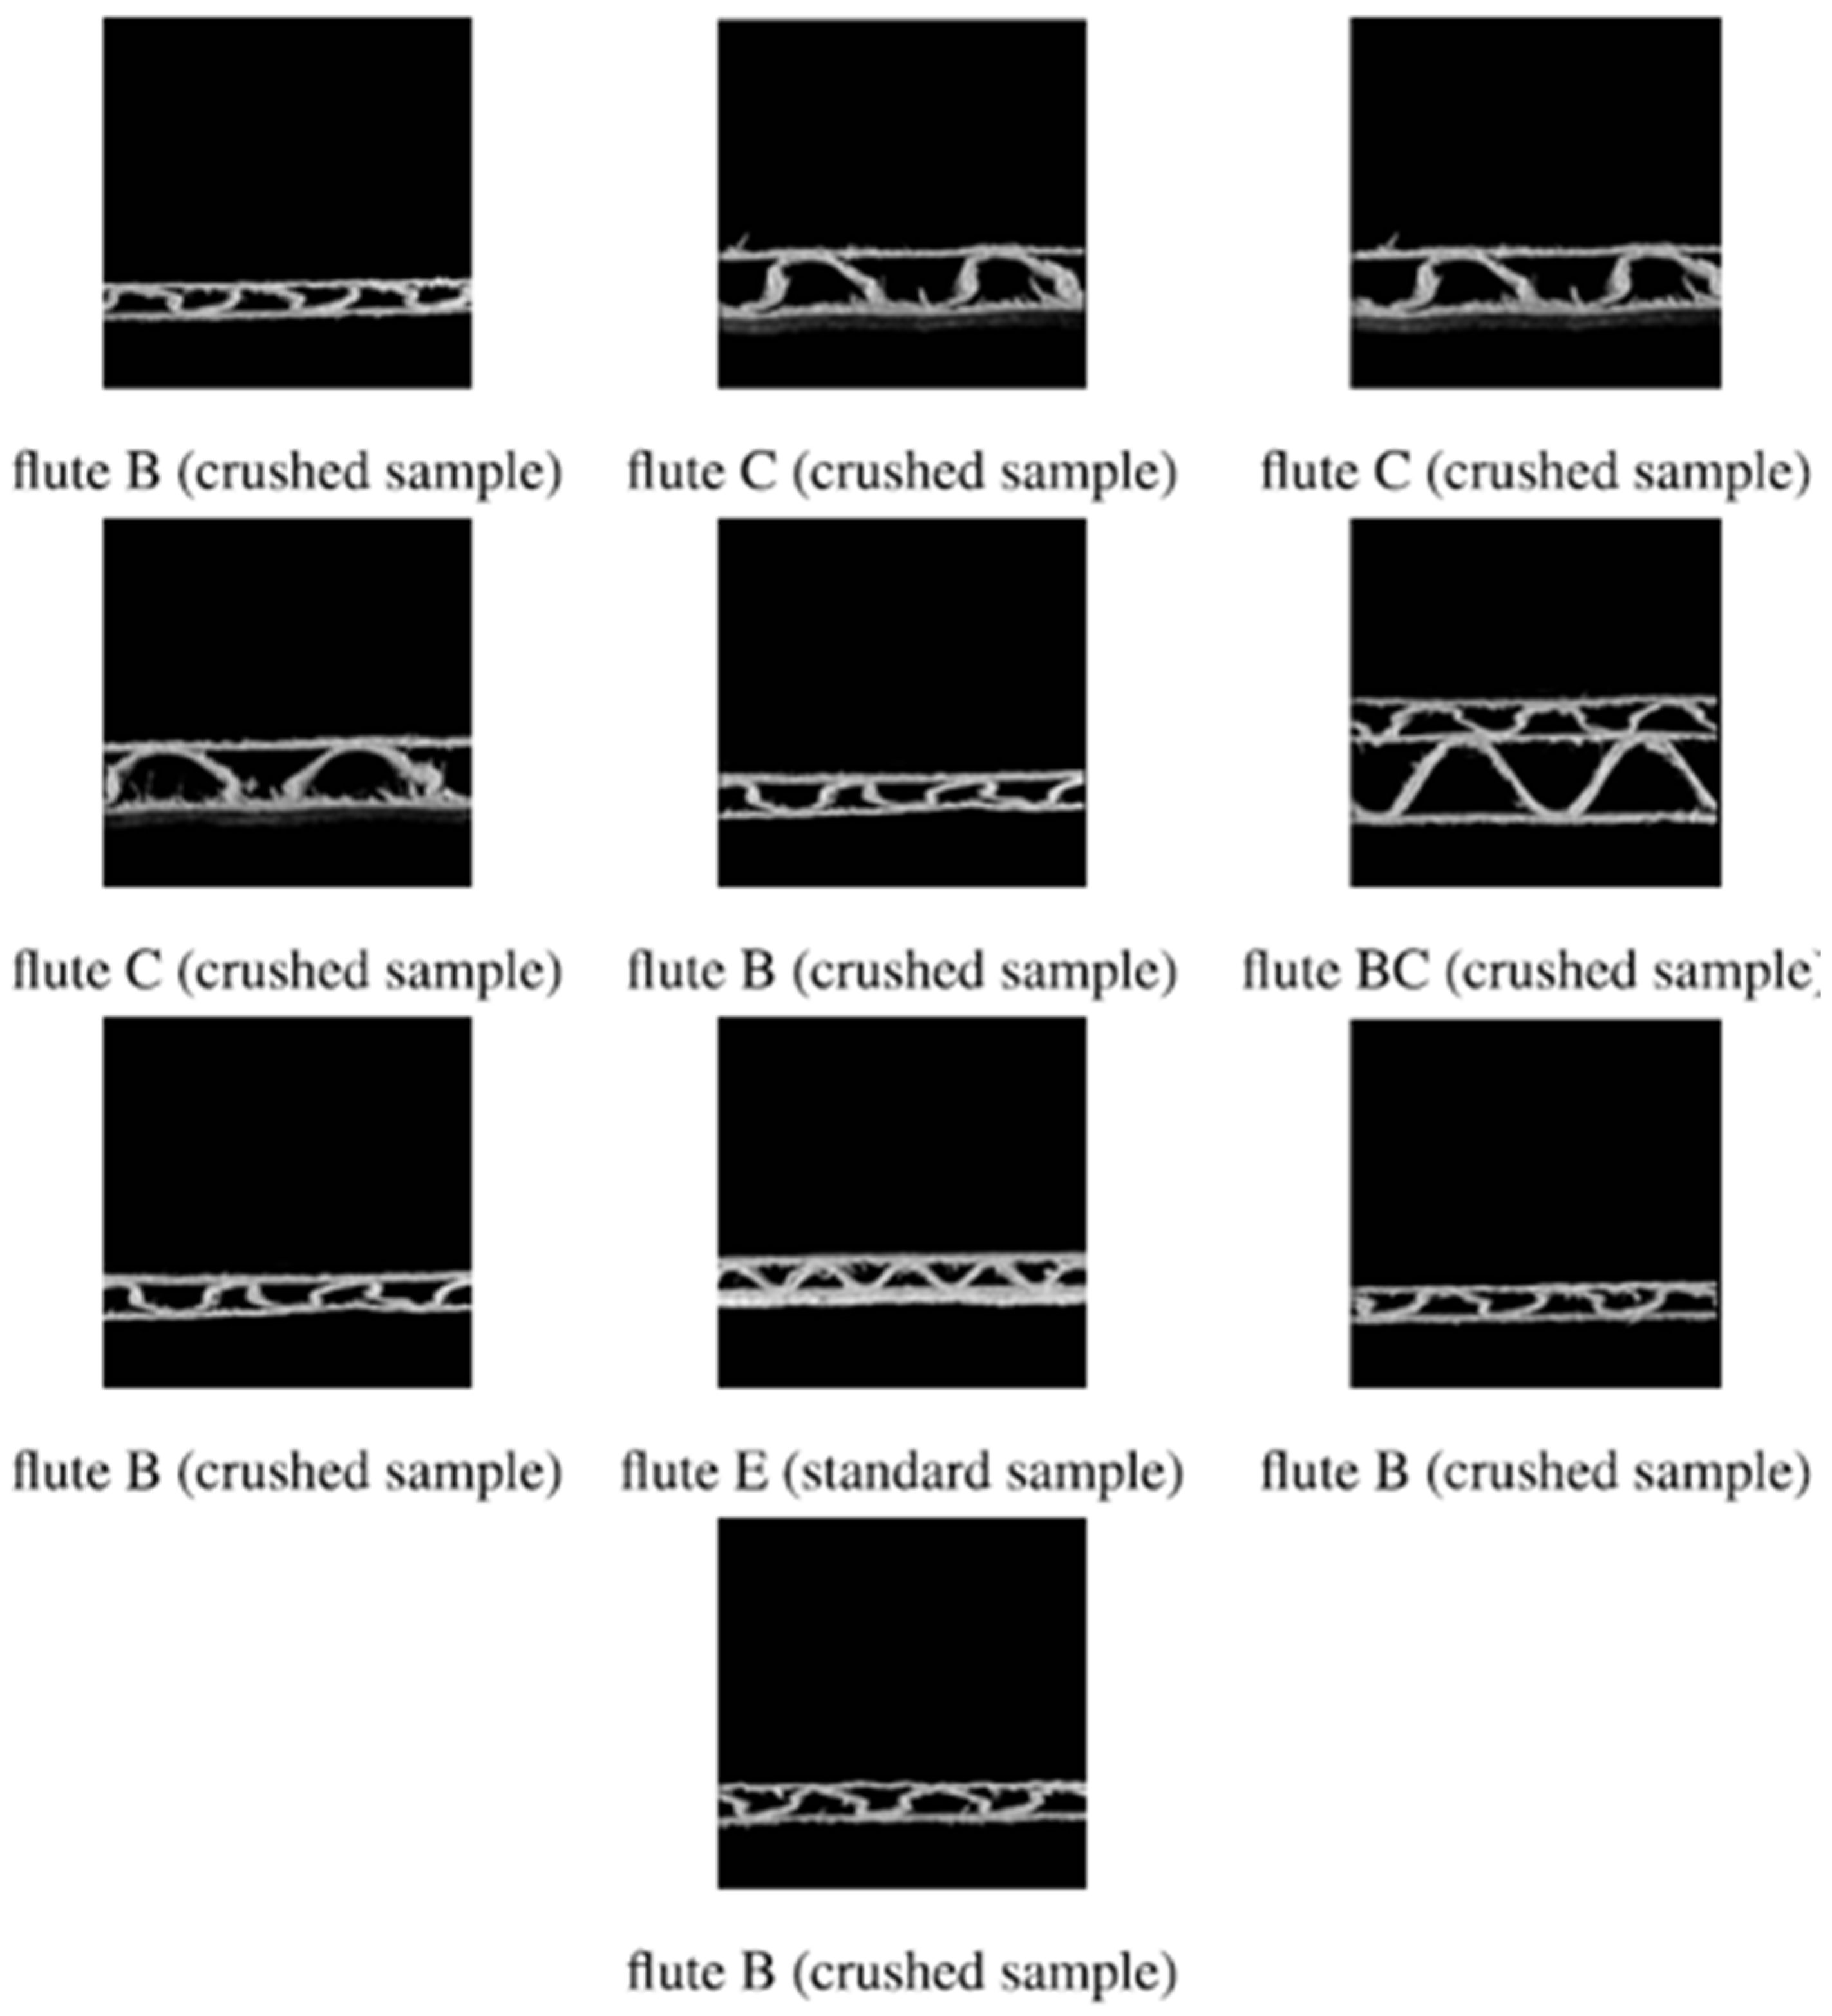
2.1. Corrugated Boards and Their Types
- A—flute with a height of approximately 5 mm;
- B—flute with a height of approximately 3 mm;
- C—flute with a height of approximately 4 mm;
- E—flute with a height of approximately 1.6 mm;
- F—flute with a height of approximately 0.8 mm.
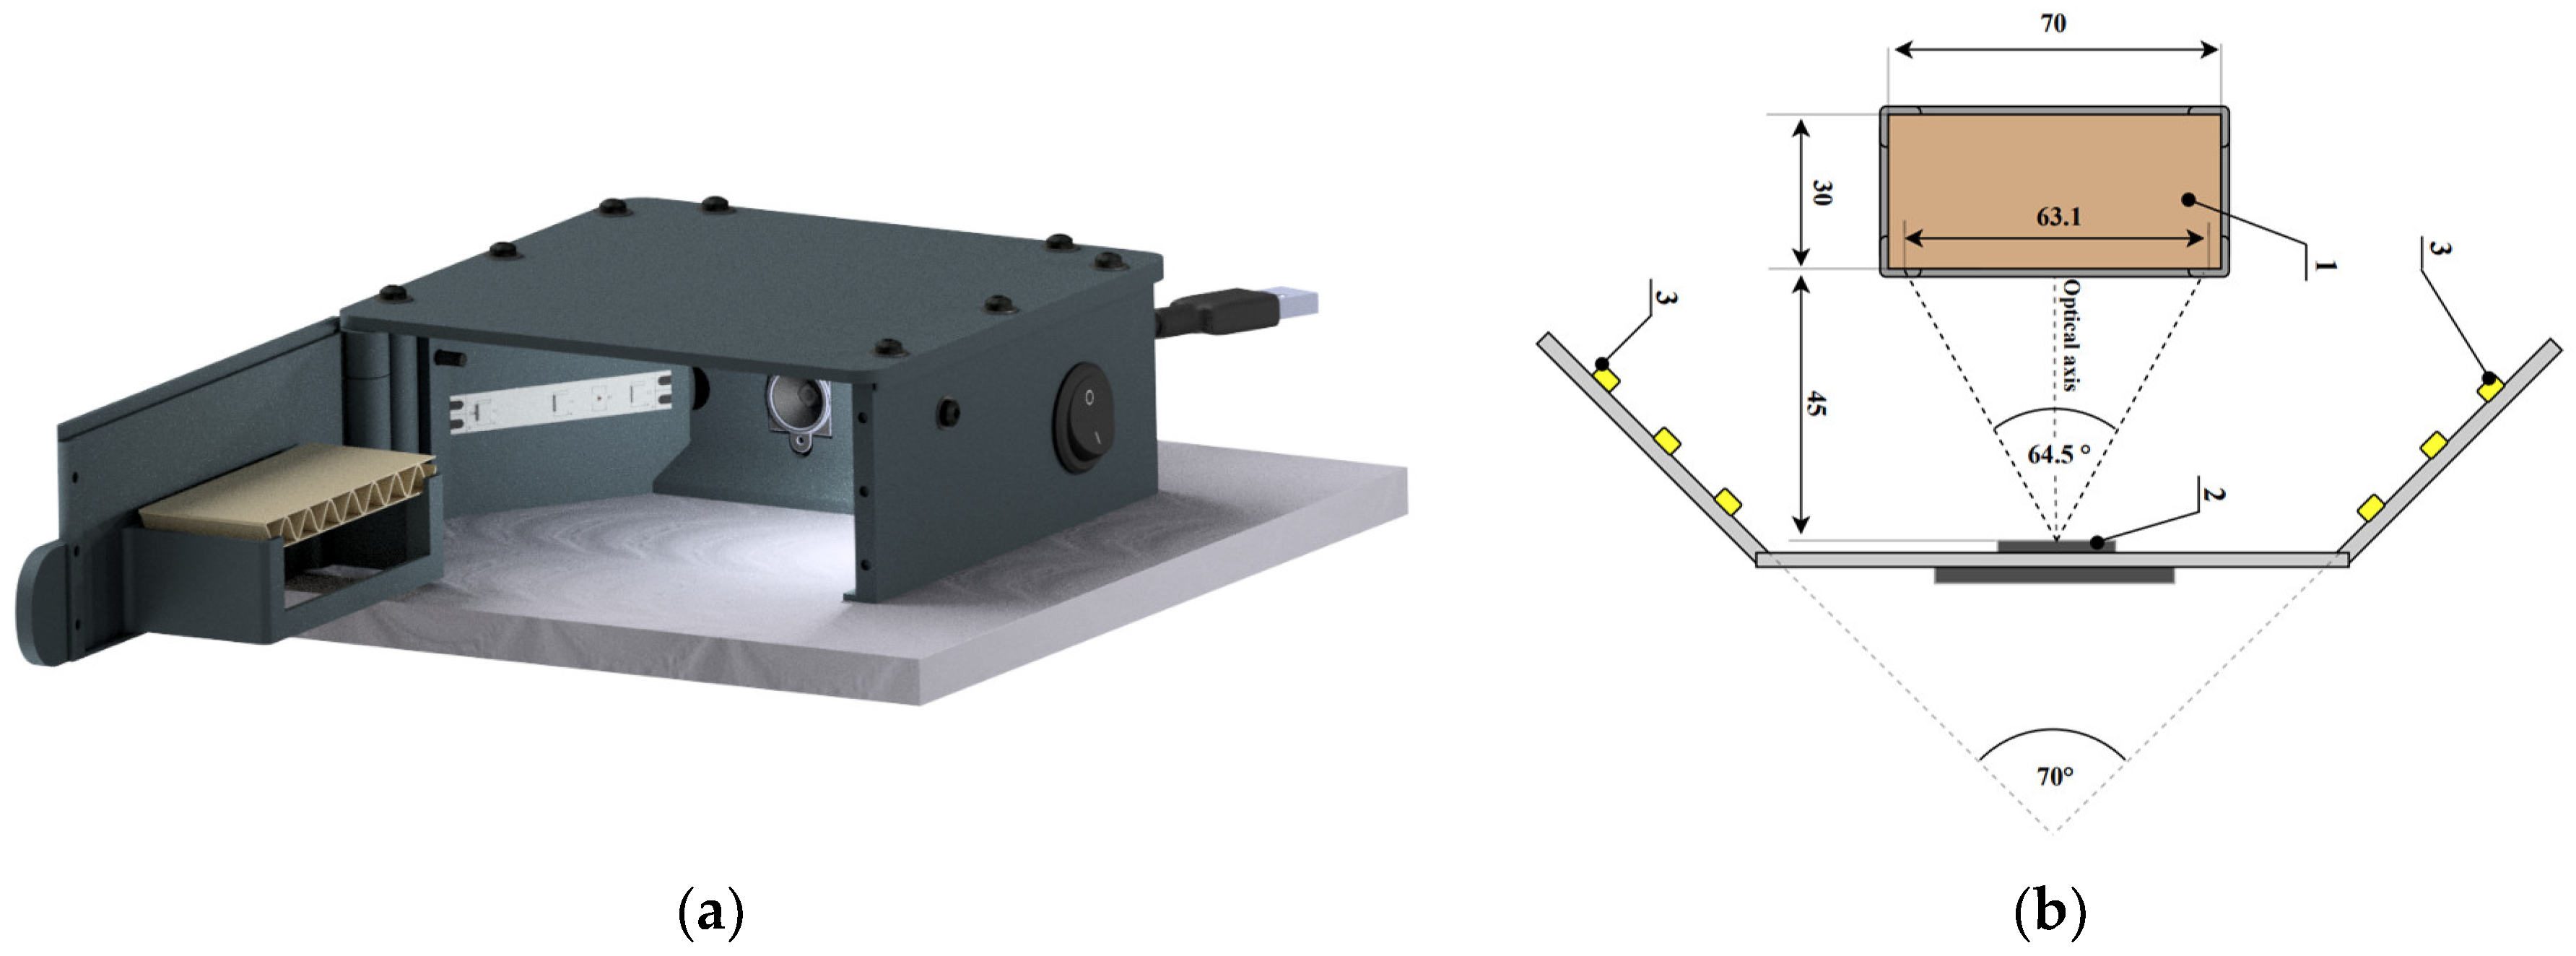
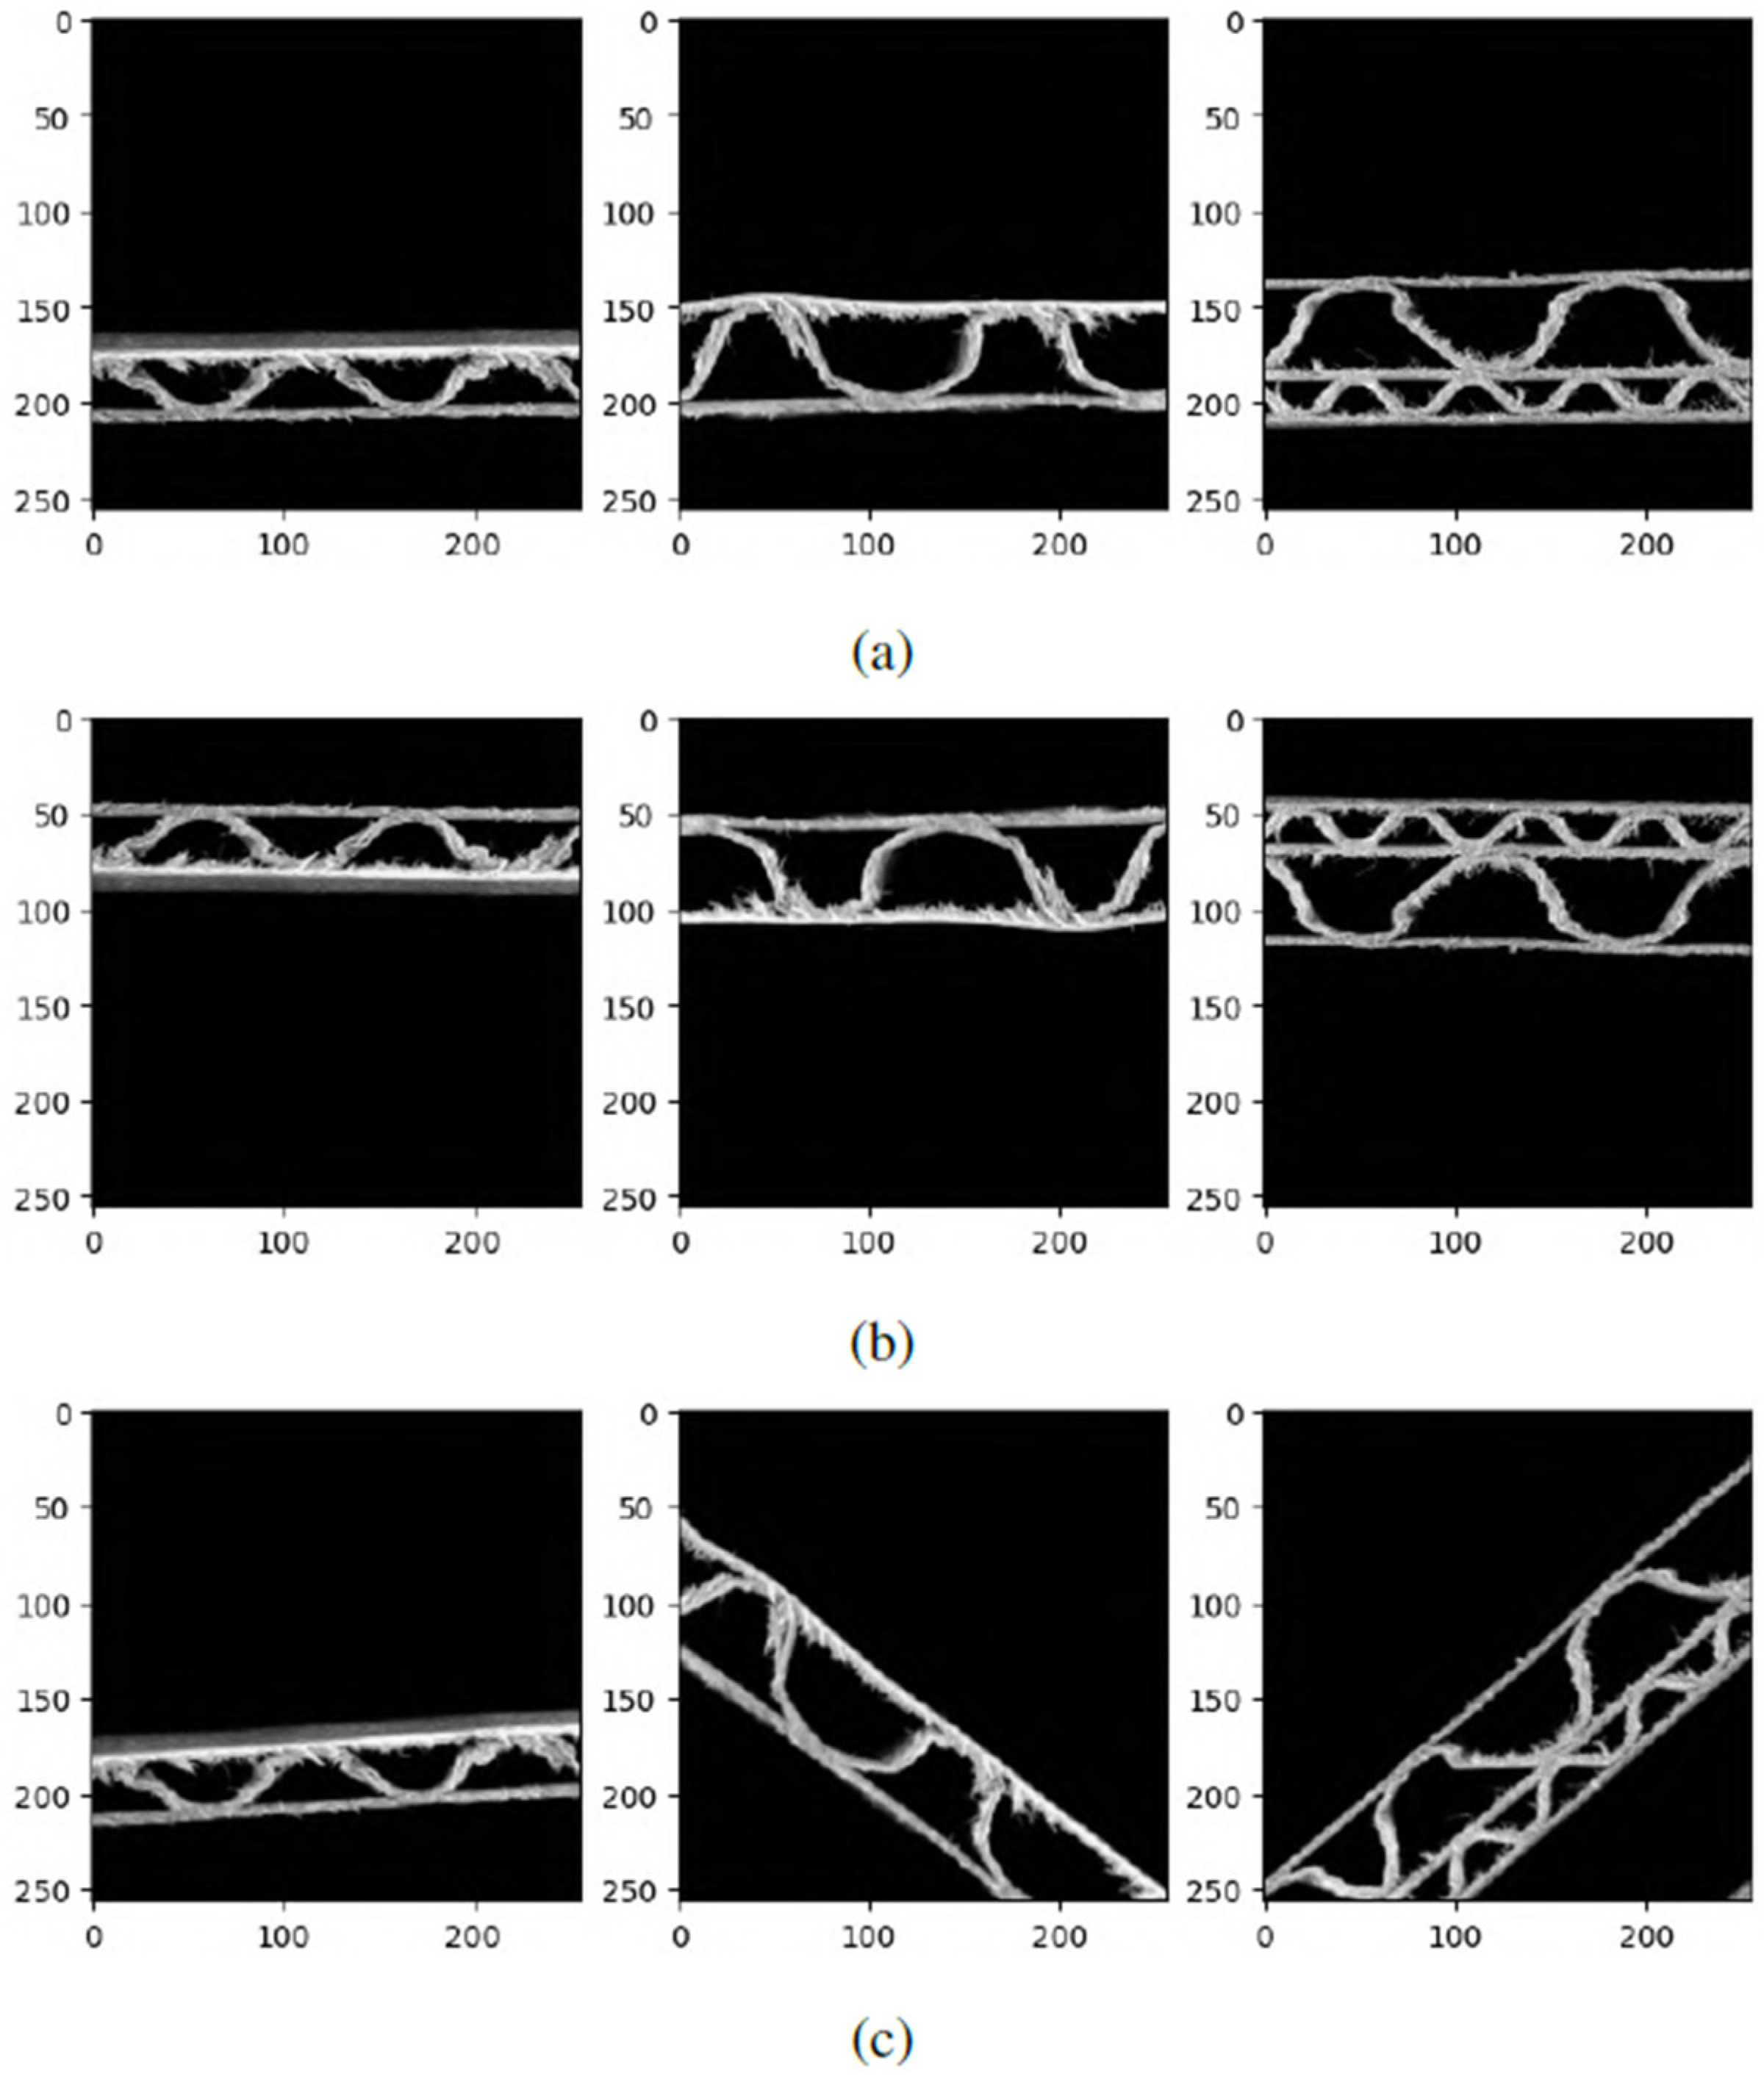
2.2. Data Acquition
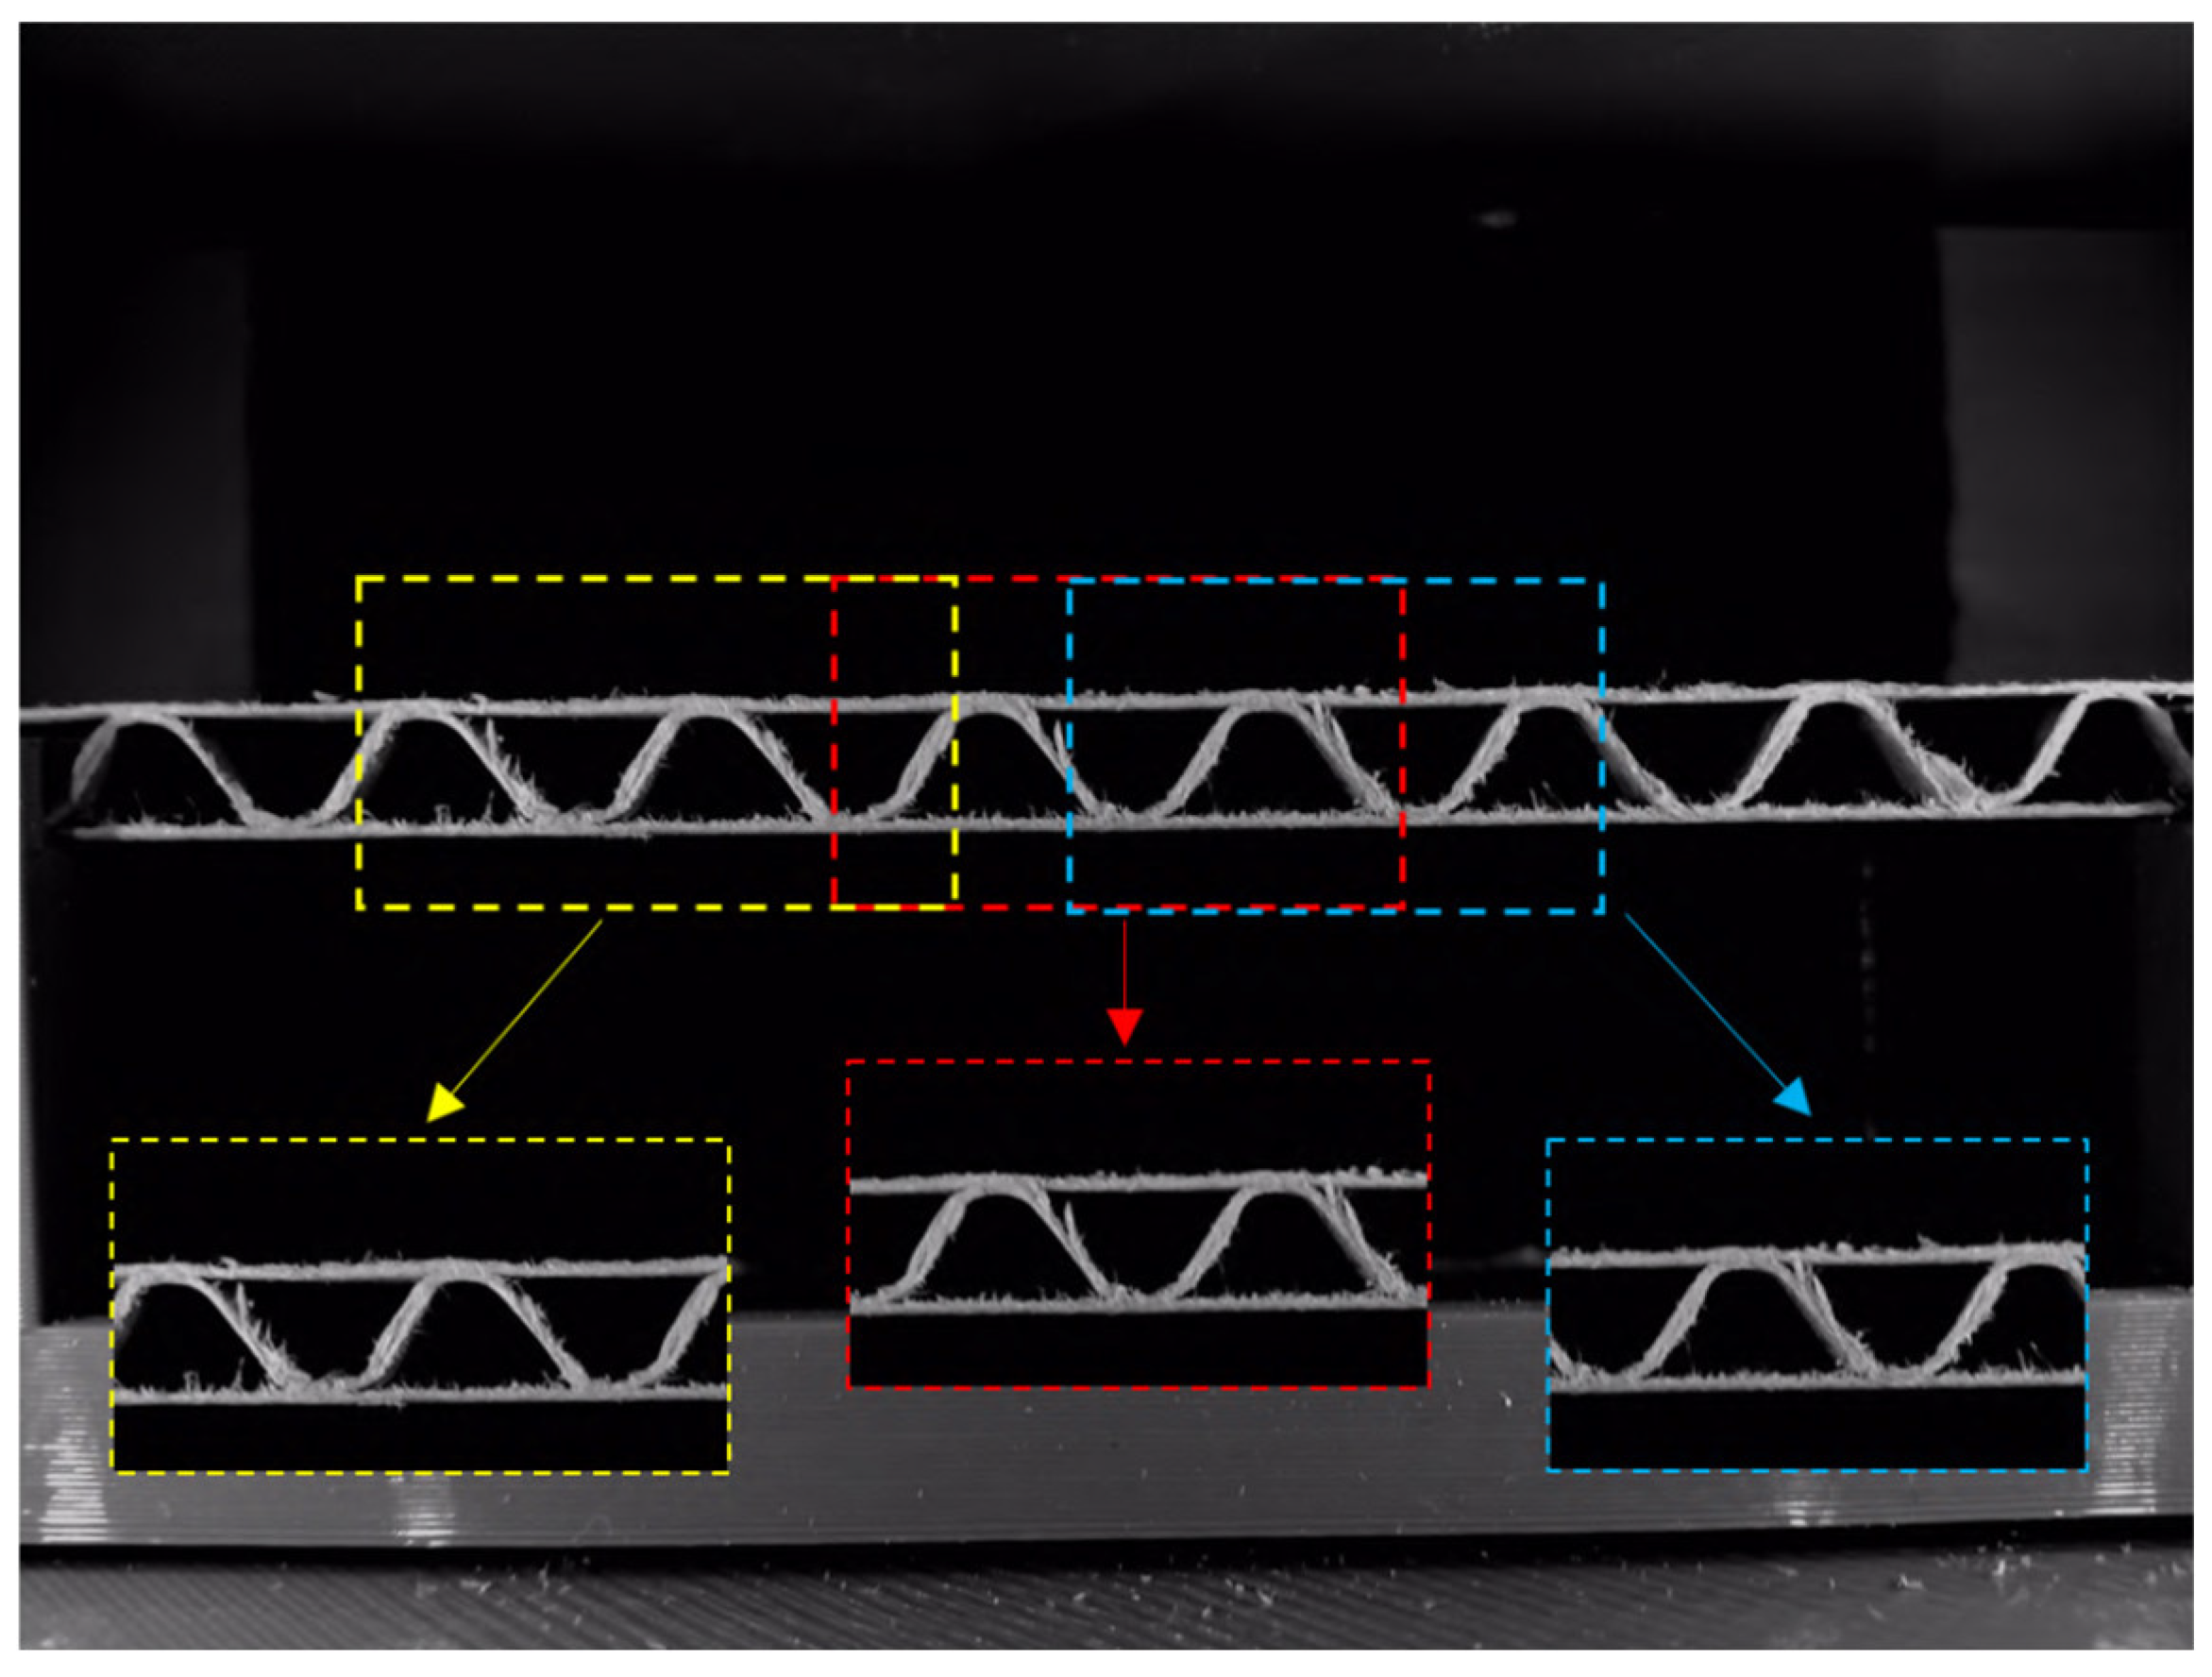
2.3. Dataset
- 49 images (70%) were randomly selected for the training set;
- 10 images (14.3%) were randomly selected for the validation set;
- 11 images (15.7%) were randomly selected for the test set.
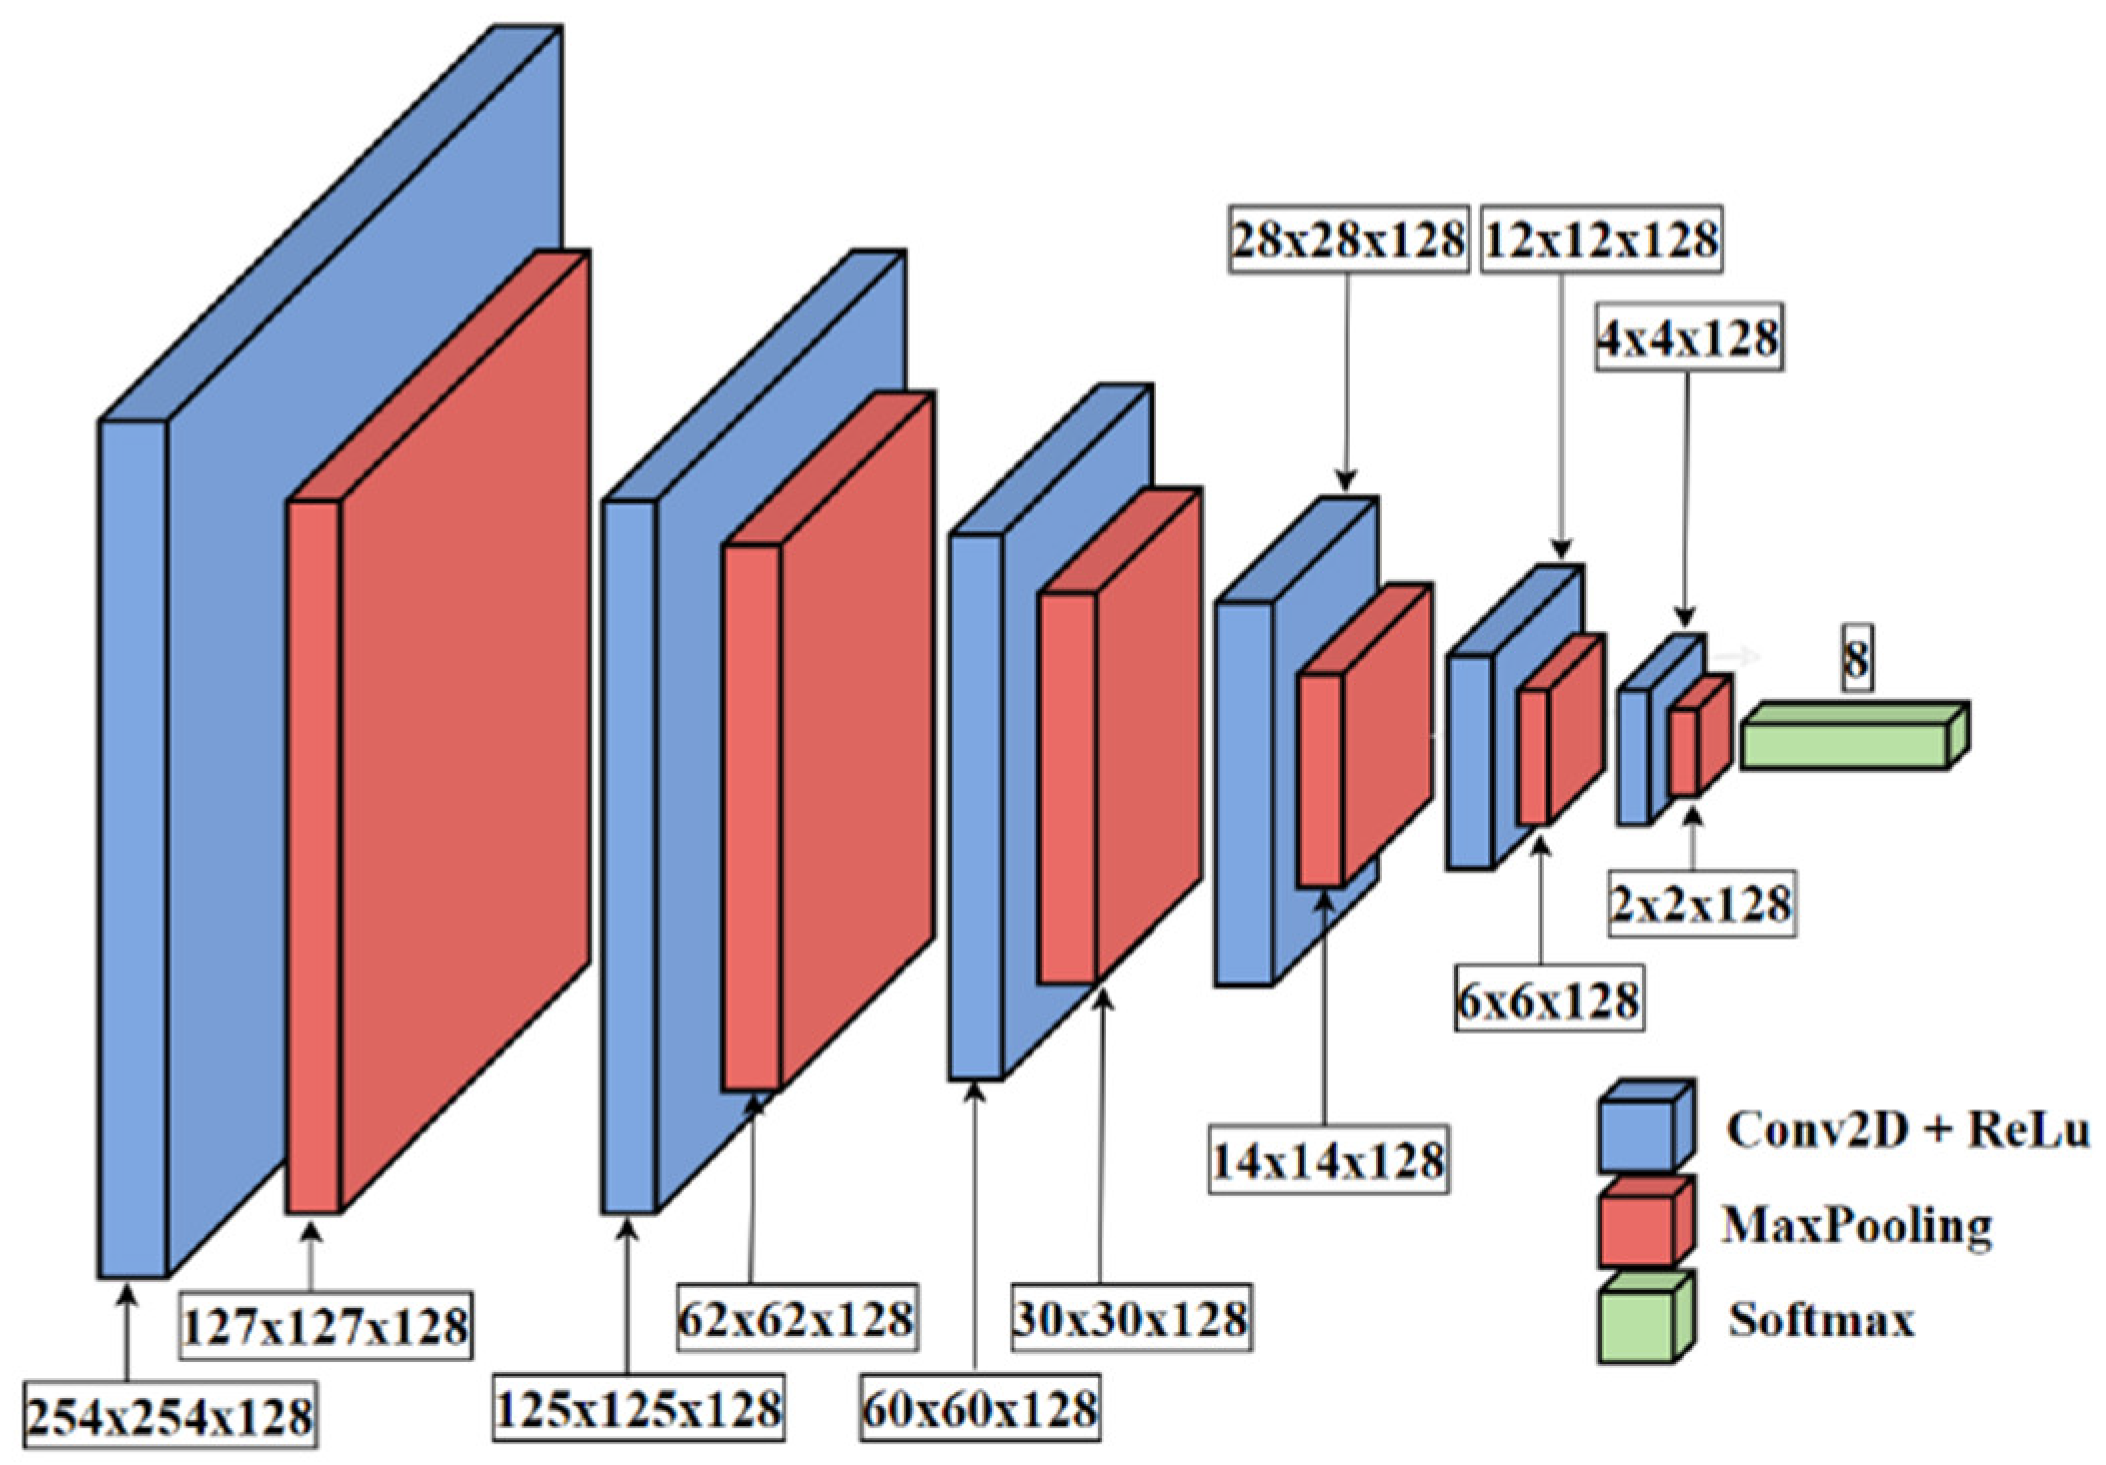
2.4. Convolutional Neural Network
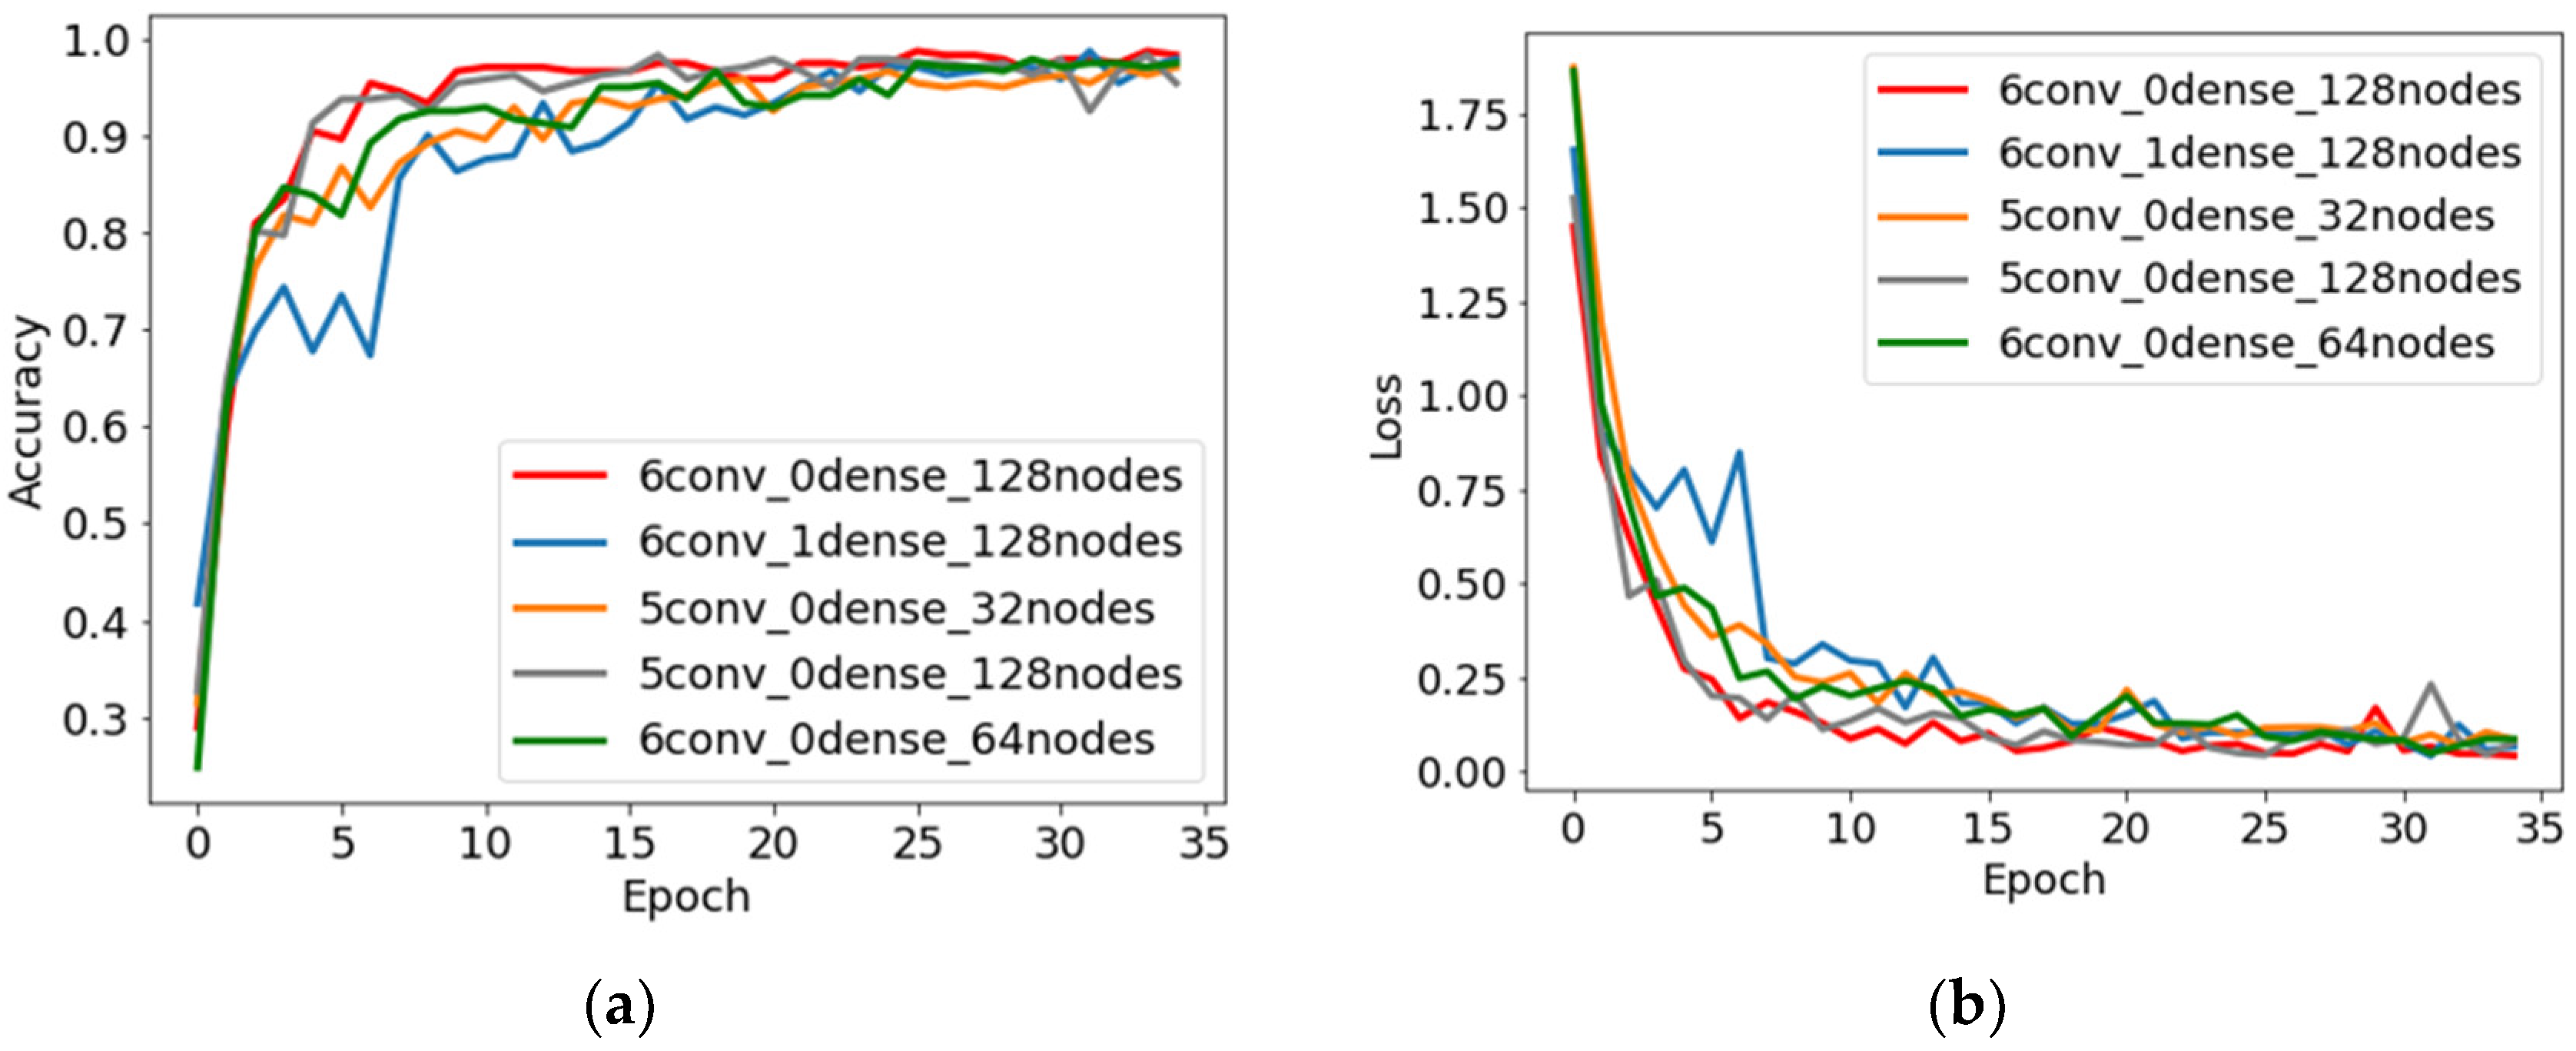
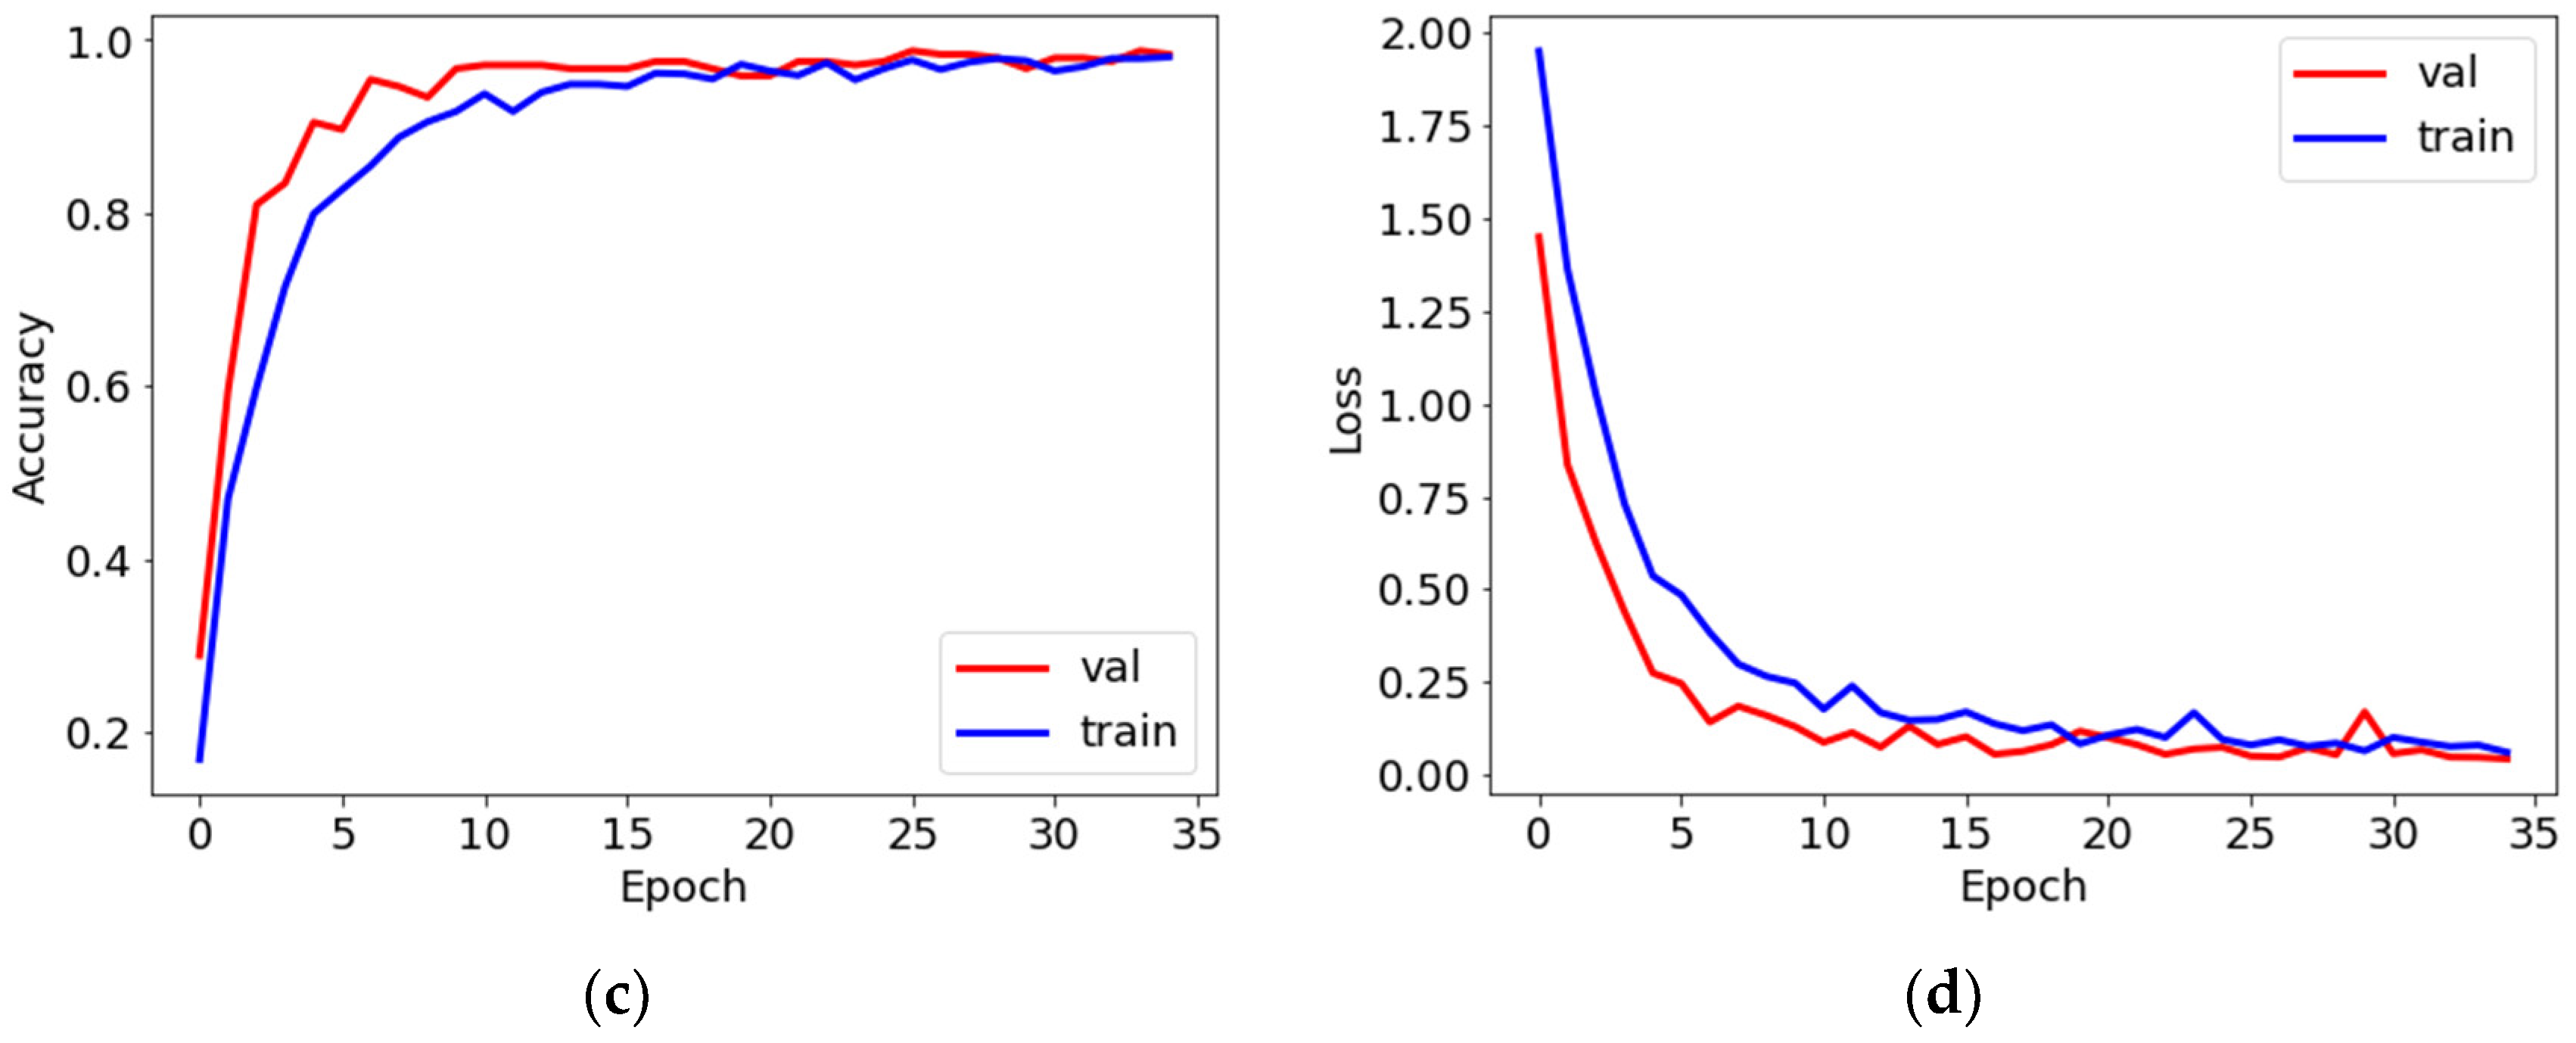
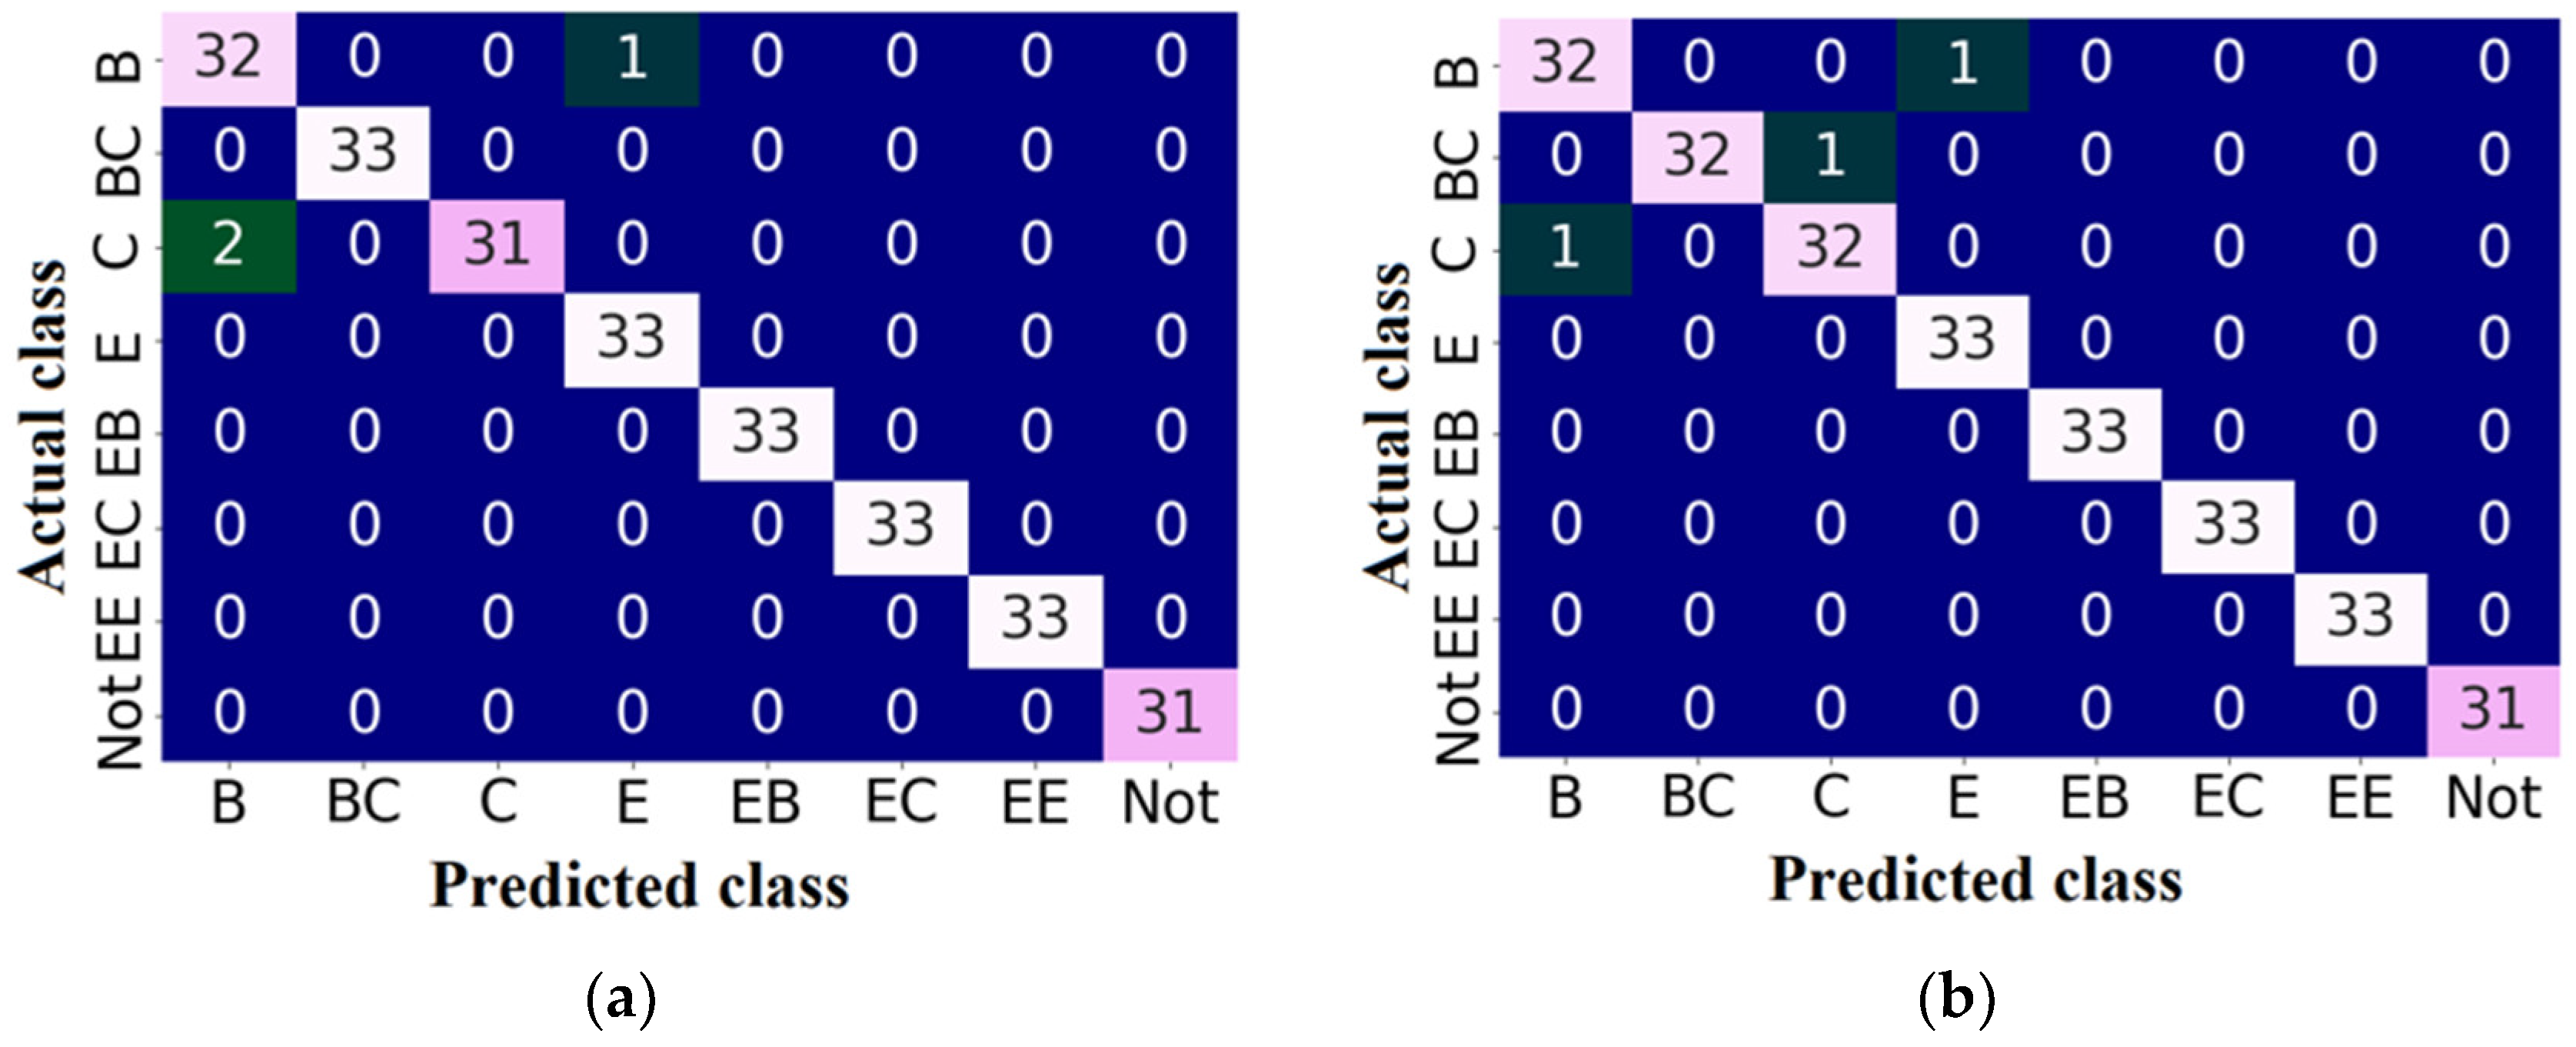
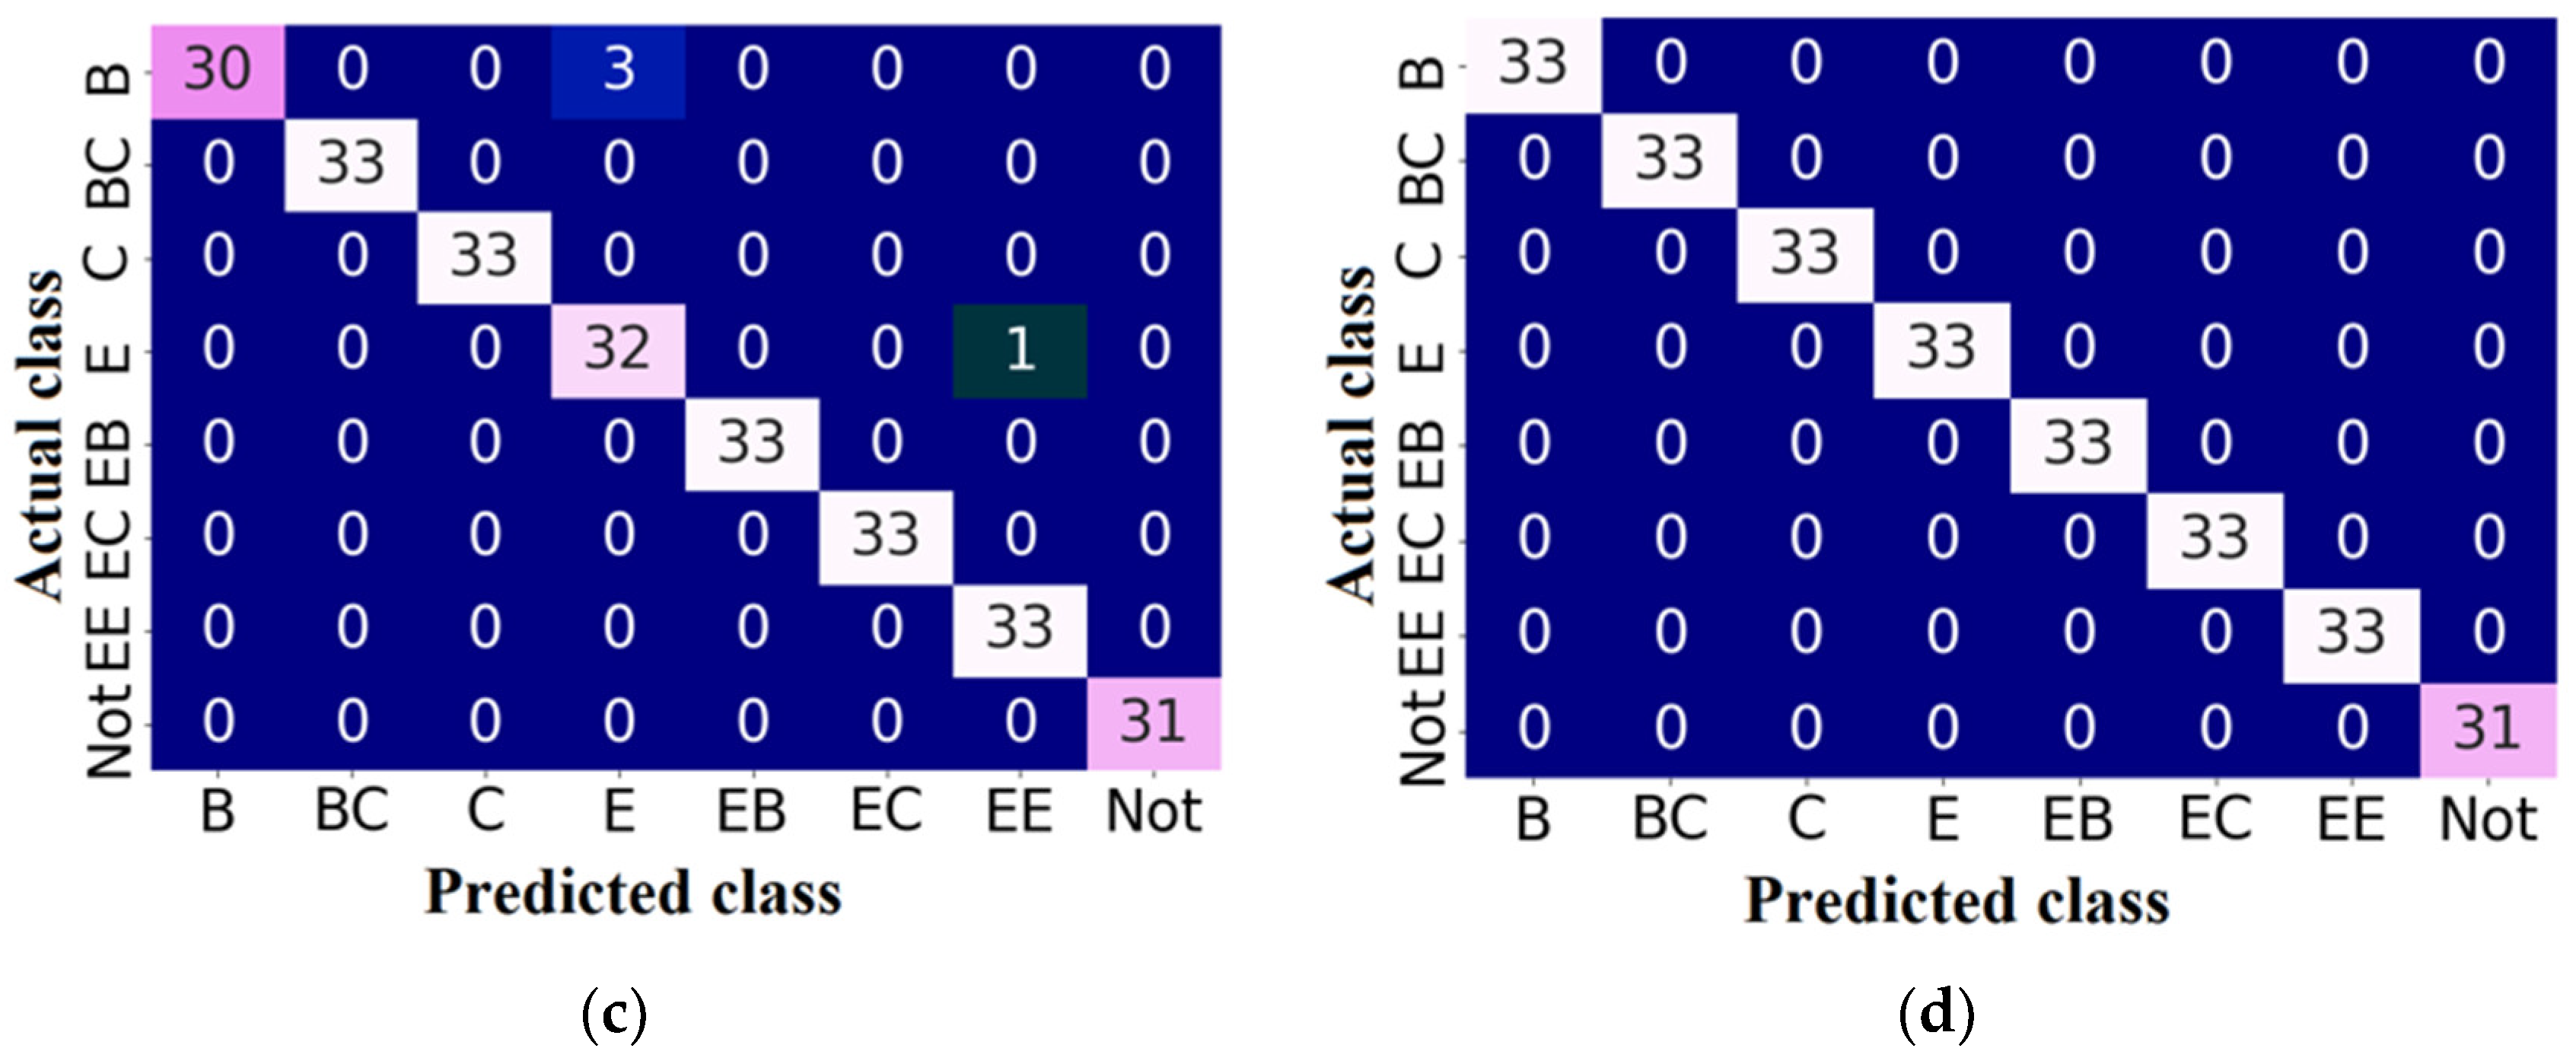
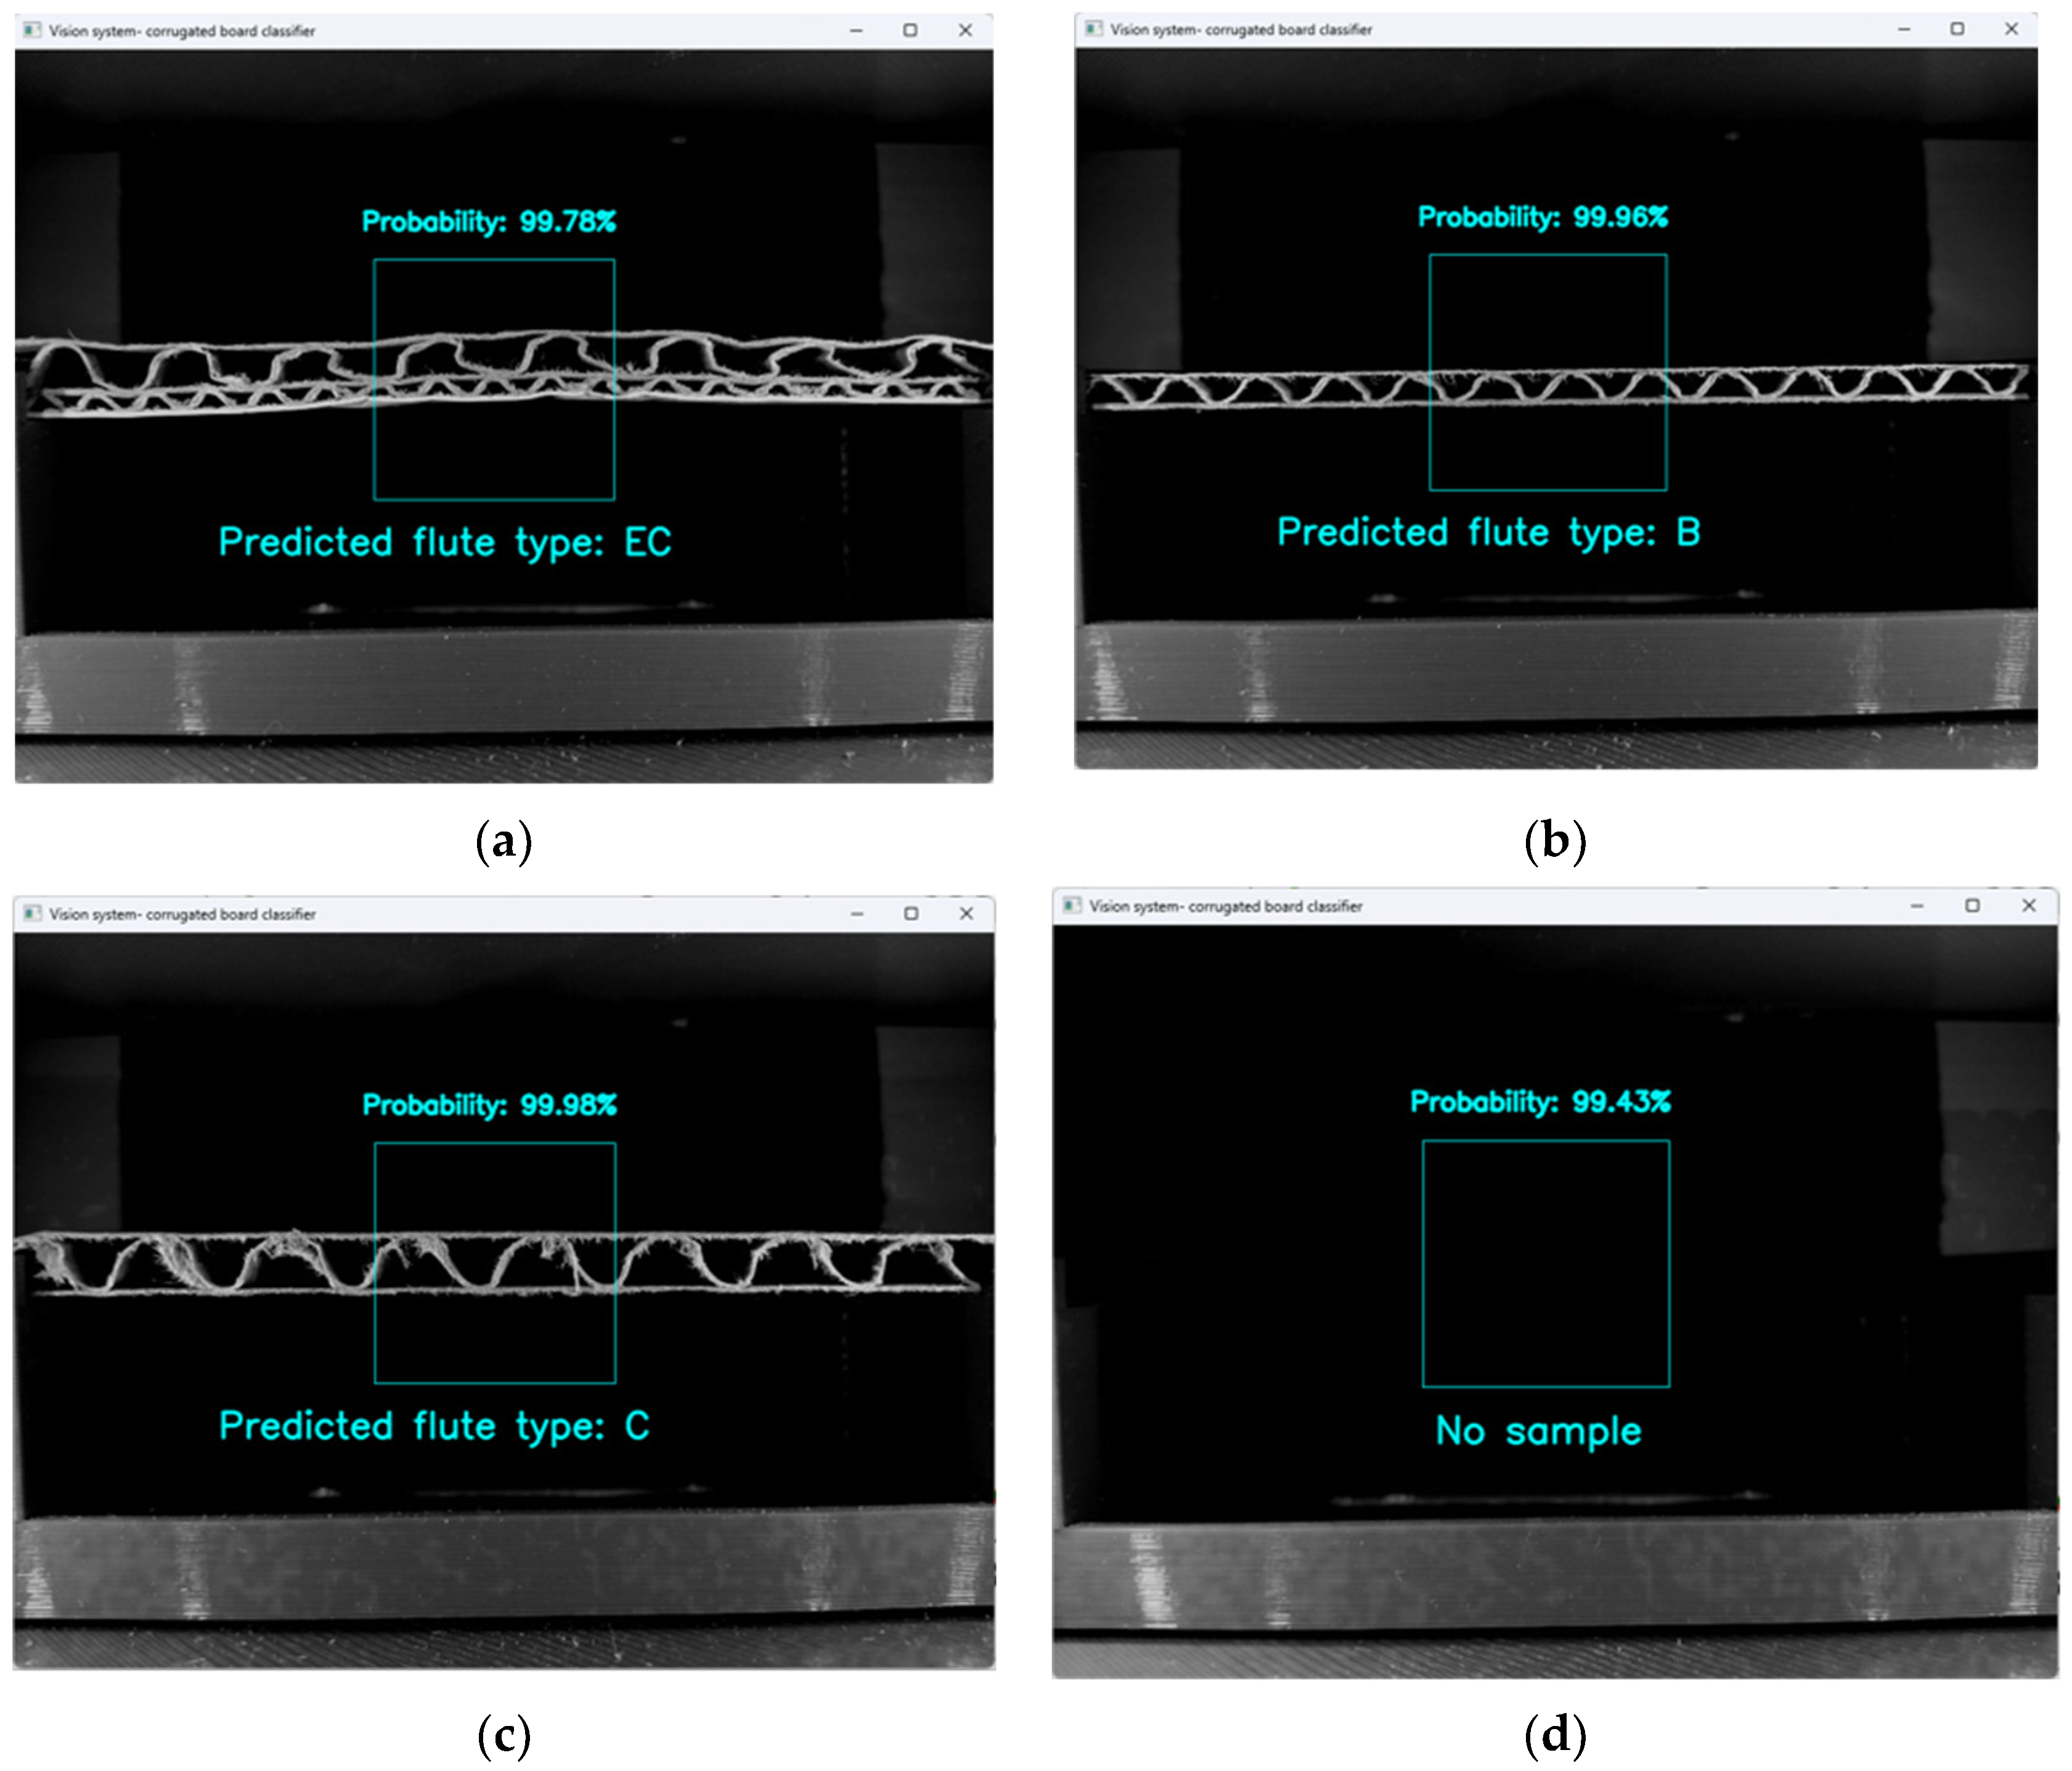
3. Results
- Number of convolutional layers—4, 5 or 6;
- Layer size (number of filters)—32, 64 or 128;
- Number of dense layers—0, 1 or 2.
4. Discussion
5. Conclusions
Author Contributions
Funding
Institutional Review Board Statement
Informed Consent Statement
Data Availability Statement
Acknowledgments
Conflicts of Interest
References
- Pereira, T.; Neves, A.S.L.; Silva, F.J.G.; Godina, R.; Morgado, L.; Pinto, G.F.L. Production Process Analysis and Improvement of Corrugated Cardboard Industry. Procedia Manuf. 2020, 51, 1395–1402. [Google Scholar] [CrossRef]
- Di Russo, F.M.; Desole, M.M.; Gisario, A.; Barletta, M. Evaluation of wave configurations in corrugated boards by experimental analysis (EA) and finite element modeling (FEM): The role of the micro-wave in packing design. Int. J. Adv. Manuf. Technol. 2023, 126, 4963–4982. [Google Scholar] [CrossRef] [PubMed]
- Beck, M.; Fischerauer, G. Modeling Warp in Corrugated Cardboard Based on Homogenization Techniques for In-Process Measurement Applications. Appl. Sci. 2022, 12, 1684. [Google Scholar] [CrossRef]
- Nordstrand, T.M. Parametric study of the post-buckling strength of structural core sandwich panels. Compos. Struct. 1995, 30, 441–451. [Google Scholar] [CrossRef]
- Nordstrand, T. Analysis and testing of corrugated board panels into the post-buckling regime. Compos. Struct. 2004, 63, 189–199. [Google Scholar] [CrossRef]
- Lu, T.J.; Chen, C.; Zhu, G. Compressive behaviour of corrugated board panels. J. Compos. Mater. 2001, 35, 2098–2126. [Google Scholar] [CrossRef]
- Garbowski, T.; Knitter-Piątkowska, A. Analytical Determination of the Bending Stiffness of a Five-Layer Corrugated Cardboard with Imperfections. Materials 2022, 15, 663. [Google Scholar] [CrossRef] [PubMed]
- Mrówczyński, D.; Knitter-Piątkowska, A.; Garbowski, T. Numerical Homogenization of Single-Walled Corrugated Board with Imperfections. Appl. Sci. 2022, 12, 9632. [Google Scholar] [CrossRef]
- Cillie, J.; Coetzee, C. Experimental and Numerical Investigation of the In-Plane Compression of Corrugated Paperboard Panels. Math. Comput. Appl. 2022, 27, 108. [Google Scholar] [CrossRef]
- Mrówczyński, D.; Garbowski, T. Influence of Imperfections on the Effective Stiffness of Multilayer Corrugated Board. Materials 2023, 16, 1295. [Google Scholar] [CrossRef]
- Biancolini, M.E.; Brutti, C. Numerical and experimental investigation of the strength of corrugated board packages. Packag. Technol. Sci. 2003, 16, 47–60. [Google Scholar] [CrossRef]
- Frank, B. Corrugated Box Compression—A Literature Survey. Packag. Technol. Sci. 2014, 27, 105–128. [Google Scholar] [CrossRef]
- McKee, R.C.; Gander, J.W.; Wachuta, J.R. Compression strength formula for corrugated boxes. Paperboard Packag. 1963, 48, 149–159. [Google Scholar]
- Maltenfort, G. Compression strength of corrugated containers. Fibre Contain. 1956, 41, 106–121. [Google Scholar]
- Allerby, I.M.; Laing, G.N.; Cardwell, R.D. Compressive strength—From components to corrugated containers. Appita Conf. Notes 1985, 1, 11. [Google Scholar]
- Fadiji, T.; Coetzee, C.J.; Berry, T.M.; Ambaw, A.; Opara, U.L. The efficacy of finite element analysis (FEA) as a design tool for food packaging: A review. Biosyst. Eng. 2018, 174, 20–40. [Google Scholar] [CrossRef]
- Domaneschi, M.; Perego, U.; Borgqvist, E.; Borsari, R. An industry-oriented strategy for the finite element simulation of paperboard creasing and folding. Packag. Technol. Sci. 2017, 30, 269–294. [Google Scholar] [CrossRef]
- Urbanik, T.J.; Saliklis, E.P. Finite element corroboration of buckling phenomena observed in corrugated boxes. Wood Fiber Sci. 2003, 35, 322–333. [Google Scholar]
- Heposalmi, S.; Matthews, S.; Leminen, V.; Varis, J.; Toghyani, A. FEM as a package design tool for corrugated paperboard. Procedia CIRP 2022, 109, 610–616. [Google Scholar] [CrossRef]
- Liu, W.; Ouyang, H.; Liu, Q.; Cai, S.; Wang, C.; Xie, J.; Hu, W. Image recognition for garbage classification based on transfer learning and model fusion. Math. Probl. Eng. 2022, 2022, 4793555. [Google Scholar] [CrossRef]
- Rahman, M.O.; Hussain, A.; Scavino, E.; Hannan, M.A.; Basri, H. Recyclable waste paper sorting using template matching. In Proceedings of the First International Visual Informatics Conference, IVIC 2009, Kuala Lumpur, Malaysia, 11–13 November 2009; pp. 467–478. [Google Scholar] [CrossRef]
- Cebeci, U.; Aslan, F.; Çelik, M.; Aydın, H. Developing a new counting approach for the corrugated boards and its industrial application by using image processing algorithm. In Practical Applications of Intelligent Systems. Advances in Intelligent Systems and Computing 279; Wen, Z., Li, T., Eds.; Springer: Berlin/Heidelberg, Germany, 2014; pp. 1021–1040. [Google Scholar] [CrossRef]
- Suppitaksakul, C.; Rattakorn, M. Machine vision system for counting the number of corrugated cardboard. In Proceedings of the International Electrical Engineering Congress (iEECON), Chonburi, Thailand, 19–21 March 2014; pp. 1–4. [Google Scholar] [CrossRef]
- Suppitaksakul, C.; Suwannakit, W. A combination of corrugated cardboard images using image stitching technique. In Proceedings of the 15th International Conference on Electrical Engineering/Electronics, Computer, Telecommunications and Information Technology, Chiang Rai, Thailand, 18–21 July 2018; pp. 262–265. [Google Scholar] [CrossRef]
- Caputo, B.; Hayman, E.; Fritz, M.; Eklundh, J.-O. Classifying materials in the real world. Image Vis. Comput. 2010, 28, 150–163. [Google Scholar] [CrossRef]
- Iqbal Hussain, M.A.; Khan, B.; Wang, Z.; Ding, S. Woven Fabric Pattern Recognition and Classification Based on Deep Convolutional Neural Networks. Electronics 2020, 9, 1048. [Google Scholar] [CrossRef]
- Wyder, P.M.; Lipson, H. Visual design intuition: Predicting dynamic properties of beams from raw cross-section images. J. R. Soc. Interface 2021, 18, 20210571. [Google Scholar] [CrossRef] [PubMed]
- Li, M.; Liu, Z.; Huang, L.; Chen, Q.; Tong, C.; Fang, Y.; Han, W.; Zhu, P. Automatic identification framework of the geometric parameters on self-piercing riveting cross-section using deep learning. J. Manuf. Process. 2022, 83, 427–437. [Google Scholar] [CrossRef]
- Ma, Q.; Rejab, M.R.M.; Azeem, M.; Idris, M.S.; Rani, M.F.; Praveen Kumar, A. Axial and radial crushing behaviour of thin-walled carbon fiber-reinforced polymer tubes fabricated by the real-time winding angle measurement system. Forces Mech. 2023, 10, 100170. [Google Scholar] [CrossRef]
- Daigo, I.; Murakami, K.; Tajima, K.; Kawakami, R. Thickness classifier on steel in heavy melting scrap by deep-learning-based image analysis. ISIJ Int. 2023, 63, 197–203. [Google Scholar] [CrossRef]
- Liu, Y.; Wu, Q.; Wang, P.; Zhuang, W. Forming process predition of a self-piercing riveted joint in carbon fibre reinforced composites and aluminium alloy based on deep learning. J. Manuf. Process. 2023, 106, 453–464. [Google Scholar] [CrossRef]
- Kato, S.; Wada, N.; Shiogai, K.; Tamaki, T.; Kagawa, T.; Toyosaki, R.; Nobuhara, H. Crack Severity Classification from Timber Cross-Sectional Images Using Convolutional Neural Network. Appl. Sci. 2023, 13, 1280. [Google Scholar] [CrossRef]
- Toyosaki, R.; Kato, S.; Tamaki, T.; Wada, N.; Kagawa, T.; Shiogai, K.; Nobuhara, H. Evaluation of the Timber Internal Crack Using CNN. In Advances on P2P, Parallel, Grid, Cloud and Internet Computing. 3PGCIC 2023, Lecture Notes on Data Engineering and Communications Technologies; Barolli, L., Ed.; Springer: Cham, Germany, 2024; Volume 189, pp. 263–273. [Google Scholar] [CrossRef]
- Huynh, T.N.; Lee, J. Optimal thickness distribution design for blending composite laminates using buckling factor prediction. Compos. Struct. 2024, 327, 117693. [Google Scholar] [CrossRef]
- Rogalka, M.; Grabski, J.K.; Garbowski, T. Identification of Geometric Features of the Corrugated Board Using Images and Genetic Algorithm. Sensors 2023, 23, 6242. [Google Scholar] [CrossRef]
- Rogalka, M.; Grabski, J.K.; Garbowski, T. Deciphering Double-Walled Corrugated Board Geometry Using Image Analysis and Genetic Algorithm. Preprints 2024, 2024011721. [Google Scholar] [CrossRef]
- Rogalka, M.; Grabski, J.K.; Garbowski, T. A Comparison of Two Artificial Intelligence Approaches for Corrugated Board Type Classification. Eng. Proc. 2023, 56, 272. [Google Scholar] [CrossRef]
- Femat. Available online: https://fematsystems.pl (accessed on 19 January 2024).

| Flute Type | Number of Non-Deformed Samples | Number of Manually Deformed Samples | Number of Samples Deformed Using Creasing Machine | Total Number of Samples |
|---|---|---|---|---|
| flute B | 48 | 48 | 48 | 144 |
| flute BC | 40 | 40 | 40 | 120 |
| flute C | 28 | 28 | 28 | 84 |
| flute E | 36 | 36 | 36 | 108 |
| flute EB | 44 | 44 | 44 | 132 |
| flute EC | 8 | 8 | 8 | 24 |
| flute EE | 12 | 12 | 12 | 36 |
| Total number of samples | 216 | 216 | 216 | 648 |
| Class | Number of Non-Deformed Samples Images | Number of Manually Deformed Samples Images | Number of Samples Deformed Using Creasing Machine | Total Number of Images |
|---|---|---|---|---|
| class B | 70 | 70 | 70 | 210 |
| class BC | 70 | 70 | 70 | 210 |
| class C | 70 | 70 | 70 | 210 |
| class E | 70 | 70 | 70 | 210 |
| class EB | 70 | 70 | 70 | 210 |
| class EC | 70 | 70 | 70 | 210 |
| class EE | 70 | 70 | 70 | 210 |
| Total number of samples | 490 | 490 | 490 | 1470 |
| class Not | 210 | 1680 | ||
| CNN Model | Accuracy (%) | Average Accuracy (%) | |||
|---|---|---|---|---|---|
| dataset1 | dataset2 | dataset3 | dataset4 | ||
| 6conv_0dense_128nodes | 98.85 | 98.85 | 98.47 | 100.00 | 99.04 |
| 6conv_1dense_128nodes | 98.09 | 99.24 | 97.71 | 99.62 | 98.67 |
| 5conv_0dense_32nodes | 96.95 | 99.24 | 97.71 | 98.85 | 98.19 |
| 5conv_0dense_128nodes | 96.56 | 99.24 | 99.24 | 97.71 | 98.19 |
| 6conv_0dense_64nodes | 96.56 | 98.09 | 98.47 | 99.24 | 98.09 |
| 5conv_1dense_128nodes | 96.18 | 97.71 | 98.47 | 99.62 | 98.00 |
| 5conv_1dense_64nodes | 96.56 | 97.71 | 98.47 | 98.85 | 97.90 |
| 6conv_0dense_32nodes | 97.71 | 96.56 | 98.09 | 98.85 | 97.80 |
| 4conv_0dense_128nodes | 96.18 | 96.56 | 97.33 | 98.85 | 97.23 |
| 5conv_0dense_64nodes | 96.18 | 98.09 | 94.66 | 99.62 | 97.14 |
| 6conv_1dense_64nodes | 98.09 | 93.51 | 97.71 | 98.47 | 96.95 |
| 6conv_2dense_128nodes | 97.33 | 92.75 | 98.09 | 98.85 | 96.76 |
| 4conv_0dense_64nodes | 95.42 | 98.47 | 95.80 | 97.33 | 96.76 |
| 5conv_2dense_128nodes | 95.04 | 96.95 | 96.56 | 97.33 | 96.47 |
| 4conv_1dense_128nodes | 93.51 | 97.71 | 95.04 | 96.95 | 95.80 |
| 5conv_1dense_32nodes | 89.69 | 97.33 | 95.80 | 98.09 | 95.23 |
| 4conv_1dense_64nodes | 92.37 | 97.33 | 94.27 | 96.56 | 95.13 |
| 5conv_2dense_64nodes | 93.51 | 93.89 | 93.89 | 98.09 | 94.85 |
| 6conv_2dense_64nodes | 90.08 | 96.56 | 95.80 | 96.16 | 94.65 |
| 6conv_1dense_32nodes | 95.42 | 93.51 | 96.56 | 91.22 | 94.18 |
| 4conv_0dense_32nodes | 92.75 | 93.89 | 92.75 | 96.56 | 93.99 |
| 4conv_2dense_128nodes | 93.13 | 95.42 | 92.75 | 94.27 | 93.89 |
| 4conv_2dense_64nodes | 93.51 | 91.98 | 91.60 | 92.75 | 92.46 |
| 4conv_1dense_32nodes | 91.22 | 91.60 | 90.84 | 95.42 | 92.27 |
| 5conv_2dense_32nodes | 90.46 | 91.22 | 88.55 | 92.37 | 90.65 |
| 6conv_2dense_32nodes | 87.79 | 80.92 | 87.79 | 88.55 | 86.26 |
| 4conv_2dense_32nodes | 86.64 | 79.77 | 89.69 | 85.11 | 85.30 |
Disclaimer/Publisher’s Note: The statements, opinions and data contained in all publications are solely those of the individual author(s) and contributor(s) and not of MDPI and/or the editor(s). MDPI and/or the editor(s) disclaim responsibility for any injury to people or property resulting from any ideas, methods, instructions or products referred to in the content. |
© 2024 by the authors. Licensee MDPI, Basel, Switzerland. This article is an open access article distributed under the terms and conditions of the Creative Commons Attribution (CC BY) license (https://creativecommons.org/licenses/by/4.0/).
Share and Cite
Rogalka, M.; Grabski, J.K.; Garbowski, T. In-Situ Classification of Highly Deformed Corrugated Board Using Convolution Neural Networks. Sensors 2024, 24, 1051. https://doi.org/10.3390/s24041051
Rogalka M, Grabski JK, Garbowski T. In-Situ Classification of Highly Deformed Corrugated Board Using Convolution Neural Networks. Sensors. 2024; 24(4):1051. https://doi.org/10.3390/s24041051
Chicago/Turabian StyleRogalka, Maciej, Jakub Krzysztof Grabski, and Tomasz Garbowski. 2024. "In-Situ Classification of Highly Deformed Corrugated Board Using Convolution Neural Networks" Sensors 24, no. 4: 1051. https://doi.org/10.3390/s24041051
APA StyleRogalka, M., Grabski, J. K., & Garbowski, T. (2024). In-Situ Classification of Highly Deformed Corrugated Board Using Convolution Neural Networks. Sensors, 24(4), 1051. https://doi.org/10.3390/s24041051