

An Optical Signal Simulator for the Characterization of Photoplethysmographic Devices


Abstract
1. Introduction
2. Materials and Methods
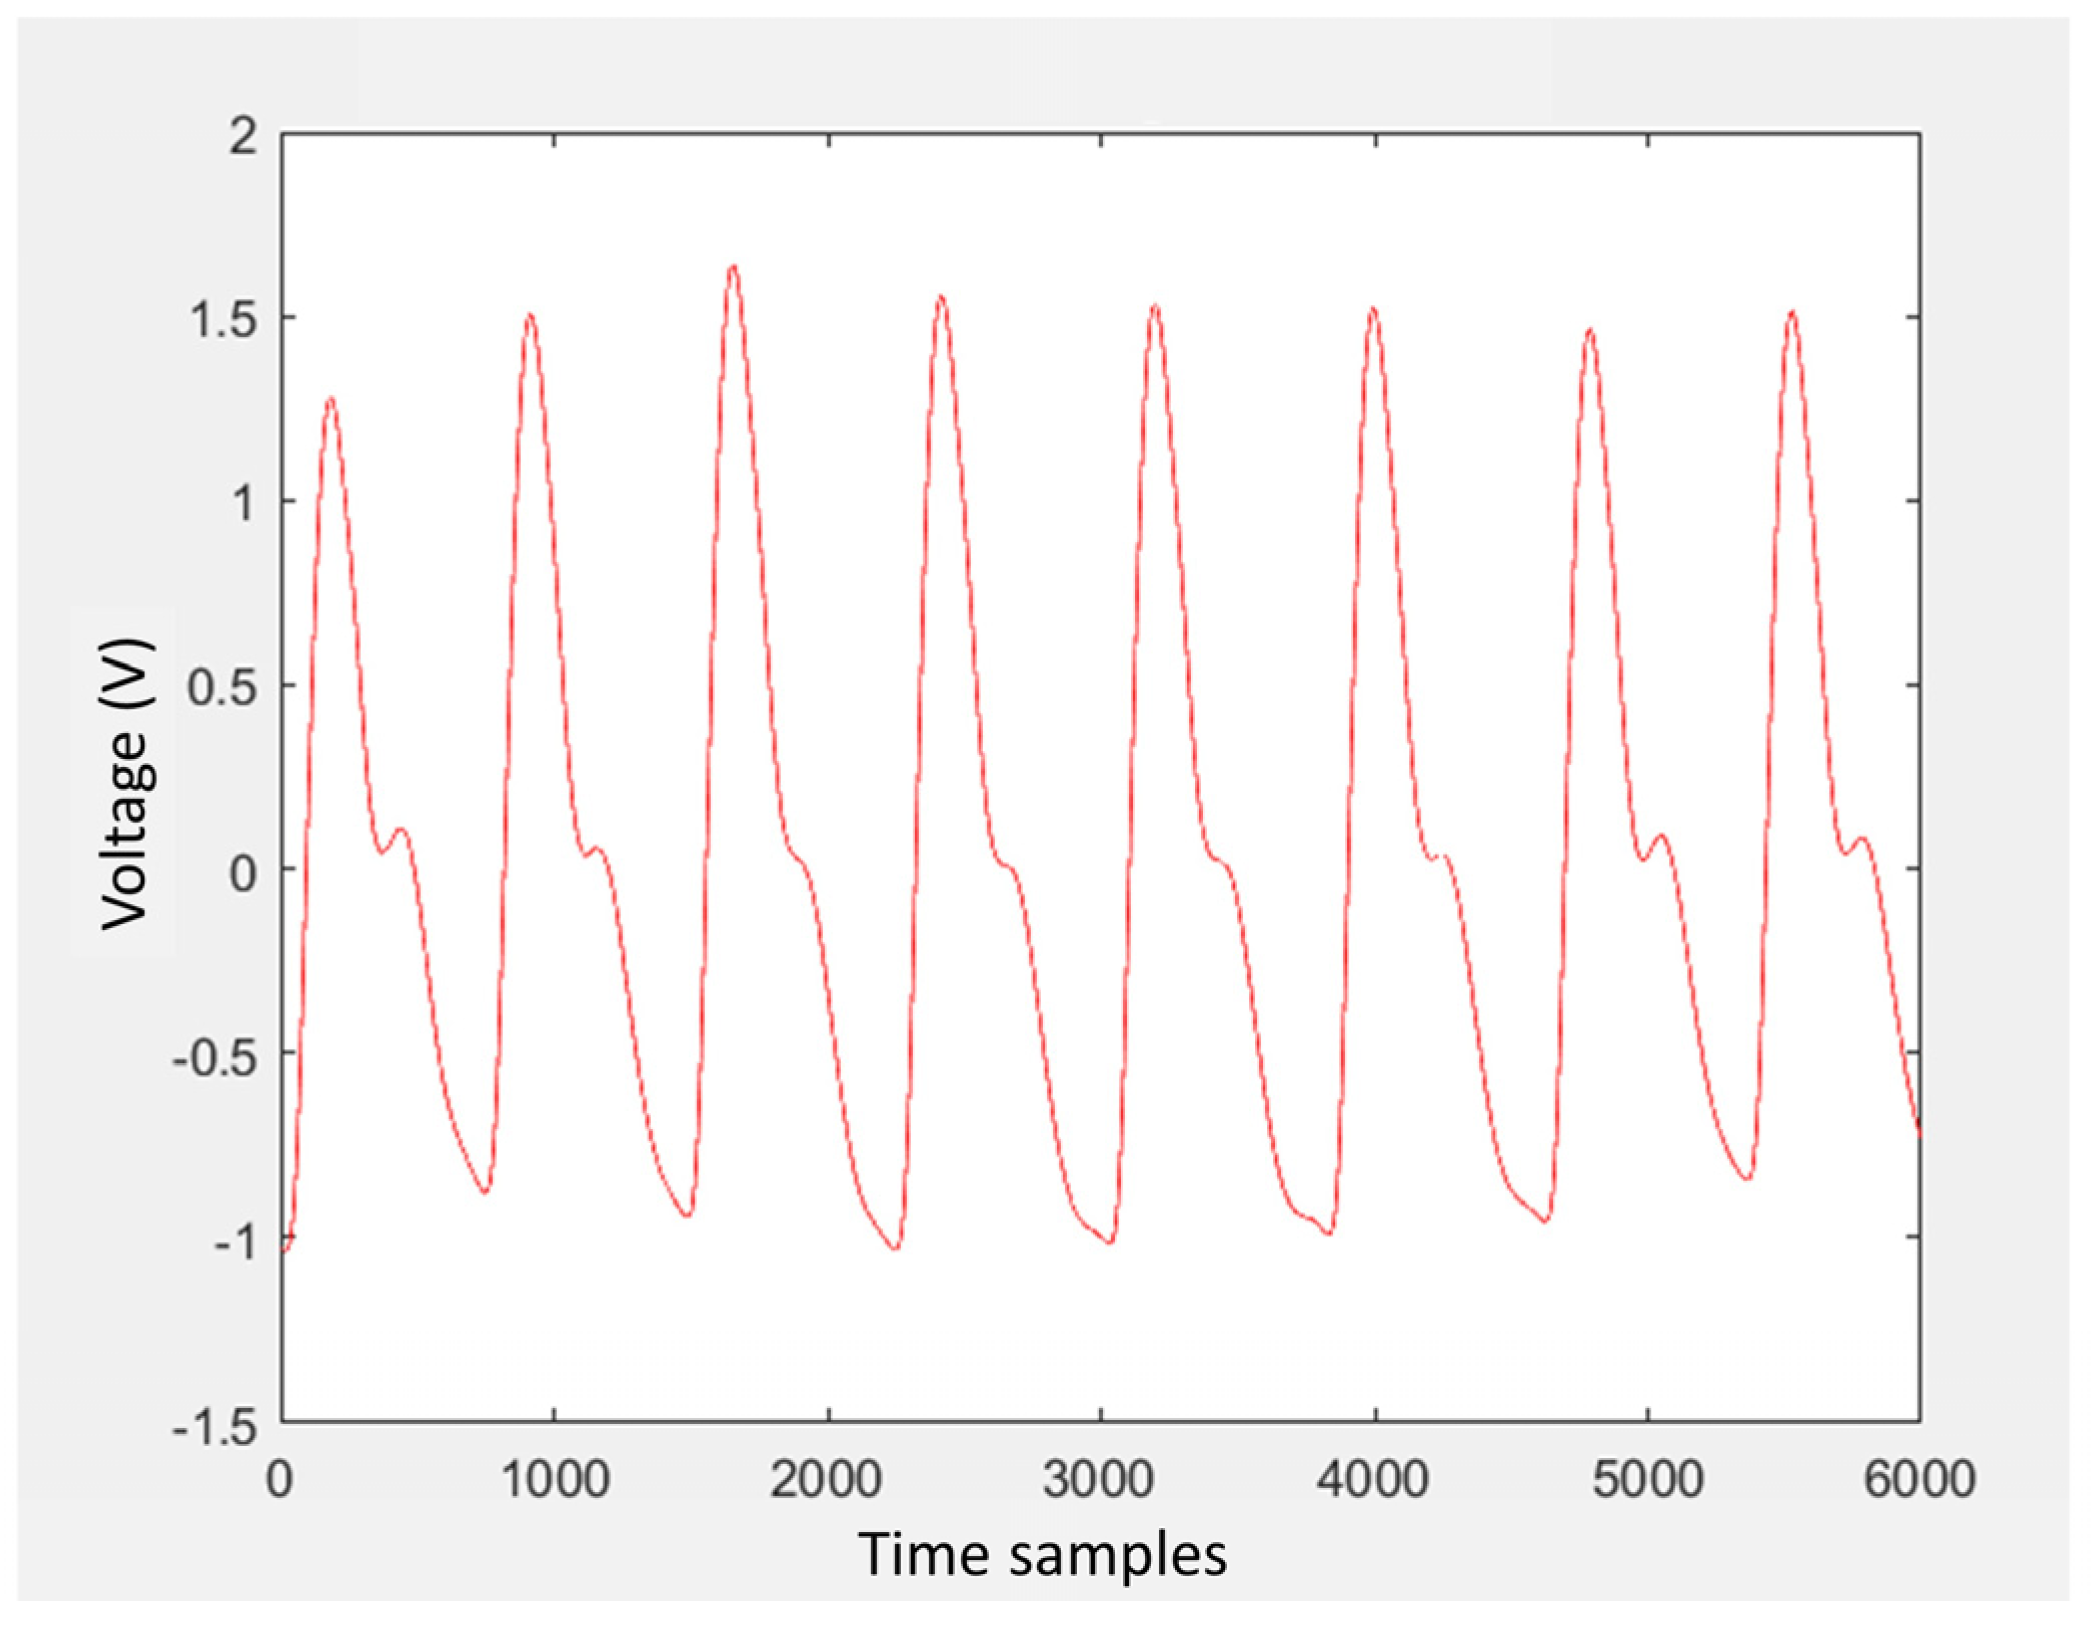
2.1. PPG Signals
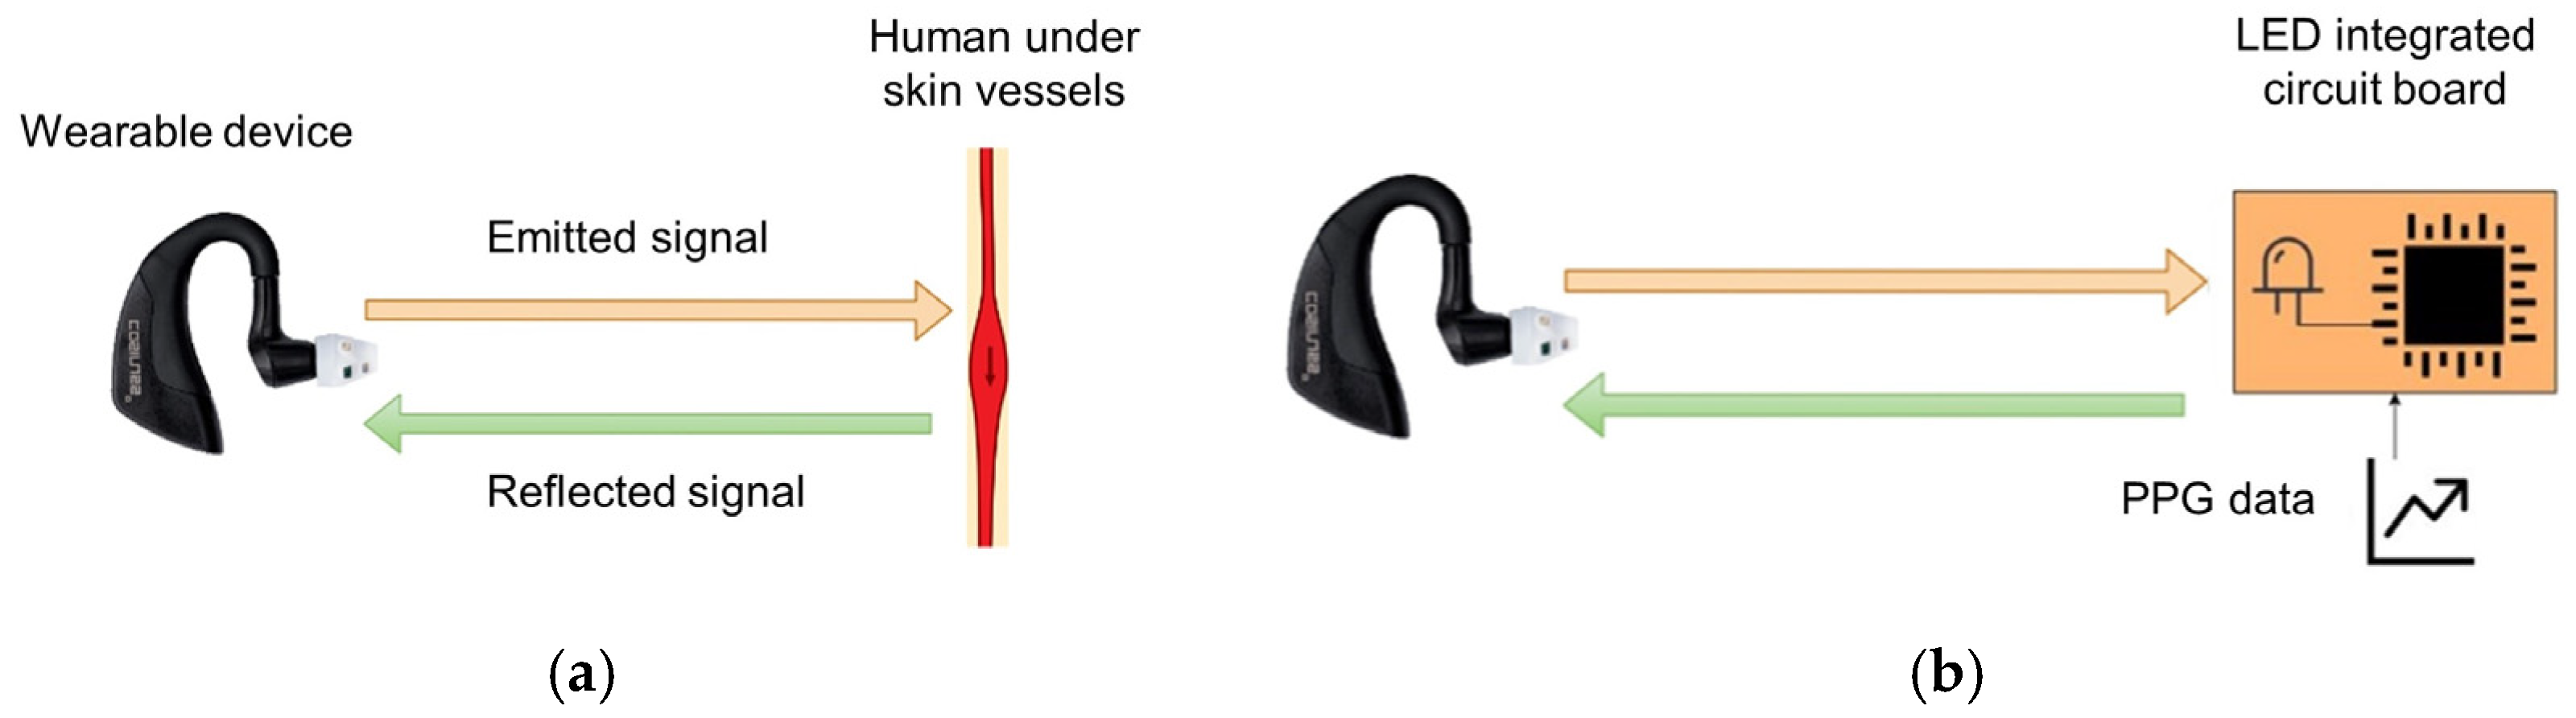
2.2. Cosinuss° Two
2.3. PPG Device Characterization
- Use of recorded physiological PPG signals, which allow effective testing of diagnostic capabilities of the device;
- Repeatability of the generated signal, allowing comparisons between different PPG sensors;
- The PPG signal software generation allows us to independently vary the average value (DC component) and the peak-to-peak amplitude (AC component) of the signal. This makes it possible to test both the absolute sensitivity of the wearable sensor (observing the minimum intensity that the device can detect) and the sensitivity concerning the minimum variation in brightness that it can detect (the minimum value of the peak-to-peak amplitude).
2.4. Signal Transmission Scheme
3. Electronic Board Design and Implementation
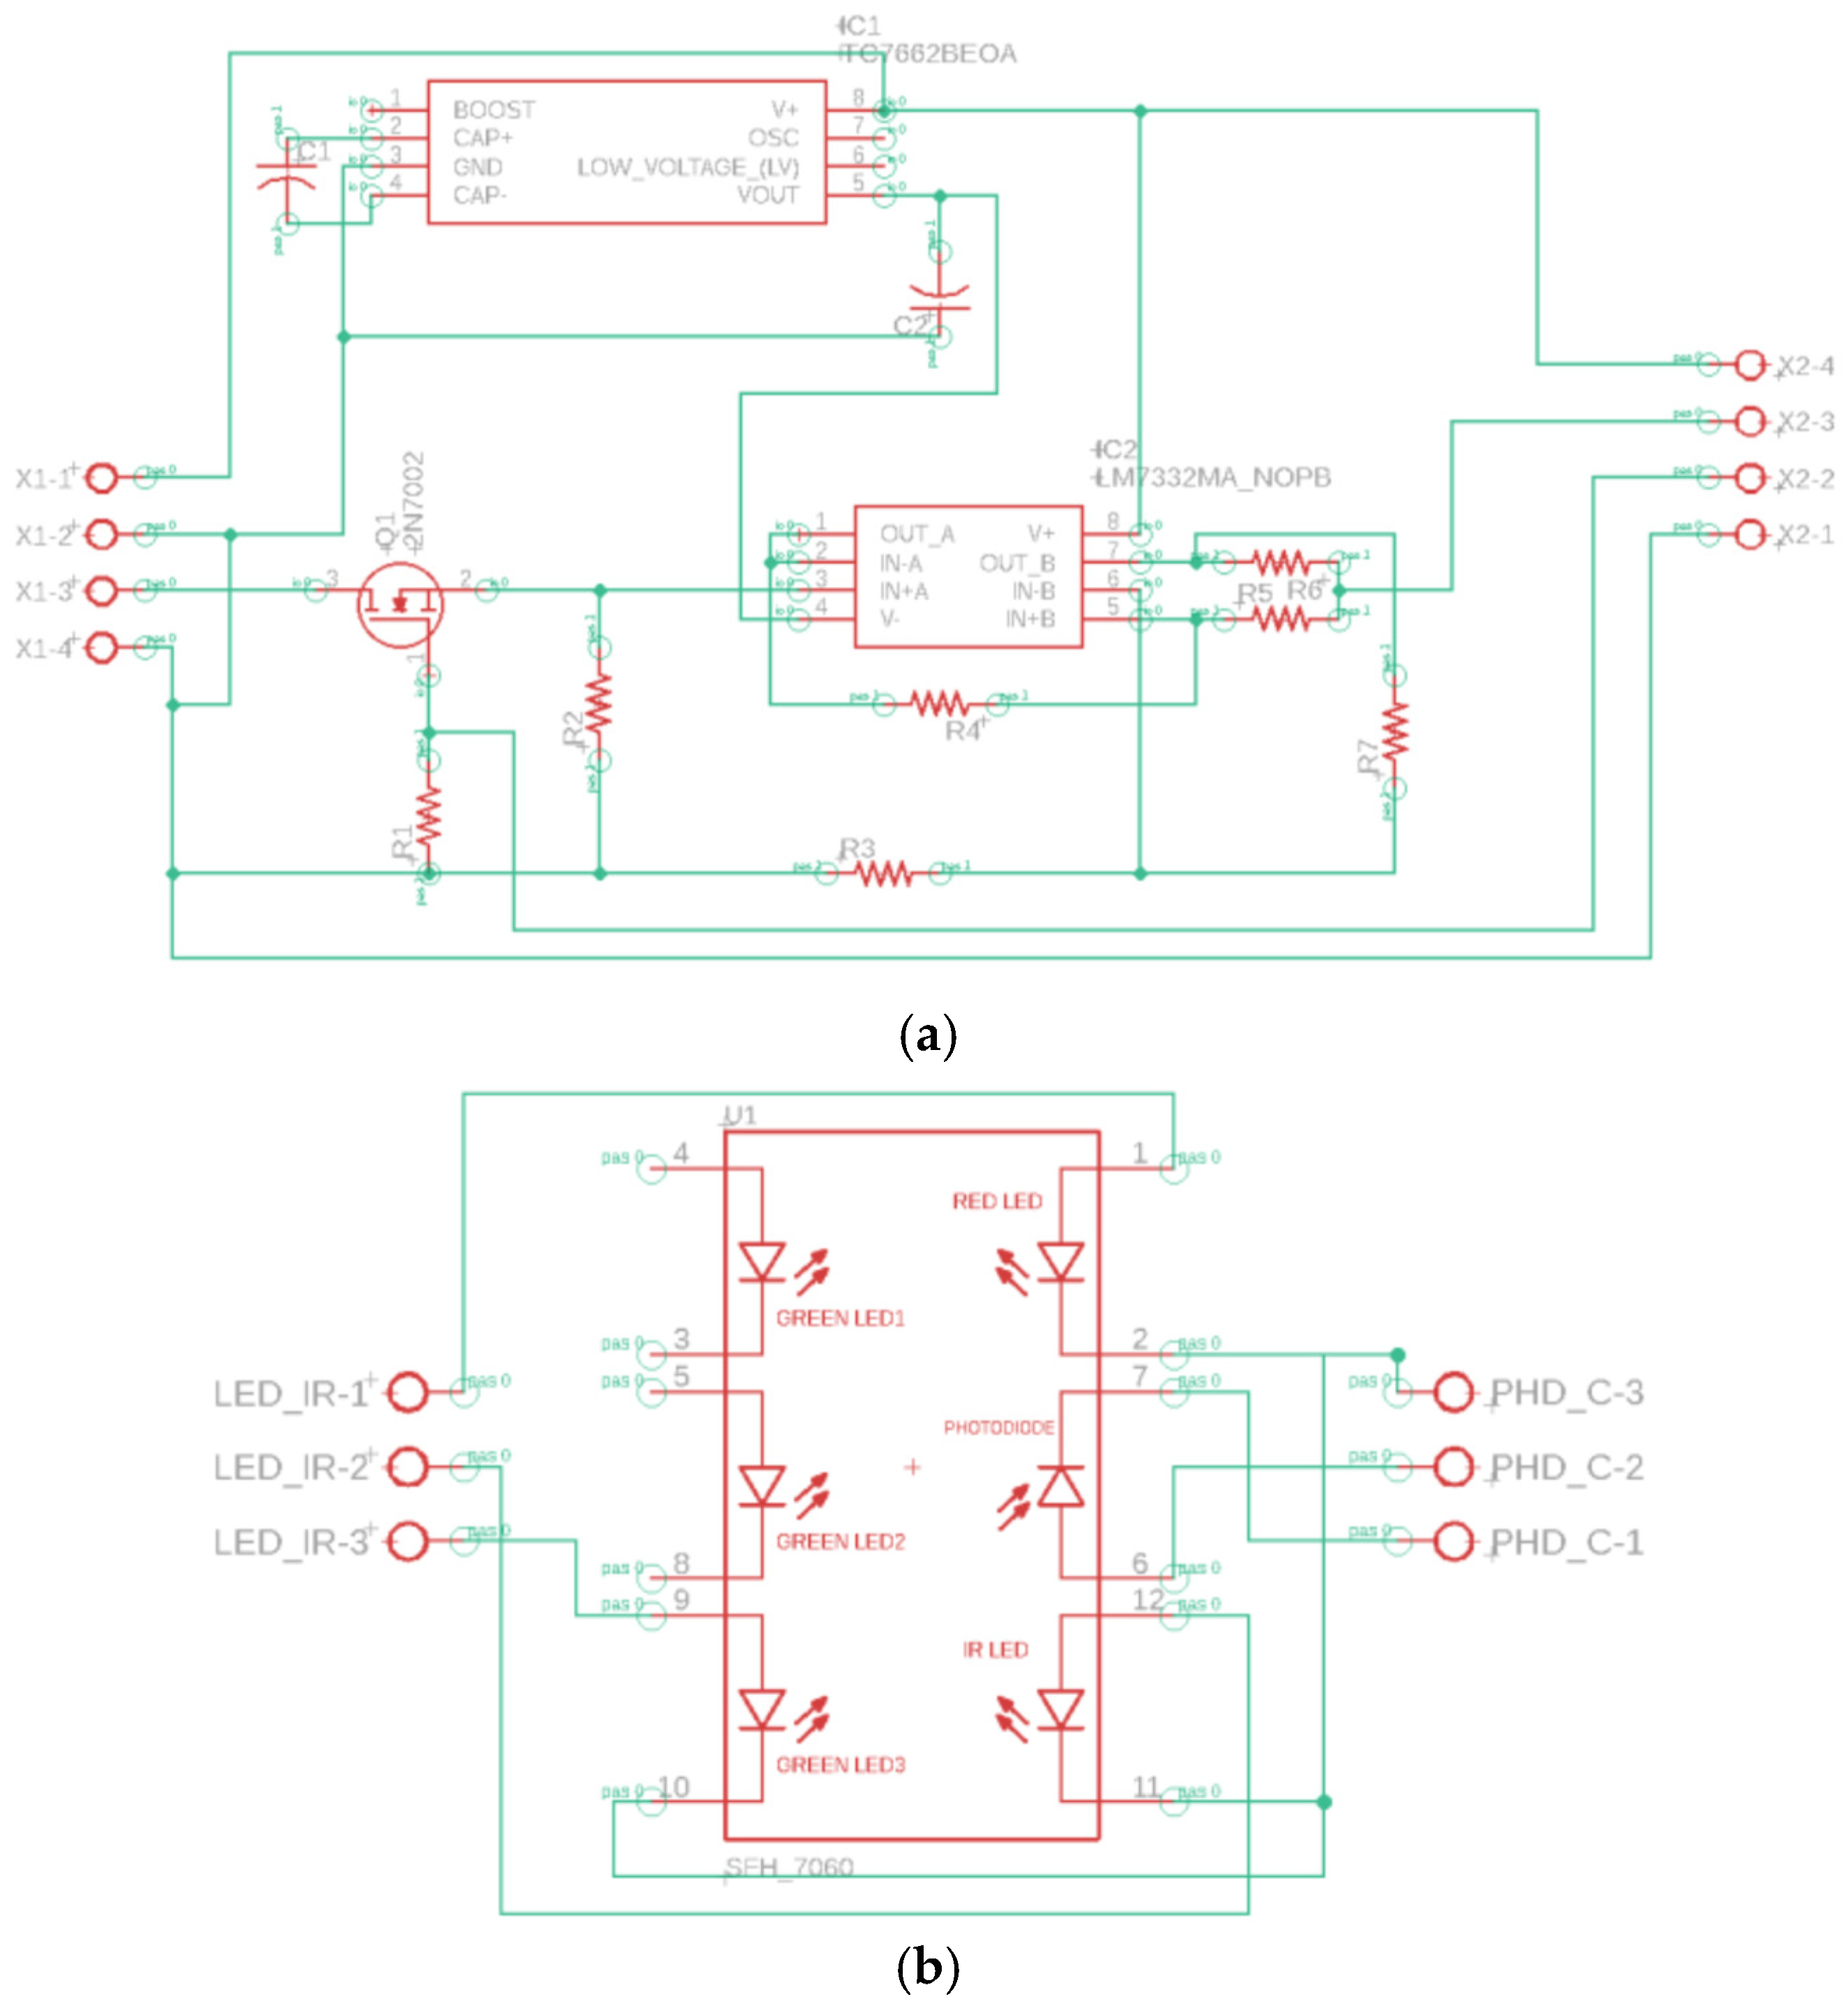
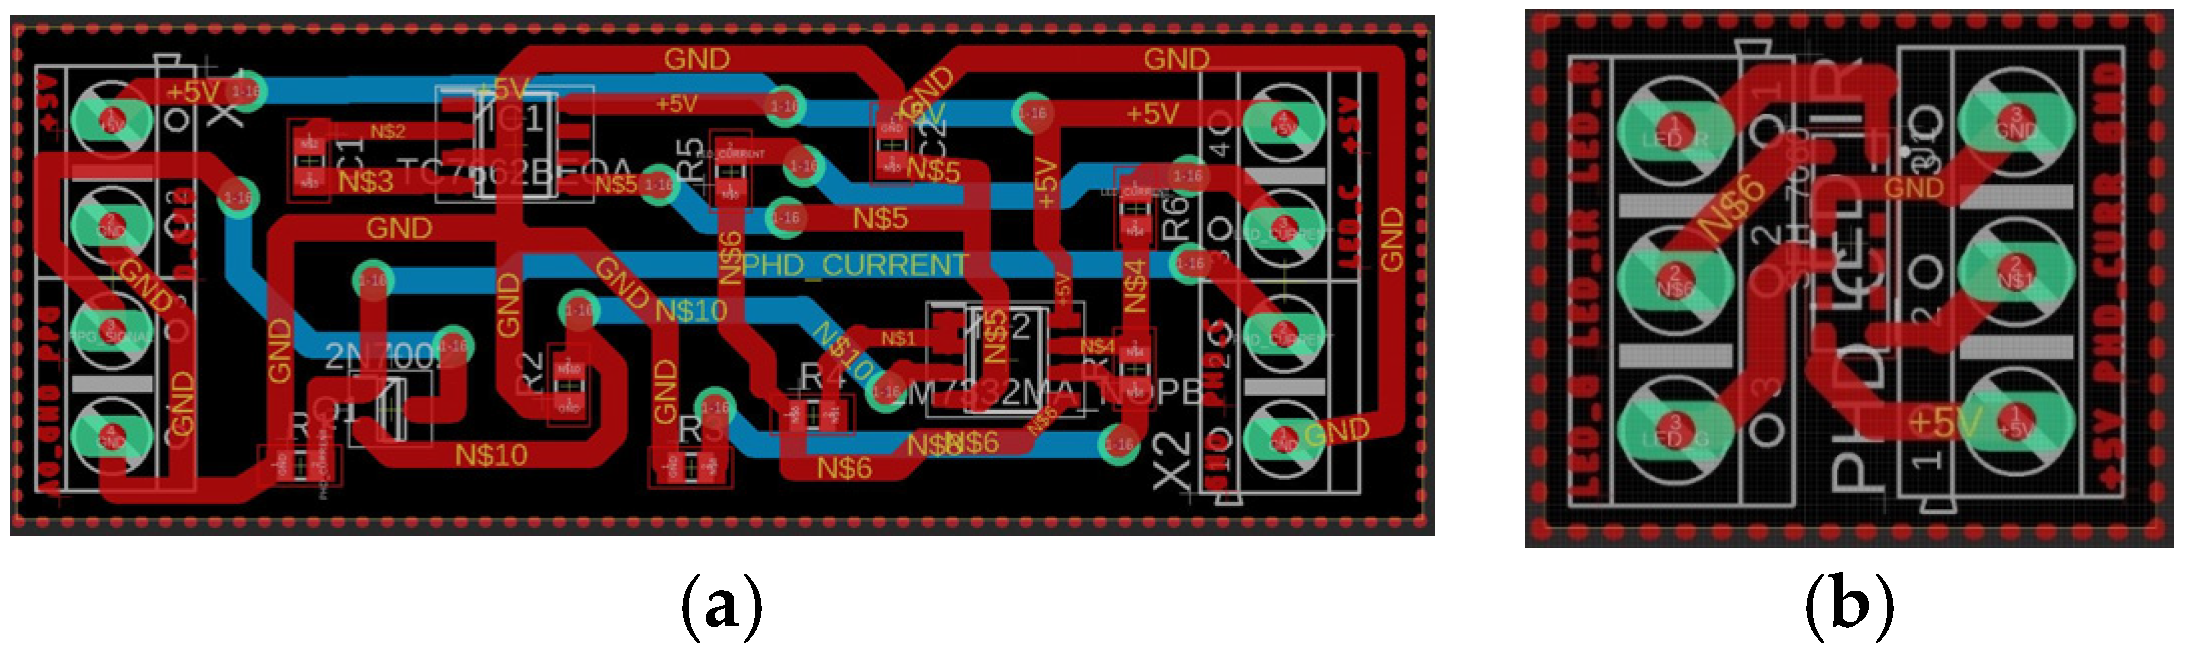
3.1. Electronic Board Design
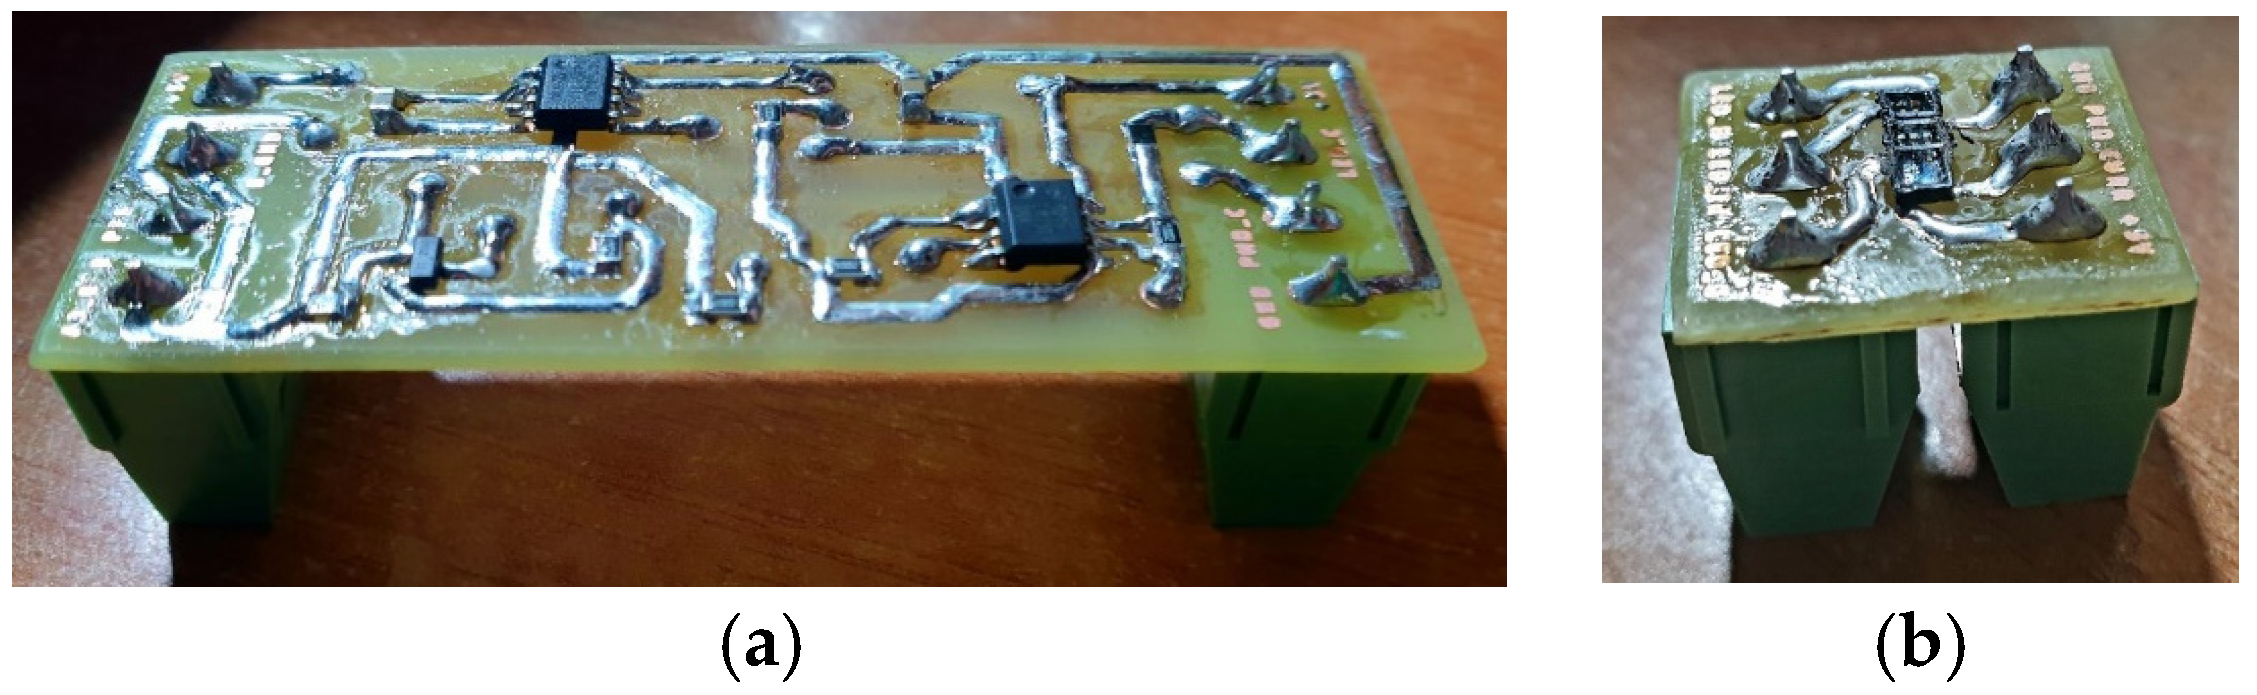
3.2. Electronic Board Implementation
3.3. Electronic Board Operation Test
- The value of the transconductance of the Howland current pump;
- The correct operation in dark conditions;
- The independence of the current supplied by the Howland pump from the load;
- The verification of the signal transmission by the LED towards a PPG device.
- 16.1 mA for the red LED;
- 16.1 mA for the infrared LED;
- 16.0 mA for the green LED.
4. Results
4.1. Measurements with the Cosinuss° Device
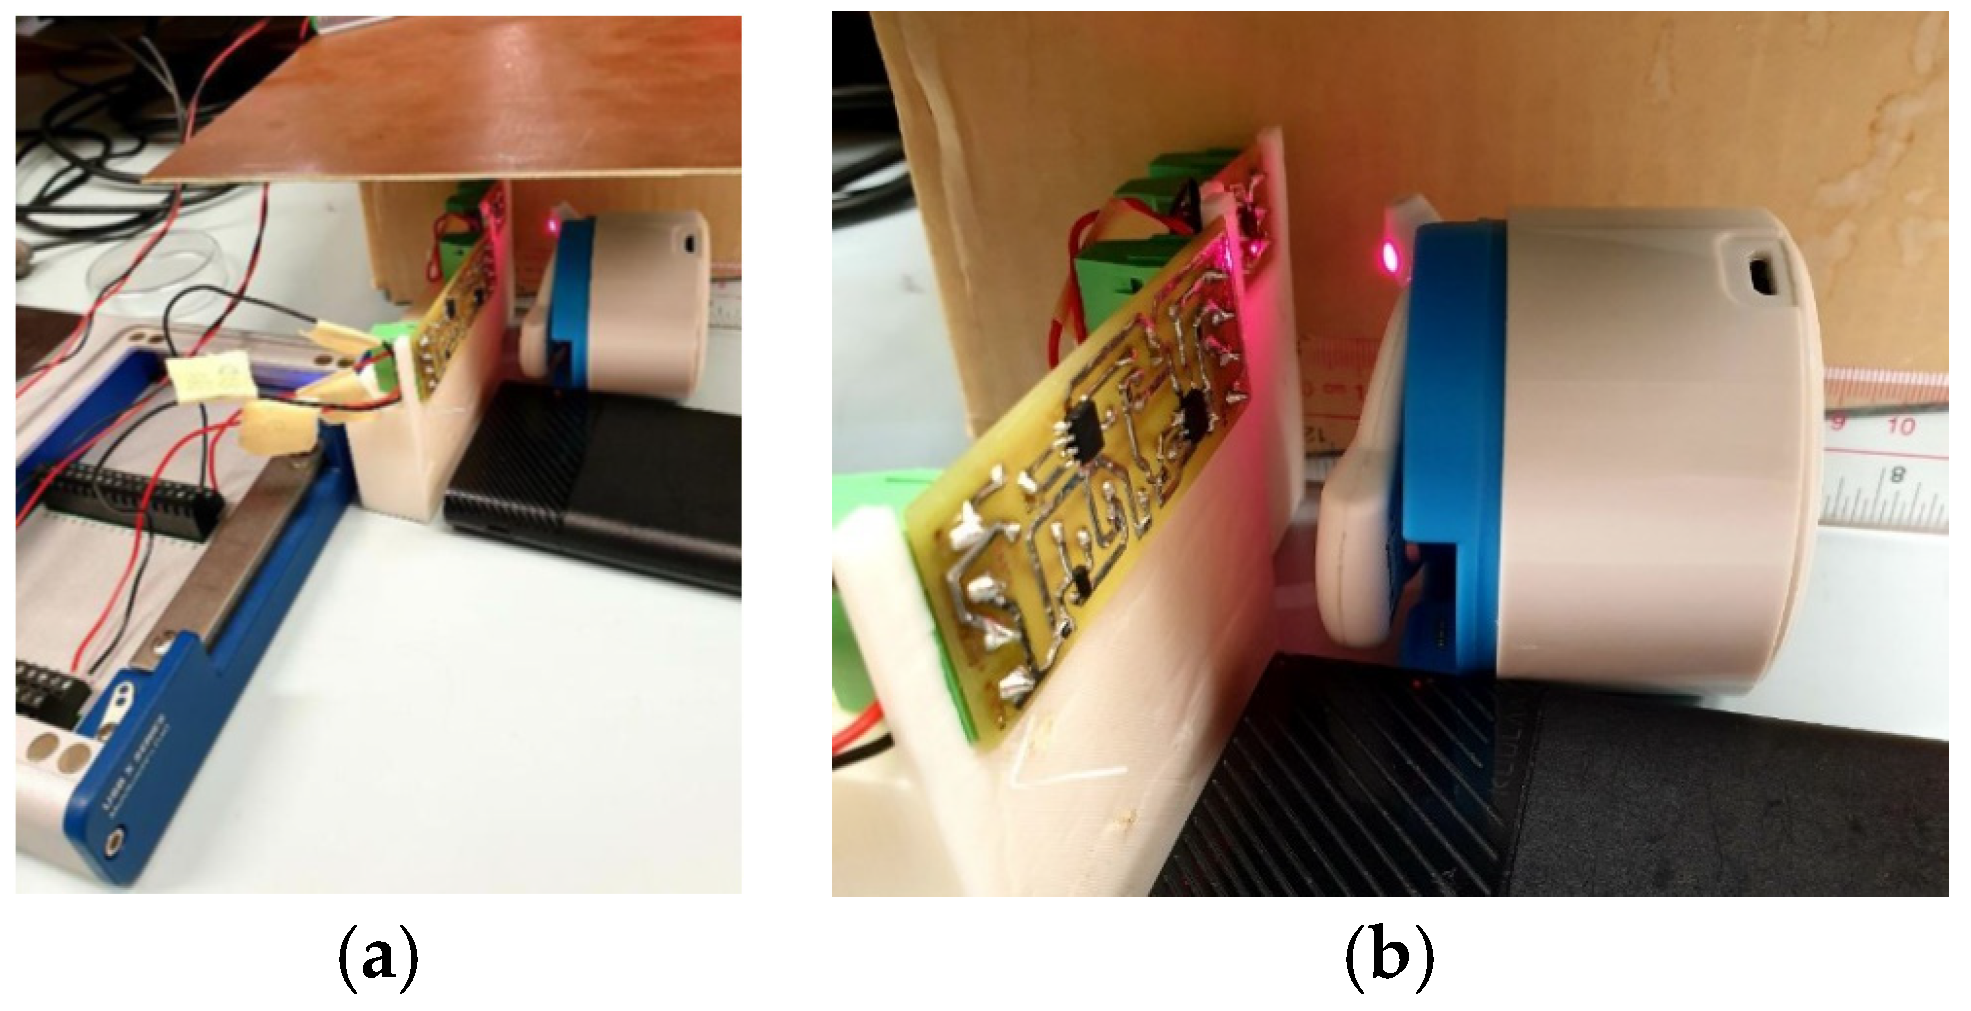
4.1.1. Measurement Setup
- (1)
- The device is positioned in the ear canal for recording to begin (as the device is temperature-sensitive, this step allows to start the device, which would otherwise remain turned off);
- (2)
- The earphone is kept in this position for about 50 s in order to stabilize the signal;
- (3)
- Then, the device is properly placed in its case, with the optical sensors of both elements at the same height;
- (4)
- After a short transient period (10–20 s), the device begins the correct recording of the PPG signal coming from the board.
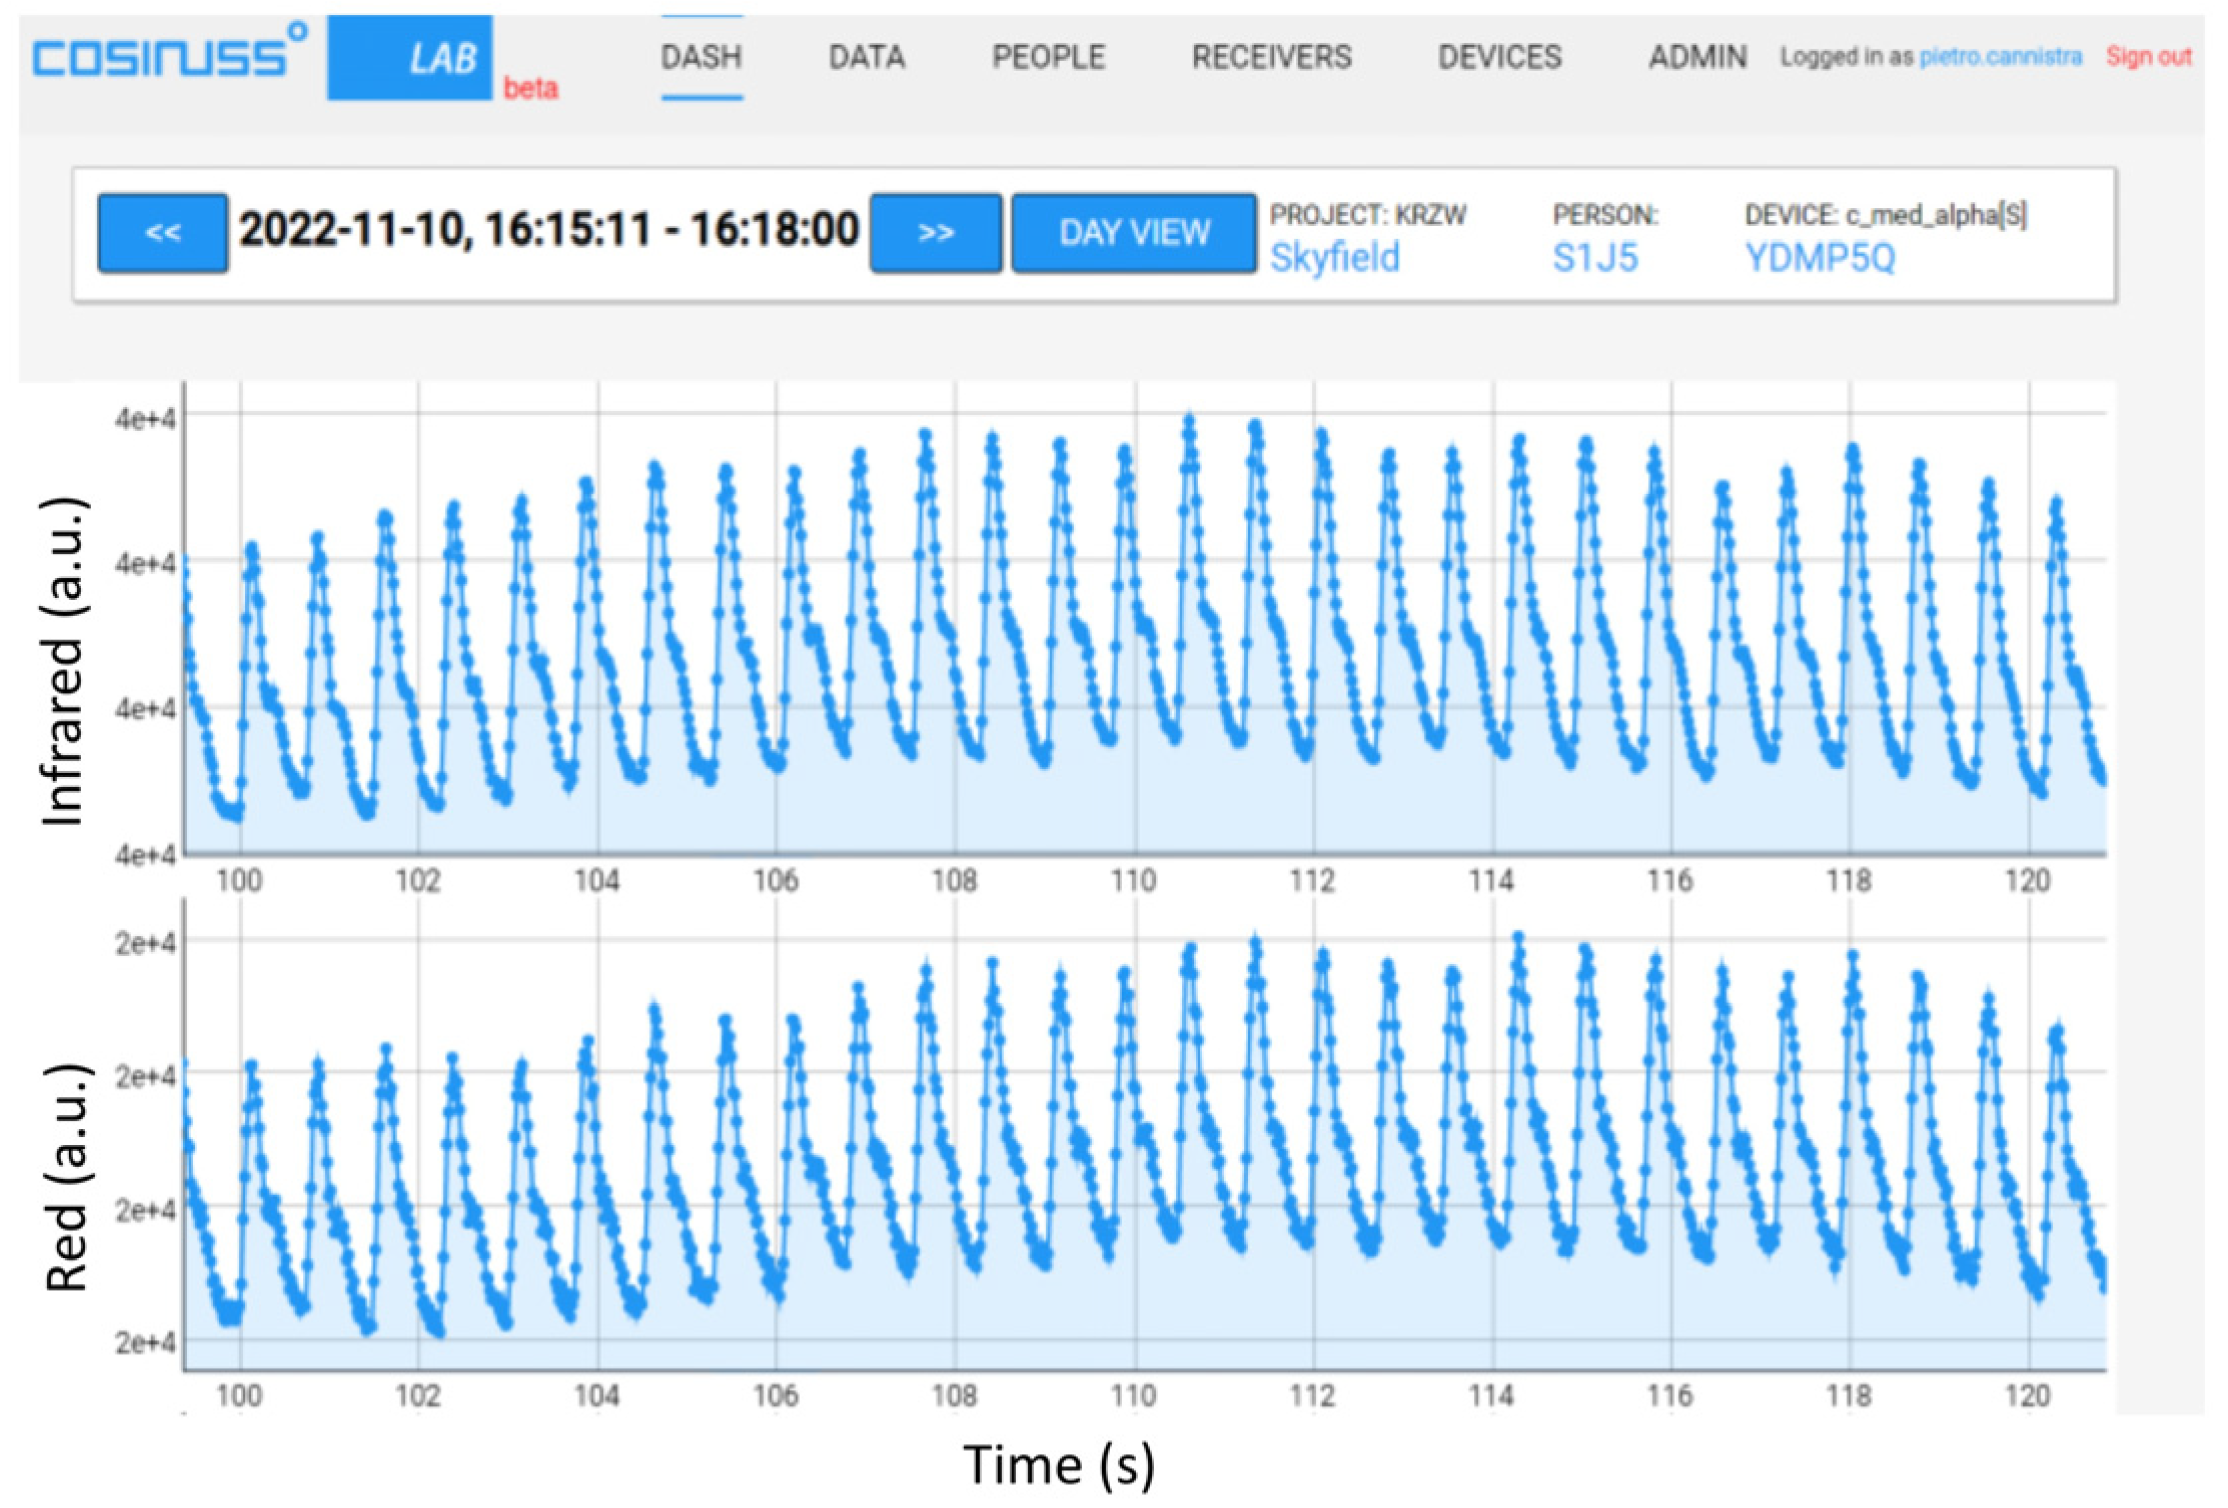
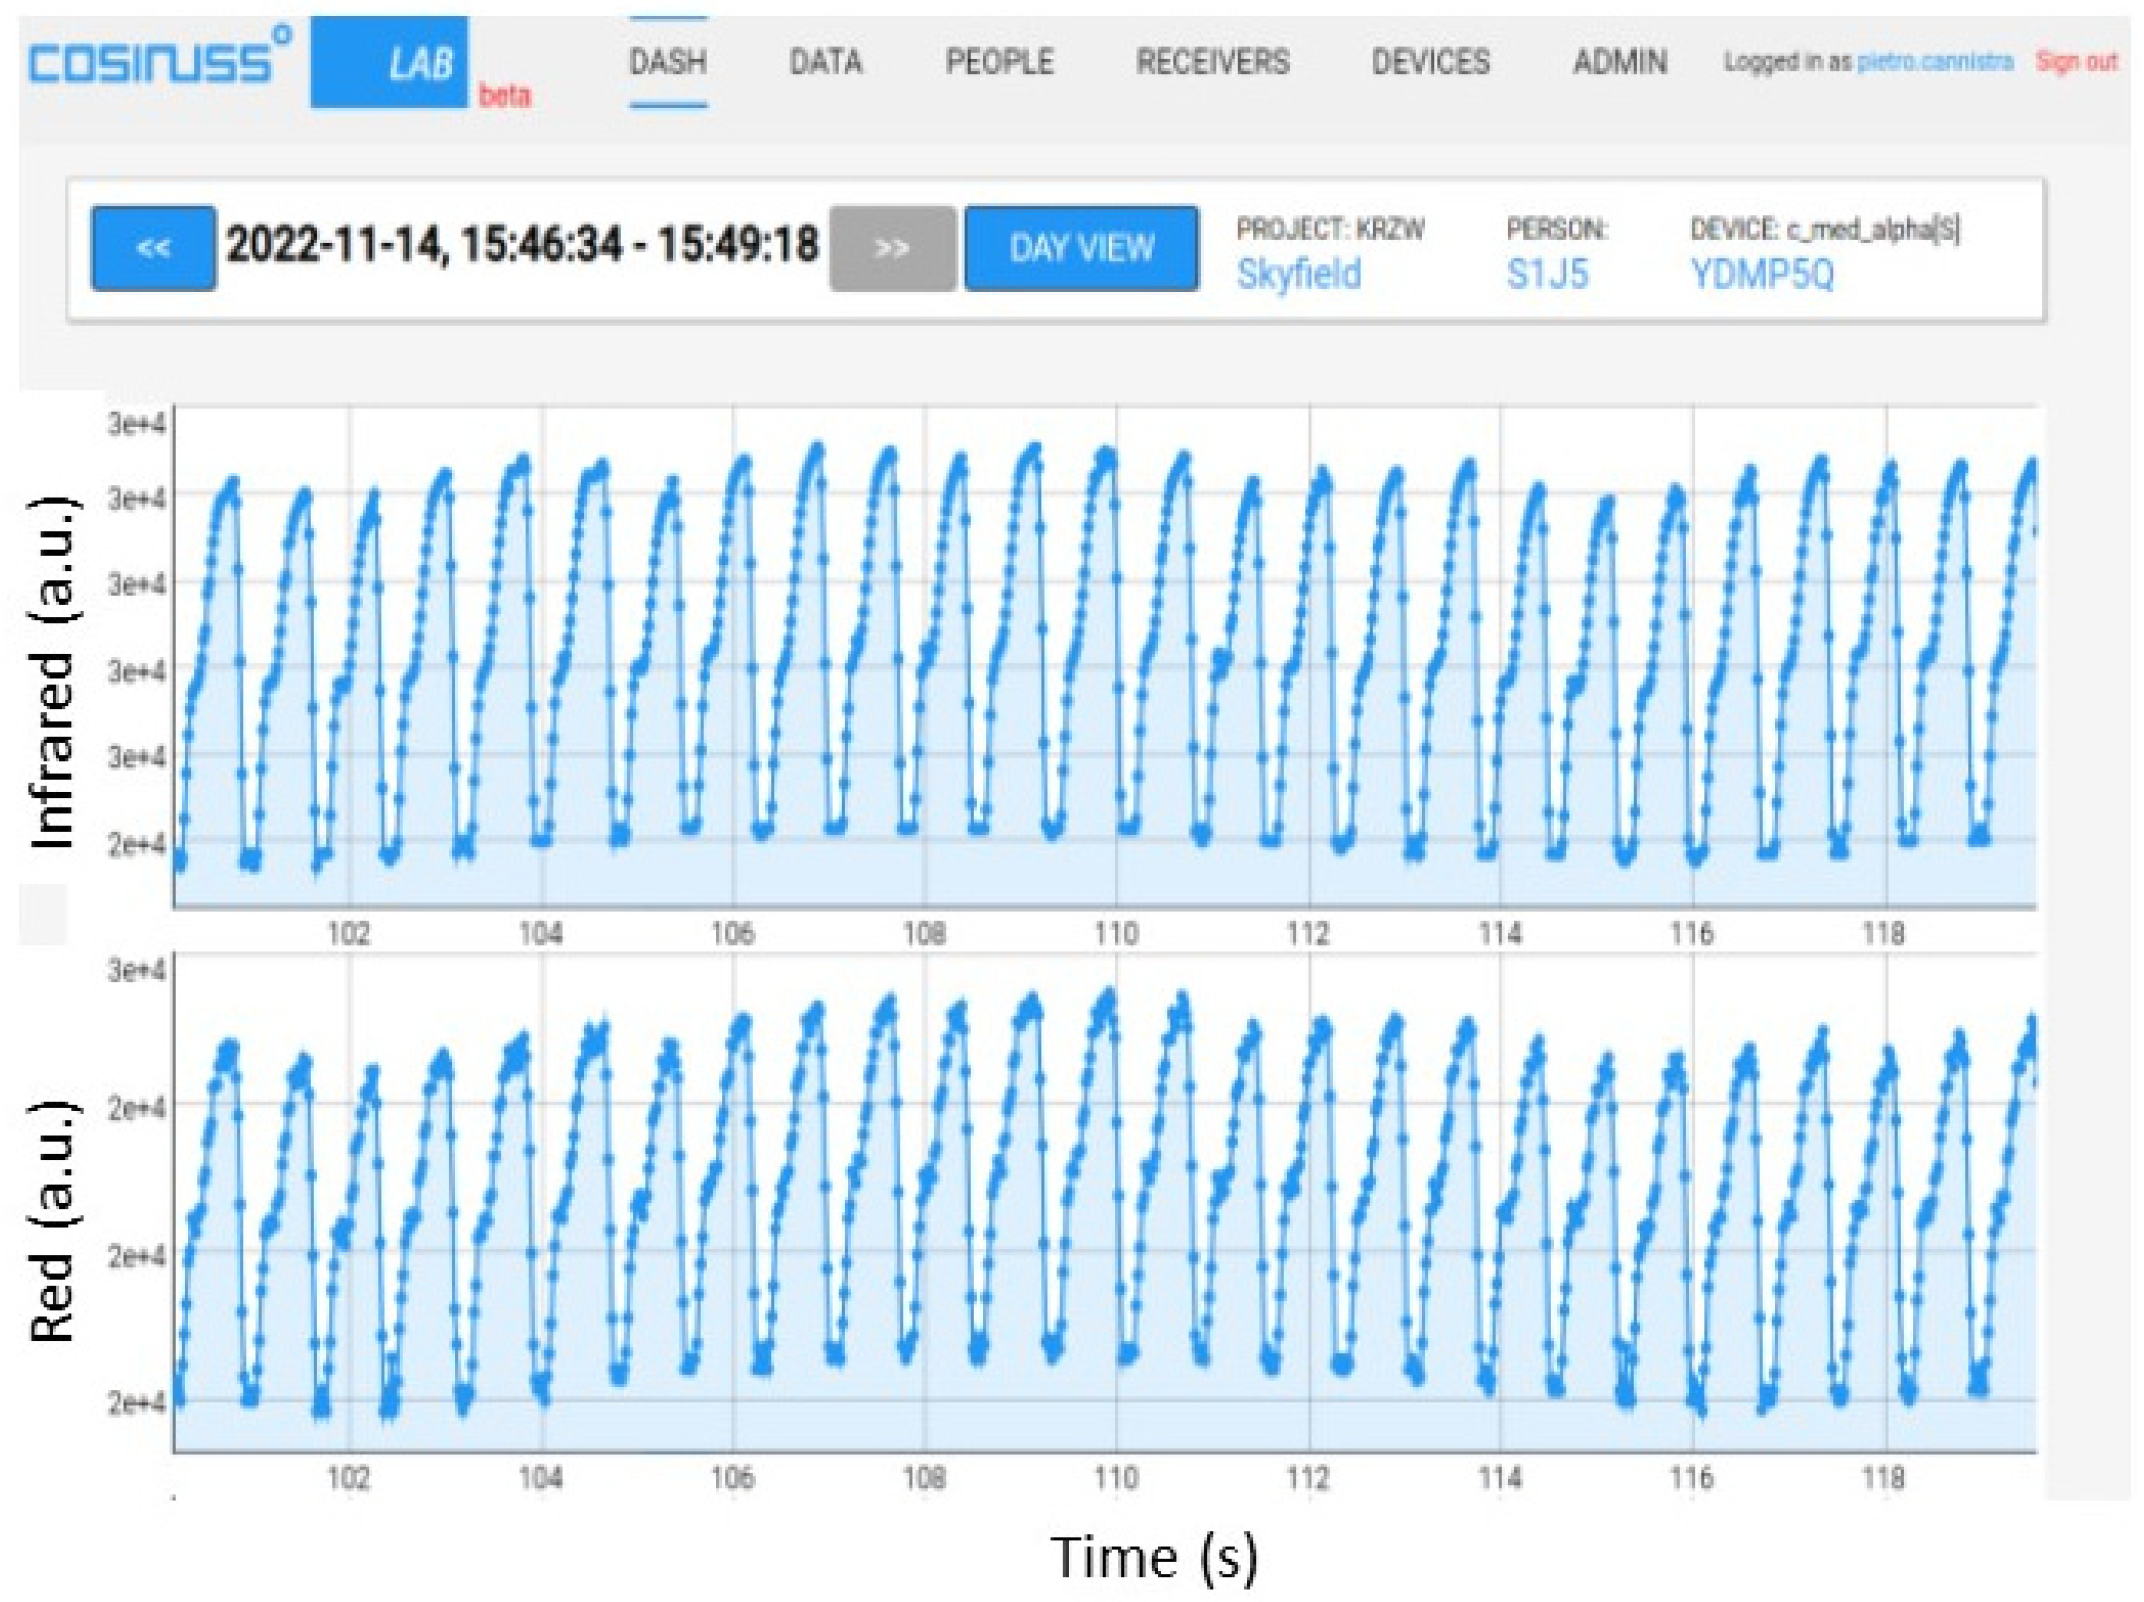
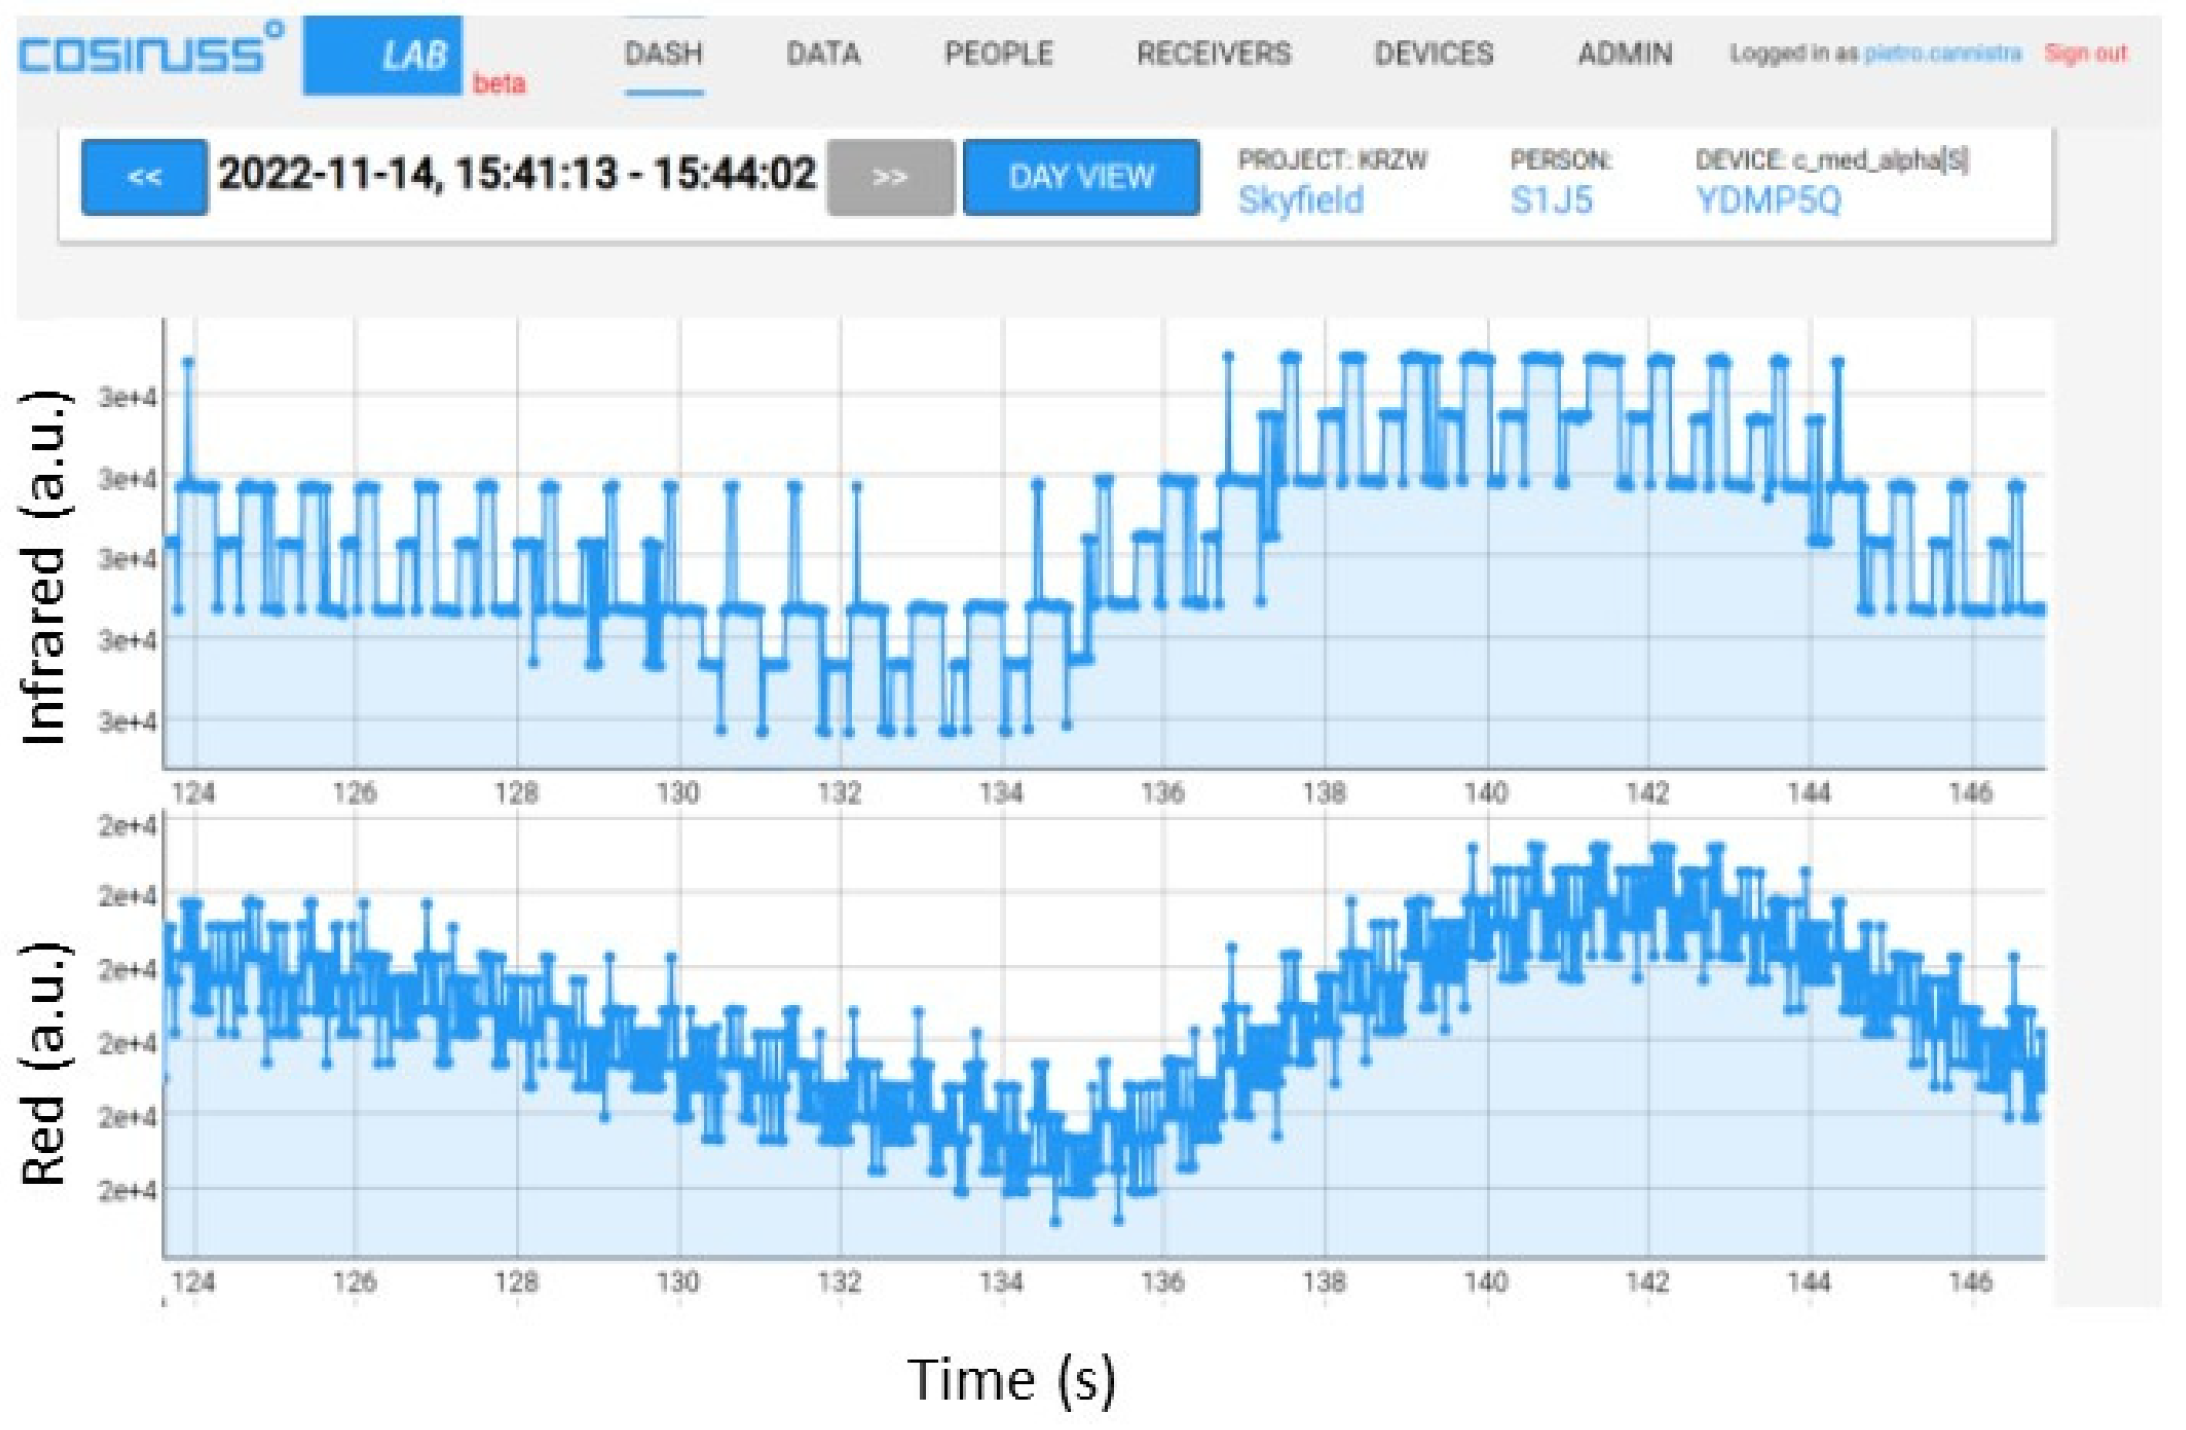
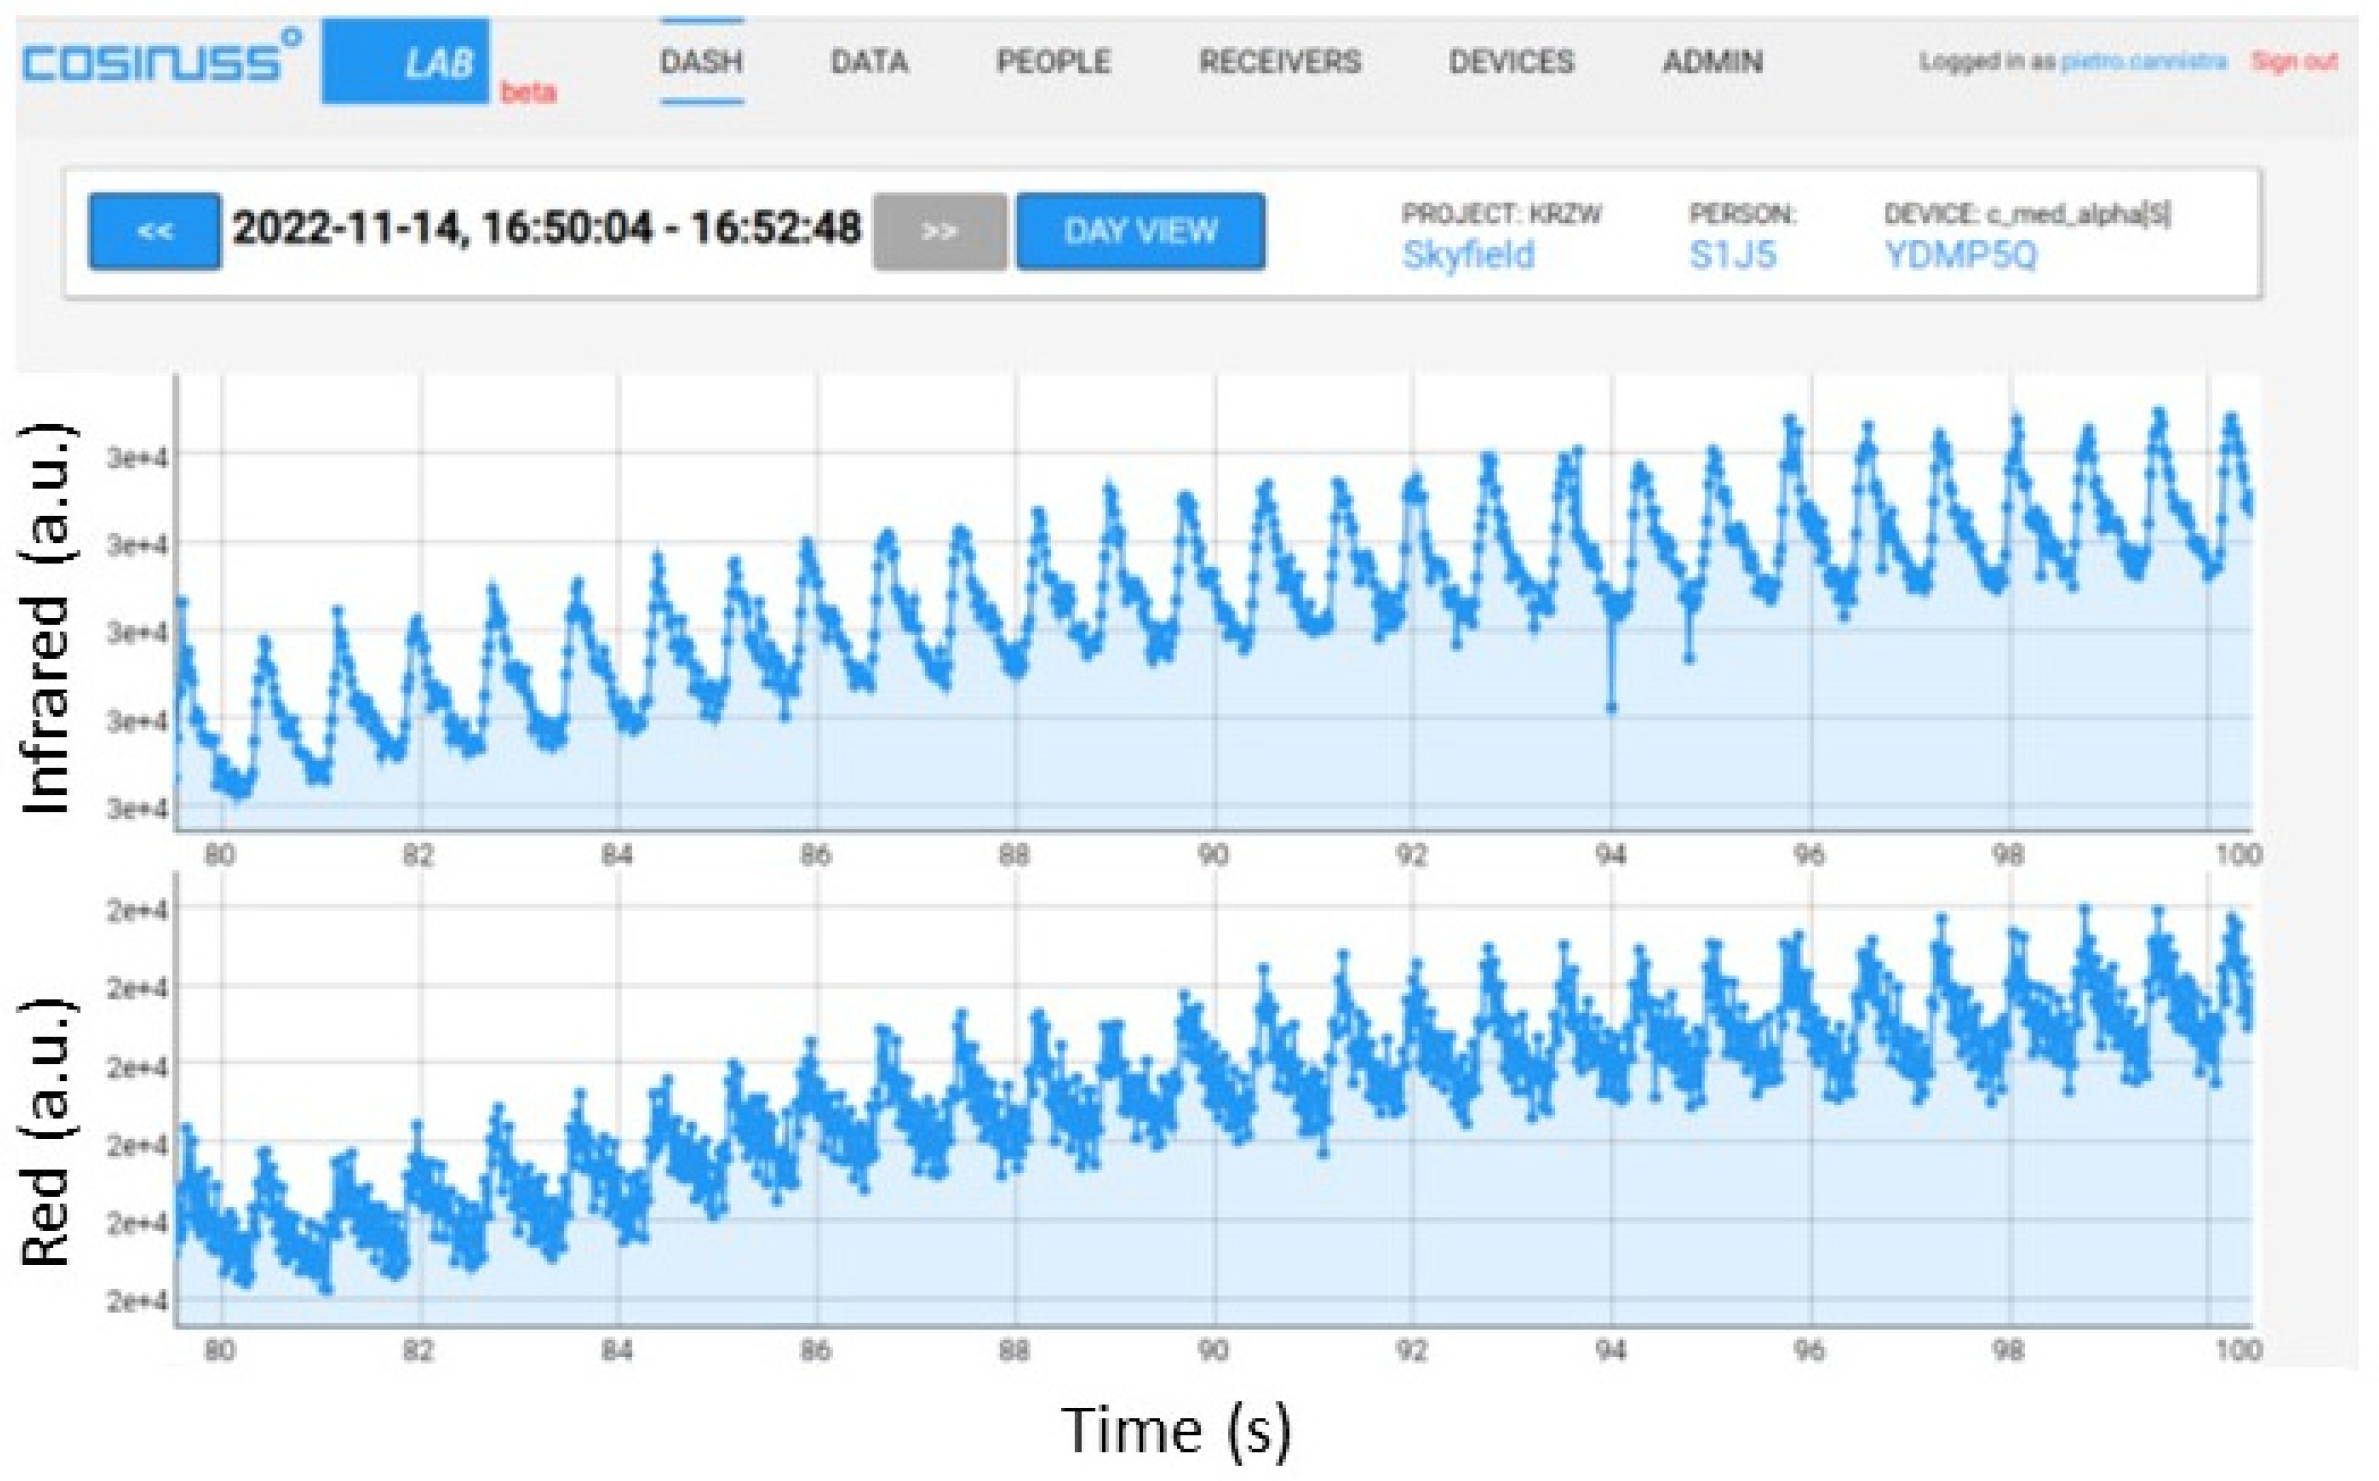
4.1.2. Signal Average Value Variation
- To find the maximum average value of the signal that the earphone can record correctly and above which the device begins to saturate;
- To find the minimum average value of the signal that the earphone is able to record correctly and below which the recorded signal can no longer be ascribable to a PPG signal.
4.1.3. Results of the Variation of the Signal Peak-to-Peak Amplitude
4.1.4. Results of Signal Frequency Variation
4.1.5. Evaluation of LED Light Power
- Setting the wavelength of interest on the power meter;
- Evaluation of the power recorded in the presence of ambient light;
- Positioning the LED and the power meter sensor in front of each other;
- Sending the PPG signal to the circuit with consequent switching on of the LED.
5. Discussion
6. Conclusions
Author Contributions
Funding
Informed Consent Statement
Data Availability Statement
Conflicts of Interest
References
- Moraes, J.L.; Rocha, M.X.; Vasconcelos, G.G.; Filho, J.E.V.; De Albuquerque, V.H.C.; Alexandria, A.R. Advances in Photopletysmography Signal Analysis for Biomedical Applications. Sensors 2018, 18, 1894. [Google Scholar] [CrossRef] [PubMed]
- Shin, H.; Park, J.; Seok, H.S.; Kim, S.-S. Photoplethysmogram Analysis and Applications: An Integrative Review. JMIR Biomed. Eng. 2020, 12, 808451. [Google Scholar] [CrossRef]
- Hina, A.; Saadeh, W. A Noninvasive Glucose Monitoring SoC Based on Single Wavelength Photoplethysmography. IEEE Trans. Biomed. Circuits Syst. 2020, 14, 504–515. [Google Scholar] [CrossRef] [PubMed]
- Wójcikowski, M.; Pankiewicz, B. Photoplethysmographic Time-Domain Heart Rate Measurement Algorithm for Resource-Constrained Wearable Devices and its Implementation. Sensors 2020, 20, 1783. [Google Scholar] [CrossRef] [PubMed]
- Castaneda, D.; Esparza, A.; Ghamari, M.; Soltanpur, C.; Nazeran, H. A review on wearable photoplethysmography sensors and their potential future applications in health care. Int. J. Biosens. Bioelectron. 2018, 4, 195–202. [Google Scholar] [CrossRef] [PubMed]
- Landry, C.; Hedge, E.T.; Hughson, R.L.; Peterson, S.D.; Arami, A. Accurate Blood Pressure Estimation During Activities of Daily Living: A Wearable Cuffless Solution. IEEE J. Biomed. Health Inform. 2021, 25, 2510–2520. [Google Scholar] [CrossRef] [PubMed]
- Lei, R.; Ling, B.W.-K.; Feng, P.; Chen, J. Estimation of Heart Rate and Respiratory Rate from PPG Signal Using Complementary Ensemble Empirical Mode Decomposition with both Independent Component Analysis and Non-Negative Matrix Factorization. Sensors 2020, 20, 3238. [Google Scholar] [CrossRef] [PubMed]
- Davies, H.J.; Williams, I.; Peters, N.S.; Mandic, D.P. In-Ear SpO2: A Tool for Wearable, Unobtrusive Monitoring of Core Blood Oxygen Saturation. Sensors 2020, 20, 4879. [Google Scholar] [CrossRef] [PubMed]
- Birrenkott, D.A.; Pimentel, M.A.; Watkinson, P.J.; Clifton, D.A. A Robust Fusion Model for Estimating Respiratory Rate from Photoplethysmography and Electrocardiography. IEEE Trans. Biomed. Eng. 2018, 65, 2033–2041. [Google Scholar] [CrossRef] [PubMed]
- Castiglioni, P.; Meriggi, P.; Di Rienzo, M.; Lombardi, C.; Parati, G.; Faini, A. Heart Rate Variability from Wearable Photoplethysmography Systems: Implications in Sleep Studies at High Altitude. Sensors 2022, 22, 2891. [Google Scholar] [CrossRef] [PubMed]
- Lee, P.-L.; Wang, K.-W.; Hsiao, C.-Y. A Non-Invasive Blood Glucose Estimation System using Dual-channel PPGs and Pulse-Arrival Velocity. IEEE Sensors J. 2023, 23, 23570–23582. [Google Scholar] [CrossRef]
- Haque, R.; Raju, S.M.T.U.; Golap, A.-U.; Hashem, M.M.A. A Novel Technique for Non-Invasive Measurement of Human Blood Component Levels from Fingertip Video Using DNN Based Models. IEEE Access 2021, 9, 19025–19042. [Google Scholar] [CrossRef]
- Georgieva-Tsaneva, G.; Gospodinova, E.; Gospodinov, M.; Cheshmedzhiev, K. Portable Sensor System for Registration, Processing and Mathematical Analysis of PPG Signals. Appl. Sci. 2020, 10, 1051. [Google Scholar] [CrossRef]
- Allen, J. Photoplethysmography and its application in clinical physiological measurement. Physiol. Meas. 2007, 28, R1–R39. [Google Scholar] [CrossRef] [PubMed]
- Loh, H.W.; Xu, S.; Faust, O.; Ooi, C.P.; Barua, P.D.; Chakraborty, S.; Tan, R.-S.; Molinari, F.; Acharya, U.R. Application of photoplethysmography signals for healthcare systems: An in-depth review. Comput. Methods Programs Biomed. 2022, 216, 106677. [Google Scholar] [CrossRef] [PubMed]
- Maity, A.K.; Veeraraghavan, A.; Sabharwal, A. PPGMotion: Model-based detection of motion artifacts in photoplethysmog-raphy signals. Biomed. Signal Process. Control 2022, 75, 103632. [Google Scholar]
- Pisa, S.; Chicarella, S.; Pittella, E.; Piuzzi, E.; Testa, O.; Cicchetti, R. A Double-Sideband Continuous-Wave Radar Sensor for Carotid Wall Movement Detection. IEEE Sensors J. 2018, 18, 8162–8171. [Google Scholar] [CrossRef]
- Pisa, S.; Pittella, E.; Piuzzi, E.; Testa, O.; Cicchetti, R. A double sideband continuous wave radar for monitoring carotid artery wall movements. In Proceedings of the 2017 IEEE/MTT-S International Microwave Symposium–IMS 2017, Honololu, HI, USA, 4–9 June 2017; pp. 1007–1010. [Google Scholar]
- Pittella, E.; Bologni, A.; Cervoni, R.; Fortunato, V.; Piuzzi, E. Comparison between a PPG Wearable Device and an AFE4403-Based Pulse Oximeter. In Proceedings of the 25th IMEKO TC-4 International Symposium on Measurement of Electrical Quantities, IMEKO TC-4 2022 and 23rd International Workshop on ADC and DAC Modelling and Testing, IWADC 2022, Brescia, Italy, 12–14 September 2022. [Google Scholar]
- Kim, K.B.; Baek, H.J. Photoplethysmography in Wearable Devices: A Comprehensive Review of Technological Advances, Current Challenges, and Future Directions. Electronics 2023, 12, 2923. [Google Scholar] [CrossRef]
- Nationals Instruments. PCIe-6361, PXIe-6361, and USB-6361 Specifications, User Manual. Available online: https://www.ni.com/docs/zh-CN/bundle/pcie-pxie-usb-6361-specs/page/specs.html (accessed on 23 January 2024).
- Available online: https://www.ni.com/docs/zh-CN/bundle/labview/page/what-is-labview.html (accessed on 23 January 2024).
- Available online: https://www.cosinuss.com/en/products/data-acquisition/in-ear-sensors/#_two (accessed on 11 May 2022).
- Coherent, FieldMasterTM Power/Energy Analyzer User Manual, User Manual Software, Version 2.10. 2002. Available online: https://www.google.com.hk/url?sa=t&rct=j&q=&esrc=s&source=web&cd=&ved=2ahUKEwi2mdyeyY6EAxU0mlYBHUpUBu0QFnoECBAQAQ&url=https%3A%2F%2Fwww.coherent.com%2Fresources%2Fpreinstallation%2Ffieldmate%2FFieldMate-User-Manual_FORMFIRST.pdf&usg=AOvVaw1E7QOXLAgOjwFftwnHdtin&opi=89978449 (accessed on 23 January 2024).
- Artisan Technology Group, “Picowatt Digital Optical Power Meter”, Newport 1830C Manual. Available online: https://www.artisantg.com/TestMeasurement/44731-1/Newport-1830-C-Picowatt-Digital-Optical-Power-Meter (accessed on 23 January 2024).
- Lam, I.V. Analysis of Improved Howland Current Pump Configurations. Tex. Instrum. 2023. [Google Scholar]
- Available online: http://eagle.autodesk.com/eagle/documentation (accessed on 23 January 2024).
- Available online: https://www.autodesk.it/products/fusion-360/overview (accessed on 23 January 2024).
- Creality CR-10 Smart Specifications, 3D Printing. 2021. Available online: https://3dprinting.com/products/3d-printer/creality-cr-10-smart/ (accessed on 23 January 2024).
- “Ultra-Small Integrated Analog Front End (AFE) for Heart-Rate Monitors and Low-Cost Pulse Oximeters”, Datasheet. Available online: https://www.ti.com/product/AFE4403 (accessed on 13 December 2023).


| Average Value (V) | Peak-to-Peak Amplitude (V) | Distance (cm) | Recorded Signal |
|---|---|---|---|
| 0.005 | 0.001 | 2 | signal overwhelmed by noise |
| 0.008 | 0.002 | 2 | very weak but recognizable PPG signal |
| 0.03 | 0.006 | 2 | robust PPG signal |
| 0.8 | 0.2 | 2 | still recognizable signal |
| 0.85 | 0.2 | 2 | device saturation |
| Average Value (V) | Peak-to-Peak Amplitude (V) | Distance (cm) | Recorded Signal |
|---|---|---|---|
| 0.008 | 0.002 | 2 | signal overwhelmed by noise |
| 0.01 | 0.002 | 2 | very weak but recognizable PPG signal |
| 0.07 | 0.01 | 2 | robust PPG signal |
| 0.7 | 0.2 | 2 | still recognizable signal |
| 0.75 | 0.2 | 2 | device saturation |
| Average Value (V) | Peak-to-Peak Amplitude (V) | Distance (cm) | Recorded Signal |
|---|---|---|---|
| 0.1 | 0.001 | 2 | signal overwhelmed by noise |
| 0.1 | 0.005 | 2 | very weak but recognizable PPG signal |
| 0.1 | 0.0075 | 2 | robust PPG signal |
| Average Value (V) | Peak-to-Peak Amplitude (V) | Distance (cm) | Recorded Signal |
|---|---|---|---|
| 0.1 | 0.005 | 2 | signal overwhelmed by noise |
| 0.1 | 0.0075 | 2 | robust PPG signal |
| Average Value (V) | LED Current (mA) | Measured Power of Red LED (µW) | Measured Power of Infrared LED (µW) |
|---|---|---|---|
| 0.008 | 0.13 | 1.77 | // |
| 0.01 | 0.16 | 2.66 | 0.513 |
| 0.03 | 0.48 | 15.2 | 2.51 |
| 0.07 | 1.1 | 47.8 | 8.30 |
| 0.1 | 1.6 | 74.5 | 13.3 |
| 0.2 | 3.2 | 168 | 31.8 |
| 0.3 | 4.8 | 264 | 51.6 |
| 0.4 | 6.5 | 362 | 72.2 |
| 0.5 | 8.1 | 460 | 93.1 |
| 0.6 | 9.7 | 558 | 114 |
| 0.7 | 11.3 | 656 | 136 |
| 0.8 | 12.9 | 755 | 157 |
| 0.9 | 14.5 | 853 | 179 |
| 1 | 16.1 | 954 | 200 |
Disclaimer/Publisher’s Note: The statements, opinions and data contained in all publications are solely those of the individual author(s) and contributor(s) and not of MDPI and/or the editor(s). MDPI and/or the editor(s) disclaim responsibility for any injury to people or property resulting from any ideas, methods, instructions or products referred to in the content. |
© 2024 by the authors. Licensee MDPI, Basel, Switzerland. This article is an open access article distributed under the terms and conditions of the Creative Commons Attribution (CC BY) license (https://creativecommons.org/licenses/by/4.0/).
Share and Cite
Pittella, E.; Testa, O.; Podestà, L.; Piuzzi, E. An Optical Signal Simulator for the Characterization of Photoplethysmographic Devices. Sensors 2024, 24, 1008. https://doi.org/10.3390/s24031008
Pittella E, Testa O, Podestà L, Piuzzi E. An Optical Signal Simulator for the Characterization of Photoplethysmographic Devices. Sensors. 2024; 24(3):1008. https://doi.org/10.3390/s24031008
Chicago/Turabian StylePittella, Erika, Orlandino Testa, Luca Podestà, and Emanuele Piuzzi. 2024. "An Optical Signal Simulator for the Characterization of Photoplethysmographic Devices" Sensors 24, no. 3: 1008. https://doi.org/10.3390/s24031008
APA StylePittella, E., Testa, O., Podestà, L., & Piuzzi, E. (2024). An Optical Signal Simulator for the Characterization of Photoplethysmographic Devices. Sensors, 24(3), 1008. https://doi.org/10.3390/s24031008