
Impact of Power and Time in Hepatic Microwave Ablation: Effect of Different Energy Delivery Schemes
 ,
, 
Abstract
1. Introduction
2. Materials and Methods
2.1. Computational Model
2.1.1. Geometry
2.1.2. Governing Equations and Conditions
2.1.3. Characteristics of Materials
2.1.4. Solver
2.1.5. Computational Modeling Phases
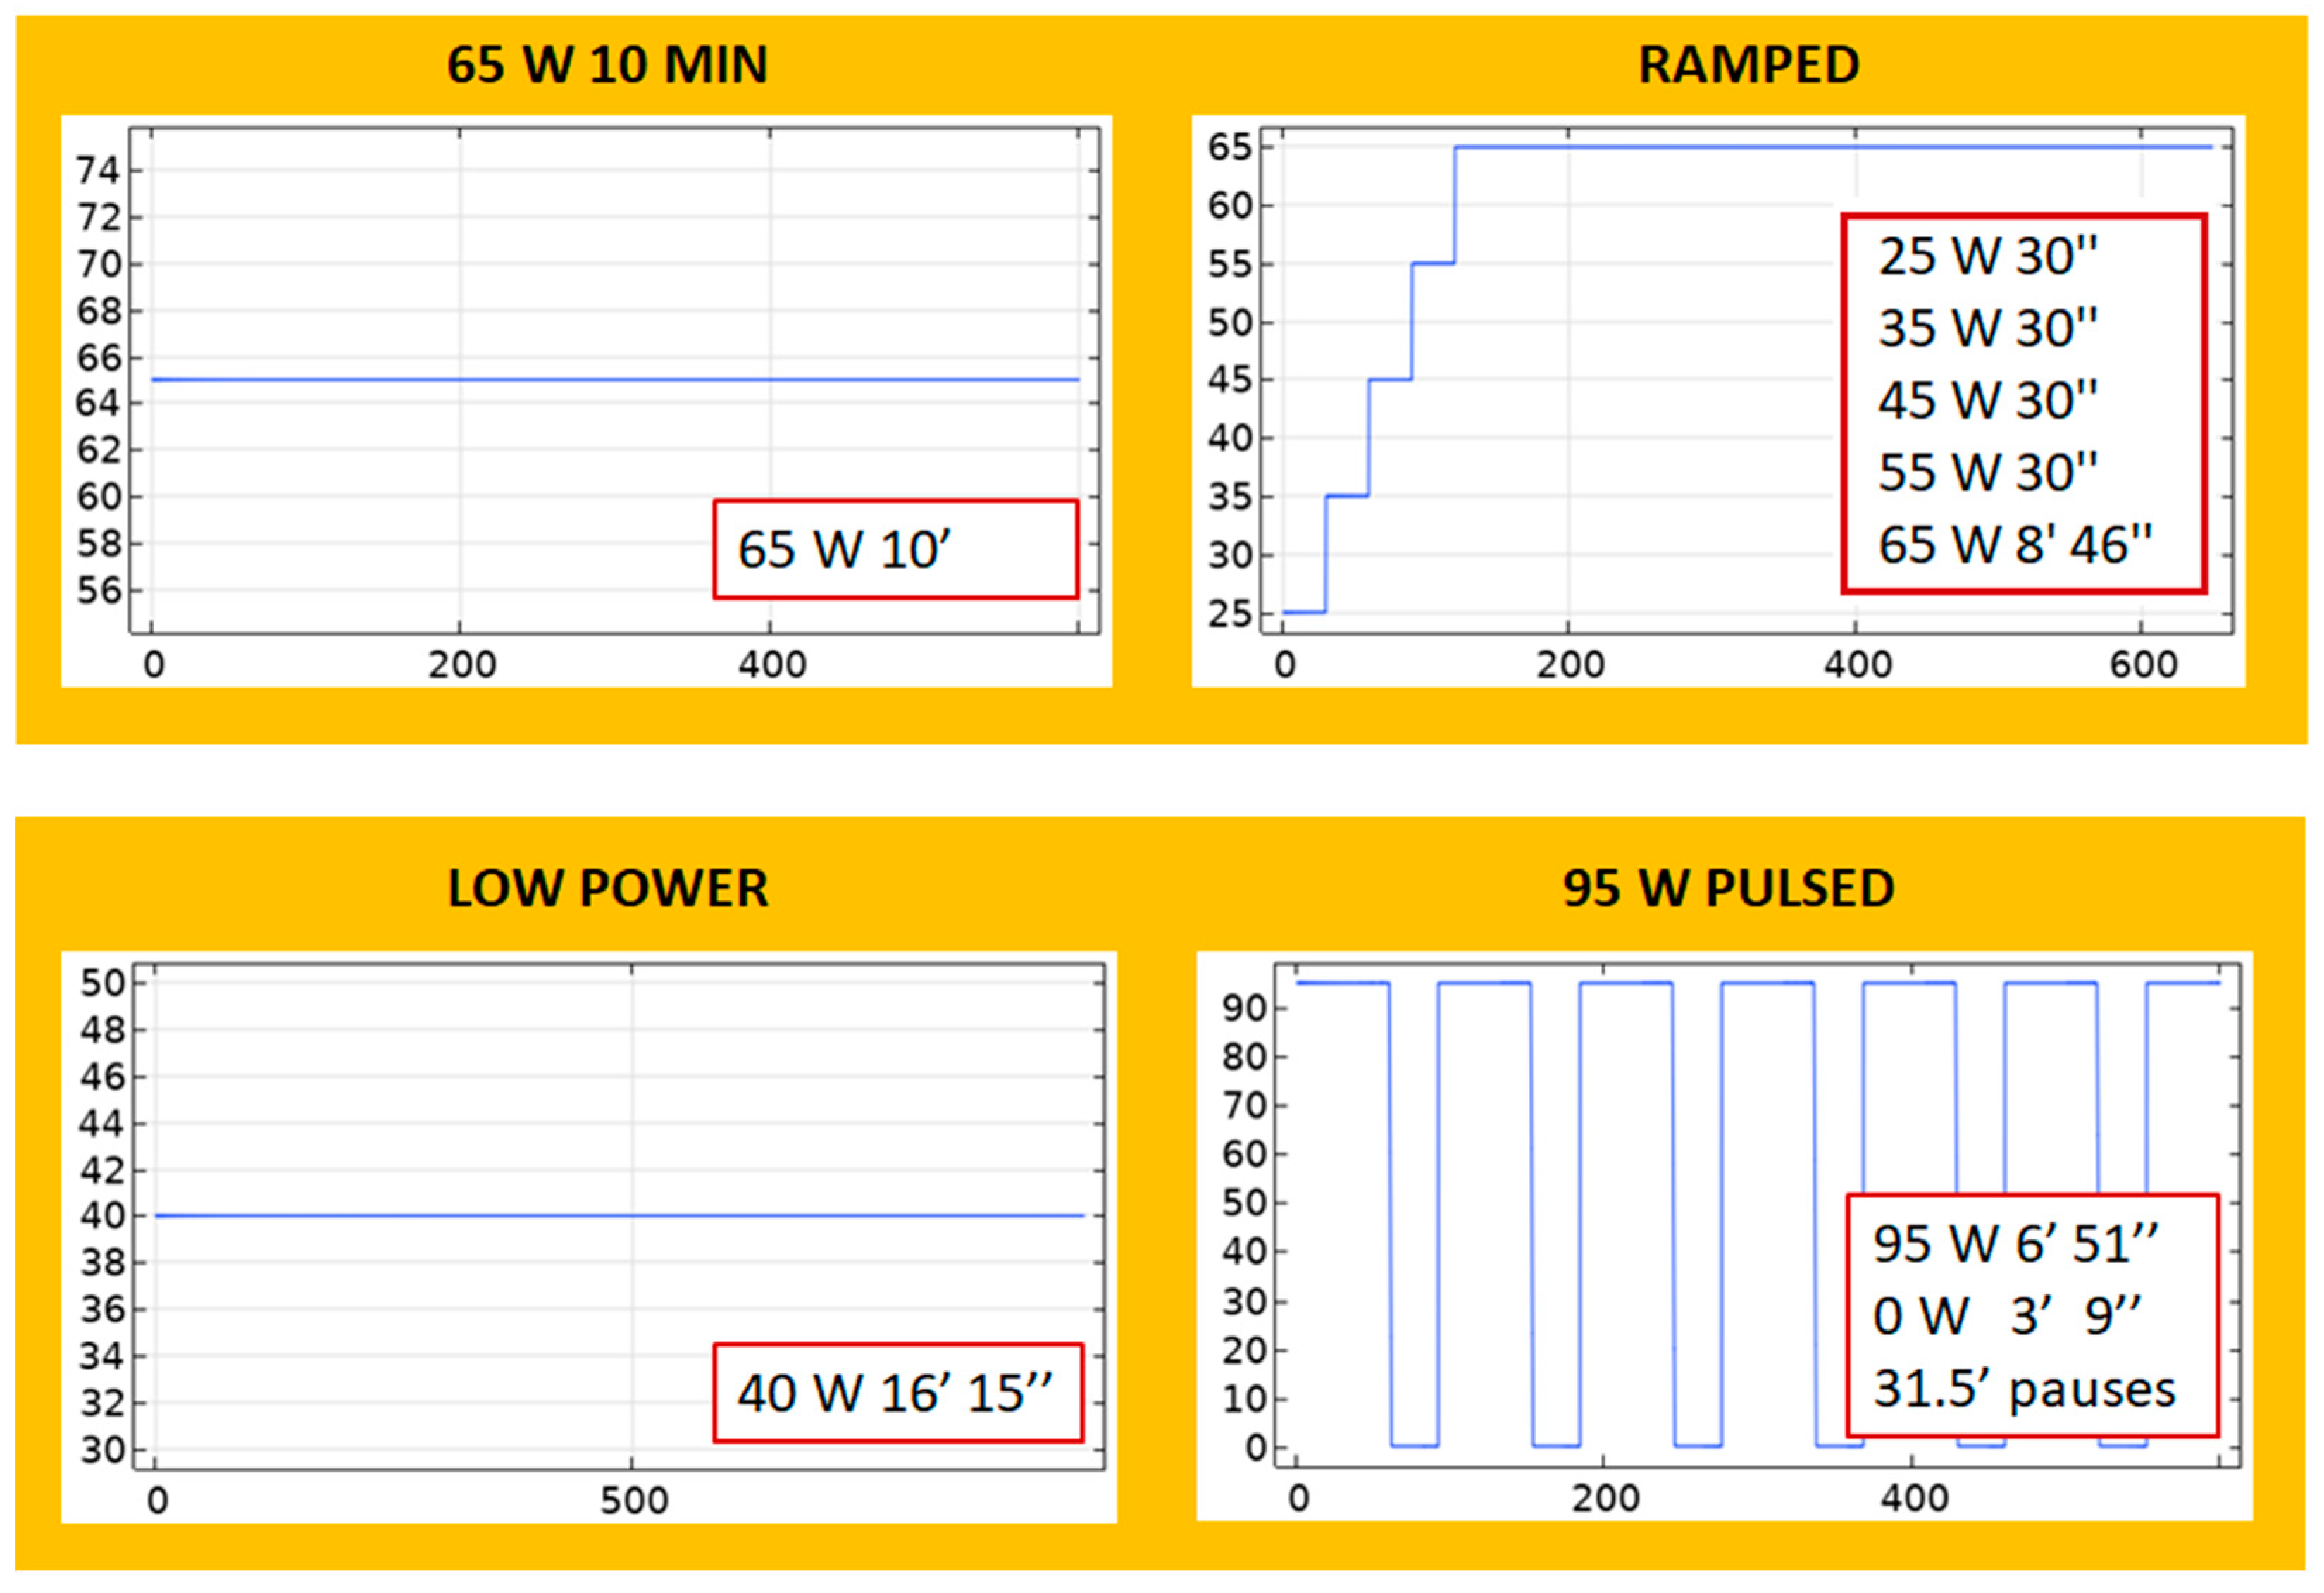
- 65 W 10 MIN: A continuous application of 65 W for 10 min.
- RAMPED: A step-wise increase in which power starts with a low value of 25 W and ends with 65 W: 25 W-30 s, 35 W-30 s, 45 W-30 s, 55 W-30 s, 65 W-8 min, and 46 s.
- LOW POWER: A continuous application of 40 W for 16 min and 15 s.
- 95 W PULSED: A periodic application of 95 W pulses with 31–32 cooling pauses.
- BOOKEND 95 W: A continuous 65 W for 8 min is applied, preceded and followed by 95 W for 1 min. The total applied energy of this protocol is 42.6 kJ.
- 65 W 15 MIN: A continuous application of 65 W for 15 min. The total applied energy of this protocol is 58.5 kJ.
2.1.6. Outcomes
2.2. Experiments in Ex Vivo Bovine Liver Tissue
3. Results
4. Discussion
5. Conclusions
Author Contributions
Funding
Institutional Review Board Statement
Data Availability Statement
Conflicts of Interest
References
- Brown, Z.J.; Tsilimigras, D.I.; Ruff, S.M.; Mohseni, A.; Kamel, I.R.; Cloyd, J.M.; Pawlik, T.M. Management of Hepatocellular Carcinoma: A Review. JAMA Surg. 2023, 158, 410–420. [Google Scholar] [CrossRef] [PubMed]
- Ahmed, M.; Solbiati, L.; Brace, C.L.; Breen, D.J.; Callstrom, M.R.; Charboneau, J.W.; Chen, M.H.; Choi, B.I.; de Baère, T.; Dodd, G.D., 3rd; et al. Image-guided tumor ablation: Standardization of terminology and reporting criteria–A 10-year update. Radiology 2014, 273, 241–260. [Google Scholar] [CrossRef] [PubMed]
- Kaye, E.A.; Cornelis, F.H.; Petre, E.N.; Tyagi, N.; Shady, W.; Shi, W.; Zhang, Z.; Solomon, S.B.; Sofocleous, C.T.; Durack, J.C. Volumetric 3D assessment of ablation zones after thermal ablation of colorectal liver metastases to improve prediction of local tumor progression. Eur Radiol. 2019, 29, 2698–2705. [Google Scholar] [CrossRef] [PubMed]
- Fallahi, H.; Sebek, J.; Prakash, P. Broadband Dielectric Properties of Ex Vivo Bovine Liver Tissue Characterized at Ablative Temperatures. IEEE Trans Biomed Eng. 2021, 68, 90–98. [Google Scholar] [CrossRef] [PubMed]
- Ji, Z.; Brace, C.L. Expanded modeling of temperature-dependent dielectric properties for microwave thermal ablation. Phys. Med. Biol. 2011, 56, 5249–5264. [Google Scholar] [CrossRef]
- Lopresto, V.; Pinto, R.; Lovisolo, G.A.; Cavagnaro, M. Changes in the dielectric properties of ex vivo bovine liver during microwave thermal ablation at 2.45 GHz. Phys. Med. Biol. 2012, 57, 2309–2327. [Google Scholar] [CrossRef]
- Trujillo, M.; Berjano, E. Review of the mathematical functions used to model the temperature dependence of electrical and thermal conductivities of biological tissue in radiofrequency ablation. Int. J. Hyperth. 2013, 29, 590–597. [Google Scholar] [CrossRef]
- Née Reimann, C.H.; Bazrafshan, B.; Hübner, F.; Schmidt, S.; Schüler, M.; Panahi, B.; Kaltenbach, B.; Polkowski, C.; Vogl, T.J.; Jakoby, R. Dielectric Contrast Between Normal and Tumor Ex-Vivo Human Liver Tissue. IEEE Access. 2019, 7, 164113–164119. [Google Scholar] [CrossRef]
- Rossmann, C.; Haemmerich, D. Review of temperature dependence of thermal properties, dielectric properties, and perfusion of biological tissues at hyperthermic and ablation temperatures. Crit. Rev. Biomed. Eng. 2014, 42, 467–492. [Google Scholar] [CrossRef]
- Cavagnaro, M.; Pinto, R.; Lopresto, V. Numerical models to evaluate the temperature increase induced by ex vivo microwave thermal ablation. Phys. Med. Biol. 2015, 60, 3287–3311. [Google Scholar] [CrossRef]
- Hui, T.C.H.; Brace, C.L.; Hinshaw, J.L.; Quek, L.H.H.; Huang, I.K.H.; Kwan, J.; Lim, G.H.T.; Lee, F.T.; Pua, U. Microwave ablation of the liver in a live porcine model: The impact of power, time and total energy on ablation zone size and shape. Int. J. Hyperth. 2020, 37, 668–676. [Google Scholar] [CrossRef] [PubMed]
- Bottiglieri, A.; Ruvio, G.; O’Halloran, M.; Farina, L. Exploiting Tissue Dielectric Properties to Shape Microwave Thermal Ablation Zones. Sensors 2020, 20, 3960. [Google Scholar] [CrossRef] [PubMed]
- Deshazer, G.; Merck, D.; Hagmann, M.; Dupuy, D.E.; Prakash, P. Physical modeling of microwave ablation zone clinical margin variance. Med. Phys. 2016, 43, 1764–1776. [Google Scholar] [CrossRef] [PubMed]
- Chiang, J.; Wang, P.; Brace, C.L. Computational modelling of microwave tumour ablations. Int. J. Hyperth. 2013, 29, 308–317. [Google Scholar] [CrossRef]
- Faridi, P.; Keselman, P.; Fallahi, H.; Prakash, P. Experimental assessment of microwave ablation computational modeling with MR thermometry. Med. Phys. 2020, 47, 3777–3788. [Google Scholar] [CrossRef]
- Pennes, H.H. Analysis of tissue and arterial blood temperatures in the resting human forearm. J. Appl. Physiol. 1948, 1, 93–122. [Google Scholar] [CrossRef]
- Abraham, J.P.; Sparrow, E.M. A thermal-ablation bioheat model including liquid-to-vapor phase change, pressure-and necrosis-dependent perfusion, and moisture-dependent properties. Int. J. Heat Mass Transf. 2007, 50, 2537–2544. [Google Scholar] [CrossRef]
- Chang, I.A. Considerations for thermal injury analysis for RF ablation devices. Open Biomed. Eng. J. 2010, 4, 3. [Google Scholar] [CrossRef]
- Bhattacharya, A.; Mahajan, R.L. Temperature dependence of thermal conductivity of biological tissues. Physiol. Meas. 2003, 24, 769. [Google Scholar] [CrossRef]
- Lopresto, V.; Pinto, R.; Farina, L.; Cavagnaro, M. Microwave thermal ablation: Effects of tissue properties variations on predictive models for treatment planning. Med. Eng. Phys. 2017, 46, 63–70. [Google Scholar] [CrossRef]
- Izzo, F.; Granata, V.; Grassi, R.; Fusco, R.; Palaia, R.; Delrio, P.; Carrafiello, G.; Azoulay, D.; Petrillo, A.; A Curley, S. Radiofrequency ablation and microwave ablation in liver tumors: An update. Oncologist 2019, 24, e990–e1005. [Google Scholar] [CrossRef] [PubMed]
- Schaible, J.; Pregler, B.; Bäumler, W.; Einspieler, I.; Jung, E.M.; Stroszczynski, C.; Beyer, L.P. Safety margin assessment after microwave ablation of liver tumors: Inter-and intrareader variability. Radiol. Oncol. 2020, 54, 57–61. [Google Scholar] [CrossRef] [PubMed]
- Huang, H.; Zhang, L.; Moser, M.A.; Zhang, W.; Zhang, B. A review of antenna designs for percutaneous microwave ablation. Phys. Med. 2021, 84, 254–264. [Google Scholar] [CrossRef] [PubMed]
- Poggi, G.; Montagna, B.; Di Cesare, P.; Riva, G.; Bernardo, G.; Mazzucco, M.; Riccardi, A. Microwave ablation of hepatocellular carcinoma using a new percutaneous device: Preliminary results. Anticancer. Res. 2013, 33, 1221–1227. [Google Scholar]
- Etoz, S.; Brace, C.L. Analysis of microwave ablation antenna optimization techniques. Int. J. RF Microw. Comput. Eng. 2018, 28, e21224. [Google Scholar] [CrossRef]
- Amabile, C.; Farina, L.; Lopresto, V.; Pinto, R.; Cassarino, S.; Tosoratti, N.; Goldberg, S.N.; Cavagnaro, M. Tissue shrinkage in microwave ablation of liver: An ex vivo predictive model. Int. J. Hyperth. 2017, 33, 101–109. [Google Scholar] [CrossRef]
- Liu, D.; Brace, C.L. CT imaging during microwave ablation: Analysis of spatial and temporal tissue contraction. Med. Phys. 2014, 41, 113303. [Google Scholar] [CrossRef]
- Radosevic, A.; Prieto, D.; Burdío, F.; Berjano, E.; Prakash, P.; Trujillo, M. Short pulsed microwave ablation: Computer modeling and ex vivo experiments. Int. J. Hyperth. 2021, 38, 409–420. [Google Scholar] [CrossRef]
- Jin, X.; Feng, Y.; Zhu, R.; Qian, L.; Yang, Y.; Yu, Q.; Zou, Z.; Li, W.; Liu, Y.; Qian, Z. Temperature control and intermittent time-set protocol optimization for minimizing tissue carbonization in microwave ablation. Int. J. Hyperth. 2022, 39, 868–879. [Google Scholar] [CrossRef]


| Material | σ (S/m) | (W/m·K) | ρ (kg/m3) | (J/kg·K) | |
|---|---|---|---|---|---|
| Liver | 1.8 (a) | 44.3 (a) | 0.5 (b) | 1050 (c) | 3400 (c) |
| 370 (d) | 2156 (d) | ||||
| Copper | 5.998 × 10⁷ | 1 | |||
| Teflon | 10−4 | 2.1 | |||
| Tube | 0 | 3.1 | |||
| Water | 0.9 | 78 | |||
| Blood | 1000 | 4148 |
| D (mm) | L (mm) | ||||||
|---|---|---|---|---|---|---|---|
| Theoretical | Experimental | Error | Theoretical | Experimental | Error | ||
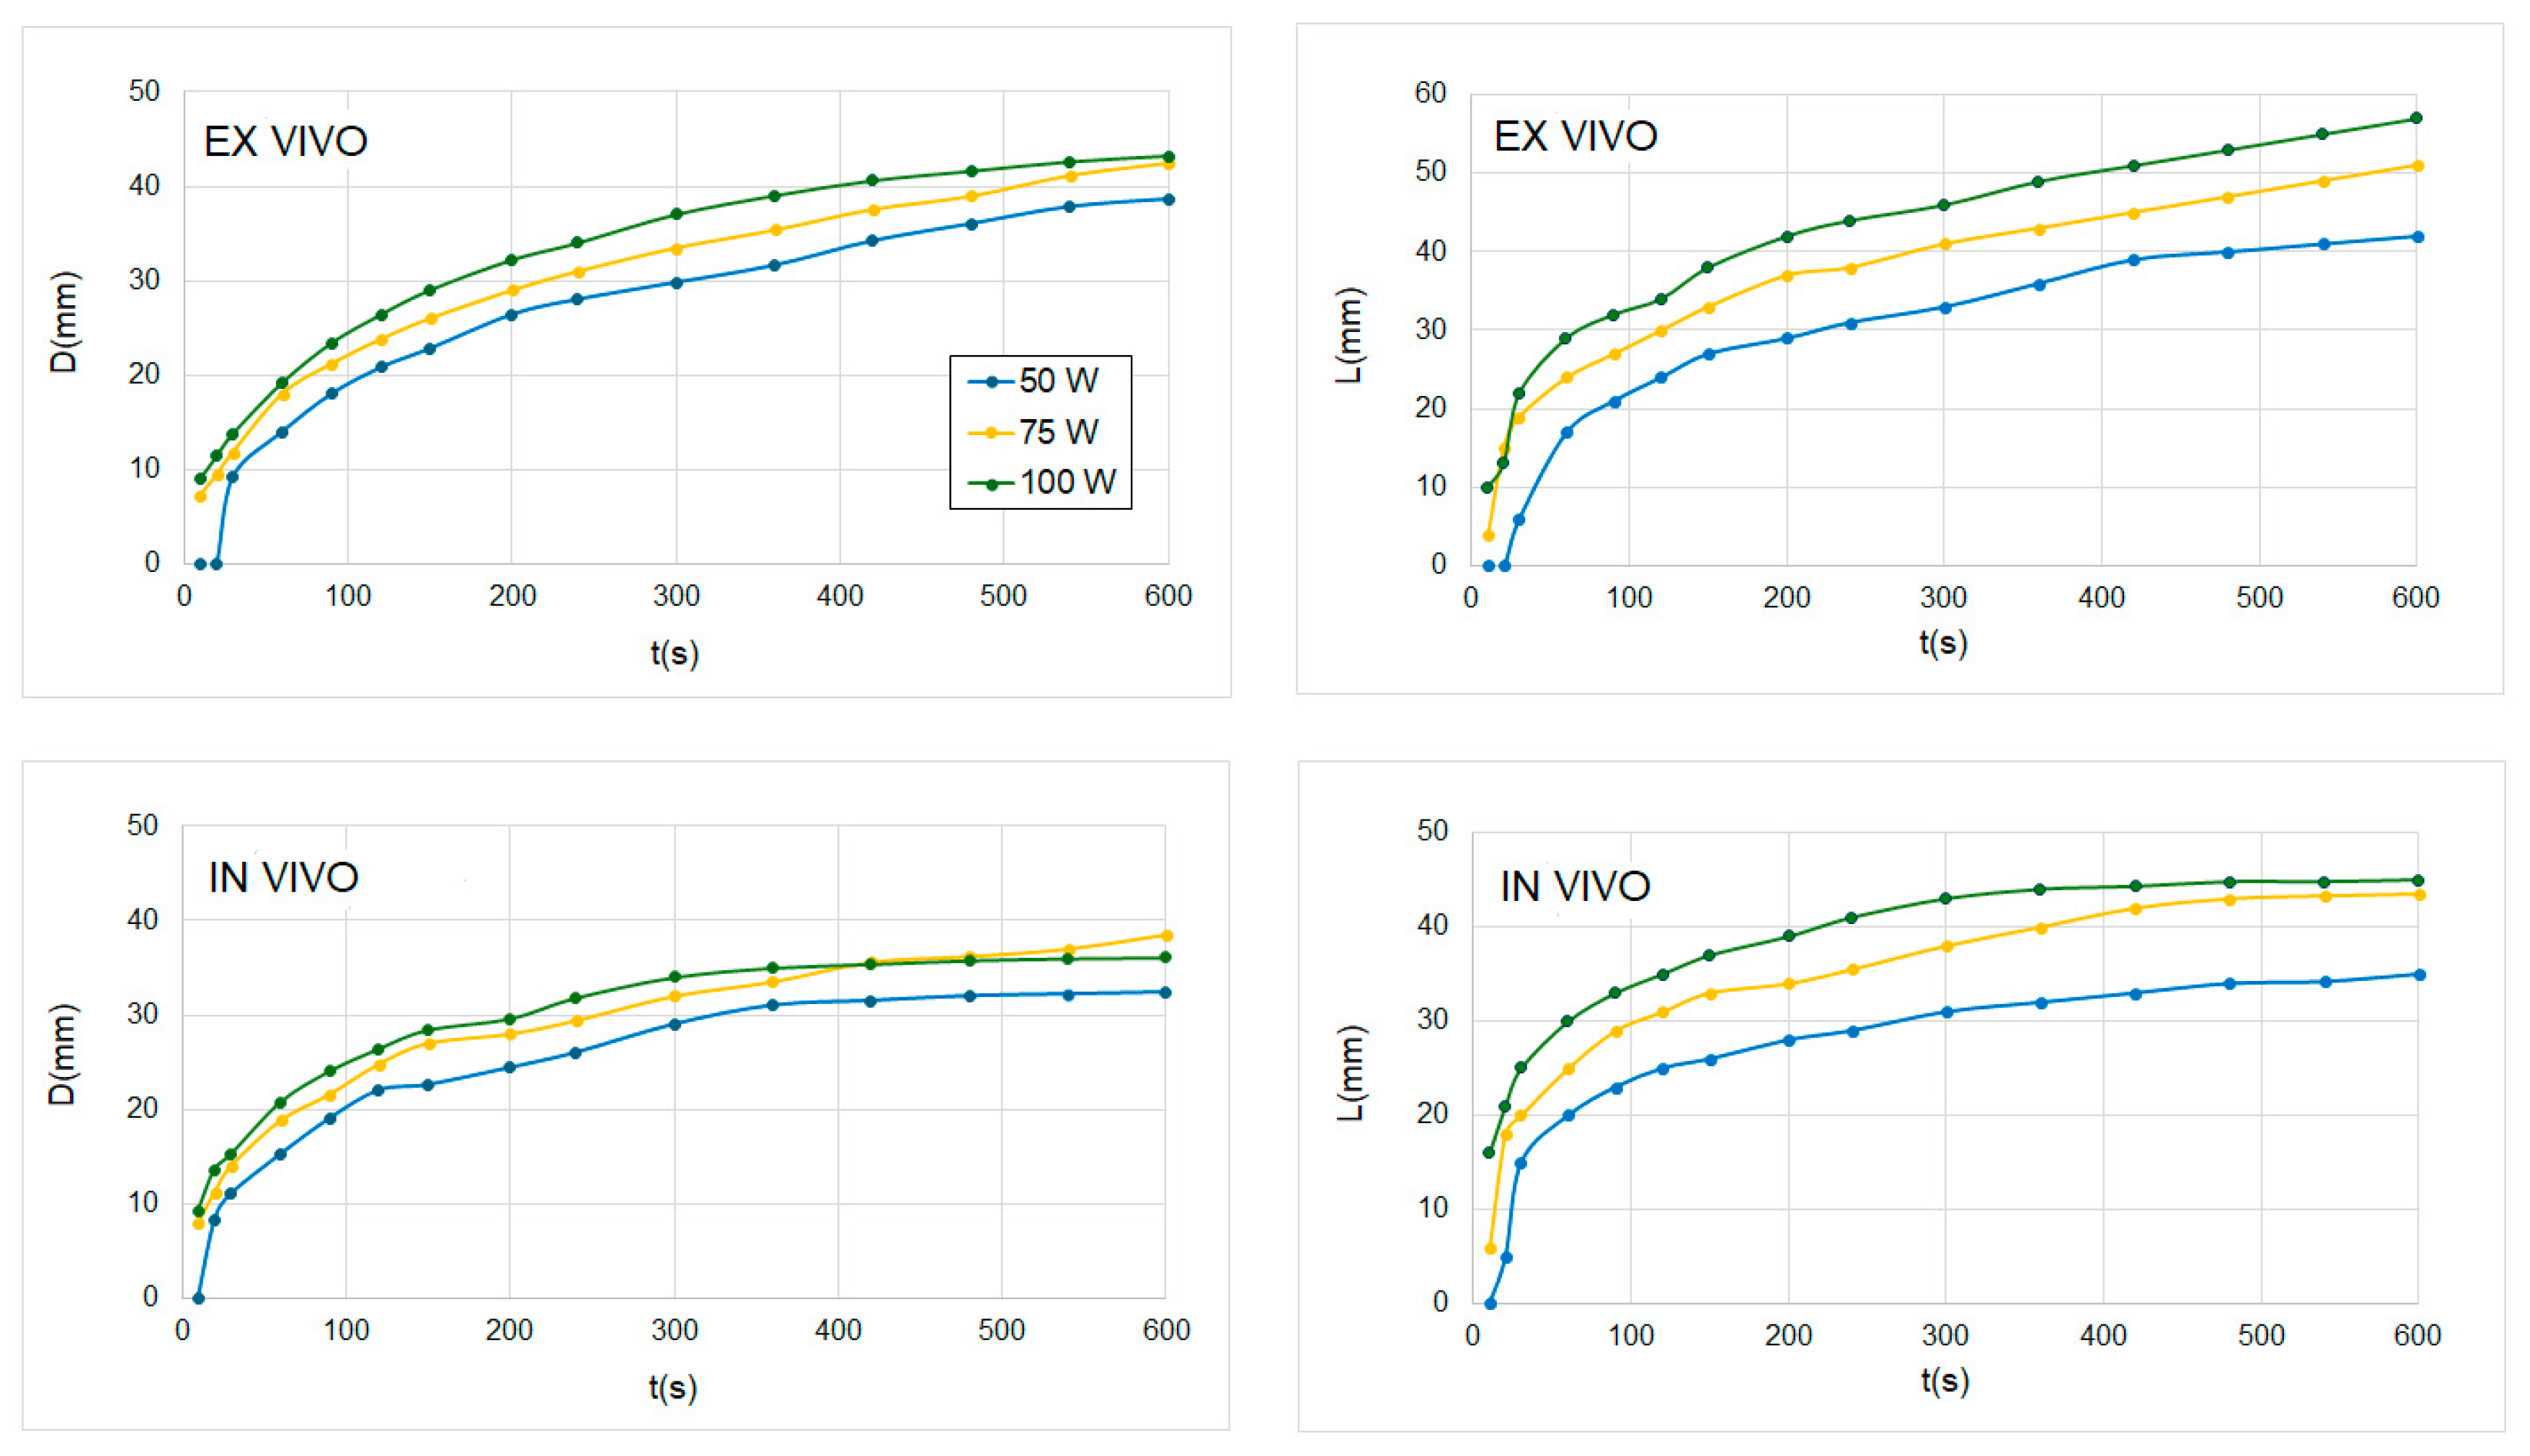
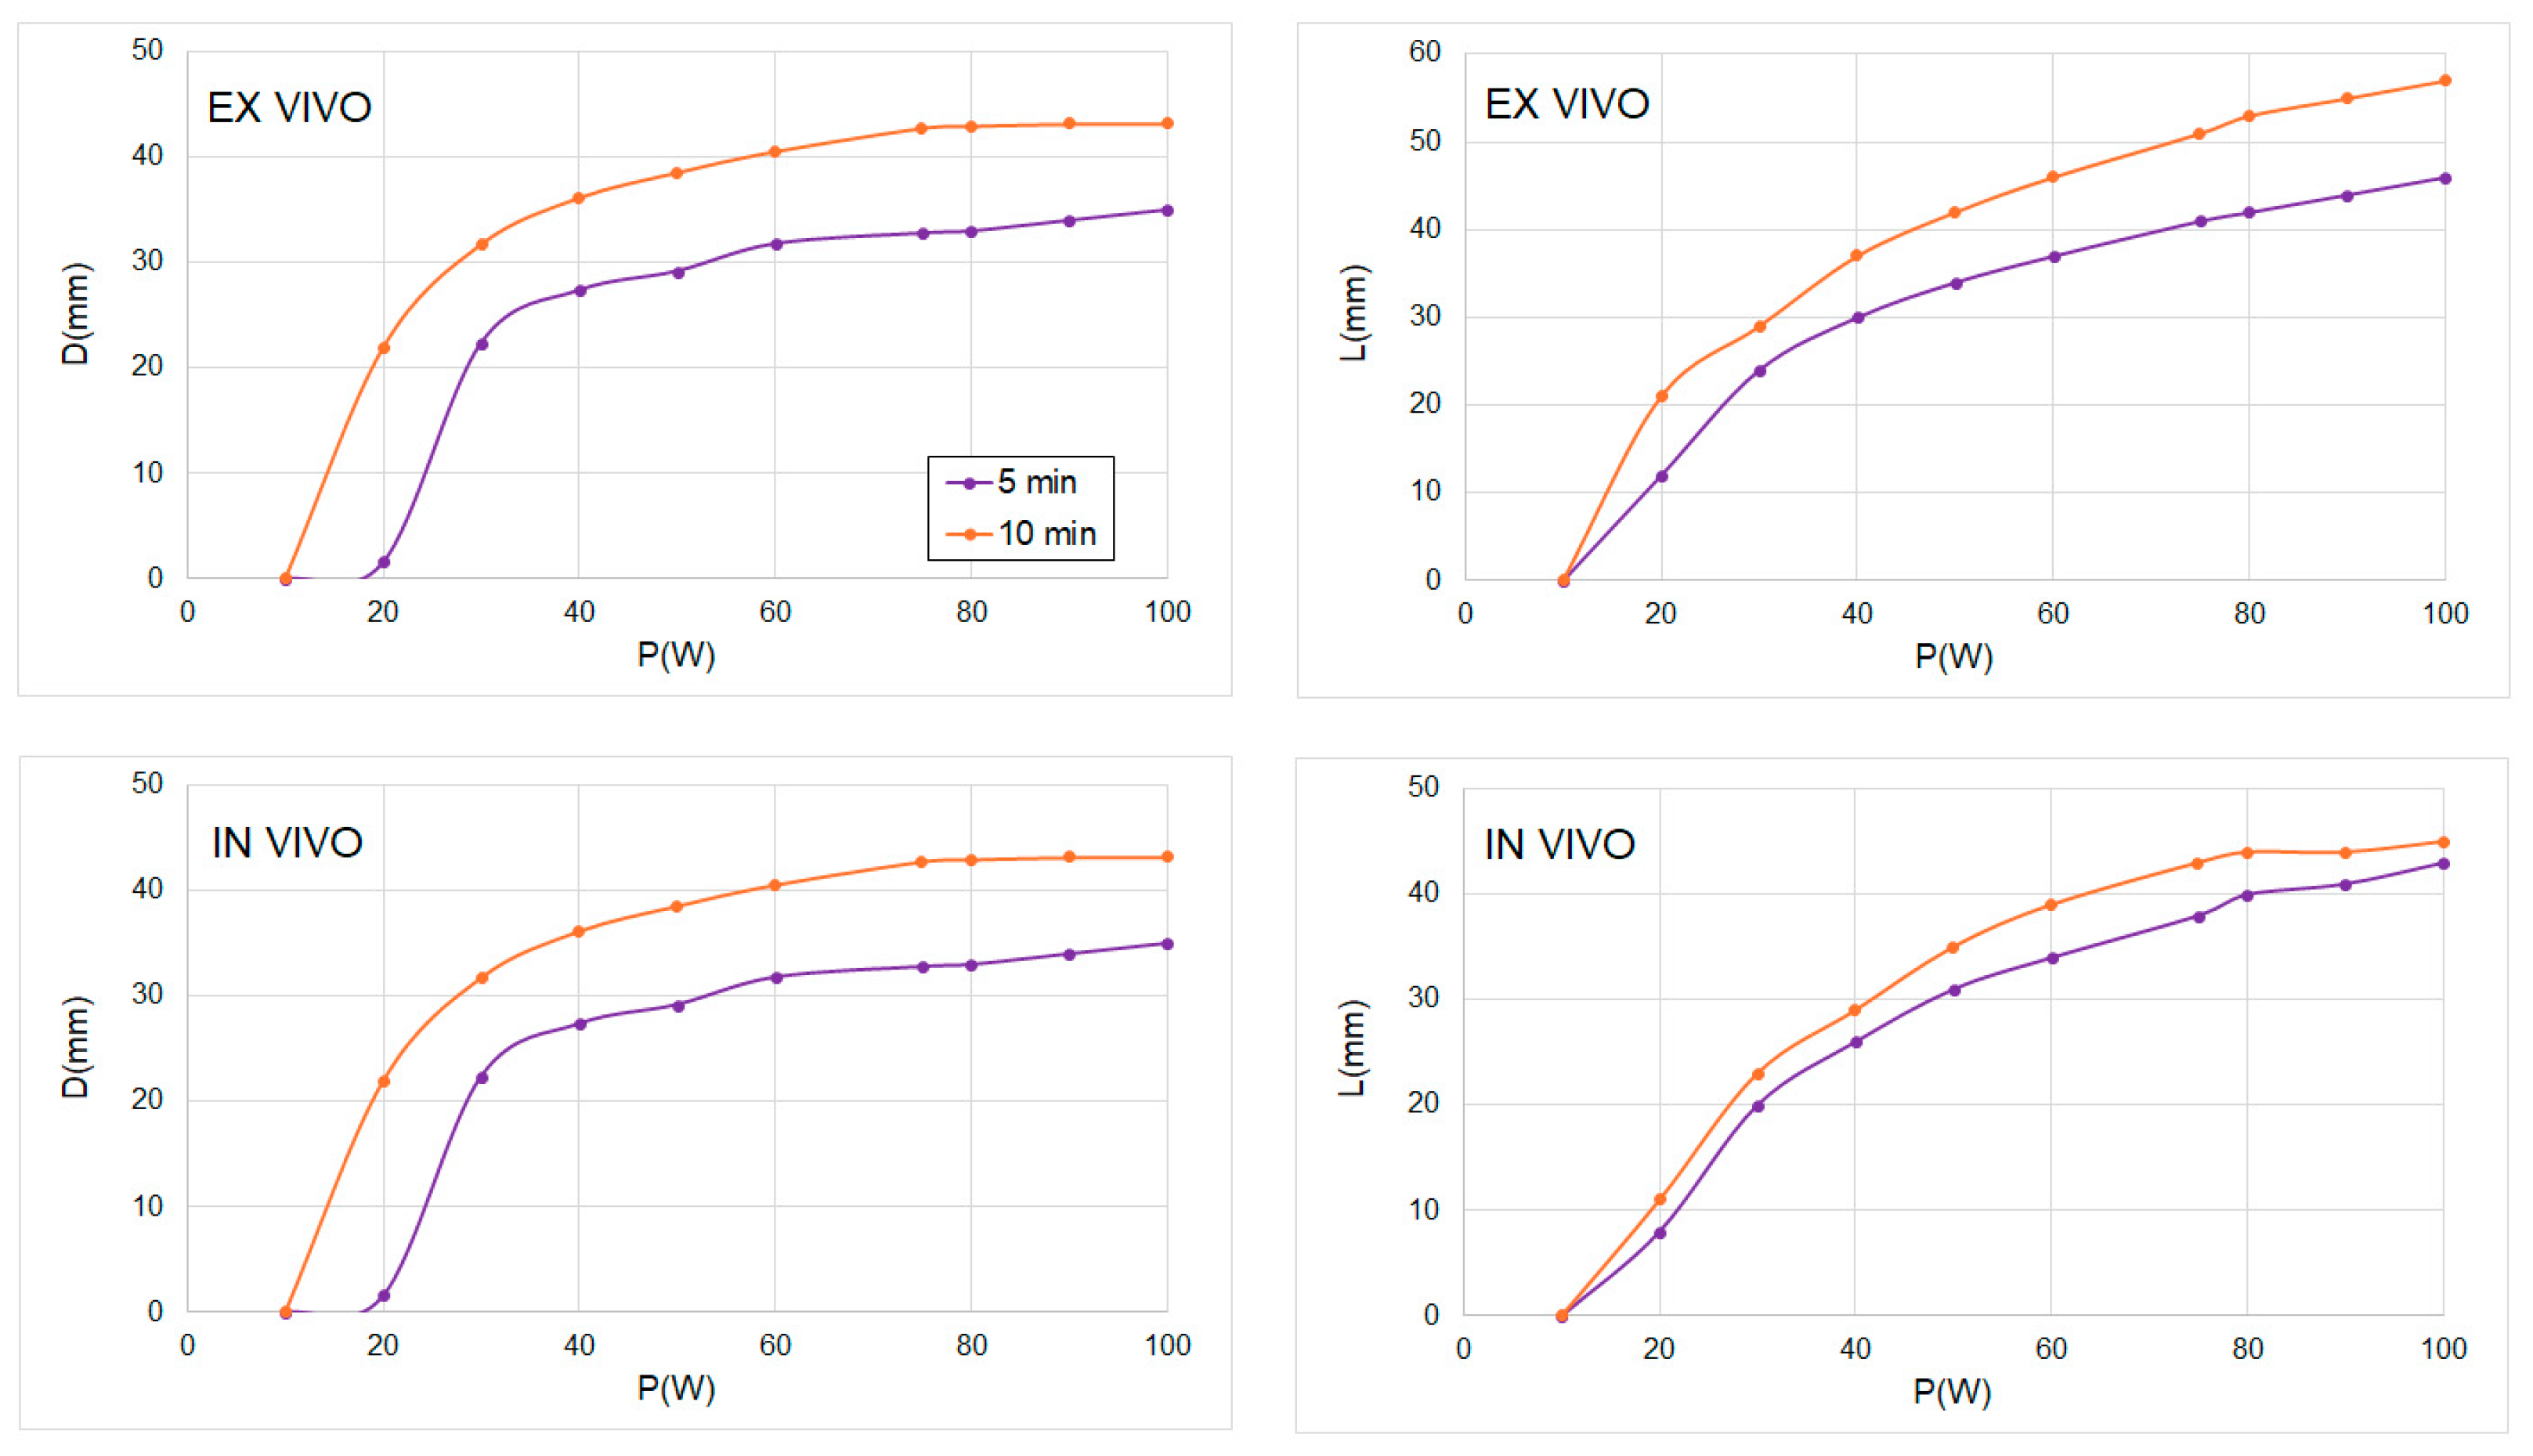
| 50 W | 5 min (n = 3) | 29.8 | 26.2 ± 1.0 | 12% | 32.1 | 27.6 ± 4.3 | 15% |
| 10 min (n = 3) | 38.6 | 35.0 ± 1.0 | 9% | 42.2 | 36.4 ± 2.6 | 13% | |
| 75 W | 5 min (n = 3) | 33.5 | 30.3 ± 2.1 | 10% | 41.1 | 36.3 ± 2.5 | 11% |
| 10 min (n = 4) | 42.5 | 38.2 ± 1.7 | 10% | 51.0 | 47.8 ± 2.4 | 6% | |
| 100 W | 5 min (n = 3) | 37.0 | 34.1 ± 5.1 | 8% | 46.1 | 42.3 ± 2.3 | 8% |
| 10 min (n = 5) | 43.2 | 41.5 ± 2.8 | 4% | 57.0 | 51.9 ± 6.7 | 9% | |
| D (mm) | L (mm) | |||||
|---|---|---|---|---|---|---|
| Theoretical | Experimental | Error | Theoretical | Experimental | Error | |
| 65 W 10 MIN (n = 5) | 39.0 | 34.9 ± 2.9 | 11% | 45.1 | 39.3 ± 2.4 | 13% |
| RAMPED (n = 4) | 39.2 | 37.4 ± 3.4 | 5% | 42.1 | 41.9 ± 2.9 | 0% |
| LOW POWER (n = 2) | 39.1 | 35.5 ± 0.7 | 9% | 42.0 | 37.4 ± 3.5 | 11% |
| 95 W PULSED (n = 4) | 38.0 | 35.3 ± 2.4 | 7% | 45.0 | 40.7 ± 6.1 | 10% |
| BOOKEND 95 W (n = 5) | 39.8 | 38.5 ± 1.7 | 3% | 45.2 | 44.9 ± 3.1 | 0% |
| 65 W 15 MIN (n = 2) | 44.0 | 41.0 ± 0.0 | 7% | 49.1 | 43.5 ± 2.1 | 11% |
Disclaimer/Publisher’s Note: The statements, opinions and data contained in all publications are solely those of the individual author(s) and contributor(s) and not of MDPI and/or the editor(s). MDPI and/or the editor(s) disclaim responsibility for any injury to people or property resulting from any ideas, methods, instructions or products referred to in the content. |
© 2024 by the authors. Licensee MDPI, Basel, Switzerland. This article is an open access article distributed under the terms and conditions of the Creative Commons Attribution (CC BY) license (https://creativecommons.org/licenses/by/4.0/).
Share and Cite
Trujillo, M.; Najafabadi, M.E.; Romero, A.; Prakash, P.; Cornelis, F.H. Impact of Power and Time in Hepatic Microwave Ablation: Effect of Different Energy Delivery Schemes. Sensors 2024, 24, 7706. https://doi.org/10.3390/s24237706
Trujillo M, Najafabadi ME, Romero A, Prakash P, Cornelis FH. Impact of Power and Time in Hepatic Microwave Ablation: Effect of Different Energy Delivery Schemes. Sensors. 2024; 24(23):7706. https://doi.org/10.3390/s24237706
Chicago/Turabian StyleTrujillo, Macarena, Mahtab Ebad Najafabadi, Antonio Romero, Punit Prakash, and Francois H. Cornelis. 2024. "Impact of Power and Time in Hepatic Microwave Ablation: Effect of Different Energy Delivery Schemes" Sensors 24, no. 23: 7706. https://doi.org/10.3390/s24237706
APA StyleTrujillo, M., Najafabadi, M. E., Romero, A., Prakash, P., & Cornelis, F. H. (2024). Impact of Power and Time in Hepatic Microwave Ablation: Effect of Different Energy Delivery Schemes. Sensors, 24(23), 7706. https://doi.org/10.3390/s24237706