
Non-Uniform Antenna Array for Enhanced Medical Microwave Imaging


Abstract
1. Introduction
2. Problem Formulation
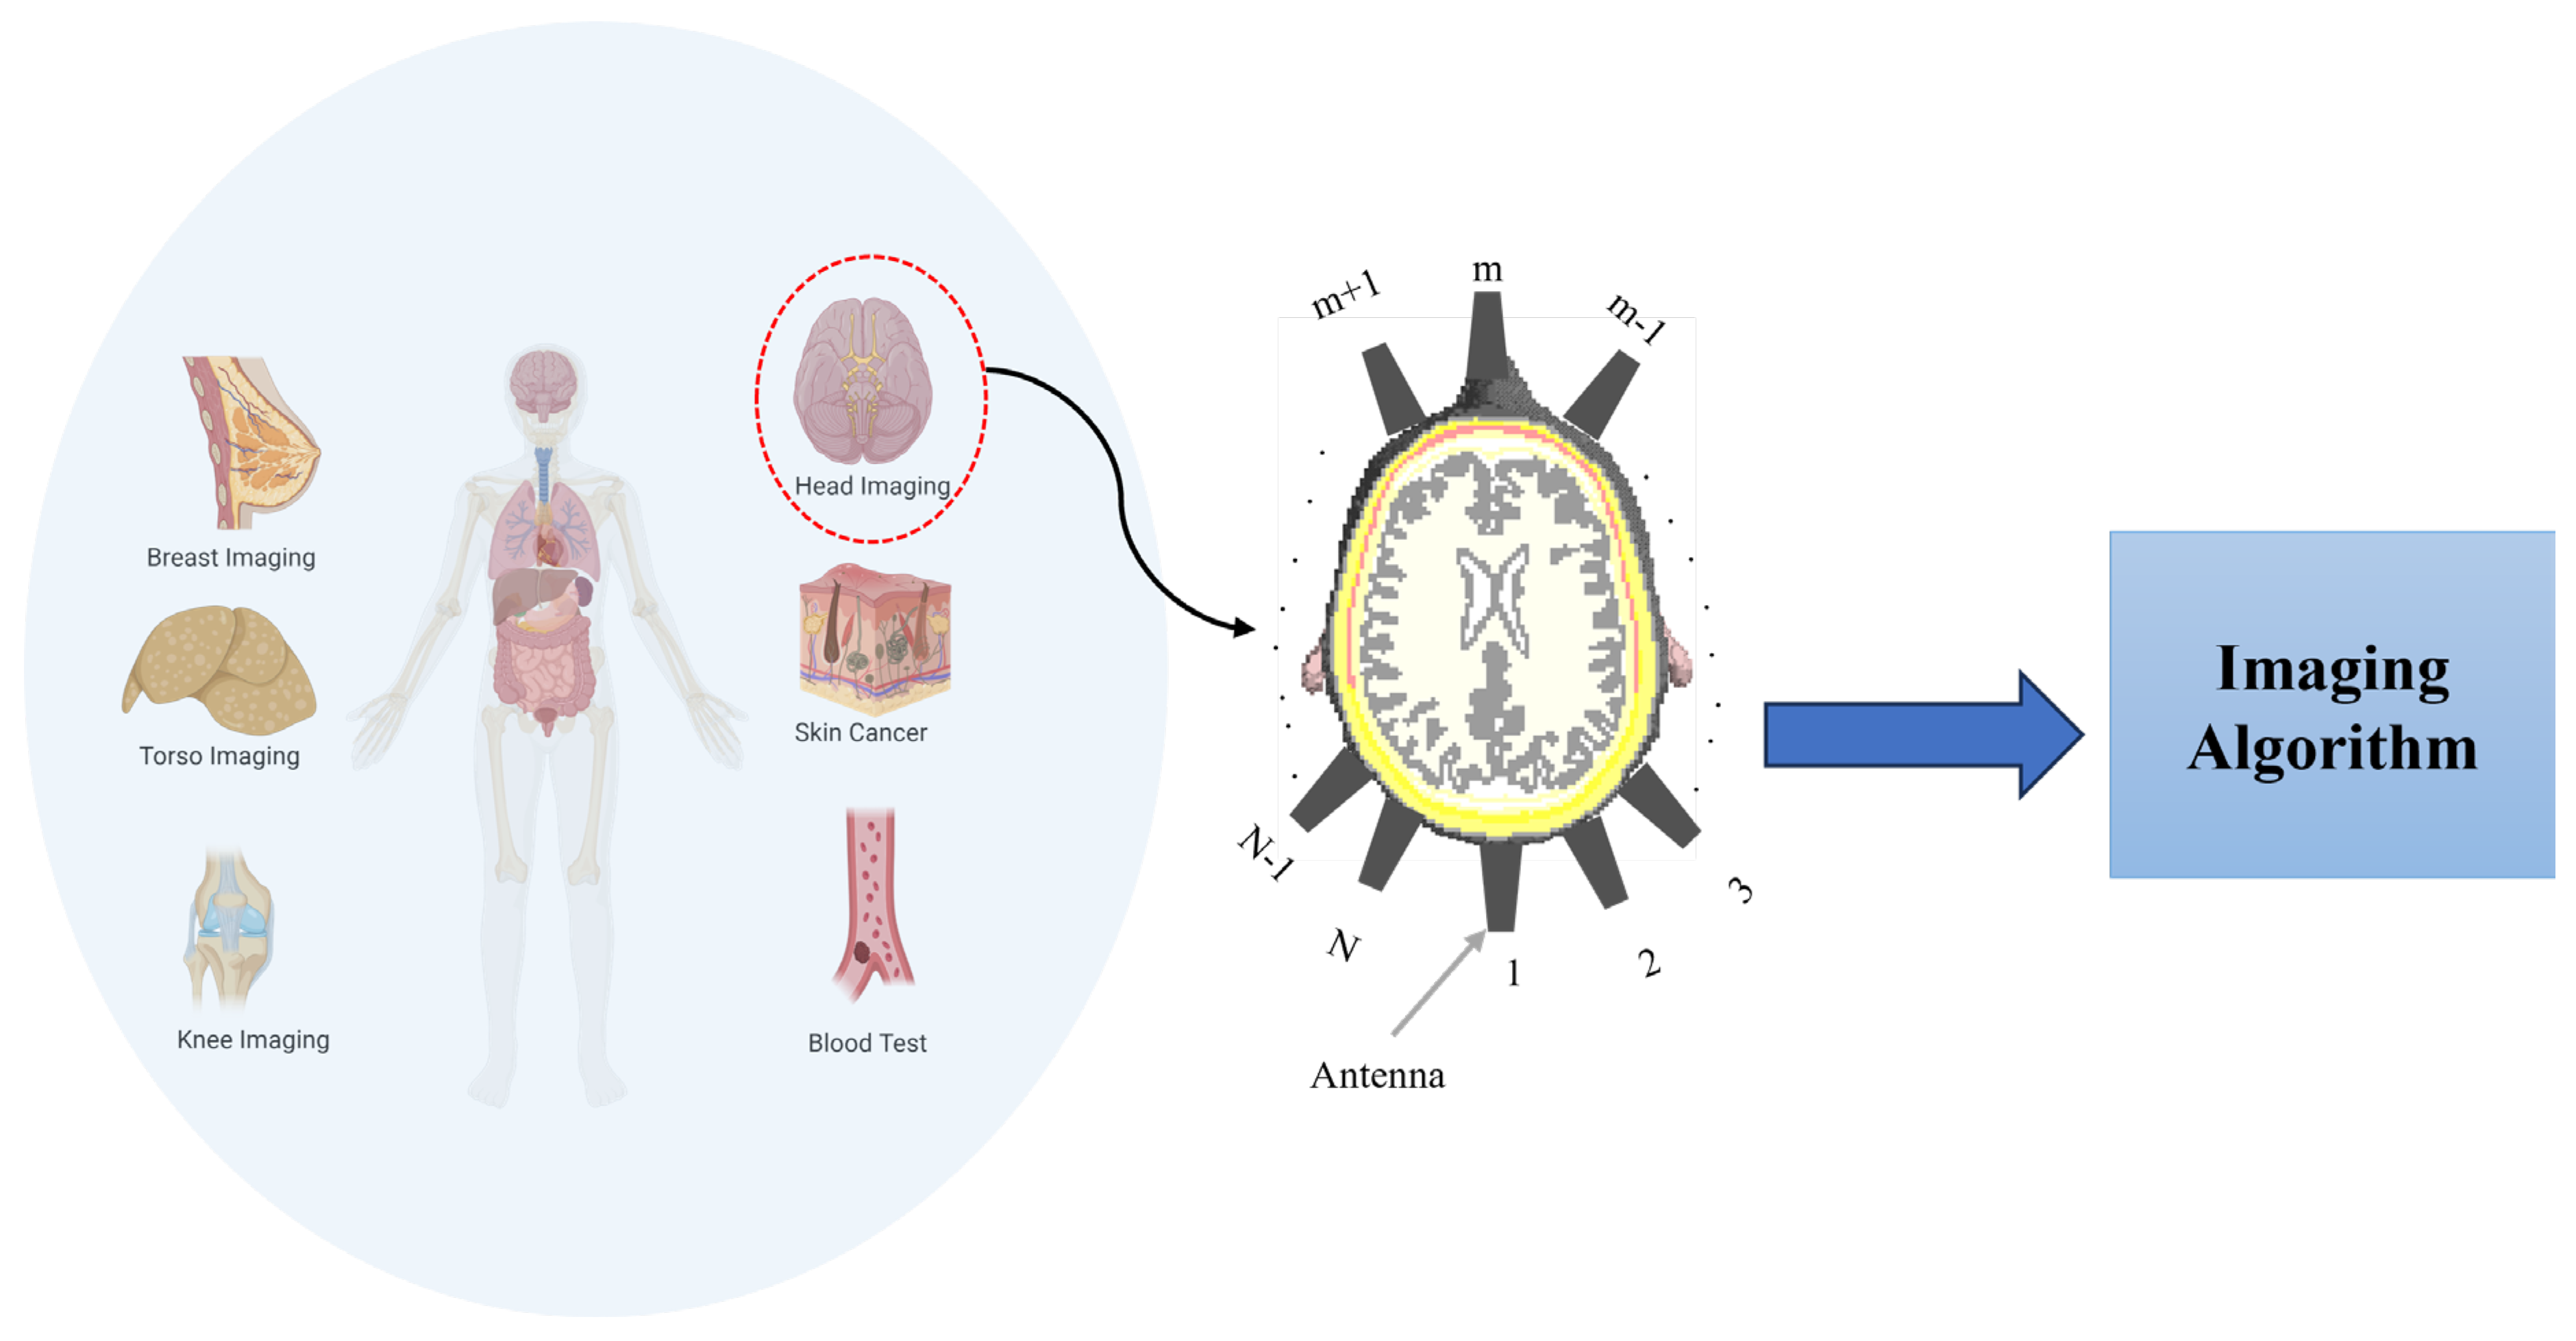
2.1. Principle of Acquired Imaging Information in MWI
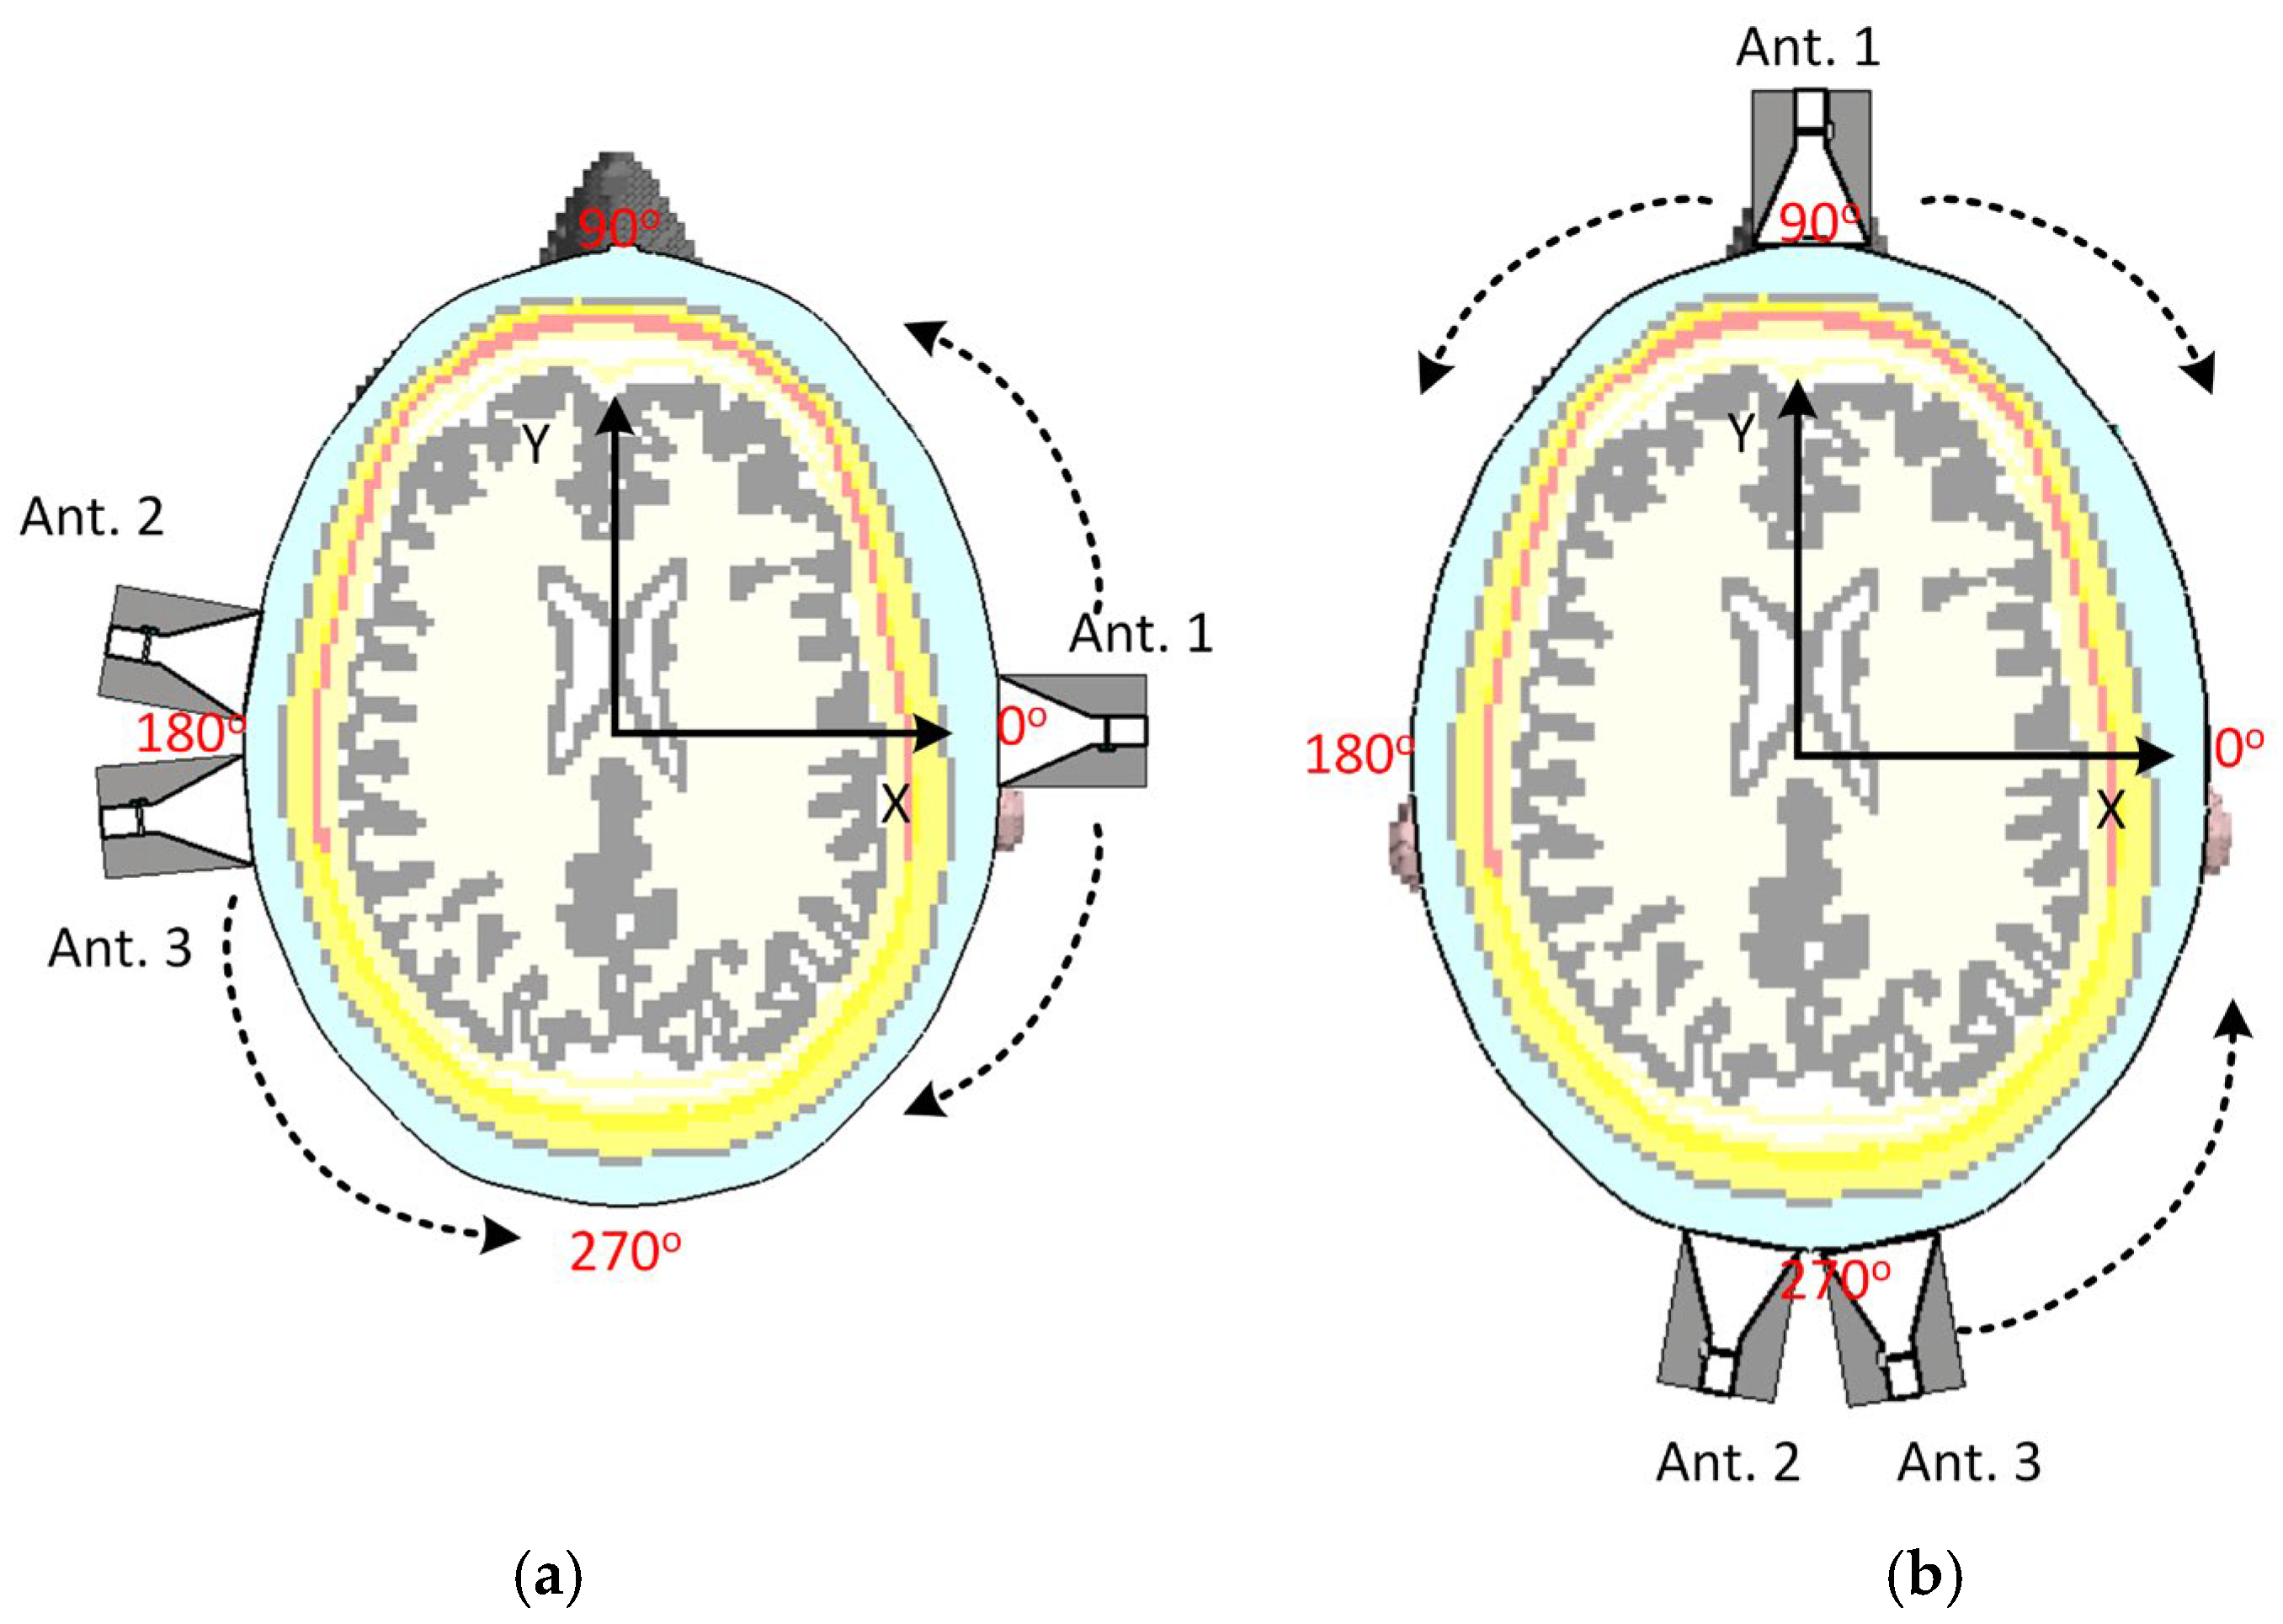
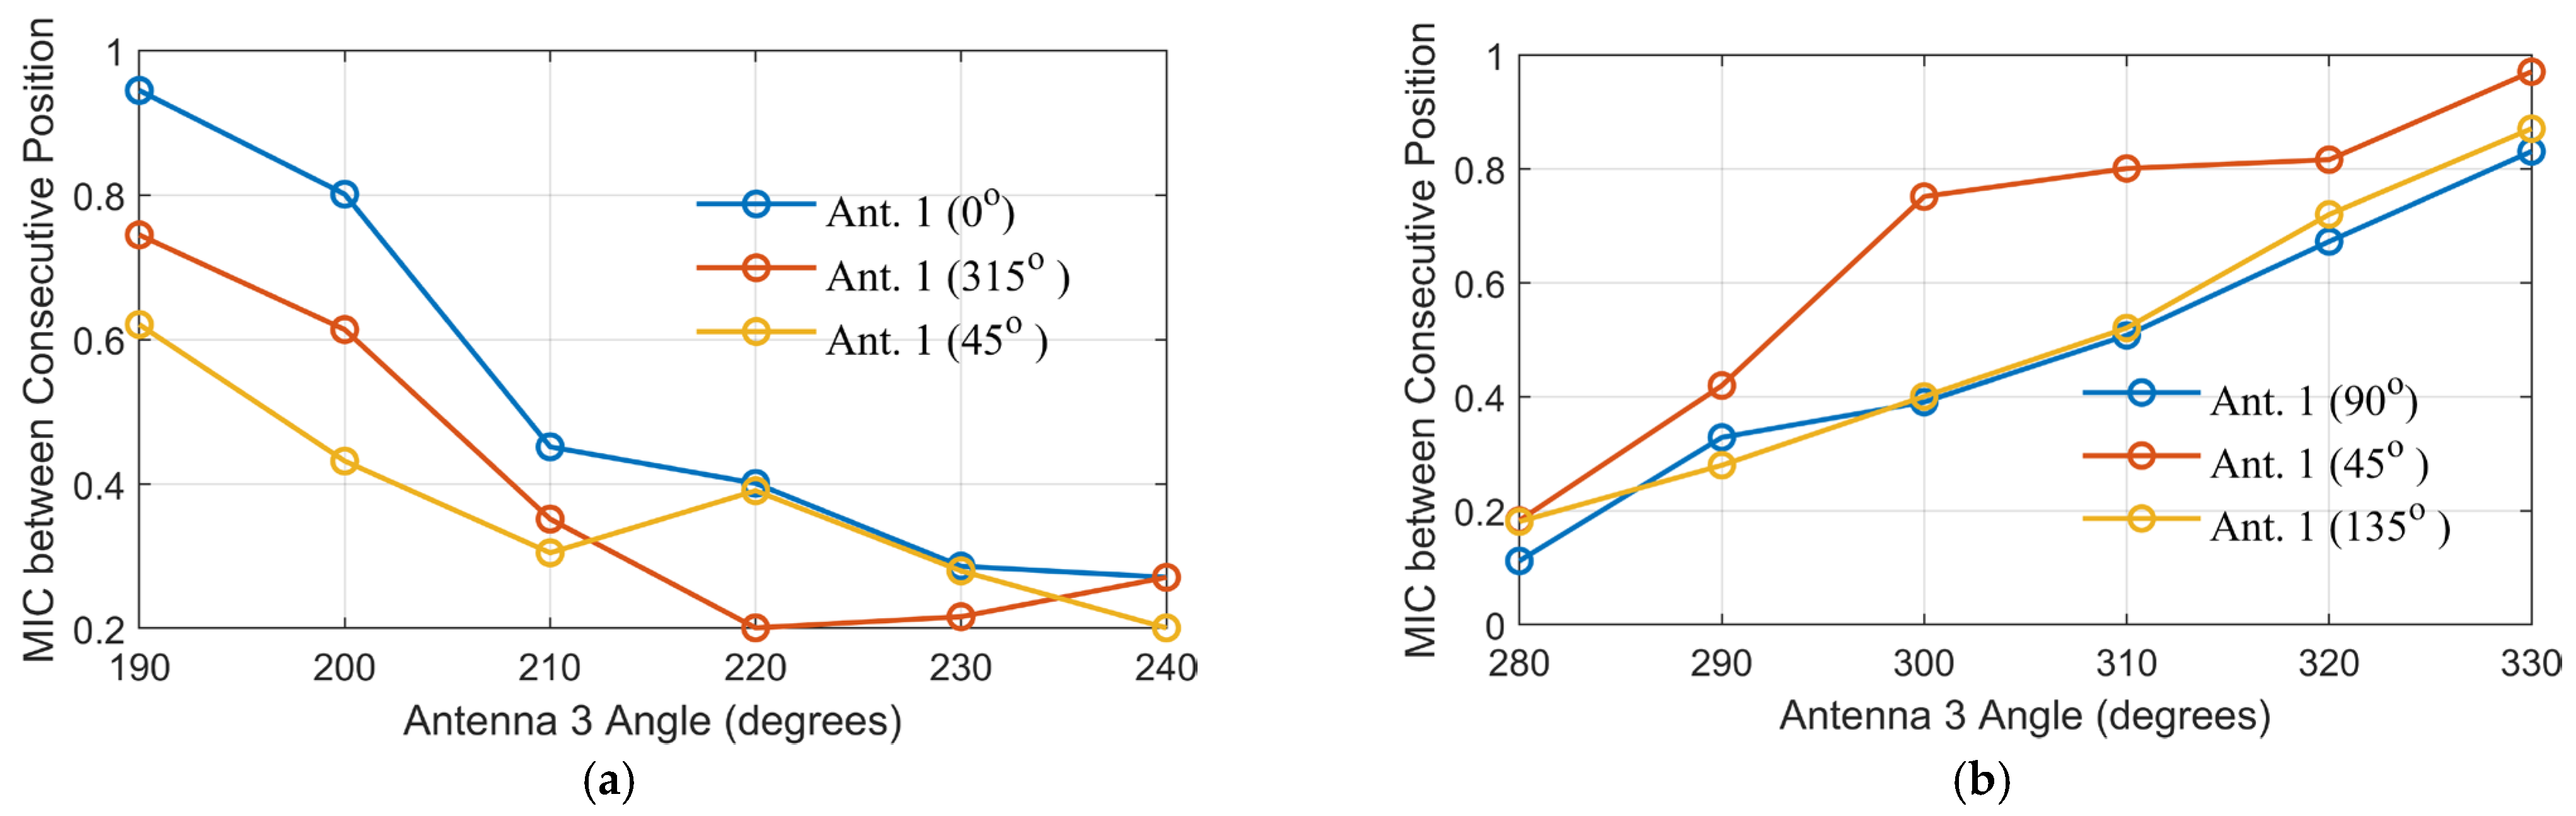
2.2. Impact of Antenna Positioning on MIC
3. Optimization of Antenna Positions for the Whole System
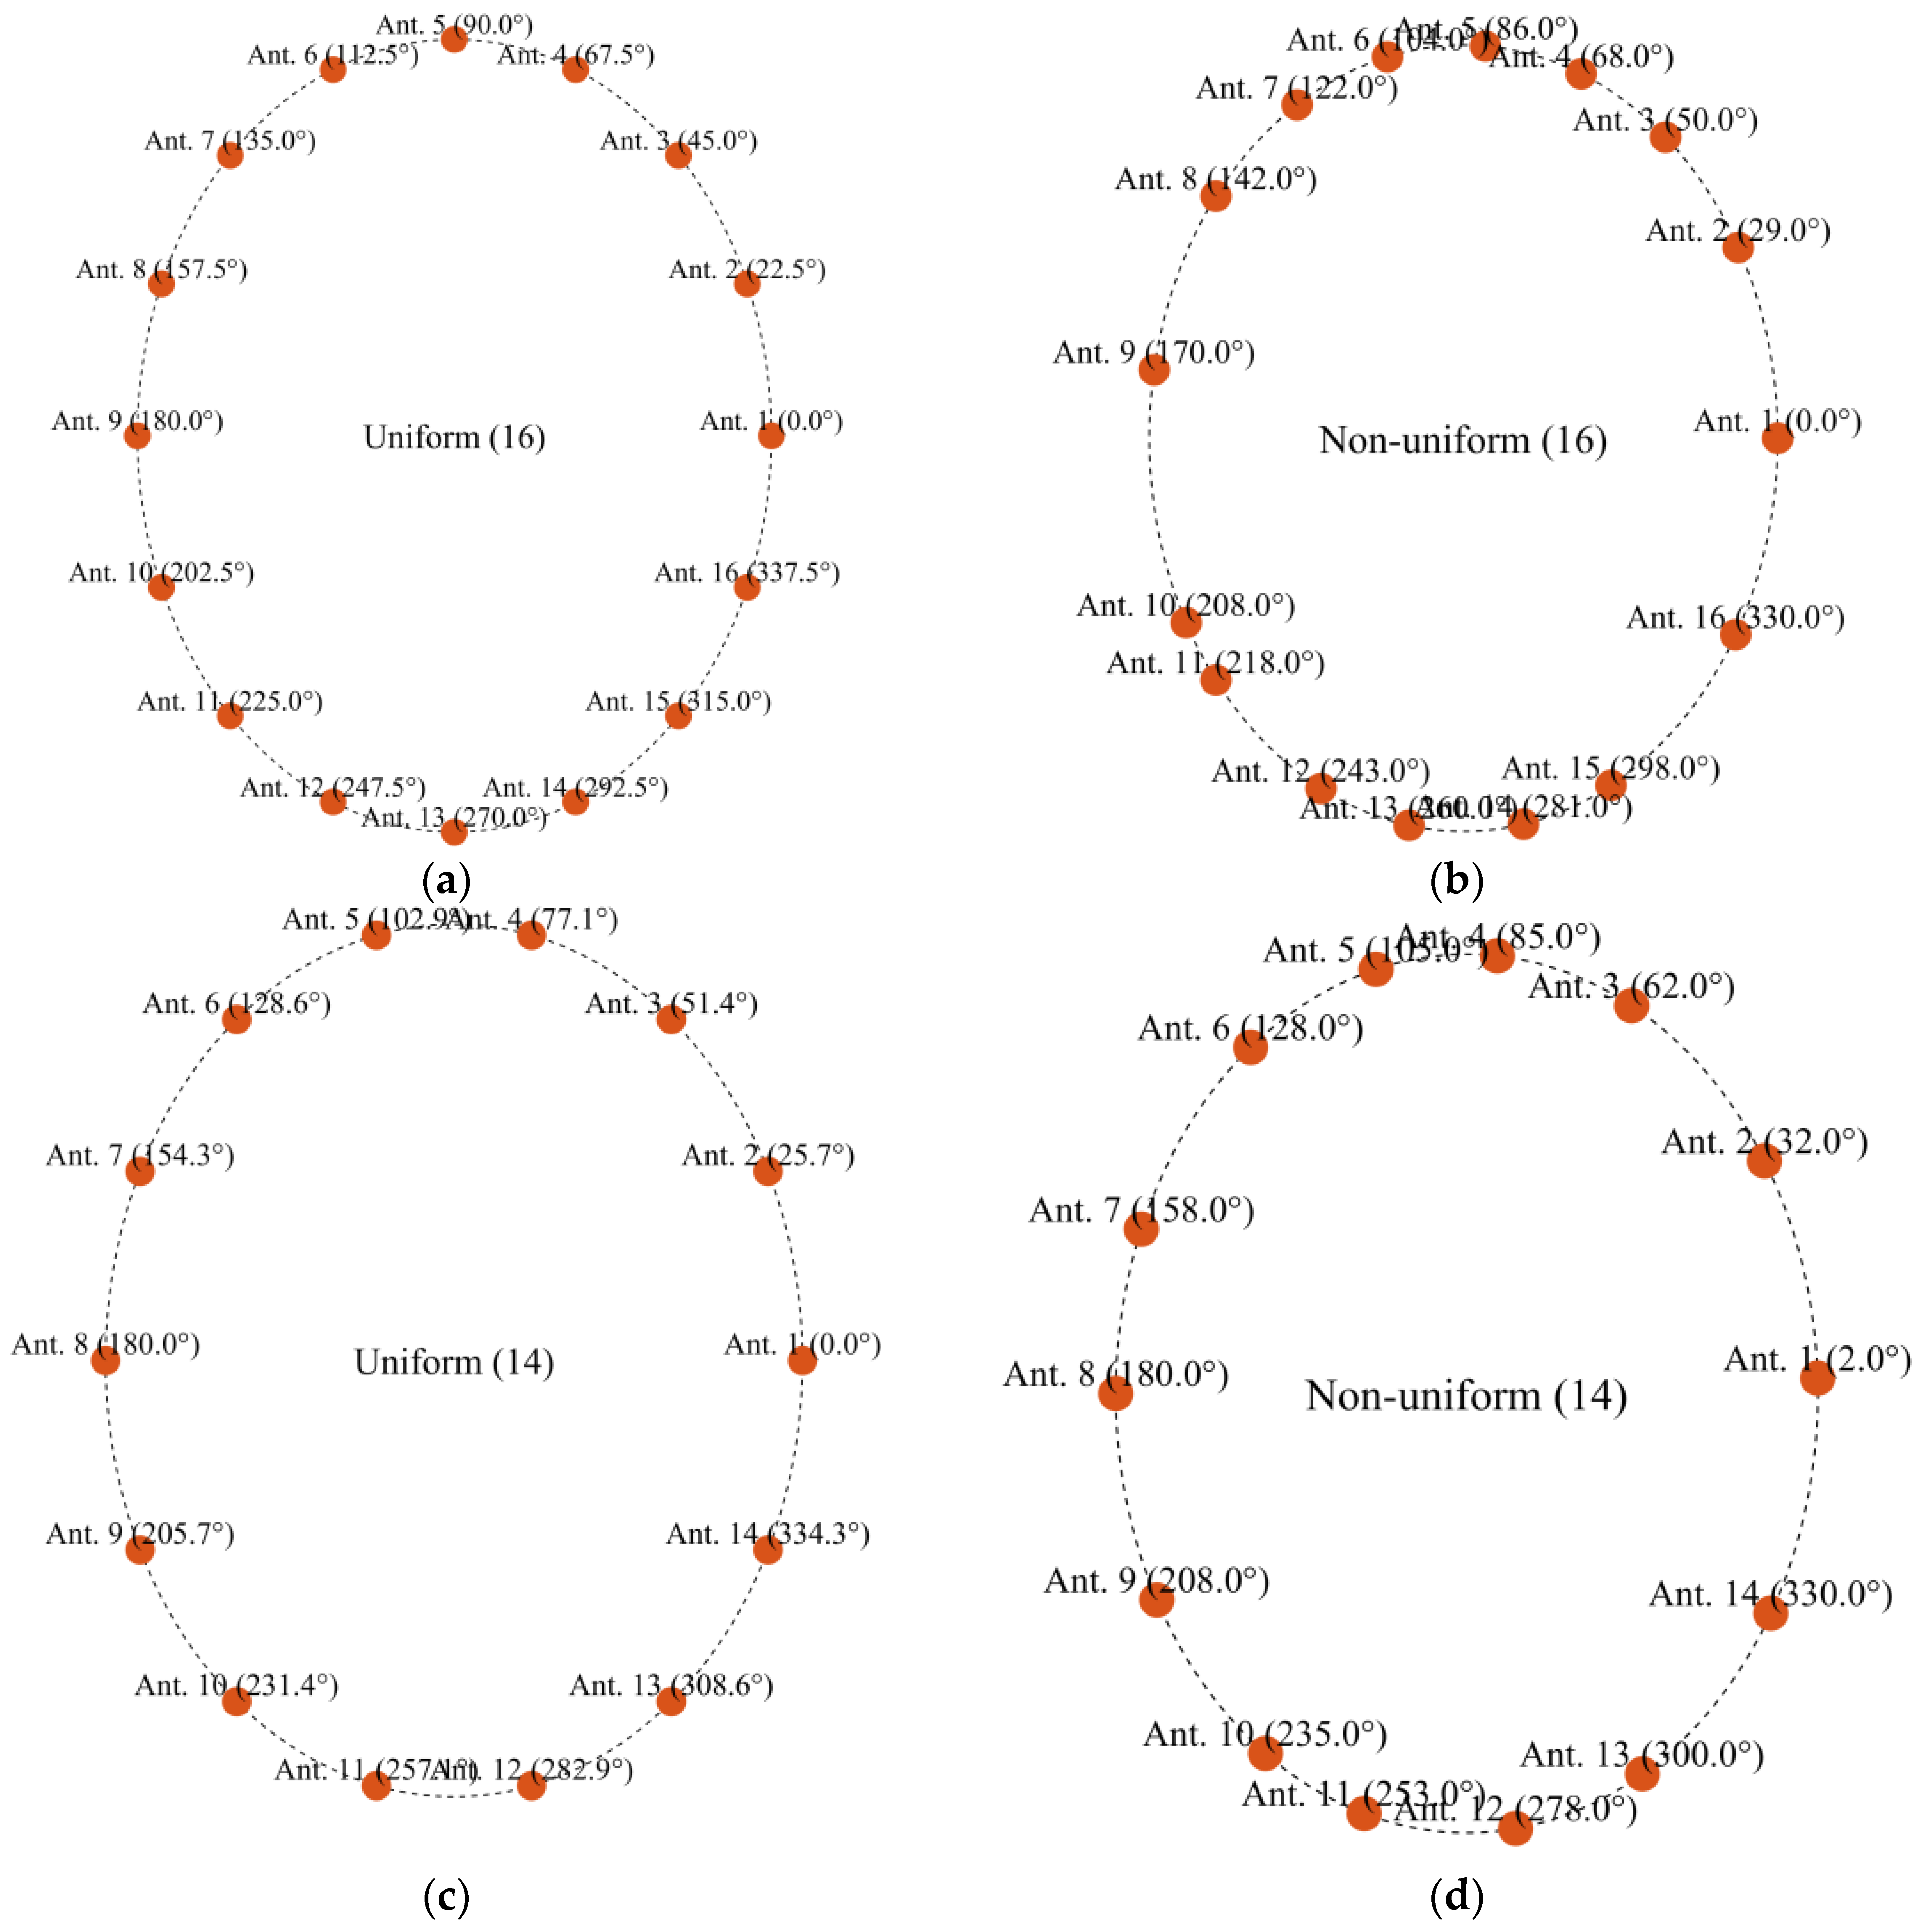
- Initialization: begin with an initial set of uniformly distributed antenna positions around the imaging domain.
- Simulation: Each antenna configuration is simulated using CST. All S-parameters, including both reflection and transmission coefficients, are extracted and transferred to a MATLAB-2024 code for further analysis.
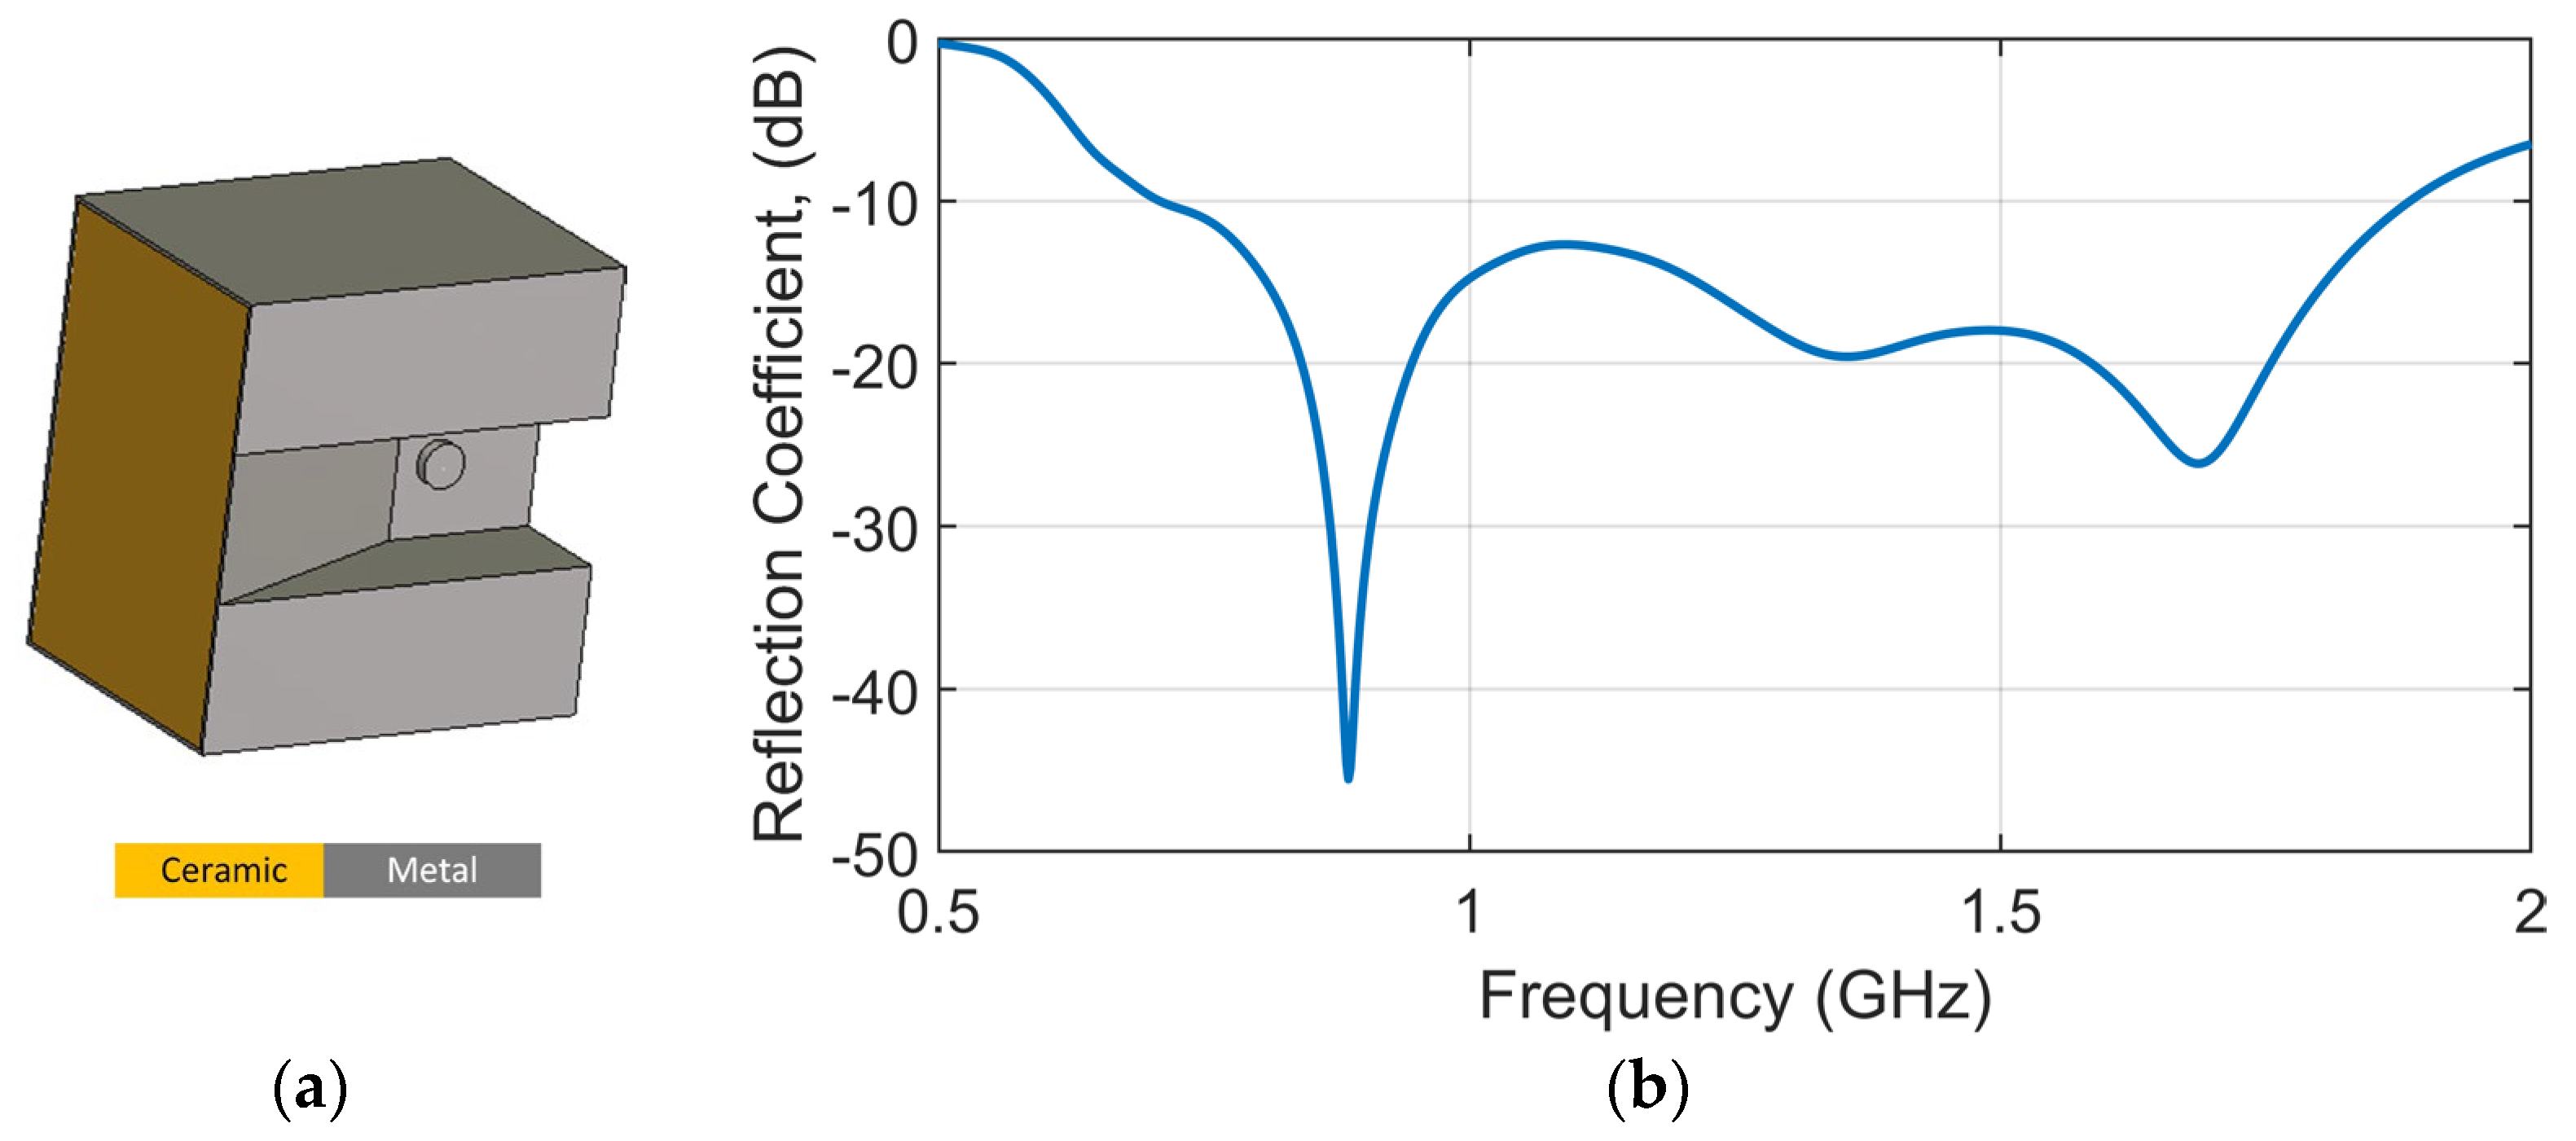
- Evaluation: In MATLAB, the reflection coefficients (S11) are checked to ensure each antenna maintains the required matching bandwidth (e.g., <−10 dB). The transmission coefficients are then evaluated using a custom-defined cost function (Equation (7)), which quantifies the spatial information diversity captured by the configuration based on the minimum MIC.
- Optimization: Based on the output of the cost function, the PSO algorithm updates the antenna positions to suggest an improved configuration. This updated layout is fed back into CST for re-simulation.
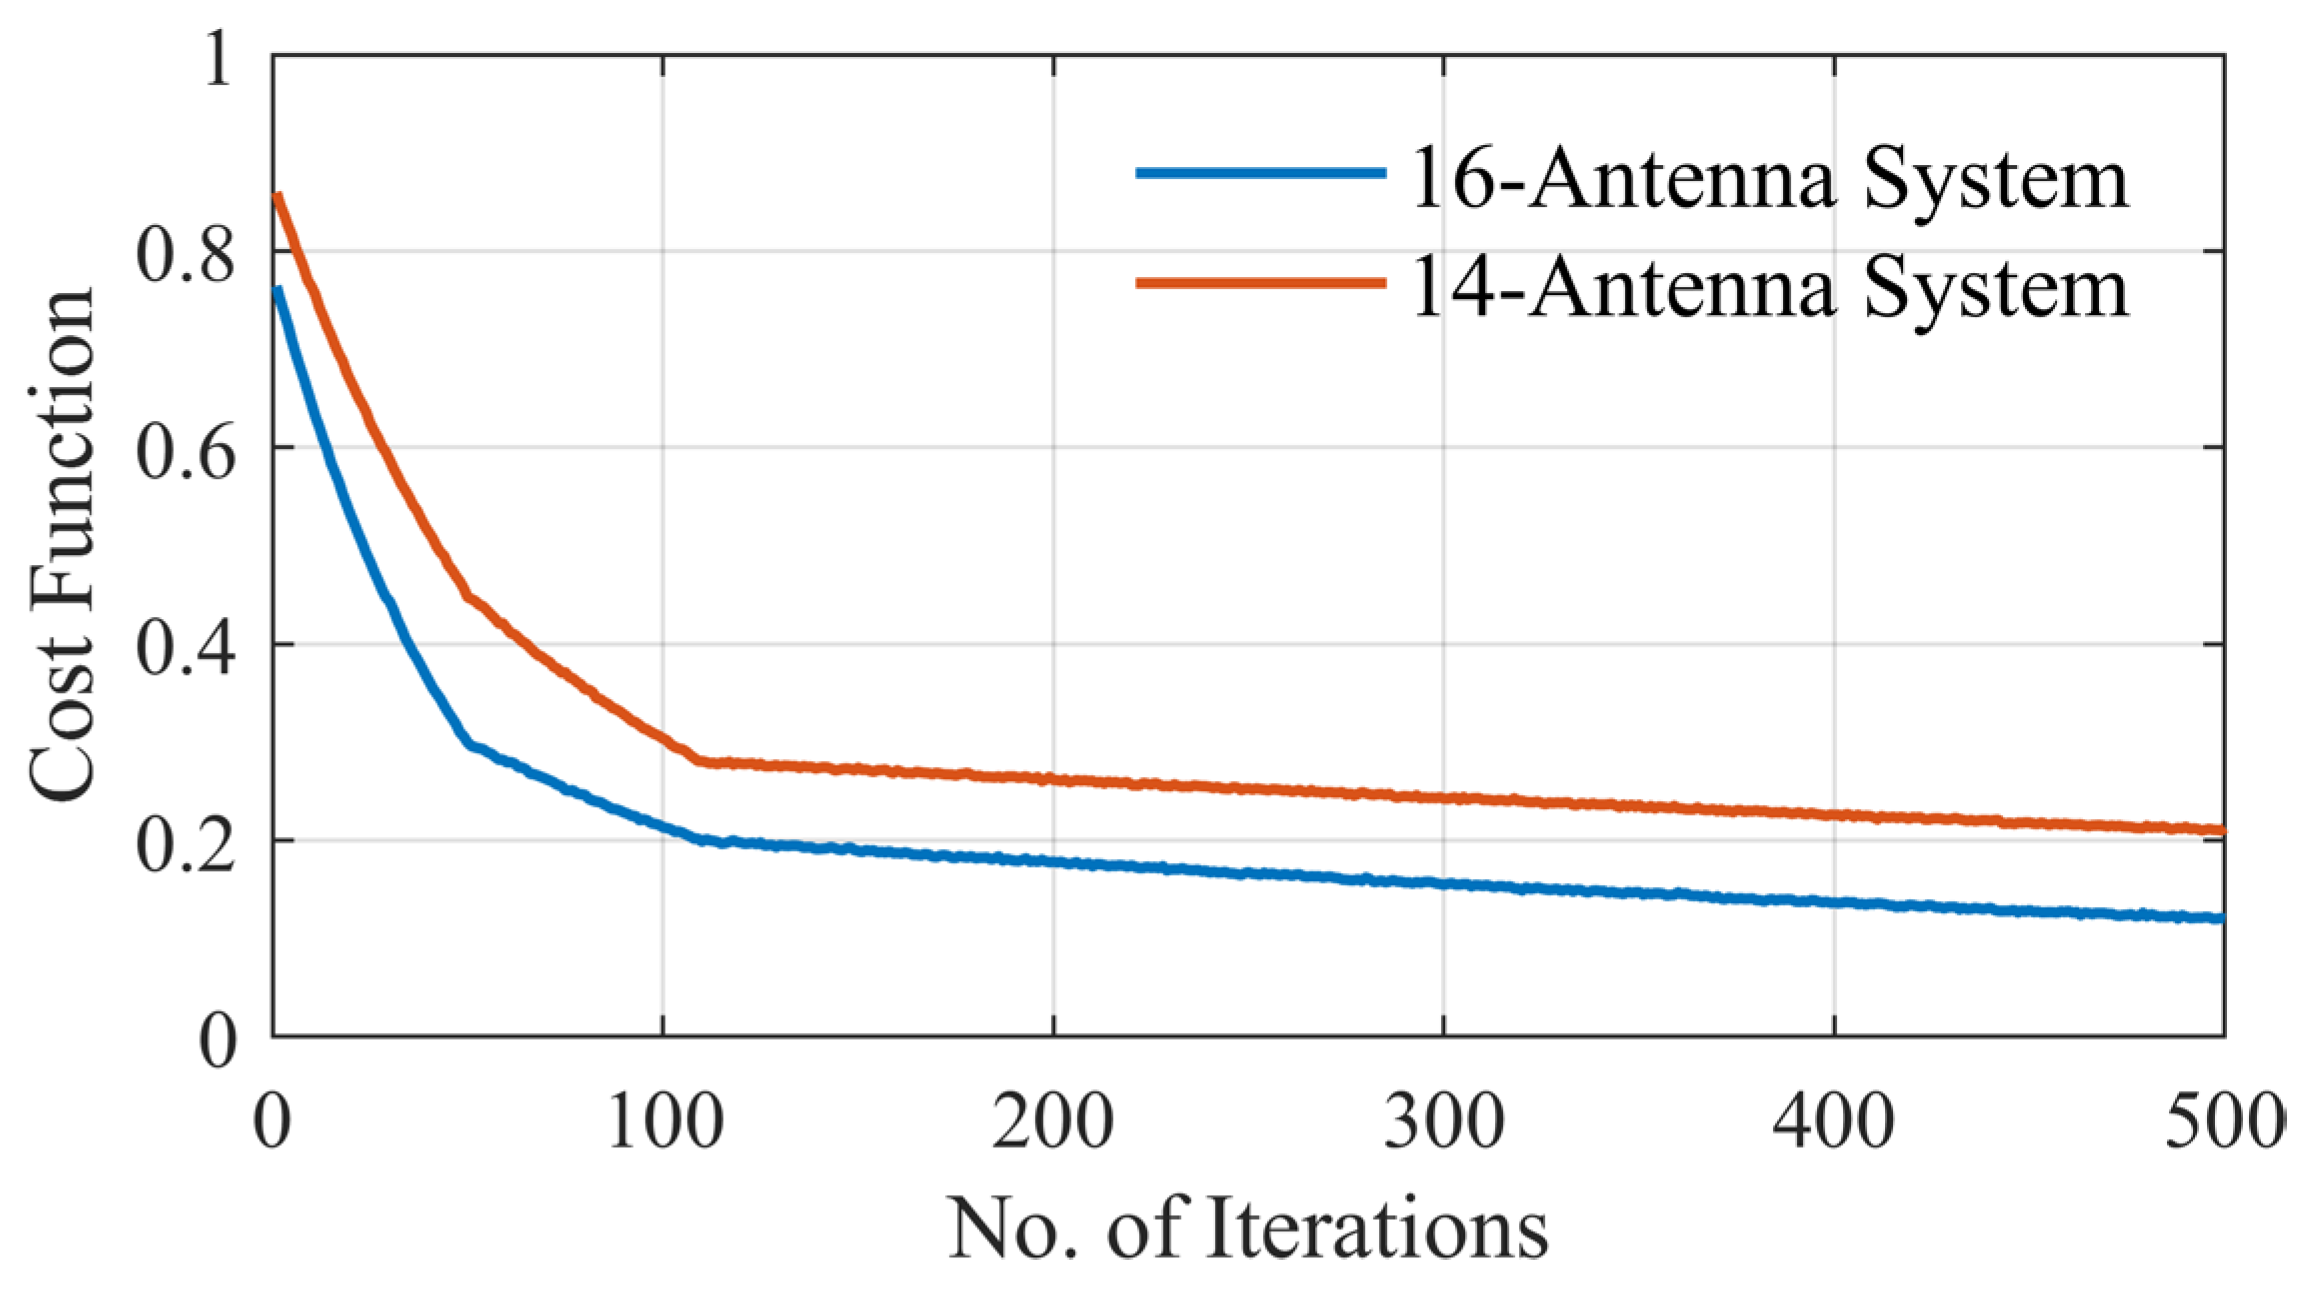
- Iteration: Steps 2 to 4 are repeated until the convergence criteria are met, indicating that a near-optimal or satisfactory antenna arrangement has been achieved.
4. Performance Evaluation and Discussion
5. Conclusions
Author Contributions
Funding
Data Availability Statement
Conflicts of Interest
References
- Haykin, S.; Litva, J.; Shepherd, T.J. Radar Array Processing, 1st ed.; Springer: Berlin/Heidelberg, Germany, 1993. [Google Scholar]
- Rodriguez-Duarte, D.O.; Vasquez, J.A.T.; Scapaticci, R.; Crocco, L.; Vipiana, F. Assessing a Microwave Imaging System for Brain Stroke Monitoring via High Fidelity Numerical Modelling. IEEE J. Electromagn. RF Microw. Med. Biol. 2021, 5, 238–245. [Google Scholar] [CrossRef]
- Friedrich, C.; Bourguignon, S.; Idier, J.; Goussard, Y. Three-Dimensional Microwave Imaging: Fast and Accurate Computations with Block Resolution Algorithms. Sensors 2020, 20, 6282. [Google Scholar] [CrossRef]
- Fedeli, A.; Schenone, V.; Estatico, C.; Randazzo, A. Stroke Detection and Monitoring by Means of a Multifrequency Microwave Inversion Approach. Electronics 2025, 14, 543. [Google Scholar] [CrossRef]
- Sultan, K.; Abbosh, A. Advancing Wearable Electromagnetic Knee Imaging: A Comprehensive Review of Systems, Frameworks, Key Challenges, and Future Directions. IEEE J. Electromagn. RF Microw. Med. Biol. 2023, 7, 468–490. [Google Scholar] [CrossRef]
- Sultan, K. Design and Implementation of Electromagnetic Knee Imaging Systems. Ph.D. Thesis, The University of Queensland, Brisbane, Australia, 2022. [Google Scholar]
- Blanco-Angulo, C.; Martínez-Lozano, A.; Gutiérrez-Mazón, R.; Juan, C.G.; García-Martínez, H.; Arias-Rodríguez, J.; Sabater-Navarro, J.M.; Ávila-Navarro, E. Non-Invasive Microwave-Based Imaging System for Early Detection of Breast Tumours. Biosensors 2022, 12, 752. [Google Scholar] [CrossRef]
- Abbosh, Y.M.; Sultan, K.; Guo, L.; Abbosh, A. Synthetic Microwave Focusing Techniques for Medical Imaging: Fundamentals, Limitations, and Challenges. Biosensors 2024, 14, 498. [Google Scholar] [CrossRef]
- Chen, H.; Luk, K.M. An Antenna Array Based on Radar Operation with High Detection Capability and Implementability for Three-Dimensional Head Imaging. IEEE Trans. Antennas Propag. 2024, 72, 4729–4743. [Google Scholar] [CrossRef]
- Sultan, K.S.; Mohammed, B.; Manoufali, M.; Mahmoud, A.; Mills, P.C.; Abbosh, A. Feasibility of Electromagnetic Knee Imaging Verified on Ex-Vivo Pig Knees. IEEE Trans. on Biomed. Eng. 2022, 69, 1651–1662. [Google Scholar] [CrossRef]
- Wang, X.; Xi, Z.; Ye, K.; Gong, Z.; Chen, Y.; Wang, X. Improvement of Phased Antenna Array Applied in Focused Microwave Breast Hyperthermia. Sensors 2024, 24, 2682. [Google Scholar] [CrossRef]
- Ahdi Rezaeieh, S.A.; Darvazehban, A.; Janani, A.S.; Abbosh, A.M. Electromagnetic Torso Scanning: A Review of Devices, Algorithms, and Systems. Biosensors 2021, 11, 135. [Google Scholar] [CrossRef]
- Darvazehban, A.; Rezaeieh, S.A.; Abbosh, A.M. Programmable Metasurface Antenna for Electromagnetic Torso Scanning. IEEE Access 2020, 8, 166801–166812. [Google Scholar] [CrossRef]
- Sultan, K.S.; Abbosh, A.M. Wearable Dual Polarized Electromagnetic Knee Imaging System. IEEE Trans. Biomed. Circuits Syst. 2022, 16, 296–311. [Google Scholar] [CrossRef]
- Mousavi, S.M.H.; Sultan, K.; Guo, L.; Janani, A.S.; Bialkowski, K.; Abbosh, A.M. Dual-Sense Circularly Polarized Substrate Integrated Waveguide Antenna for Deep Torso Imaging. IEEE Trans. Antennas Propag. 2025, 73, 188–200. [Google Scholar] [CrossRef]
- Darvazehban, A.; Rezaeieh, S.A.; Zamani, A.; Abbosh, A.M. Pattern reconfigurable metasurface antenna for electromagnetic torso imaging. IEEE Trans. Antennas Propag. 2019, 67, 5453–5462. [Google Scholar] [CrossRef]
- Origlia, C.; Rodriguez-Duarte, D.O.; Tobon Vasquez, J.A.; Bolomey, J.-C.; Vipiana, F. Review of Microwave Near-Field Sensing and Imaging Devices in Medical Applications. Sensors 2024, 24, 4515. [Google Scholar] [CrossRef]
- Awan, D.; Bashir, S.; Khan, S.; Al-Bawri, S.S.; Dalarsson, M. UWB Antenna with Enhanced Directivity for Applications in Microwave Medical Imaging. Sensors 2024, 24, 1315. [Google Scholar] [CrossRef]
- Bucci, O.M.; Crocco, L.; Scapaticci, R.; Bellizzi, G. On the Design of Phased Arrays for Medical Applications. Proc. IEEE 2016, 104, 633–648. [Google Scholar] [CrossRef]
- Guo, L.; Abbosh, A.M. Microwave Stepped Frequency Head Imaging Using Compressive Sensing with Limited Number of Frequency Steps. IEEE Antennas Wirel. Propag. Lett. 2015, 14, 1133–1136. [Google Scholar] [CrossRef]
- Zamani, A.; Abbosh, A.M.; Crozier, S. Multistatic Biomedical Microwave Imaging Using Spatial Interpolator for Extended Virtual Antenna Array. IEEE Trans. Antennas Propag. 2017, 65, 1121–1130. [Google Scholar] [CrossRef]
- Pato, M.; Eleutério, R.; Conceição, R.C.; Godinho, D.M. Evaluating the Performance of Algorithms in Axillary Microwave Imaging towards Improved Breast Cancer Staging. Sensors 2023, 23, 1496. [Google Scholar] [CrossRef]
- Fear, E.C.; Li, X.; Hagness, S.C.; Stuchly, M.A. Confocal microwave imaging for breast cancer detection localization of tumors in three dimensions. IEEE Trans. Biomed. Eng. 2002, 49, 812–822. [Google Scholar] [CrossRef] [PubMed]
- Elahi, M.A. Confocal Microwave Imaging and Artifact Removal Algorithms for the Early Detection of Breast Cancer. Ph.D. Thesis, University of Galway, Galway, Ireland, 2018. [Google Scholar]
- Guo, L.; Abbosh, A.M. Optimization-Based Confocal Microwave Imaging in Medical Applications. IEEE Trans. Antennas Propag. 2015, 63, 3531–3539. [Google Scholar] [CrossRef]
- Reimer, T.; Pistorius, S. Review and Analysis of Tumour Detection and Image Quality Analysis in Experimental Breast Microwave Sensing. Sensors 2023, 23, 5123. [Google Scholar] [CrossRef] [PubMed]
- Bucci, O.M.; Isernia, T. Electromagnetic inverse scattering: Retrievable information and measurement strategies. Radio Sci. 1997, 32, 2123–2137. [Google Scholar] [CrossRef]
- Abbosh, A.; Bialkowski, K.; Guo, L.; Al-Saffar, A.; Zamani, A.; Trakic, A.; Brankovic, A.; Bialkowski, A.; Zhu, G.; Cook, D.; et al. Clinical electromagnetic brain scanner. Sci. Rep. 2024, 14, 5760. [Google Scholar] [CrossRef]
- IT’IS. Human Models. Available online: https://itis.swiss/virtual-population/virtual-population/overview/ (accessed on 20 October 2024).
- Kennedy, J.; Eberhart, R. Particle swarm optimization. In Proceedings of the ICNN’95—International Conference on Neural Networks, Perth, Australia, 27 November–1 December 1995; Volume 4, pp. 1942–1948. [Google Scholar] [CrossRef]
- Feng, Y.; Teng, G.; Wang, A.; Yao, Y. Chaotic inertia weight in particle swarm optimization. Proceedings of Second the International Conference on Innovative Computing, Informatio and Control (ICICIC 2007), Kumamoto, Japan, 5–7 September 2007; p. 475. [Google Scholar]
- Xie, Y.; Guo, B.; Xu, L.; Li, J.; Stoica, P. Multistatic adaptive microwave imaging for early breast cancer detection. IEEE Trans. Biomed. Eng. 2006, 53, 1647–1657. [Google Scholar] [CrossRef]
- Sultan, K.S.; Abbosh, A. Handheld Electromagnetic Scanner for Deep Vein Thrombosis Detection and Monitoring. IEEE Trans. Antennas Propag. 2024, 72, 3210–3224. [Google Scholar] [CrossRef]


| Antenna 3 @ Scenario 1 | MIC (2,3) | Antenna 3 @ Scenario 2 | MIC (2,3) |
|---|---|---|---|
| 0.840 | 0.112 | ||
| 0.713 | 0.231 | ||
| 0.709 | 0.291 | ||
| 0.512 | 0.395 | ||
| 0.387 | 0.413 | ||
| 0.781 | 0.231 | ||
| 0.660 | 0.201 | ||
| 0.321 | 0.321 |
| Uniform (16) | Non-Uniform (16) | Uniform (14) | Non-Uniform (14) | |
|---|---|---|---|---|
| 1 | ||||
| 2 | ||||
| 3 | ||||
| 4 | ||||
| 5 | ||||
| 6 | ||||
| 7 | ||||
| 8 | ||||
| 9 | ||||
| 10 | ||||
| 11 | ||||
| 12 | ||||
| 13 | ||||
| 14 | ||||
| 15 | ||||
| 16 |
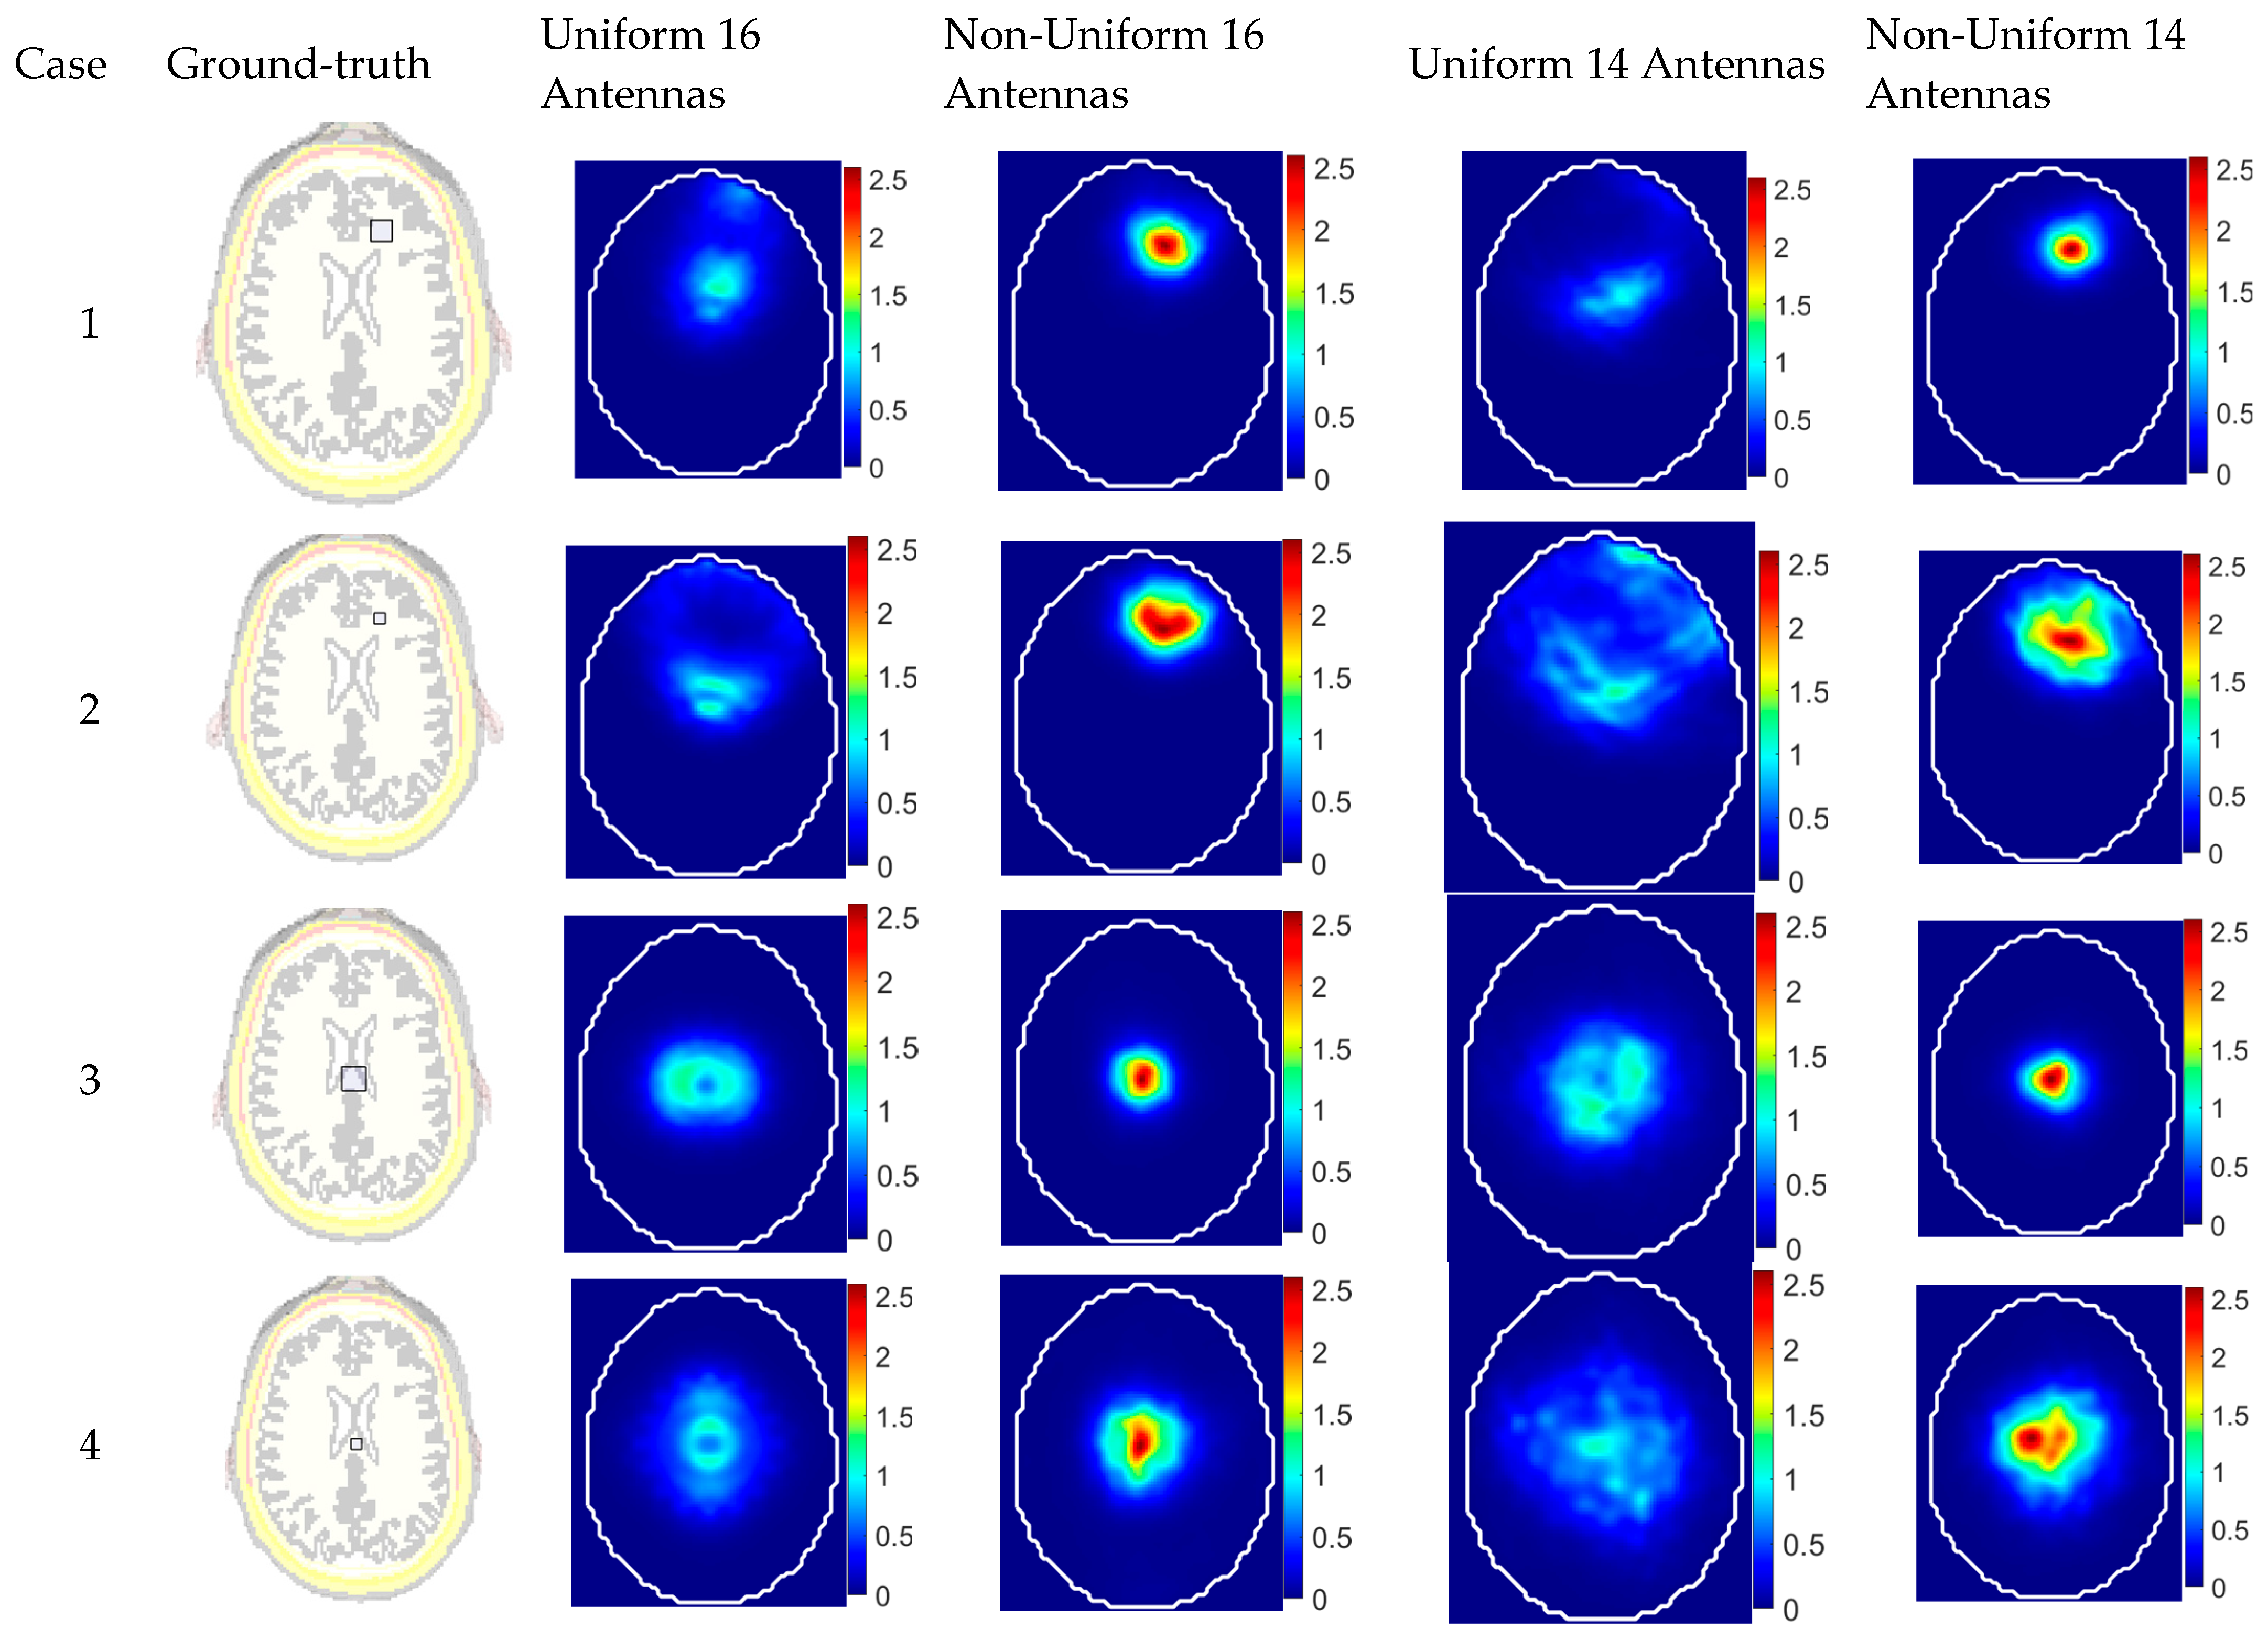
| Case | Target Position (x,y)/Target Size w × l × h (mm) | Uniform 16 Antennas | Non-Uniform 16 Antennas | Uniform 14 Antennas | Non-Uniform 14 Antennas | ||||
|---|---|---|---|---|---|---|---|---|---|
| PE | SCR | PE | SCR | PE | SCR | PE | SCR | ||
| 1 | ) | 28.6 mm | 6.18 dB | 0 mm | 6.45 dB | 34.05 mm | 2.33 dB | 2 mm | 5.68 dB |
| 2 | ) | 48.1 mm | 0.51 dB | 2 mm | 4.56 dB | 43.17 mm | 0.317 dB | 4 mm | 3.71 dB |
| 3 | ) | 15 mm | 1.81 dB | 1 mm | 6.78 dB | 5.385 mm | 1.515 dB | 1 mm | 5.41 dB |
| 4 | ) | 12.1 mm | 4.14 dB | 1 mm | 4.86 dB | 16.76 mm | 0.827 dB | 8.7 mm | 2.86 dB |
Disclaimer/Publisher’s Note: The statements, opinions and data contained in all publications are solely those of the individual author(s) and contributor(s) and not of MDPI and/or the editor(s). MDPI and/or the editor(s) disclaim responsibility for any injury to people or property resulting from any ideas, methods, instructions or products referred to in the content. |
© 2025 by the authors. Licensee MDPI, Basel, Switzerland. This article is an open access article distributed under the terms and conditions of the Creative Commons Attribution (CC BY) license (https://creativecommons.org/licenses/by/4.0/).
Share and Cite
Abbosh, Y.M.; Sultan, K.; Guo, L.; Abbosh, A. Non-Uniform Antenna Array for Enhanced Medical Microwave Imaging. Sensors 2025, 25, 3174. https://doi.org/10.3390/s25103174
Abbosh YM, Sultan K, Guo L, Abbosh A. Non-Uniform Antenna Array for Enhanced Medical Microwave Imaging. Sensors. 2025; 25(10):3174. https://doi.org/10.3390/s25103174
Chicago/Turabian StyleAbbosh, Younis M., Kamel Sultan, Lei Guo, and Amin Abbosh. 2025. "Non-Uniform Antenna Array for Enhanced Medical Microwave Imaging" Sensors 25, no. 10: 3174. https://doi.org/10.3390/s25103174
APA StyleAbbosh, Y. M., Sultan, K., Guo, L., & Abbosh, A. (2025). Non-Uniform Antenna Array for Enhanced Medical Microwave Imaging. Sensors, 25(10), 3174. https://doi.org/10.3390/s25103174