1. Introduction
Cargo transportation by train in mining operations is the primary logistical activity in this category. During this activity, several defects can occur, ranging from loose parts to problems arising in the carts [
1]. Even if a maintenance system is in place to assess breakdowns or equipment failures, a train derailment can lead to astronomical costs for mining companies [
2], resulting in millions of dollars in expenses.
Concerning maintenance management, individuals typically bear the responsibility for assessing the feasibility of using specific parts on wagons for new trips or determining whether a wagon needs to be taken out of service for maintenance. However, relying on human involvement in this process poses risks, both for the maintenance itself and for the individuals conducting the assessments. To mitigate these risks, an increasing number of companies are adopting computer vision solutions to inspect certain situations and parts [
3]. Despite its widespread usage, automatic inspection through image analysis is not without challenges. The identification procedure often involves several stages, including image acquisition, preprocessing, feature extraction, and, finally, classification.
The feature extraction phase in this type of system faces the challenge of specialist approval, since prior knowledge of what constitutes a defect is necessary. In this paper we show examples of a crack in a wagon, and examples of a part of a wagon with no issue. To eliminate the reliance on human judgment in the process, a classification system for structural problems on railway cars can incorporate machine learning algorithms. This approach removes the decision-making burden from the maintainer and, with their assistance, focuses solely on creating a database to evaluate the objective of the task. The use of convolutional neural networks (CNN) and their variants has proven to be a widely adopted technique for image classification [
4,
5].
One challenge in machine learning, including with CNNs, is the ability to learn models from unbalanced datasets, which often occurs during the acquisition of images in real-world scenarios. For instance, the shear pad (hereafter referred to as PAD) is one of the crucial components of a wagon that requires inspection [
6]. However, large organizations possess a substantial fleet of wagons, comprising various wagon models. Furthermore, not all wagons are equipped with a PAD, and only a very small percentage of them exhibit defects. In essence, an automatic wagon inspection system must handle a multi-class dataset with a significantly high imbalance rate.
Another challenge in working with machine learning is the creation of a reliable database for conducting nonconformity checks [
7]. These databases are generated from real information, such as images. For instance, the superstructure is of significant importance when inspecting wagons. However, large companies often have a vast number of wagons, and they operate at least two different types of wagons on a daily basis for transporting ores. This paper presents results solely for one type of wagon.
Works utilizing variations of U-Net networks have found applications in various fields. While this method initially began with medical applications years ago [
8], its versatility has expanded to other areas. One such area is transportation, where these adaptations can be applied in real-world scenarios, as well as simulations [
9,
10,
11].
In this context, this work aimed to utilize machine learning techniques, such as multilayer perceptron (MLP), CNN, Mask R-CNN, U-Net, and an ensemble of these different methods, to accurately classify the condition of wagon components through images. Specifically, we employed a preprocessed database to aid our classifications and evaluated the performance of these algorithms using two different databases.
The objectives of this work aimed to contribute to two main points: (i) the development of a workflow proposal for identifying non-conformities in train cars, and (ii) evaluation of the method proposed in the previous objective, with different machine learning algorithms on two different types of databases: one unbalanced and one balanced. We anticipated that by addressing these two questions, we could develop a new method for preparing images of train cars to identify defective parts, as well as proposing a way to classify cracks using different methods.
The remainder of this paper is organized as follows: the next section presents related works associated with our method, followed by a brief description of the real-world problem with which our method was tested in the subsequent section.
Section 4 describes the methodology used for data collection, as well as the methodology for classification algorithms, which we used to evaluate our databases.
Section 5 presents our experimental results, while
Section 6 provides a comparison of the results obtained using other methodologies and classification algorithms. Finally, the last section concludes the paper by presenting our plans for future work.
2. Related Work
This section describes relevant works from the literature, such as the work of Gonçalves et al. [
12], which explored the use of HOG descriptors for identifying train parts and creating a database consisting of three classes of PADs. In their study, images were extracted using descriptors combined with SVM. The objective was to determine the optimal distance within a large-scale image for locating the PADs. To achieve this, the classifier identified the best bounding boxes in three intervals, allowing for the removal of the PADs from the image.
The work presented by [
6] focused on utilizing a discrete Fourier transform (DFT) in the spatial representation of railway car components, to develop an automatic detector for defective parts using convolutional neural network (CNN) classification. Their findings demonstrated the classification of PADs using metrics such as accuracy, precision, recall, and F1-score, as well as an accuracy boxplot. The results indicated that the use of DFT improved the CNN classification accuracy by 1.04%. This work serves as a practical application based on the database created in the study by [
12].
An example of work in the transportation field utilizing U-Net was proposed by [
11]. In their study, the authors aimed to identify the boundaries of car circulation lanes through image analysis. They employed the U-Net algorithm for lane segmentation. The authors introduced group-by-group convolution and depth-wise separable convolution into the backbone network, which simplified the branches of the network. They also incorporated convolution into the enhanced path network with a multi-level skip connection structure, to preserve coarse-grained semantic feature information. The full-scale skip connection fusion mechanism of the decoder was retained, enabling the capture of both fine-grained and coarse-grained semantic features at full scale. By introducing skip connections between the decoder and the encoder, the network enhances lane extraction, without increasing the receptive field size. The network’s ability to extract line features and contextual information improves the accuracy of lane line detection. Experimental results demonstrated that the improved neural network achieved excellent performance in detecting complex lane lines, effectively enhancing both the accuracy and time sensitivity of lane line detection.
Figure 1 showcases the image segmentation results achieved using U-Net.
The work of [
13] showed the use of hyperspectral images for target selection, using only one spectrum. In the paper, they detailed the creation of a background dictionary that consisted of identifying only one atom target. The proposed method was compared with other techniques shown in the article and had the best performance. The work of [
14] used labels to identify and recreate regions in multi-spectral images and classify them according to their characteristics, according to the model proposed in the article, which had relevant results for a part of the terrain images using three different databases from different sensors.
The work of [
15] conducted a study on the 2D modeling of CNNs to identify micro-cracks in train gears. In the study, the authors indicated that the trained model detected these cracks with 92% accuracy. In this context, it is essential to mention that, along with the work of [
15], there are correlations with other wagon components, such as checks for various gear types (utilizing images), other components (wheels and brakes), and even other forms of analysis.
The paper by [
16] focused on inspecting fatigue in a wheel axle. The study identified fractures caused by plane deformation, the direct consequence of inadequate maintenance of the car parts. Two types of tests were conducted to determine the occurrence of cracks and assess the operational condition of the wagons. However, the results consistently concluded that replacing the parts was necessary to prevent accidents. The primary tests performed in this study were tension tests, involving the application of longitudinal and transverse forces to the wheel axles. Additionally, chemical testing using optical emission spectroscopy (OES) was conducted on these axles [
17], similarly to that of [
16], focusing on studying fatigue in wagon axles. In addition to mechanical calculations, their work included thermal testing of the structures. In a simulated environment, both situations were tested, revealing that the thermal indications of the braking points of the wheels had the highest incidence of problems. Furthermore, the vertical angular force on the wheels emerged as the most severe mechanical issue observed in their tests.
The work by [
18] addressed the identification of problems in their organization, to improve train brake maintenance management. The study took into account the optimal timing for brake replacement, considering the cost reduction for the company. It also determined the storage of brakes and their availability for scheduled exchanges. The authors concluded that significant savings of 25% could be achieved if the brake depot was readily available for immediate exchanges in train cars.
Peng and colleagues presented a method that focuses on addressing cracks resulting from brake wear on trains. The authors proposed a three-step analysis approach to examine these cracks. Firstly, a finite element model of the wagon wheel is utilized for all braking applications. Secondly, the stress intensity factor of the thermal cracks is calculated. Lastly, the authors employed the generalized Frost–Dugdale approach to model crack growth. Through simulations, the authors observed that vibratory forces were the primary cause of cracking problems during stages 2 and 3 of the testing process [
19].
3. Statement of the Problem
In many railway companies, wagon maintenance is carried out by employees, who are tasked with evaluating several components within a given time frame. These components include the compression bar, triangle, bearing box adapter, and coupling support plate. Since wagons are crucial assets in railway operations, it is essential to ensure accurate and optimized maintenance practices. However, visual inspections conducted by humans pose risks to employees, as they often need to work in hazardous environments, such as being in close proximity to moving trains, to inspect these items [
20].
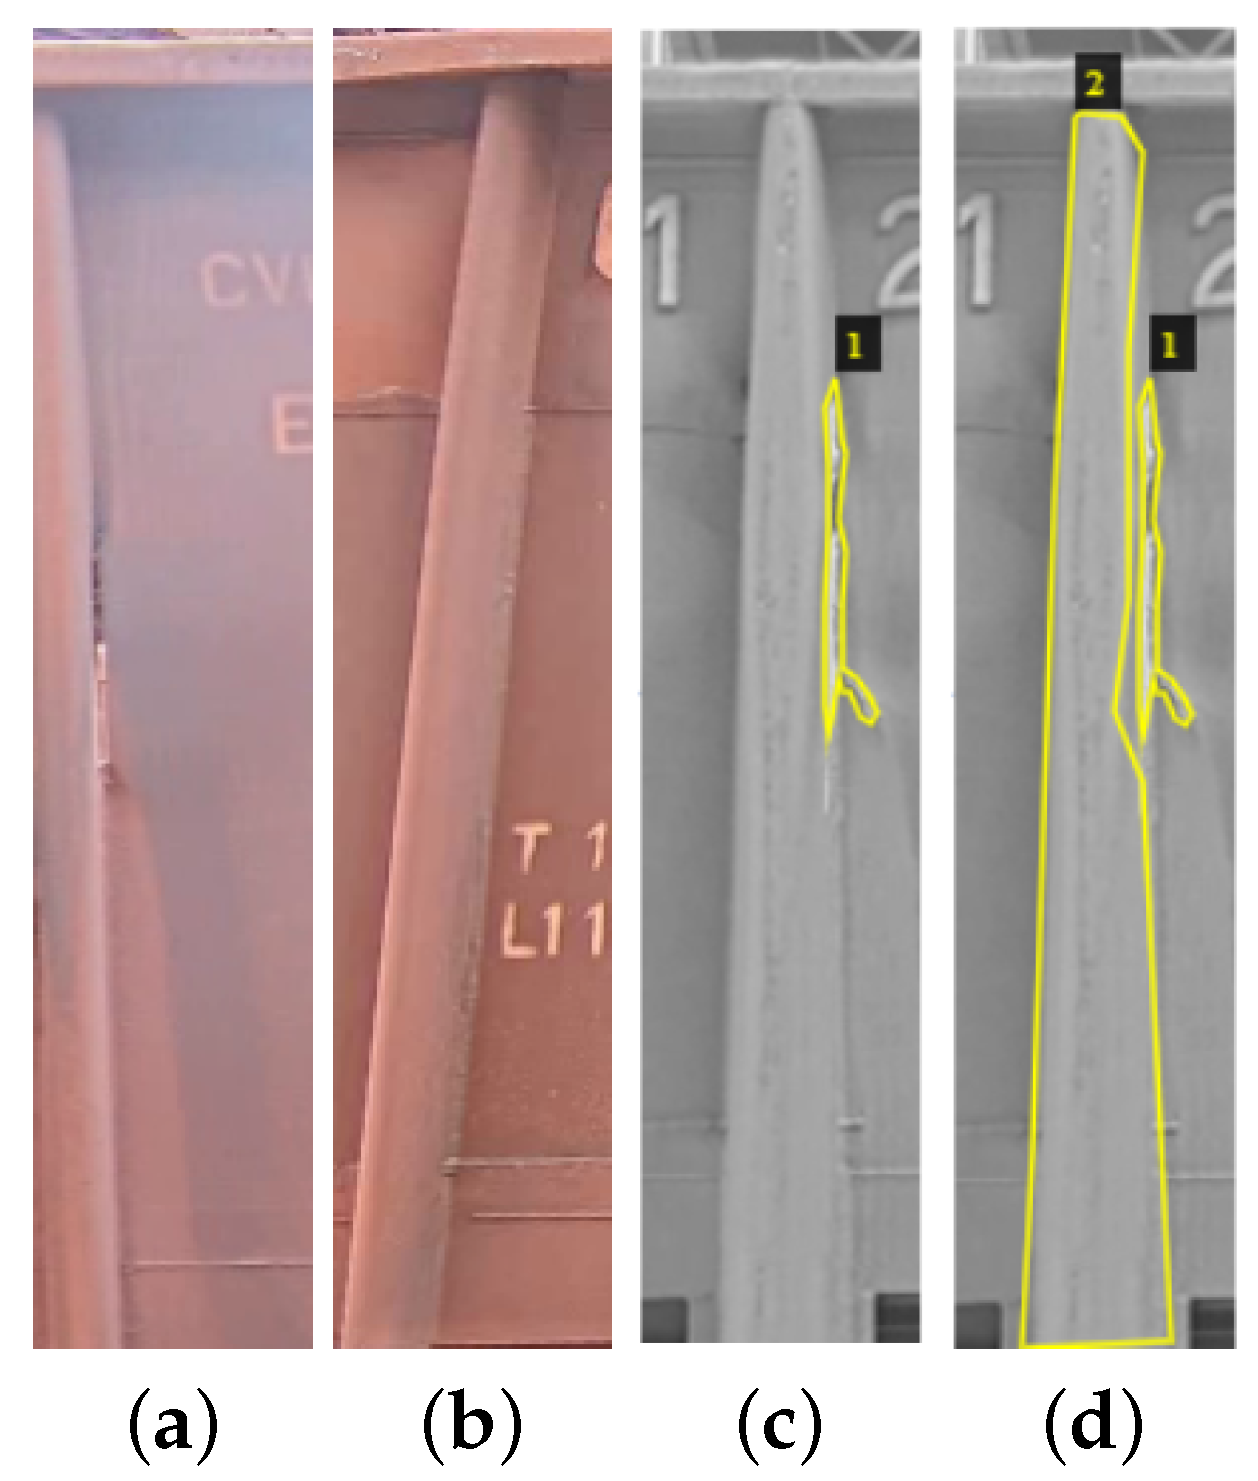
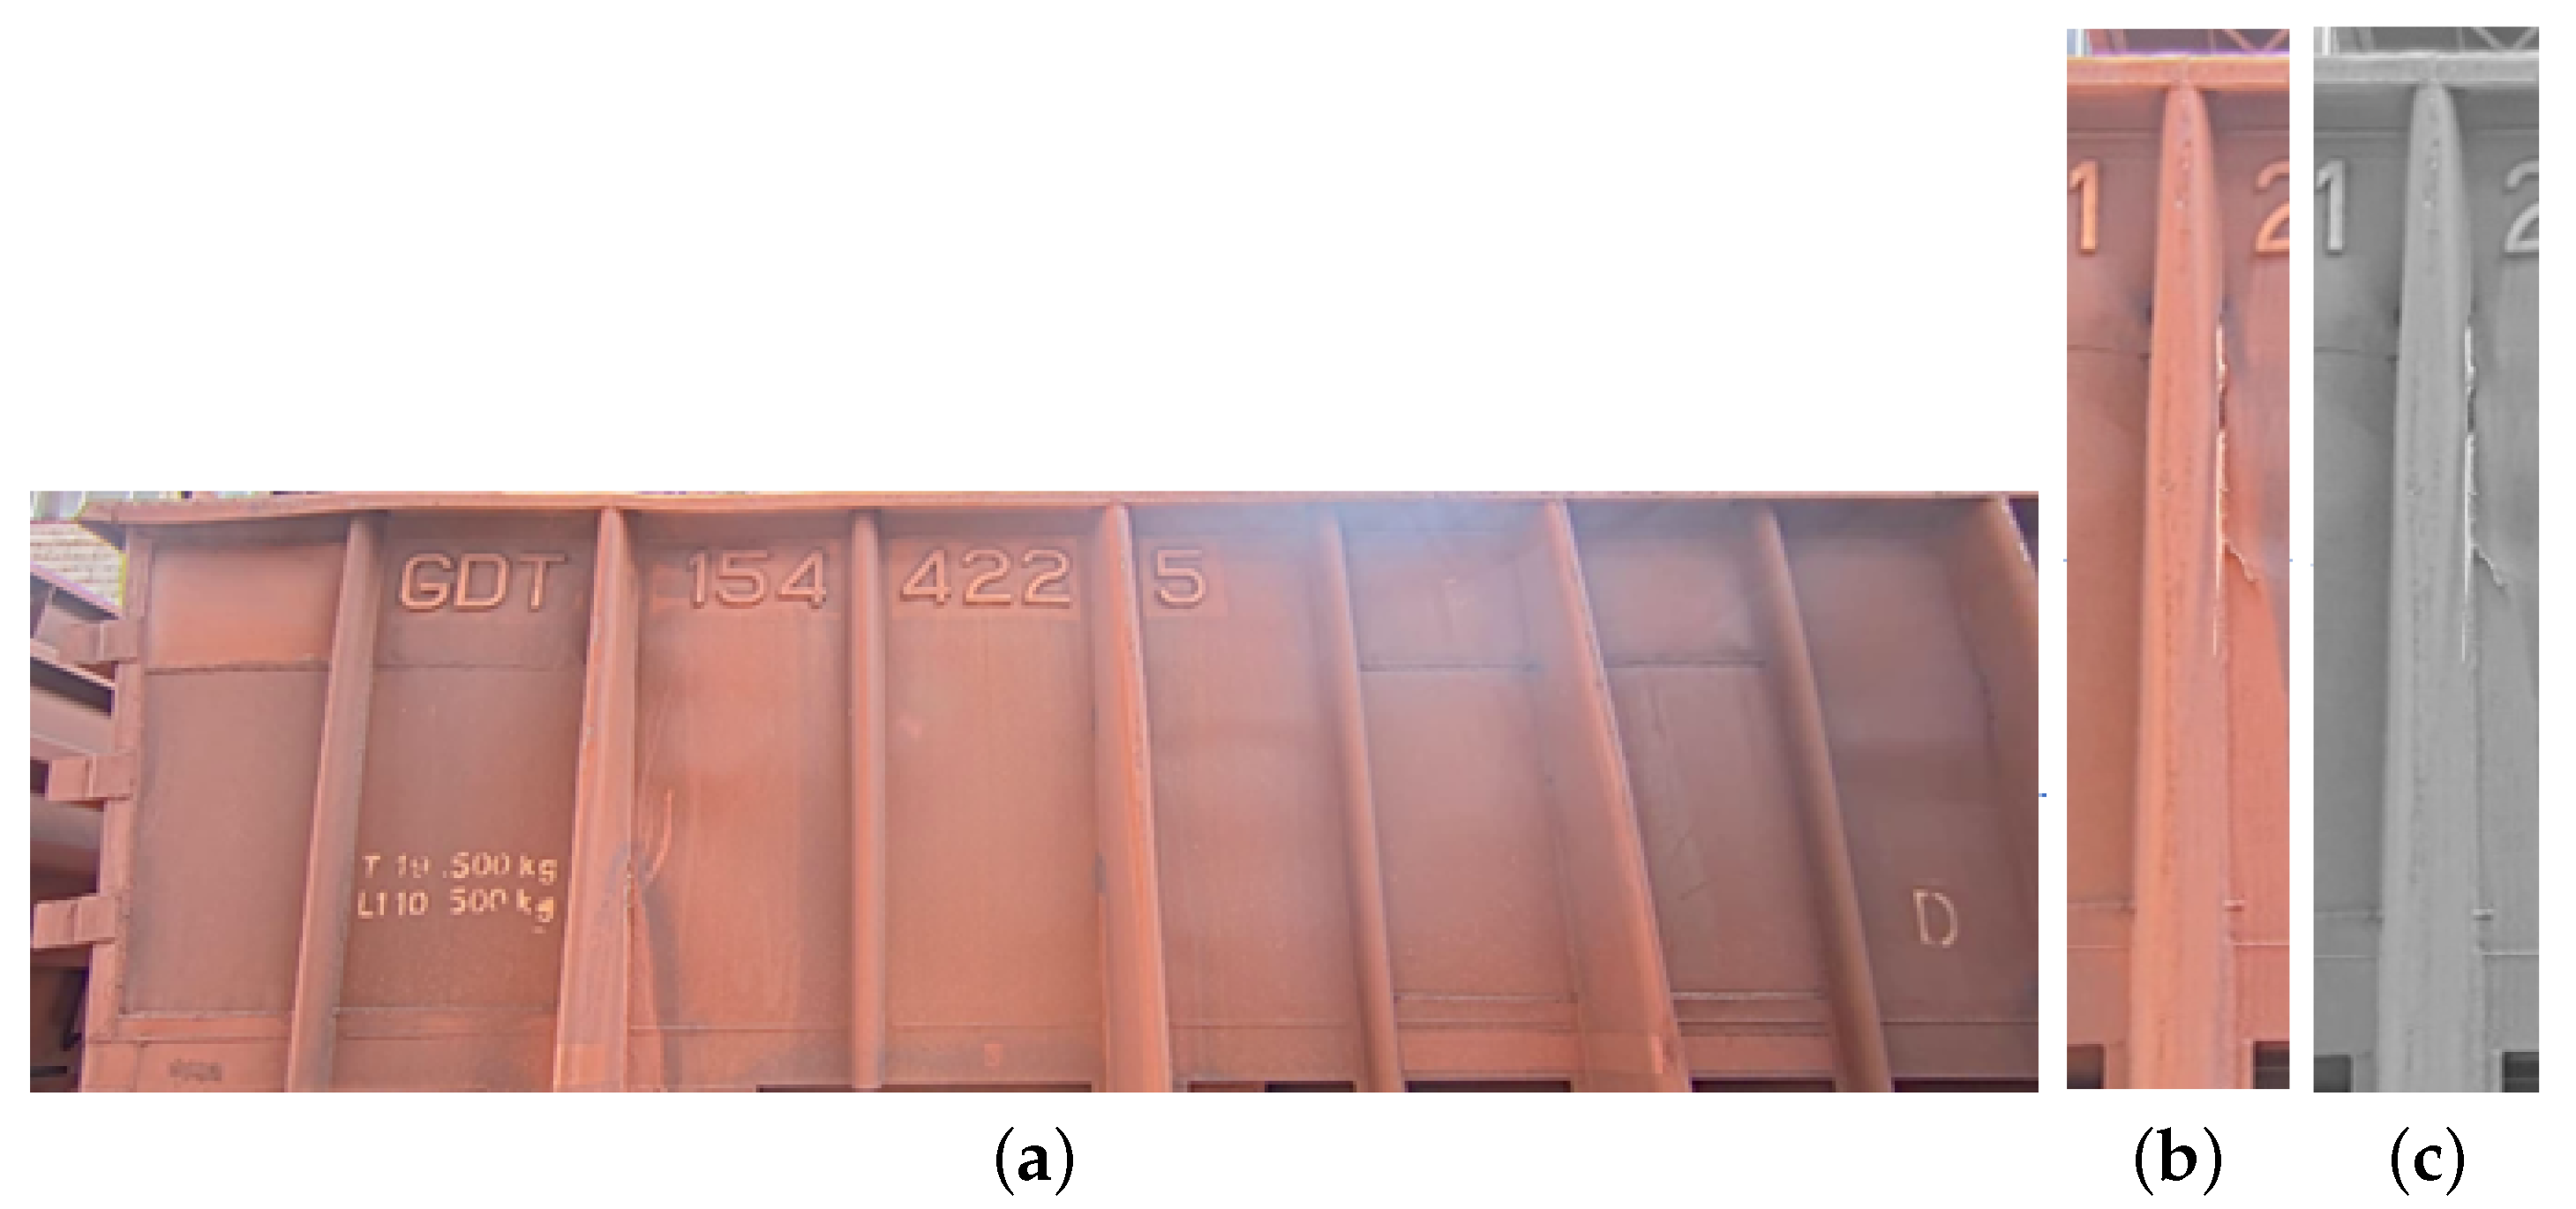
To be more specific, our study focuses on a specific wagon component known as the superstructure. This metal component is susceptible to cracking due to the constant insertion and removal of ore. In this work, we specifically consider the left side of the superstructure, with a particular focus on the joints, which we refer to as pillars.
This study is part of a larger project aimed at developing an automatic inspection system for wagon components for the one of the largest mining company in the world, who operate approximately 2000 km of railroad tracks in Brazil. Rail transportation plays a crucial role in any mining operation, and the company operates one of the largest trains in the world, consisting of four locomotives and 330 wagons. The company transports iron ore through its railway network 24 h a day, 7 days a week.
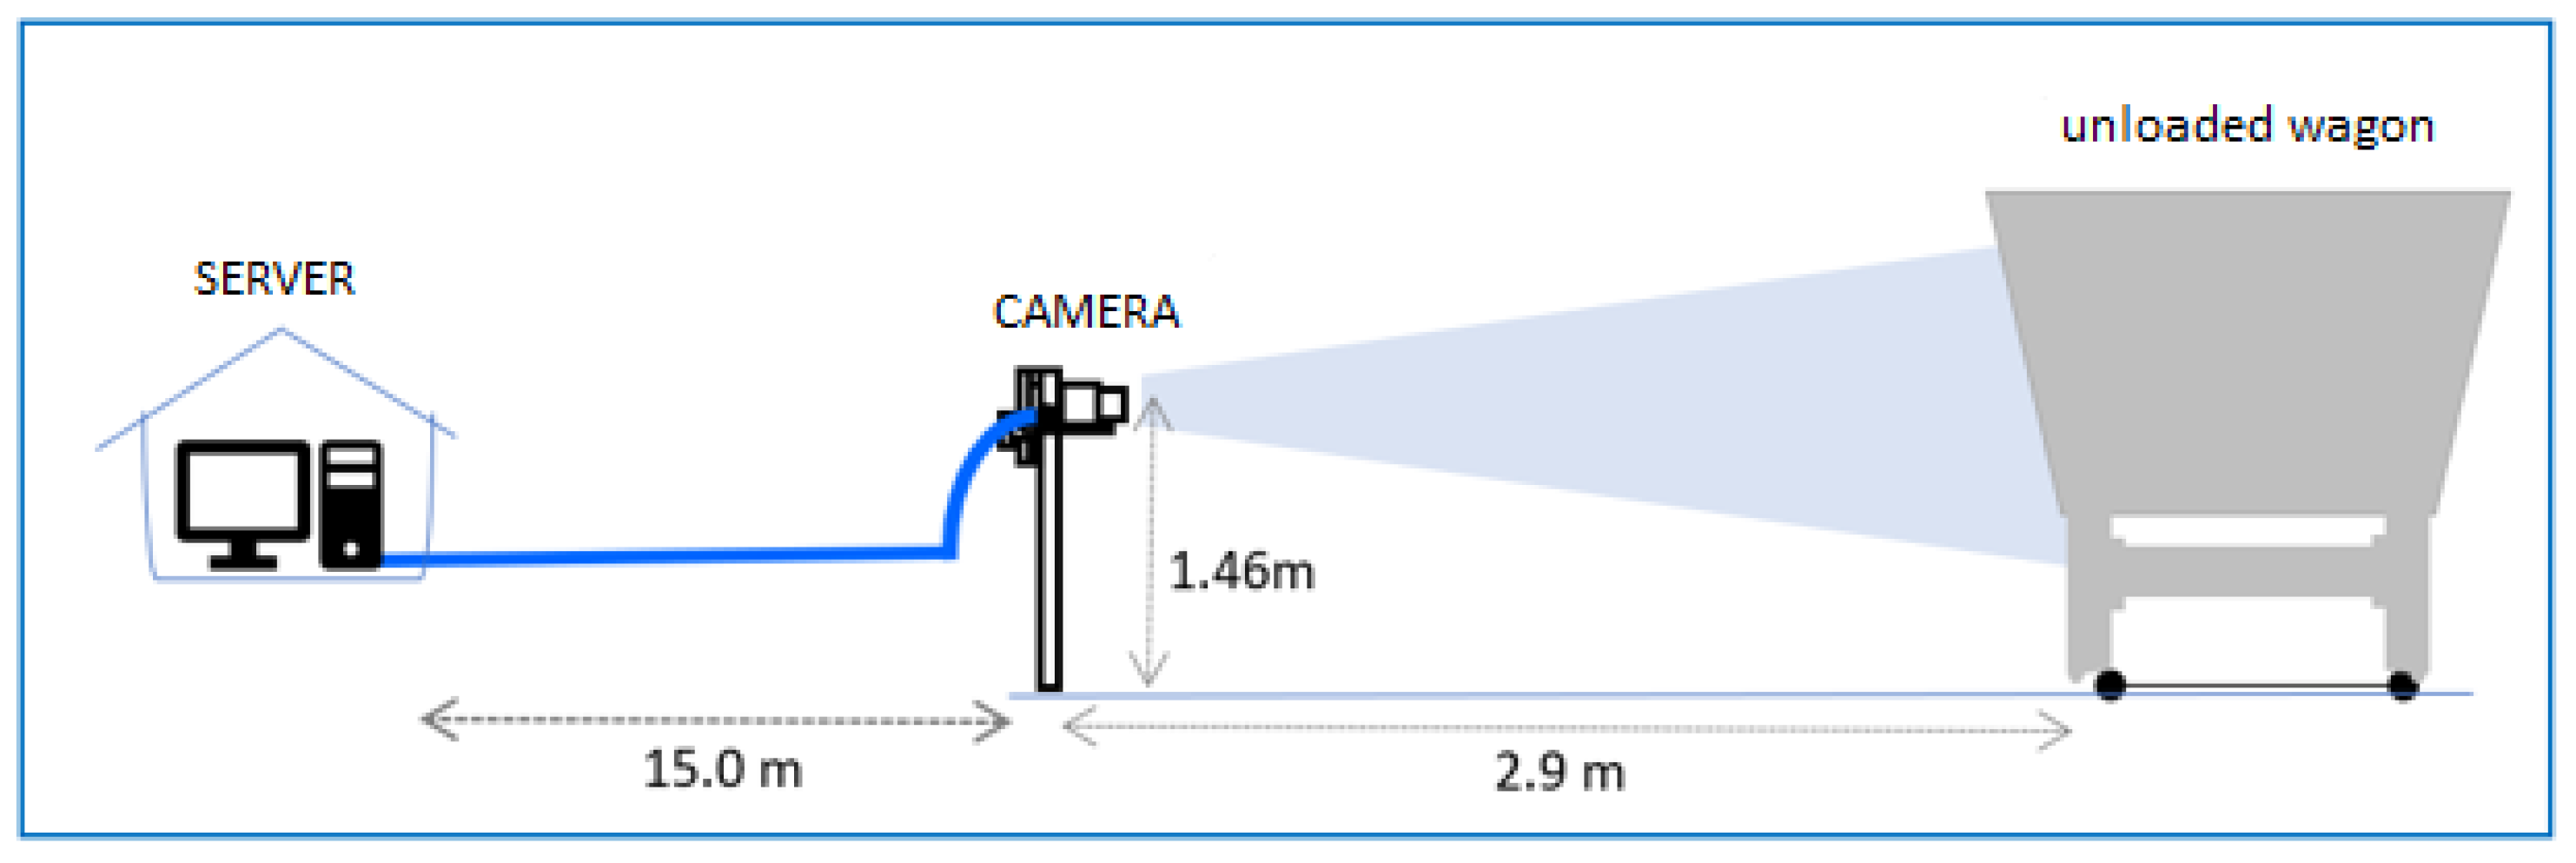
Given the large quantity of wagons, various models, and the challenging operating environment, the superstructure component is prone to various types of damage. To address this, a camera system is employed to capture images, which are then processed using image processing and computer vision algorithms. The focus of this paper was to evaluate our method’s performance in classifying superstructures cracks based on the collected images. We utilized two different databases: one with a single class —crack, and another with two classes —crack and pillar. The methodology and experiments sections provide detailed information on how the tests were conducted.
5. Results
In this section, we will present the results found for the two types of databases. The first database contained 400 images with unbalanced classes. In this database, two classes were identified, and 35% of the images had problems. The second database consisted of only one class, but it contained 200 images, half of which had cracks. To present the accuracy results, we will use boxplot graphs for each test of the two databases.
5.1. Unbalanced Database Results for 2-Class Classification with Mask R-CNN Algorithm
Regarding the unbalanced database, an important observation about the results is the randomness of the images selected for testing. Out of the total 400 trained images, only approximately 35% of them exhibited irregularities or cracks. Based on this, 140 images were tested in 10 rounds, and in rounds 1, 2, and 9, none of the images captured by the algorithm yielded any results.
In this case,
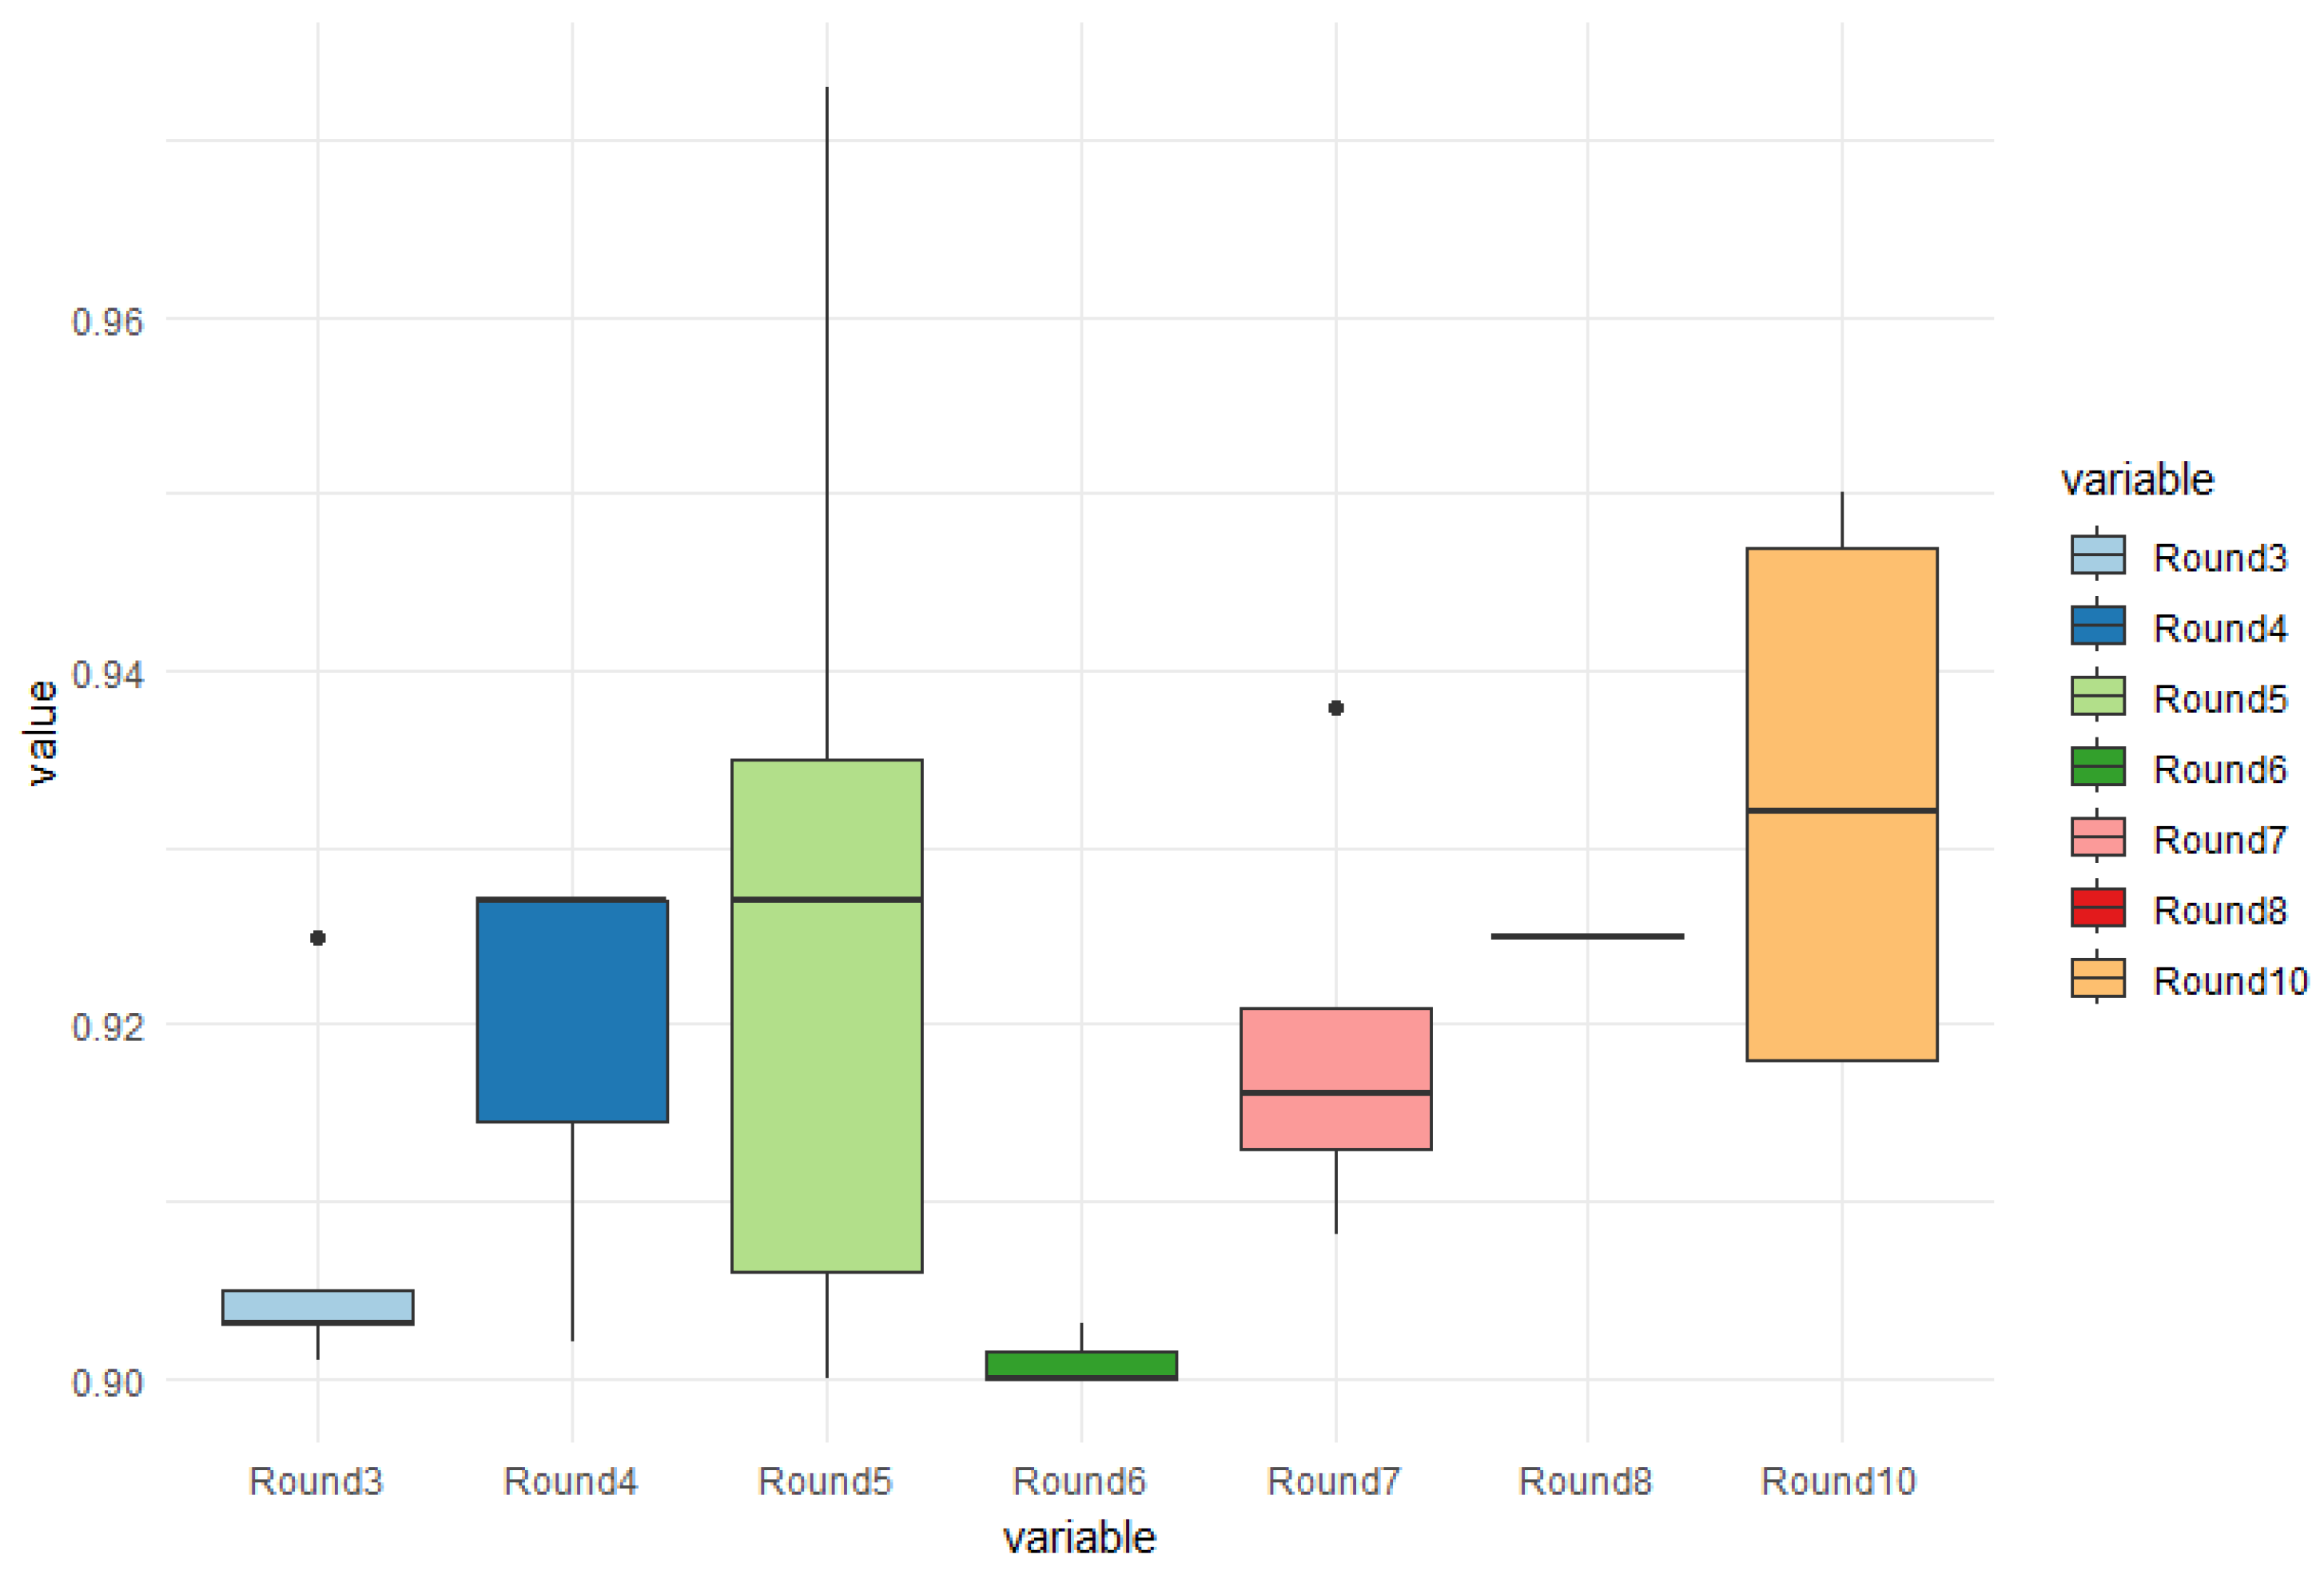
Figure 7 displays boxplot graphs depicting the accuracy of crack detection in the tested rounds. In all rounds, less than 50% of the images exhibited cracks. However, round 5 demonstrated the highest accuracy, achieving a hit rate of 97.30%, and for reasons illustrated in
Table 1, it also displayed the best average accuracy among all rounds, in contrast to the number of test executions, with a value of 92.40%, indicating a greater variability in images in this round. Even though the highest result on average was achieved by Round 10 (93.33%).
With these results, we can verify that the imbalance of the database caused the problem of evasion of encounters with problems. In this case, a model with a balanced database is seen below, to identify if this problem continued.
To understand the results of the test round of the unbalanced database with two classes, with pillars and cracks being presented,
Table 1 shows the number of images with cracks, the best result, and the average of their best hit rates, whether identifying a crack or not.
The use of two classes was an indication used to improve the identification of cracks, as these occur in the weld joints or folds of the wagon structure. In this case, the column sorts were disregarded in this round.
5.2. Balanced Database Results for 1-Class Classification with Mask R-CNN Algorithm
In the case of the balanced database, the accuracy was also used to evaluate the detection of cracks in freight trains. Similarly to the previous test, 10 rounds of tests were conducted, with each round consisting of 30 randomly chosen images from the total of 200 images used for training and testing. However, the specific results and accuracy metrics for the balanced database are not provided.
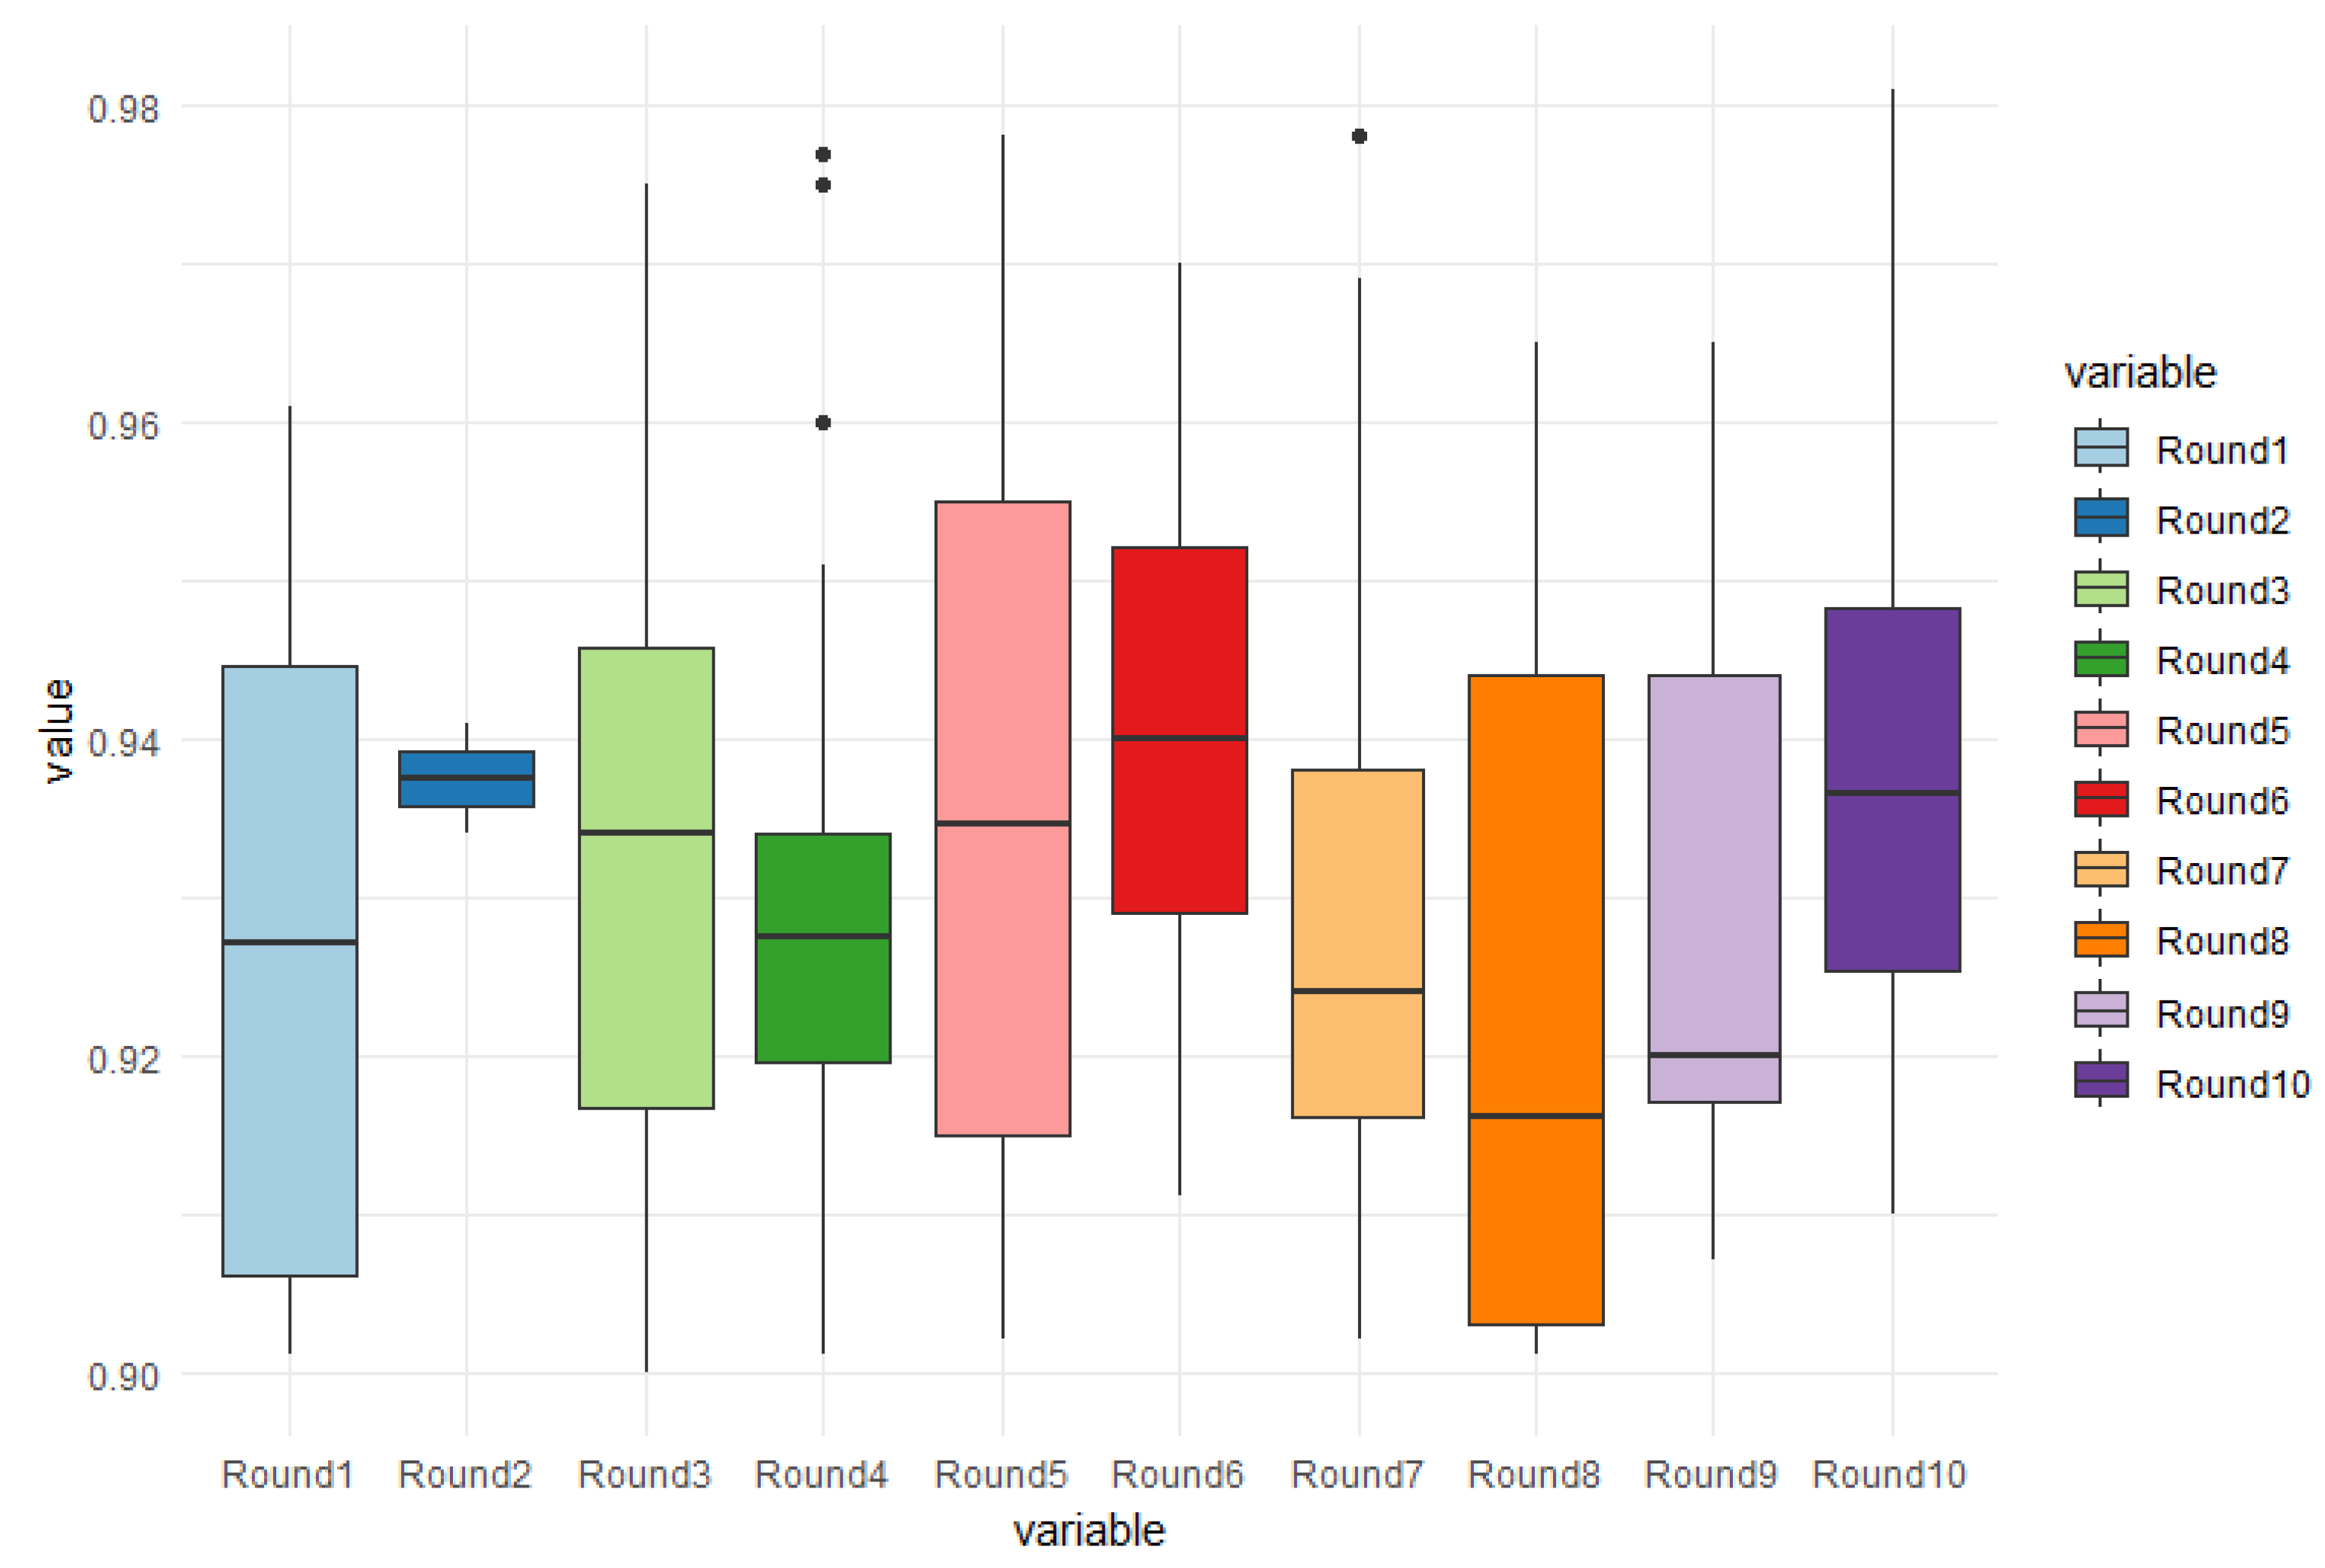
Figure 8 displays the boxplot graphs depicting the accuracy results for the balanced database. It can be observed that in round 7, all thirty images tested showed cracking problems, resulting in the lowest accuracy value of 90.2%. The highest accuracy rate achieved was 97.80%, and the average accuracy across all rounds was 92.90%. In round 2, only two out of the thirty tested images showed results, which happened by chance and contributed to the highest accuracy rate of 94.41% for that particular round.
Among the 10 test rounds conducted, round 6 achieved the highest hit rate, with more than 70% of the images containing cracks. It identified 27 out of 30 images correctly, resulting in an average accuracy of 94.06%. The peak accuracy for round 6 reached 97%, as shown in the graph. However, it should be noted that both round 5 and round 7 achieved a higher hit rate of 97.80% for images with cracking problems, despite having a slightly lower overall average accuracy.
The test rounds that did not reach the threshold of 70% of images with cracking problems (rounds 1, 2, 9, and 10) are shown in
Table 1, and it is worth noting that round 10 achieved the highest hit rate for an individual image, reaching 98.10% accuracy. Despite the lower overall number of images with problems, the average hit rate in round 10 was comparable to the rounds that had a higher proportion of images with cracks. This suggests that even in rounds with a lower prevalence of problems, the model was still able to accurately identify the presence of cracks in the tested images.
5.3. Applying U-Net and Ensemble on Unbalanced Databases for Crack Detection in Train Images
In this subsection, the results of the application of U-Net in its original architecture will be described. The model was tested on an unbalanced database consisting of 260 images without cracking problems and 140 images containing cracks.
For the first test presented in the next section, images with cracks were identified with U-NET. It is important to note that the U-Net model outperformed the Mask R-CNN model in this particular scenario (unbalanced database).
The ensemble methodology is a technique used to combine the predictions of multiple models in order to improve the overall performance and accuracy. In the context of this work, an ensemble approach was applied to the results obtained from the Mask R-CNN, U-Net, CNN, and multi-layer perceptron models, in order to enhance the success rates in identifying cracks in train car images.
By combining the predictions of multiple models, the ensemble approach aimed to leverage the strengths of each individual model and mitigate their weaknesses. This can lead to more robust and accurate results by reducing the impact of any individual model’s limitations or biases.
Common techniques for ensemble learning include majority voting, weighted voting, and stacking. These techniques could be applied to combine the predictions of the Mask R-CNN and U-Net models, potentially improving the overall accuracy and reliability of crack detection in train car images [
25,
26].
The results of an ensemble approach need to be evaluated and compared to the individual models’ performance to assess its effectiveness in improving the success rates. This can be done by measuring metrics such as accuracy [
26].
Overall, the ensemble methodology applied in this work aimed to harness the collective power of multiple models to achieve better results in identifying cracks in train car images, ultimately enhancing the effectiveness of the crack-detection system.
5.3.1. Unbalanced Database Results for 1 Class on U-NET
After dividing the database into training and test sets, with 260 images for training and 140 images for testing, the U-Net model was trained and evaluated. Several test runs were performed, and as a result, five models were generated for evaluation.
These five models were variations of the U-Net architecture trained on different meta parameter subsets for the same training data. By generating multiple models, the aim was to explore different representations and learn diverse patterns from the data, thereby increasing the chances of achieving better performance and accuracy.
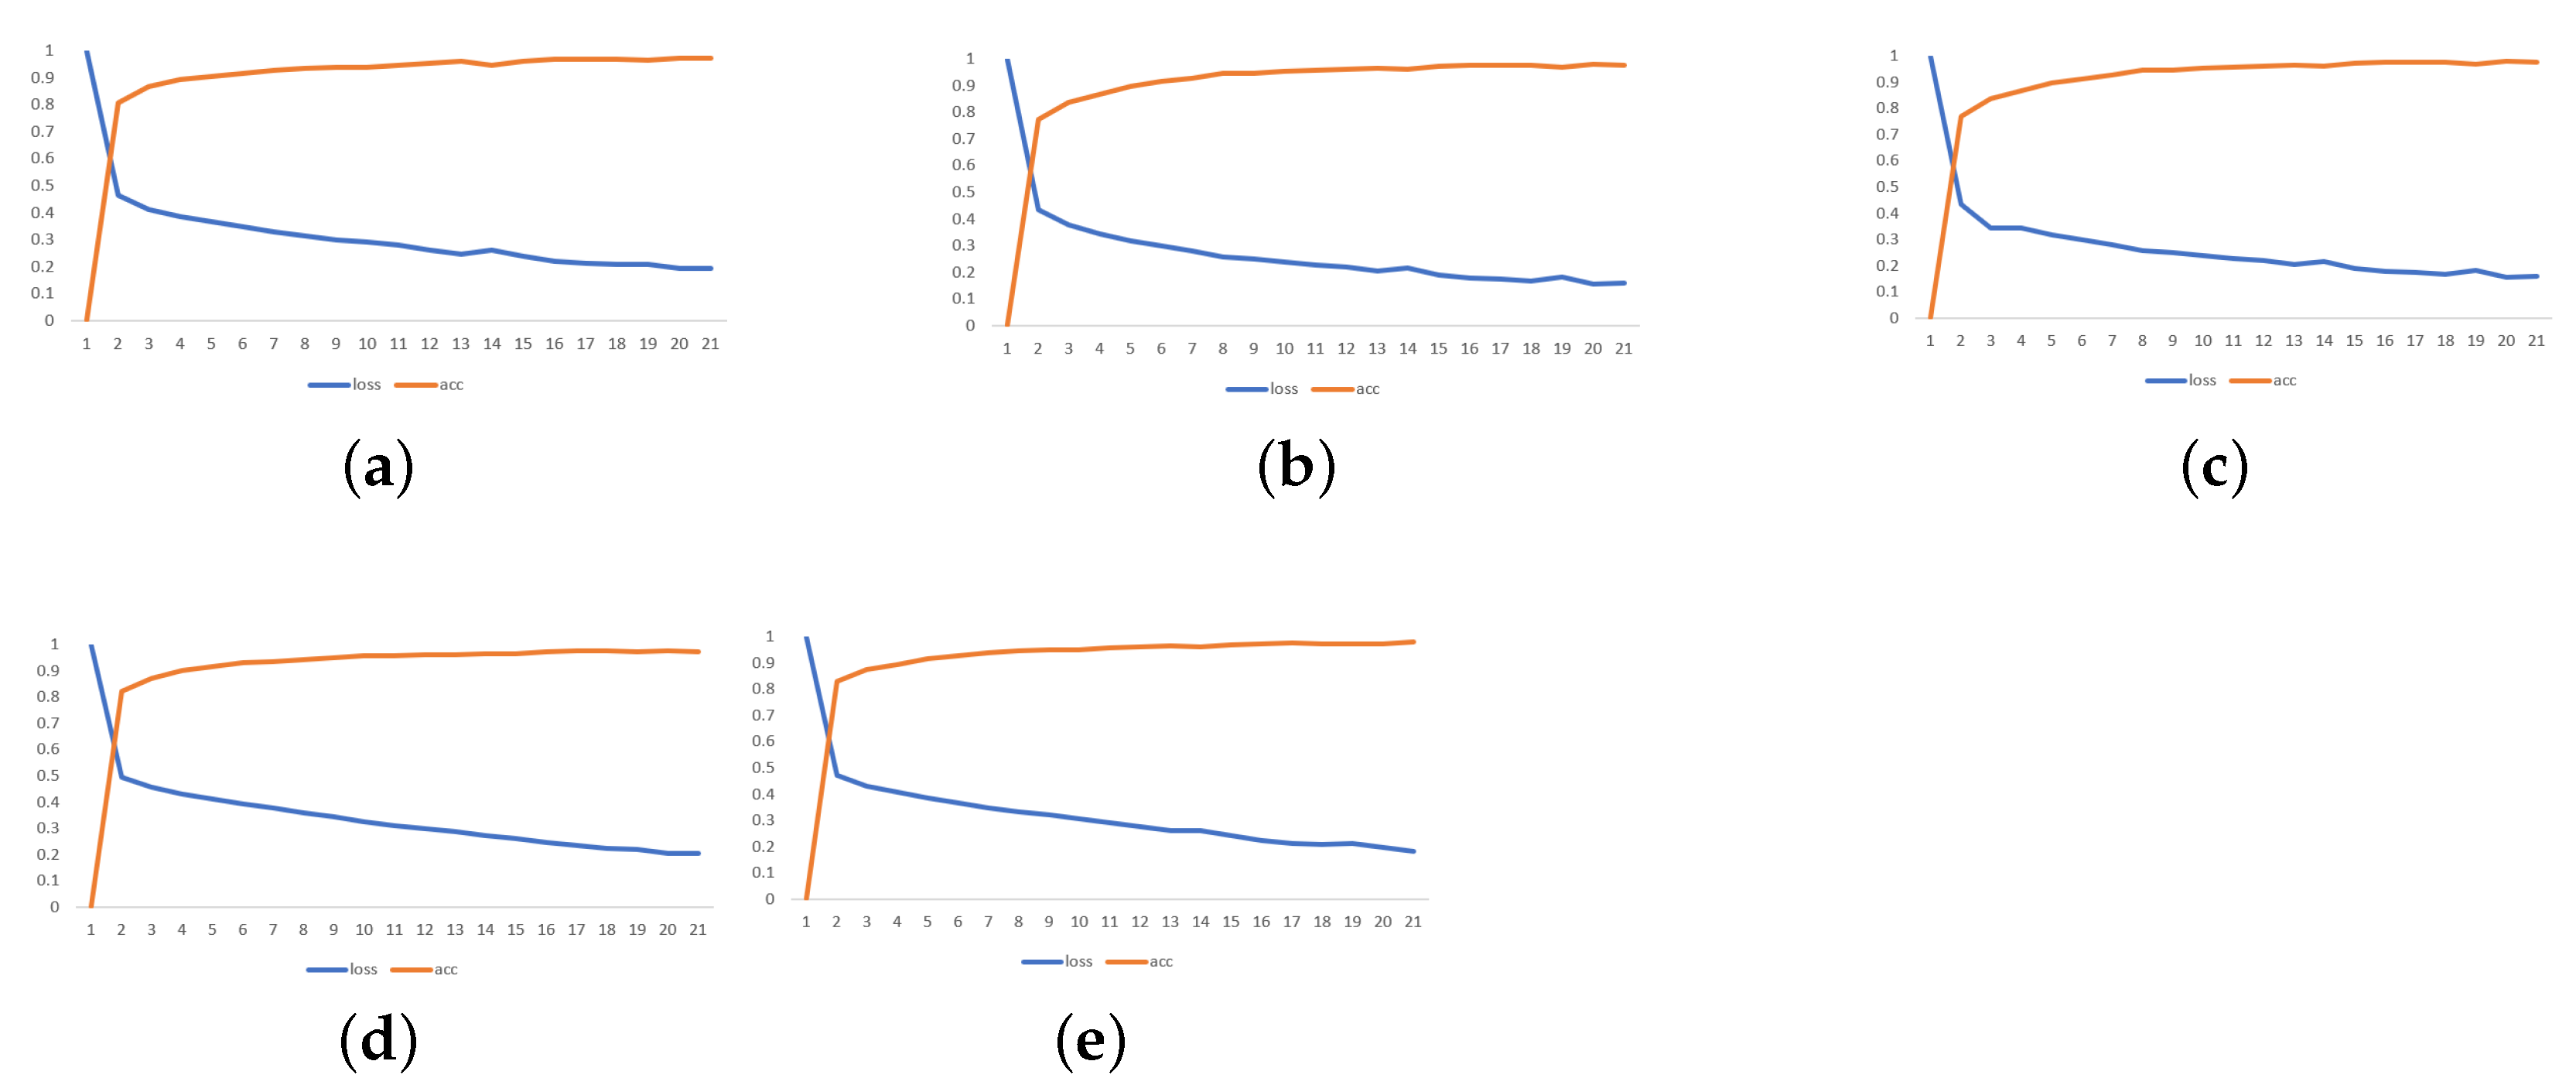
Figure 9 illustrates the evaluation of loss and accuracy metrics for the five trained U-Net models over 20 epochs. The graph provides insights into the performance and learning progress of each model during the training process.
Based on the graph, it can be observed that all five models exhibited a similar trend in terms of loss and accuracy. As the number of training epochs increased, the loss decreased, indicating that the models were learning and improving their ability to minimize the difference between the predicted and actual values. At the same time, the accuracy increased, reflecting the models ability to correctly classify the input data.
Among the five models, model 5 (
Figure 9e) stands out, as it achieved the highest accuracy and lowest loss during training. This suggests that this particular model learned to effectively capture and identify the patterns associated with cracks in the input images. Consequently, model 5 was selected for further testing and evaluation.
The decision to choose model 5 for testing was based on its superior performance and the fact that it had been trained on a larger number of images with cracking problems. This choice was expected to yield higher accuracy in detecting cracks in the test images, as indicated by its strong performance during training.
The evaluation of the selected U-Net model was carried out on a total of 60 randomly chosen images from the database. These images were divided into three different sets, each containing 20 images. The purpose of this evaluation was to assess the model’s performance in detecting cracks in various image samples.
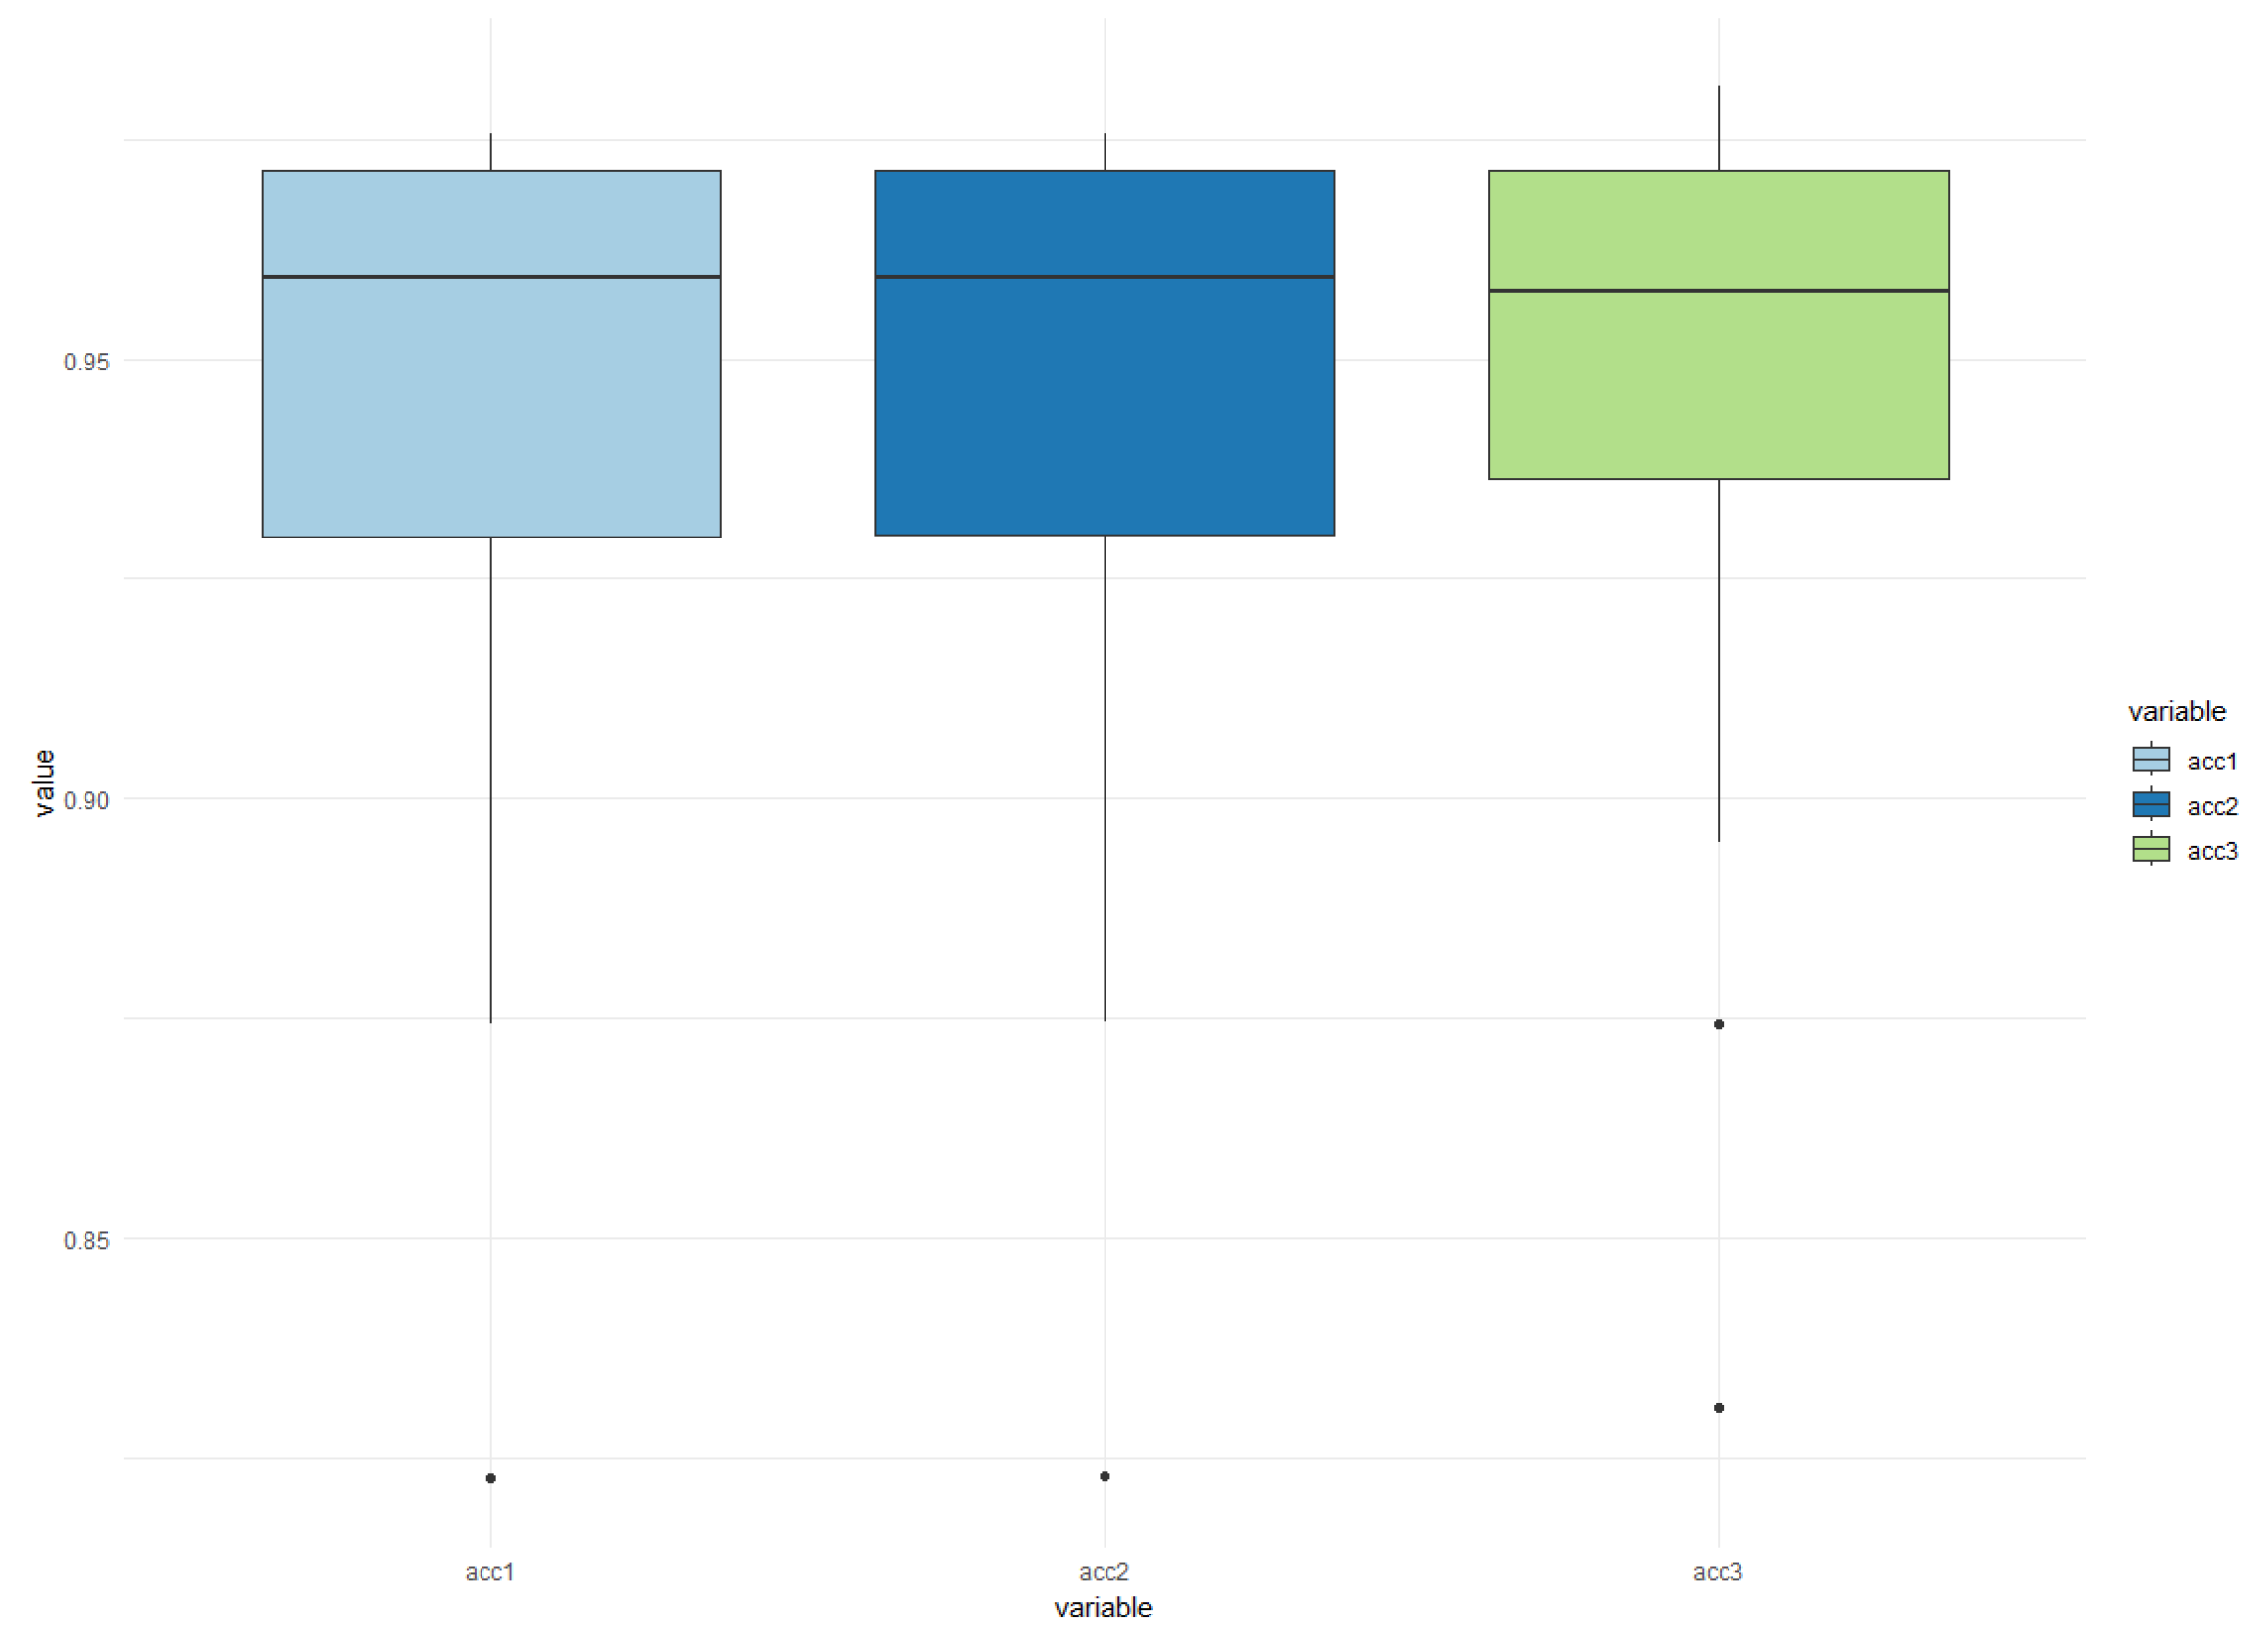
In
Figure 10, you can see the behavior of each of these groups of 20 images, divided into three different categories. The main observation from the figure is that the average hit rates for detecting cracks in the images were similar across the three groups. The first group had an average hit rate of 94.31%, the second group had an average hit rate of 94.32%, and the third group had an average hit rate of 94.44%.
In this context, as shown in
Figure 10, it can be observed that this classification model did not require a large number of images for evaluation. Additionally, the success rate for the best model was around 97%, with the highest result being 98.08%.
5.3.2. Ensemble with Unbalanced Database Results for 1-Class Classification
To further improve the results, the method of using an ensemble approach, based on a voting mechanism using accuracy, was adopted. In
Figure 11,
Figure 12 and
Figure 13, the results for the three models of each of the four classifiers are presented. These models utilized a total of 400 images, with 260 images depicting train cars without any crack problems, and 140 images representing cars with cracks.
Furthermore, in
Figure 11, it can be observed that 10 images per model were employed for testing. In each of these tests, apart from the four individual classifiers, an ensemble consisting of all four classifiers and a second ensemble comprising the Mask R-CNN and U-NET classifiers were also included.
The results depicted in
Figure 11 indicate that the four classifiers achieved a maximum hit rate of 67% and an average of 63%. It can be observed that the use of an ensemble did not improve the performance of the individual classifiers. This can be attributed to the fact that the MLP classifier generated numerous errors when identifying cracked images.
When comparing the ensemble of four classifiers with the ensemble of two classifiers, a significant difference can be observed. This was mainly due to the Mask R-CNN and U-NET classifiers, which achieved remarkable results. The accuracy of the ensemble of four classifiers averaged around 92.97%, with the best case achieving a 95% accuracy rate on the images.
In
Figure 12, a similar pattern is observed, where the ensemble of two classifiers performed better than the ensemble of four classifiers. The best hit rate in the two-class vote was 96%, which indicates an improvement compared to the results in test 1 of
Figure 11. This improvement can be attributed to the two classifiers having a higher accuracy, with an average hit rate of 93.20%.
Similarly,
Figure 13 confirms the previous observations, where the ensemble of two classifiers outperformed the ensemble of four classifiers. In the worst case scenario, the average hit rate was 64.37% and the best rate was 64.87%. However, in the best case scenario for the ensembles, the hit rate improved significantly, with a best rate of 97.03% and an average rate of 93.14%. This highlights the effectiveness of the ensemble approach in improving the overall accuracy of the classifiers.
The use of ensembles did not improve the results of the classifications performed by U-NET in checking cracks in train cars. However, the results did improve for the three tests compared to the average results of Mask R-CNN. The difference between their best results was less than 1%. This suggests that an ensemble approach may not be necessary for U-NET, as it already performs well on its own. However, for Mask R-CNN, the ensemble approach helped to improve its overall performance.
6. Previous Algorithm History and Discussion
To consider the Mask R-CNN method for crack classification activities in freight train cars, various techniques were explored. The approach involved experimenting with different types of neural networks, from simple ones to more complex convolutional neural networks, using various meta-parameters. The goal was to develop a solution that does not heavily rely on pre-processing and provides accurate results that are aligned with the expectations of the team responsible for verifying cracks in train wagons.
The decision not to rely on additional pre-processing techniques was primarily driven by the need for a fast and efficient system. The initial approach presented in this work, involving the use of complete 4K images, was deemed impractical, due to the computational burden and the inherent similarity between images. Since cracks in train cars are often small and localized, it was determined that dividing the images into smaller regions would be a more effective approach. This approach allowed for a more focused analysis of specific areas where cracks are likely to occur, resulting in improved classification accuracy.
The expert assessments revealed that other methods, such as using a common neural network with a softmax function, were not successful in achieving satisfactory results. One major challenge was the unrealistic classification time required by this approach. Additionally, the highly unbalanced nature of the database and the use of complete wagon images contributed to the low accuracy, with an average hit rate of only 25%. These limitations highlighted the need for a more efficient and focused approach, which led to the exploration of convolutional neural networks and the adoption of image division techniques, as discussed earlier.
The use of convolutional neural networks (CNNs) was explored extensively, considering various meta-parameters in an attempt to improve the results. However, the challenges posed by the high-resolution, unprocessed images and the similarity between the two classes limited the accuracy achieved.
Table 2 provides an overview of the performance of the three different types of CNNs used in the search for an optimal methodology for the data and classification algorithm.
Unfortunately, the accuracy of these CNN models did not exceed 60%, indicating the complexity of the crack classification task and the need for alternative approaches. These unsuccessful attempts further motivated the development of the approach described in
Section 4, which involved image division and the utilization of more specific algorithms like Mask R-CNN and U-NET.
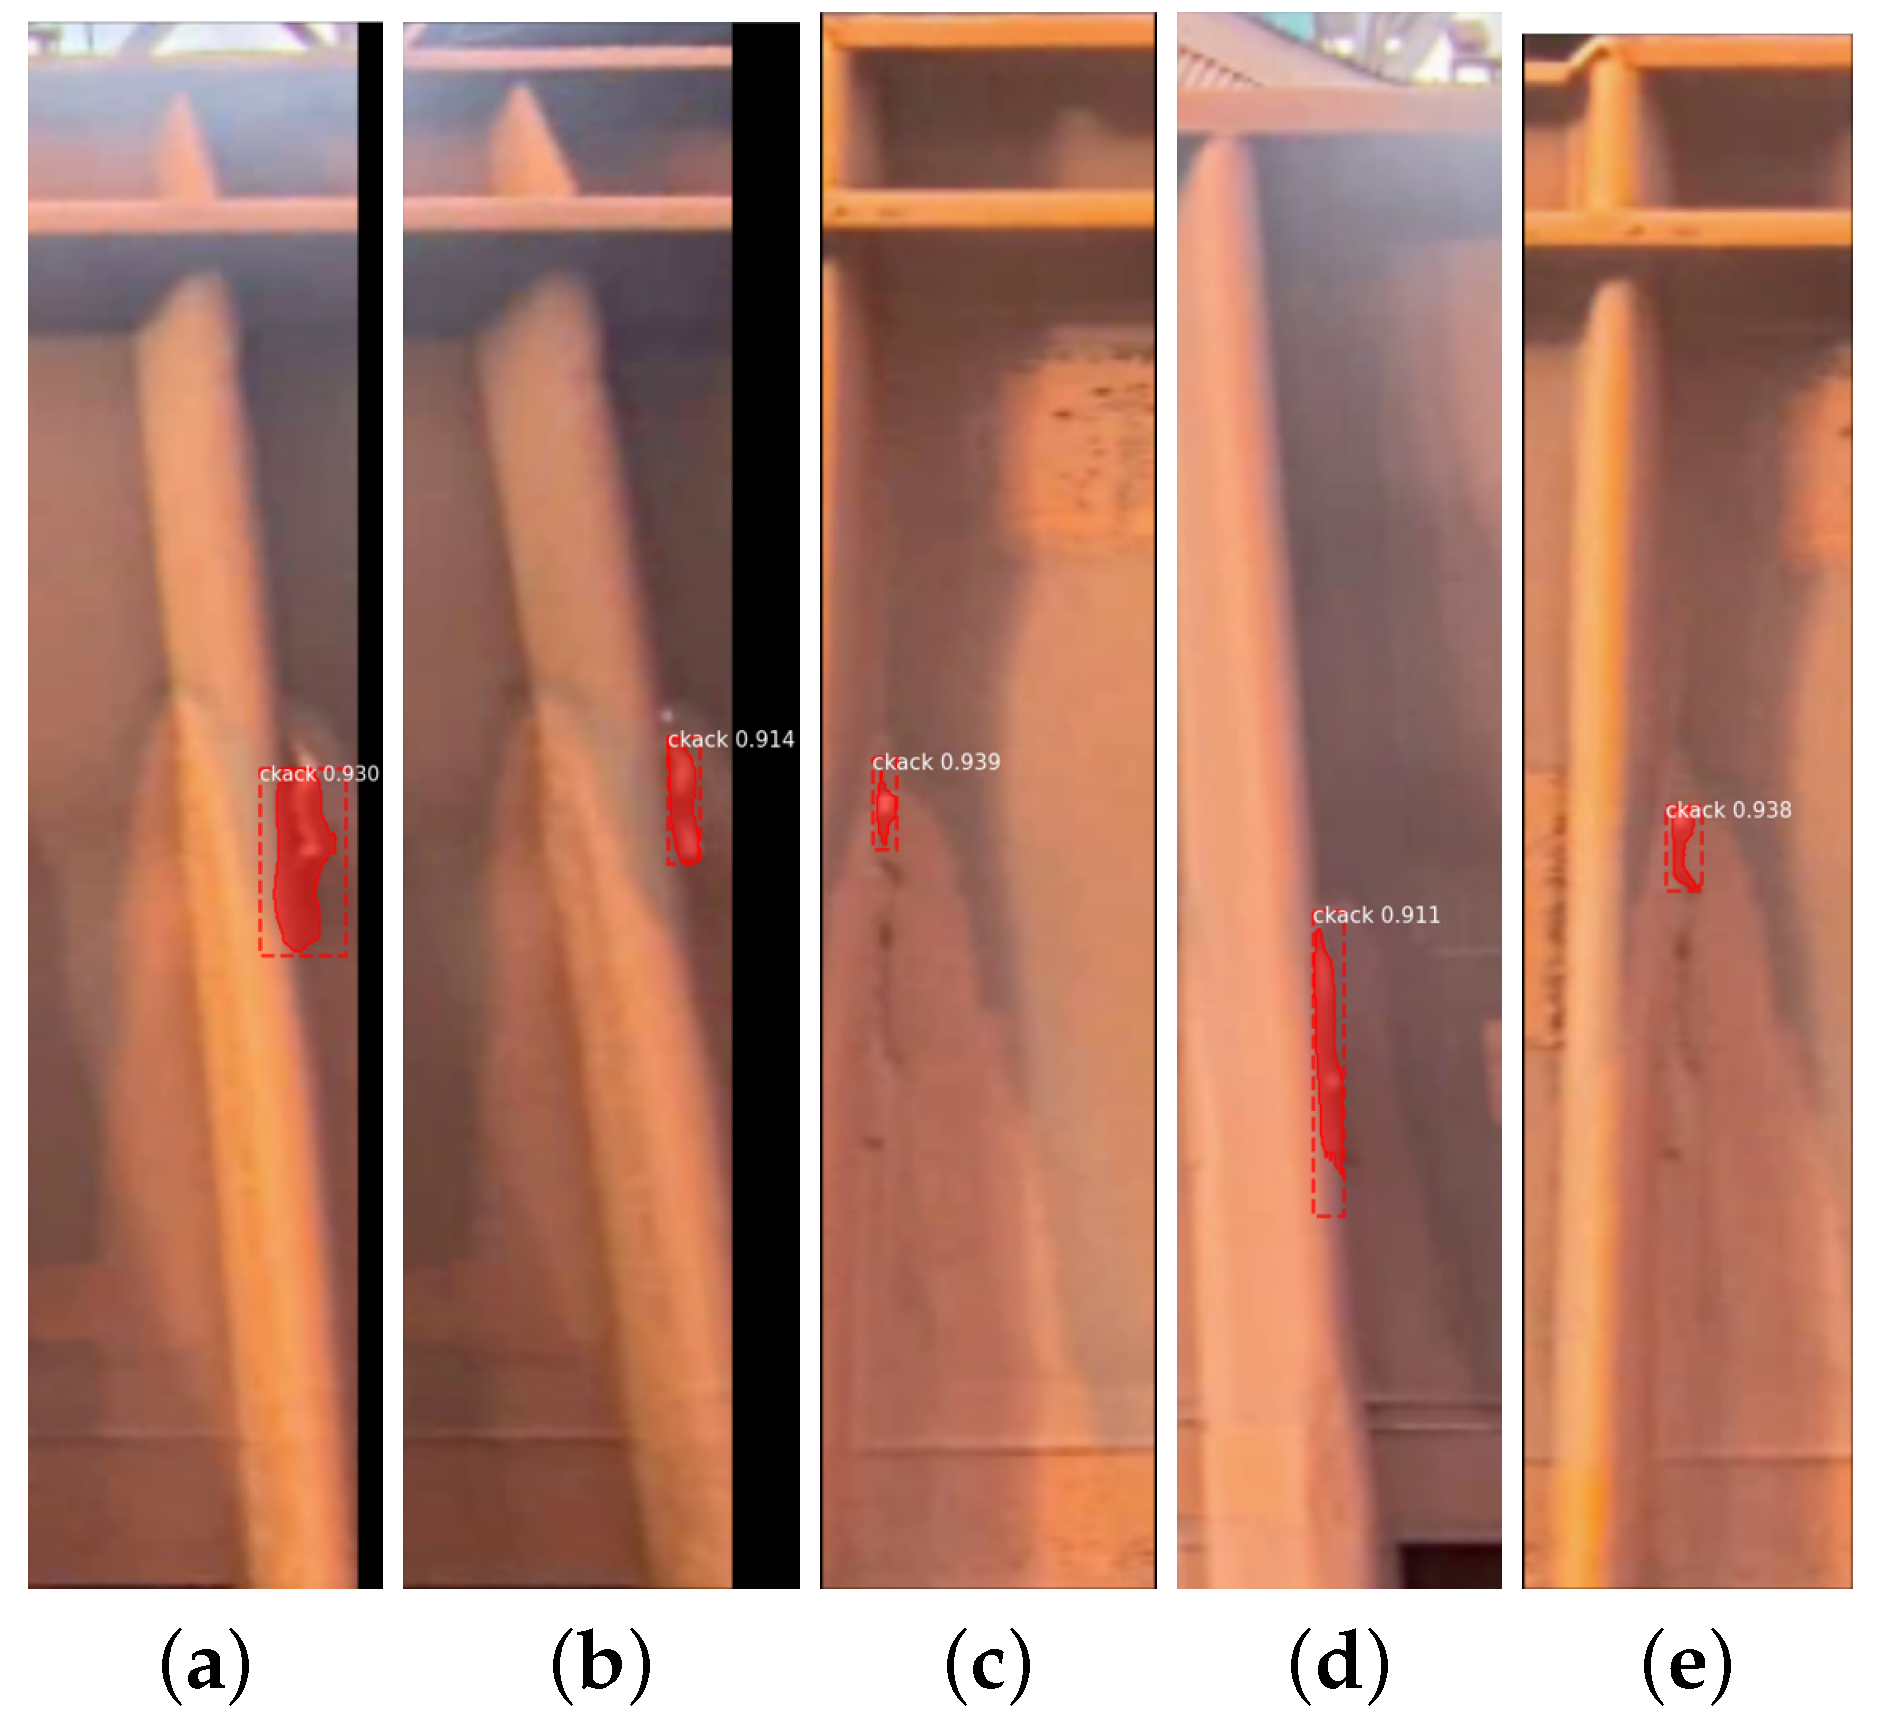
The choice of using the Mask R-CNN algorithm for image preprocessing and tagging was based on its simplicity and effectiveness in handling image segmentation tasks. The algorithm’s ability to identify and mark specific regions (such as cracks) in images made it a suitable choice for the crack classification task at hand. In
Figure 14, we can see examples of how the algorithm behaved at different times when evaluating the cracks in the trains, as well as its real confidence in the classification.
However, it is worth mentioning that there are other algorithms and approaches available for region-based image markup. Exploring alternative algorithms for region annotation and segmentation could be a potential avenue for future research and improvement in the crack classification process. Different algorithms may offer unique advantages or considerations based on the specific requirements and characteristics of the dataset and problem domain.
Best Results Comparison
The best cases among the algorithms in the present study and the shortest testing times are presented in
Table 3. It can be seen that training took the most time in the complete process; however, the testing time for each individual image was similar for all the selected algorithms.
The time values presented in
Table 3 are a rough estimate, they show a round value, and this difference did not exceed 30 min. In an analysis in which we used time as the criterion for choosing the CNN implementation, Mask R-CNN and U-Net were more suitable for training. For the test response, the best case was the combination of ensemble quotation with Mask R-CNN and U-Net.
In neither case is the MLP algorithm recommended for deployment in production. In a crossover, the choice of the best result would be the Mask R-CNN algorithm, because when there is the need for retraining, it has the best results for time/accuracy. The issue of implementing such a system in a production environment to help employees identify defective parts would involve the company’s software approval process, as it is a computer system.
7. Conclusions and Future Work
The transportation of cargo plays a vital role in various industries, including mining. Trains are commonly used for transporting goods and raw materials from mining sites to processing facilities or distribution centers. The use of trains for this purpose offers several advantages, such as the ability to transport large quantities of cargo in a single trip and the ability to operate on established rail networks.
The use of computer vision and machine learning techniques for crack detection in freight trains is indeed a valuable contribution to the field. Traditional methods of crack detection, such as chemical tests and temperature tests, have their limitations and may not be suitable for continuous monitoring of train structures. The application of computer vision and machine learning algorithms can provide a non-destructive and automated approach to crack detection. By using cameras to capture images or videos of train structures, these algorithms can analyze visual data to identify and locate cracks or other anomalies.
Overall, the combination of computer vision and machine learning technologies holds great potential for improving the detection and monitoring of cracks in freight trains, contributing to the safety, maintenance, and overall performance of railway infrastructure.
Our paper differs from the works [
6,
12,
16,
17,
18] cited in
Section 2 of related works, firstly, because it deals with the identification of cracks in train car superstructures; some of those works reported the identification of defective parts, and others identified cracks, but not in train car superstructures and using real images. Next, no specific works of this nature were found, and our work differs from the other works. Certain studies have similarities, but not in the aspect of railway images. The work in [
13,
14] could be considered analogous in its data pre-processing for the identification of masks, but it used images in conventional format, not hyper-spectral and multi-spectral images.
The use of two databases with different characteristics provided a comprehensive approach to crack detection in freight trains. The first database consisted of 400 random images of pieces of wagons, containing two classes: images with cracks and images without cracks. However, this database was unbalanced, meaning that the number of images in each class was significantly different. This can pose challenges for classification models, as they may be biased towards the majority class. The second database contained 200 images with only one class, specifically images with annotated cracks. In this case, 50% of the images in the database contained annotated cracks. This database provided a focused and balanced set of images specifically designed to train and evaluate the classifier’s performance in crack detection.
The results obtained from the unbalanced database demonstrated the effectiveness of the classifier in detecting cracks in freight train images, even when the dataset was imbalanced. Despite only 30% of the images containing cracks being validated, the classifier achieved a high accuracy rate in its best result, reaching 98.08% with the U-NET algorithm. This indicates that the classifier was successful in identifying and classifying cracks in the tested images.
Moreover, the average accuracy of 92.40% across the testing rounds further confirmed the classifier’s ability to consistently perform well in detecting cracks. This average accuracy suggests that the classifier can reliably identify cracks in a majority of the tested images, contributing to the overall effectiveness of the crack-detection system.
It is worth noting that some models may not have found any images with cracks in their testing rounds. This could be attributed to the nature of the dataset and the specific characteristics of the images in those rounds. However, the high accuracy rates achieved in the best result and the average indicate that the classifier was capable of effectively detecting cracks in the majority of the tested images, showcasing its potential for crack detection for freight trains.
The results obtained from the balanced database further confirm the importance of a balanced dataset in achieving better classification performance for crack detection in freight trains. With a more balanced dataset, where approximately 65.66% of the tested images contained cracks (validation), the classifier demonstrated improved performance in identifying cracks across the 10 different models.
Furthermore, the use of a single objective class, focusing solely on identifying cracked wagons, proved to be effective for the Mask R-CNN classifier. By simplifying the classification task to a single class, the classifier was able to specifically focus on detecting and localizing cracks in the images, leading to improved accuracy in crack identification.
The best result achieved among the balanced models was an impressive 98.10% accuracy in one of the models. This indicates that the classifier was able to accurately identify and classify cracks in the majority of the tested images, showcasing its high precision in crack detection. Additionally, another model achieved the best average hit rate of 94.06%, demonstrating consistent performance across multiple testing rounds.
This work aimed to evaluate the effectiveness of the Mask R-CNN, U-NET, and ensemble classifier algorithms in identifying cracks in train cars. Two databases were utilized to conduct this evaluation, and the results demonstrated that both databases were successful in achieving the objective of crack detection.
However, it became evident that the use of a balanced database with a single class yielded better results in terms of the number of classified images and the learning capability of the algorithm. This balanced database consisted of images containing only the class “crack”, and it provided a more focused and targeted dataset for the classifier to learn from.
By utilizing a balanced database, where the distribution of images with cracks was more evenly represented, the classifier demonstrated improved performance in identifying and classifying cracks accurately. This dataset configuration allowed the algorithm to develop a better understanding of the features and characteristics associated with cracks, leading to more reliable and precise classification results.
The balanced database’s superiority can be attributed to several factors. Firstly, having a more balanced distribution of images ensured that the classifier had exposure to an adequate number of positive examples (cracked wagons), allowing it to learn the distinguishing features of cracks more effectively. Additionally, the absence of an overwhelming majority of negative examples (wagons without cracks) prevented the classifier from favoring the majority class, which can lead to biased and inaccurate results.
The better results achieved with the balanced database underscore the importance of dataset composition and balance in effectively training classifiers. It highlights the need to carefully consider dataset design and composition when developing machine learning models for crack detection in train cars or similar applications.
Overall, the use of a balanced database with a single class proved to be a more suitable approach for crack detection in train cars using the Mask R-CNN classifier algorithm. It resulted in improved performance, higher accuracy, and better learning capabilities, ultimately enhancing the effectiveness of the algorithm in identifying and classifying cracks accurately.
In summary, this work effectively answered the two questions posed in the introduction, proposing a new method for preparing image databases. It presents several approaches that establish a baseline for future research, as well as an investigation of various machine learning methods documented in the literature.
Future work in this area could explore the potential of ensemble methods combined with voting and pruning techniques, to further improve the classification of cracks in trains. Ensemble methods have shown promise in enhancing the performance of classifiers by combining the predictions of multiple models. By leveraging the diversity of different classifiers, an ensemble can often achieve better accuracy and robustness.
In the context of crack classification in trains, an ensemble approach could involve training multiple classifiers using different algorithms, architectures, or hyperparameter settings. These classifiers could then be combined through voting mechanisms, such as majority voting or weighted voting, to determine the final prediction. Additionally, pruning techniques could be employed to select a subset of the most informative and diverse classifiers for the ensemble, further improving the efficiency and performance.


 ,
, 


