
Experimental Investigation and Damage Identification of High-Pile Wharf Framed Bents under Horizontal Impact Loads


Abstract
1. Introduction
2. Experimental Setups
2.1. Engineering Background
2.2. Model Design
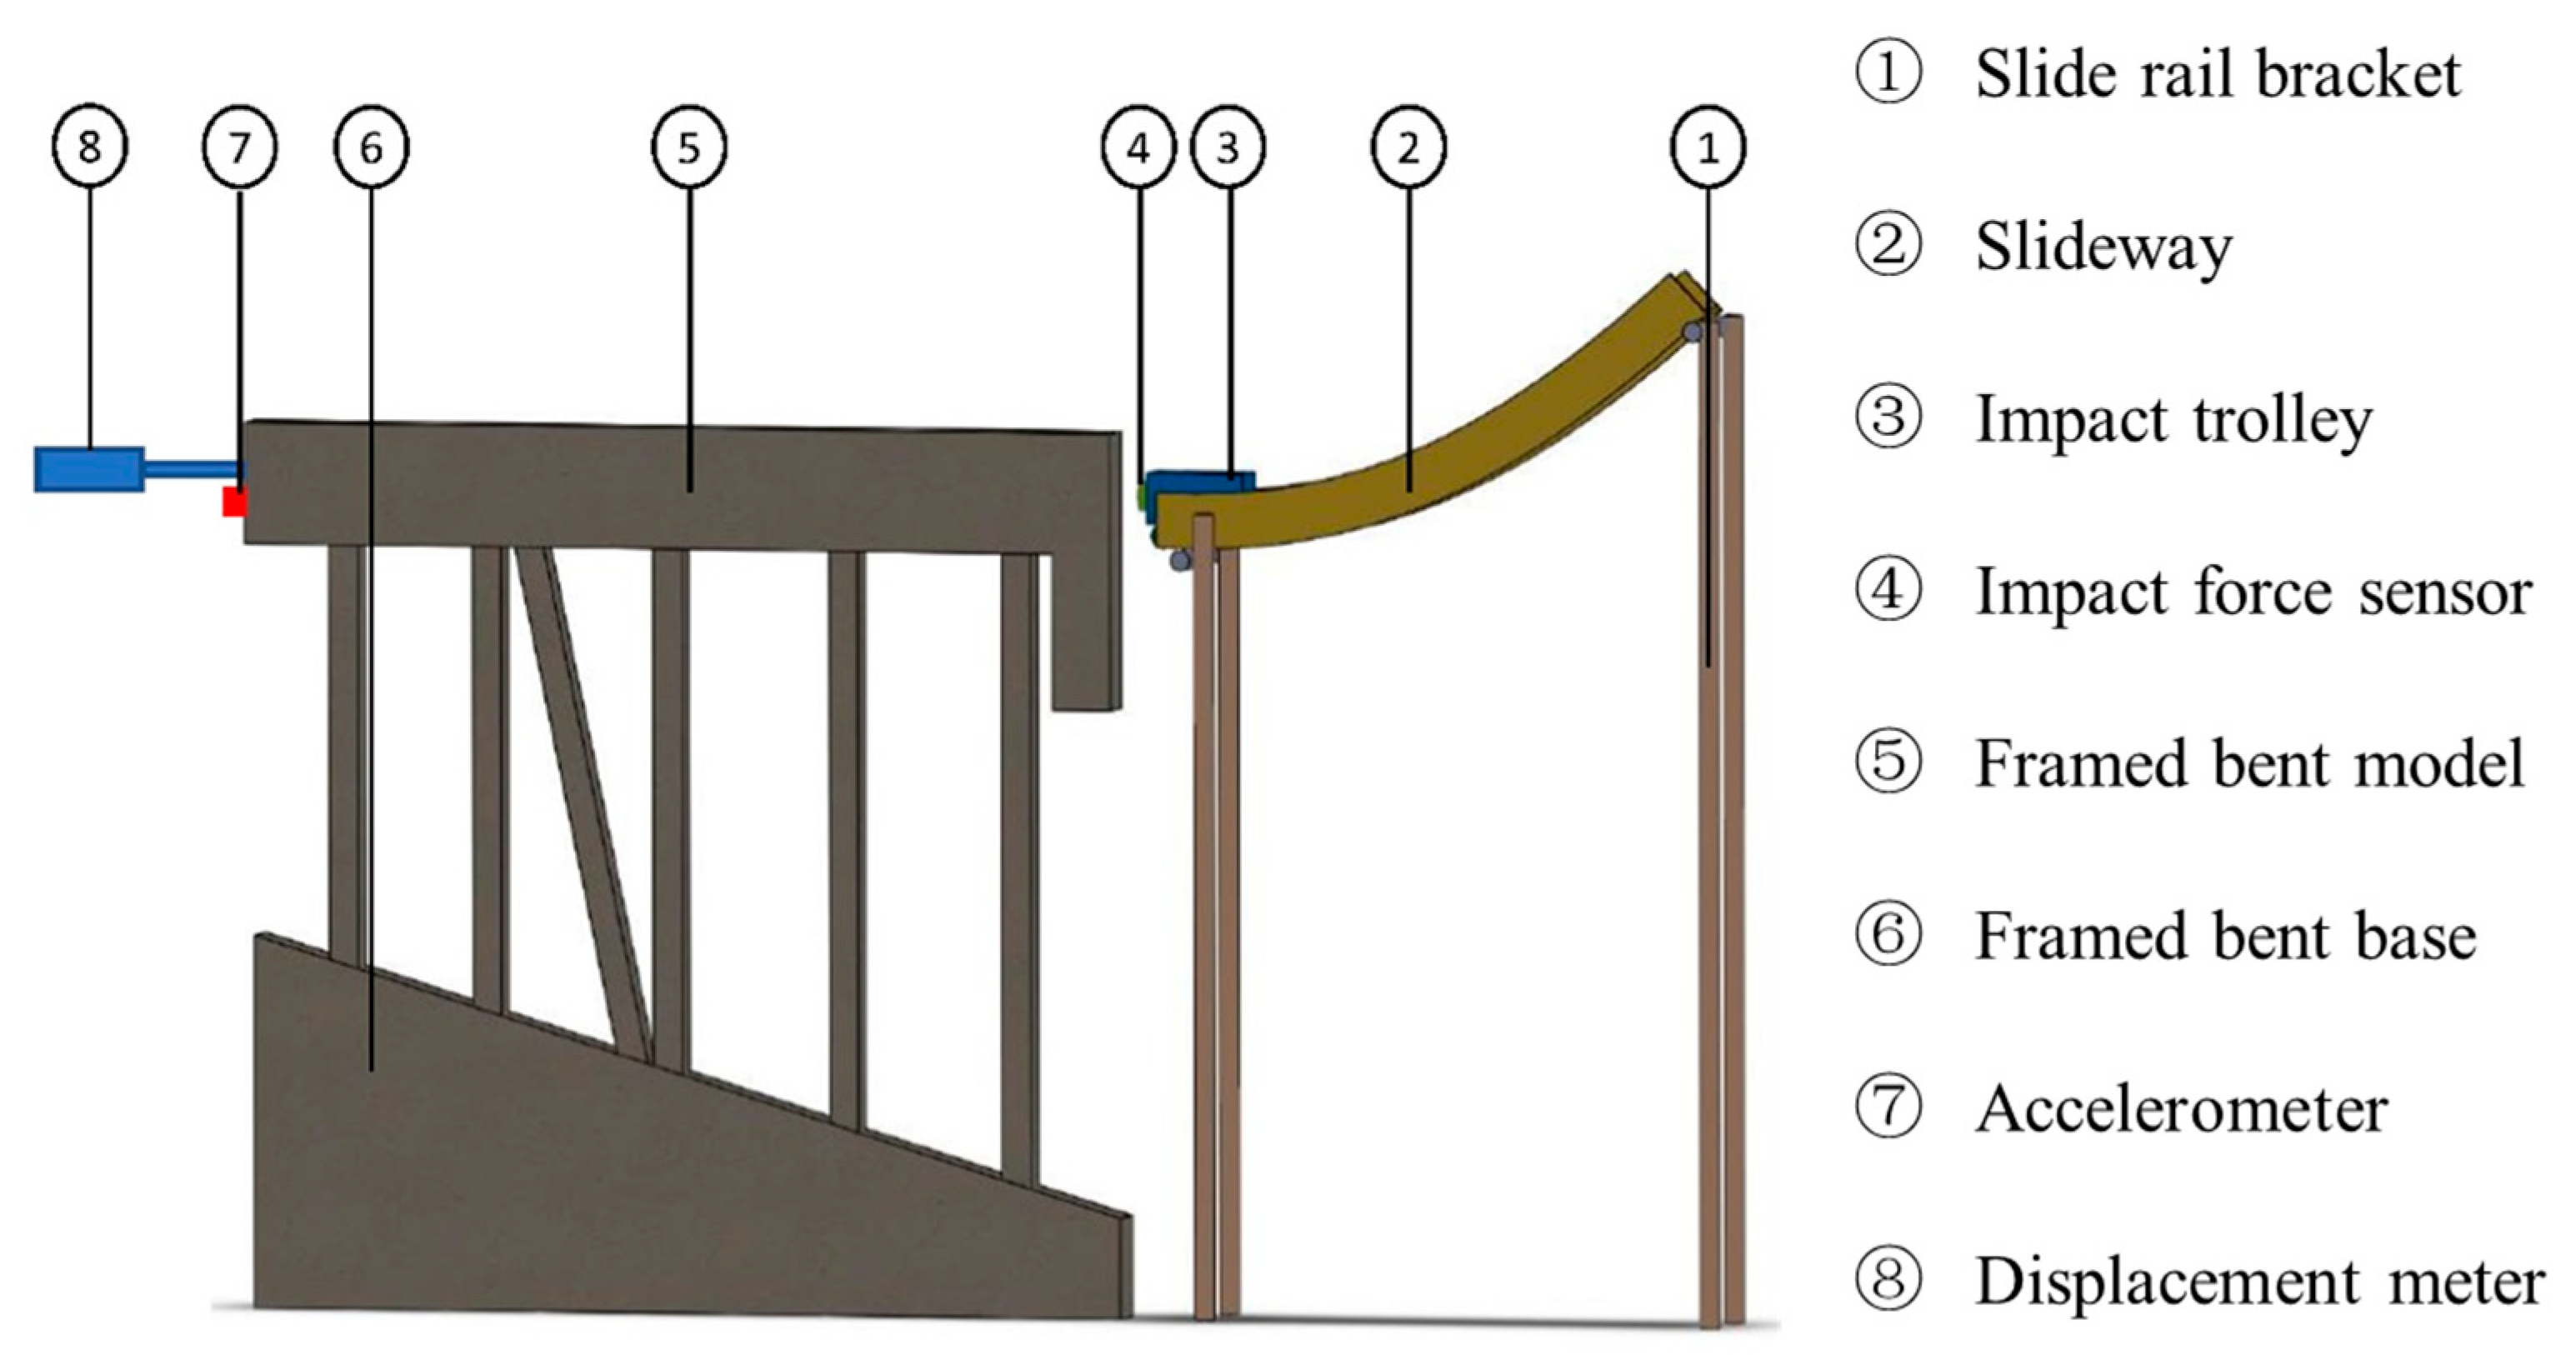
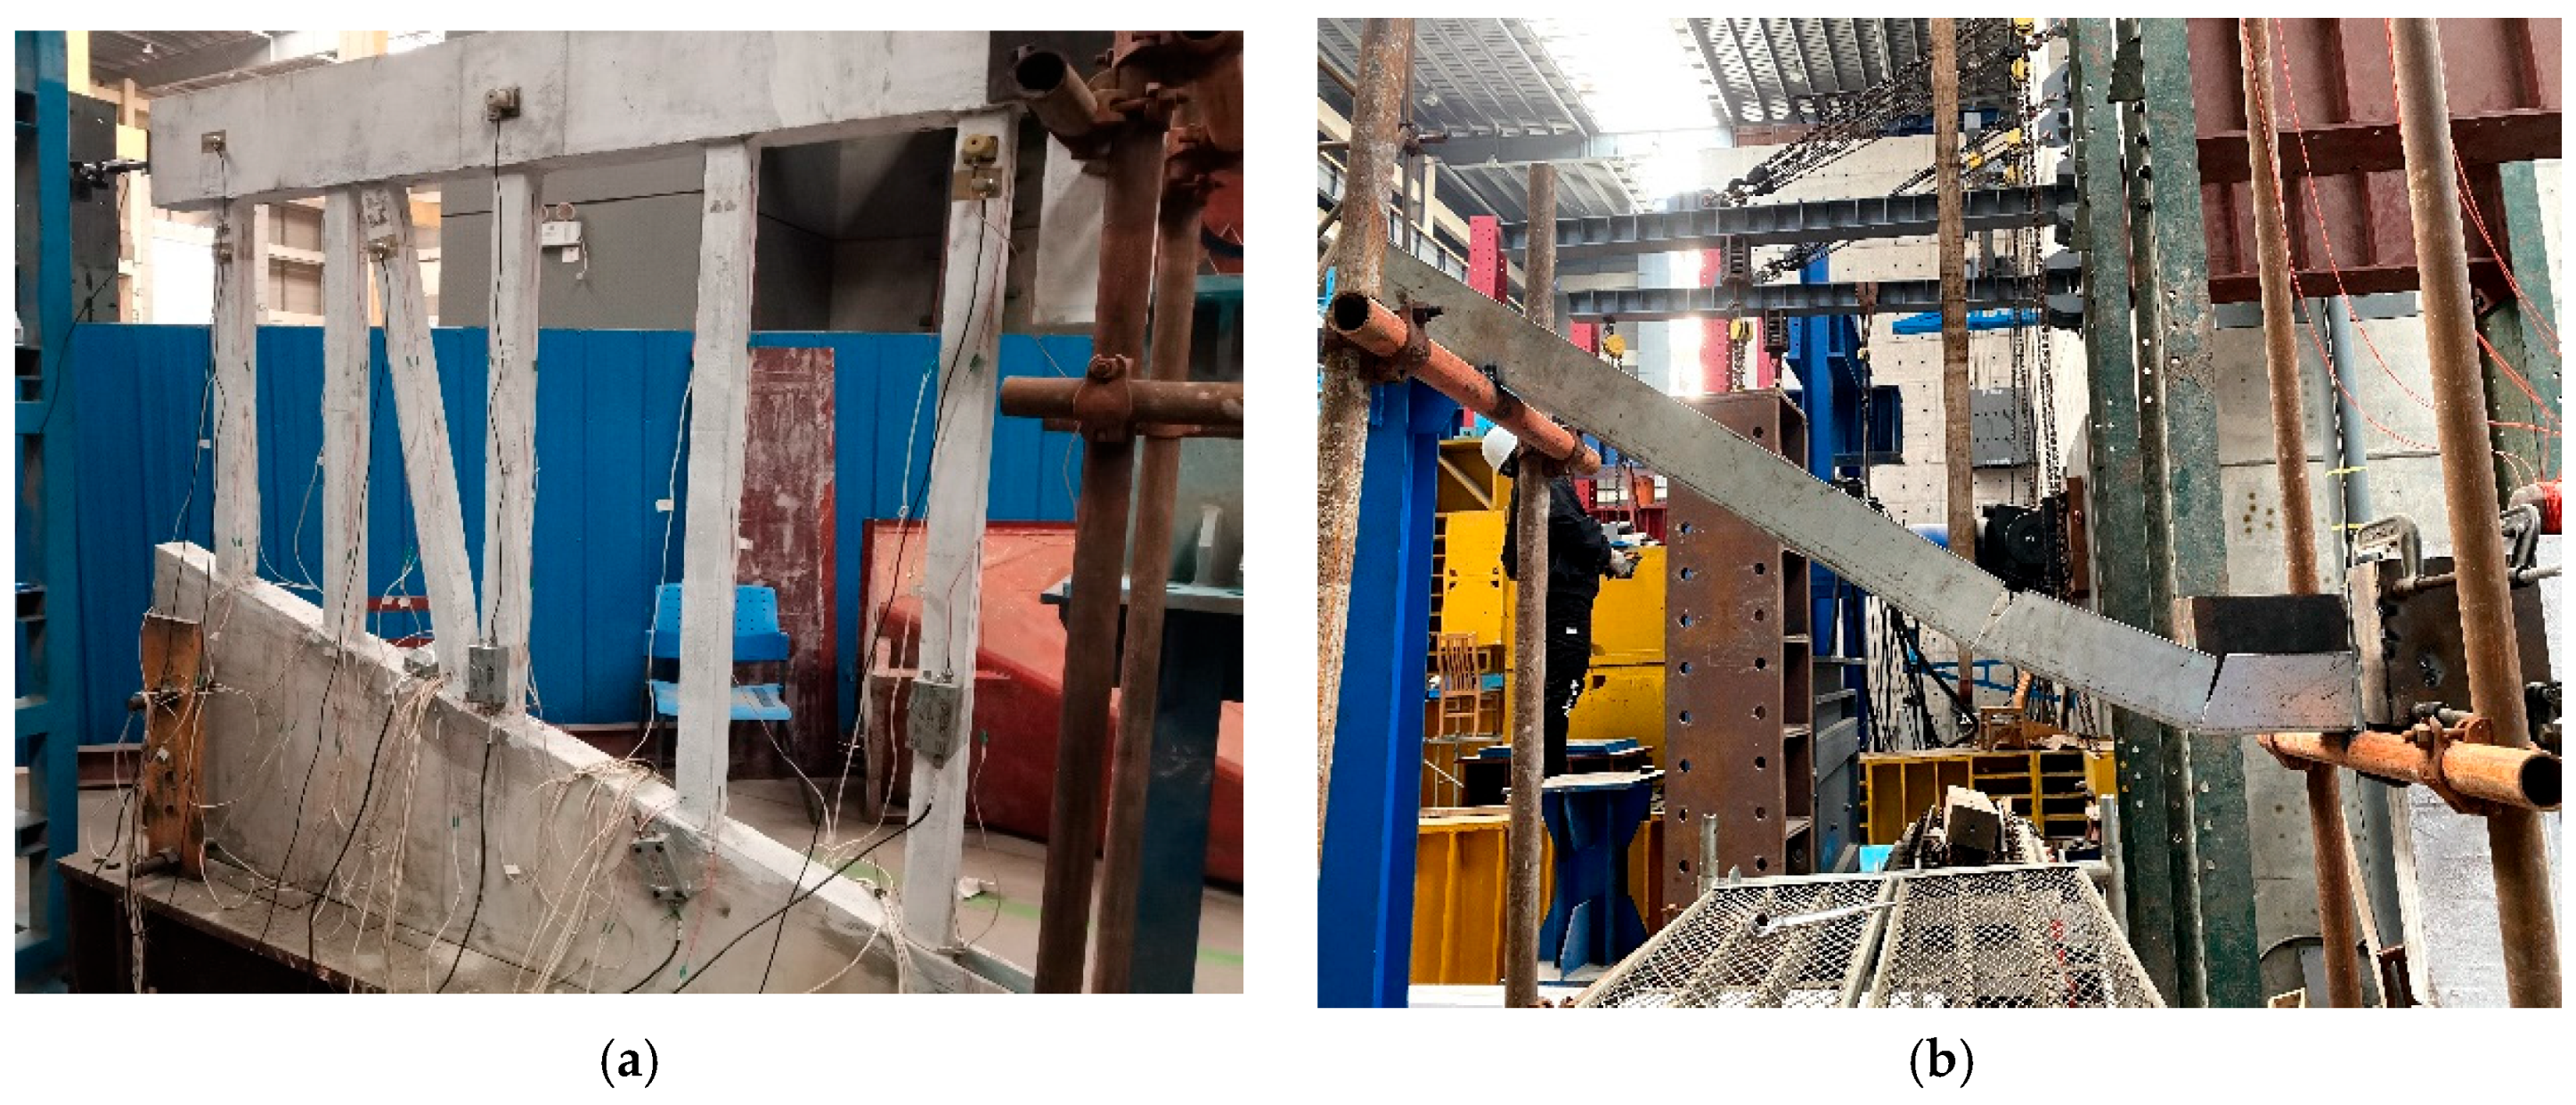
2.3. Test System
2.4. Experimental Process
3. The Method of Pile Damage Identification Based on Static Strain
4. Results and Discussion
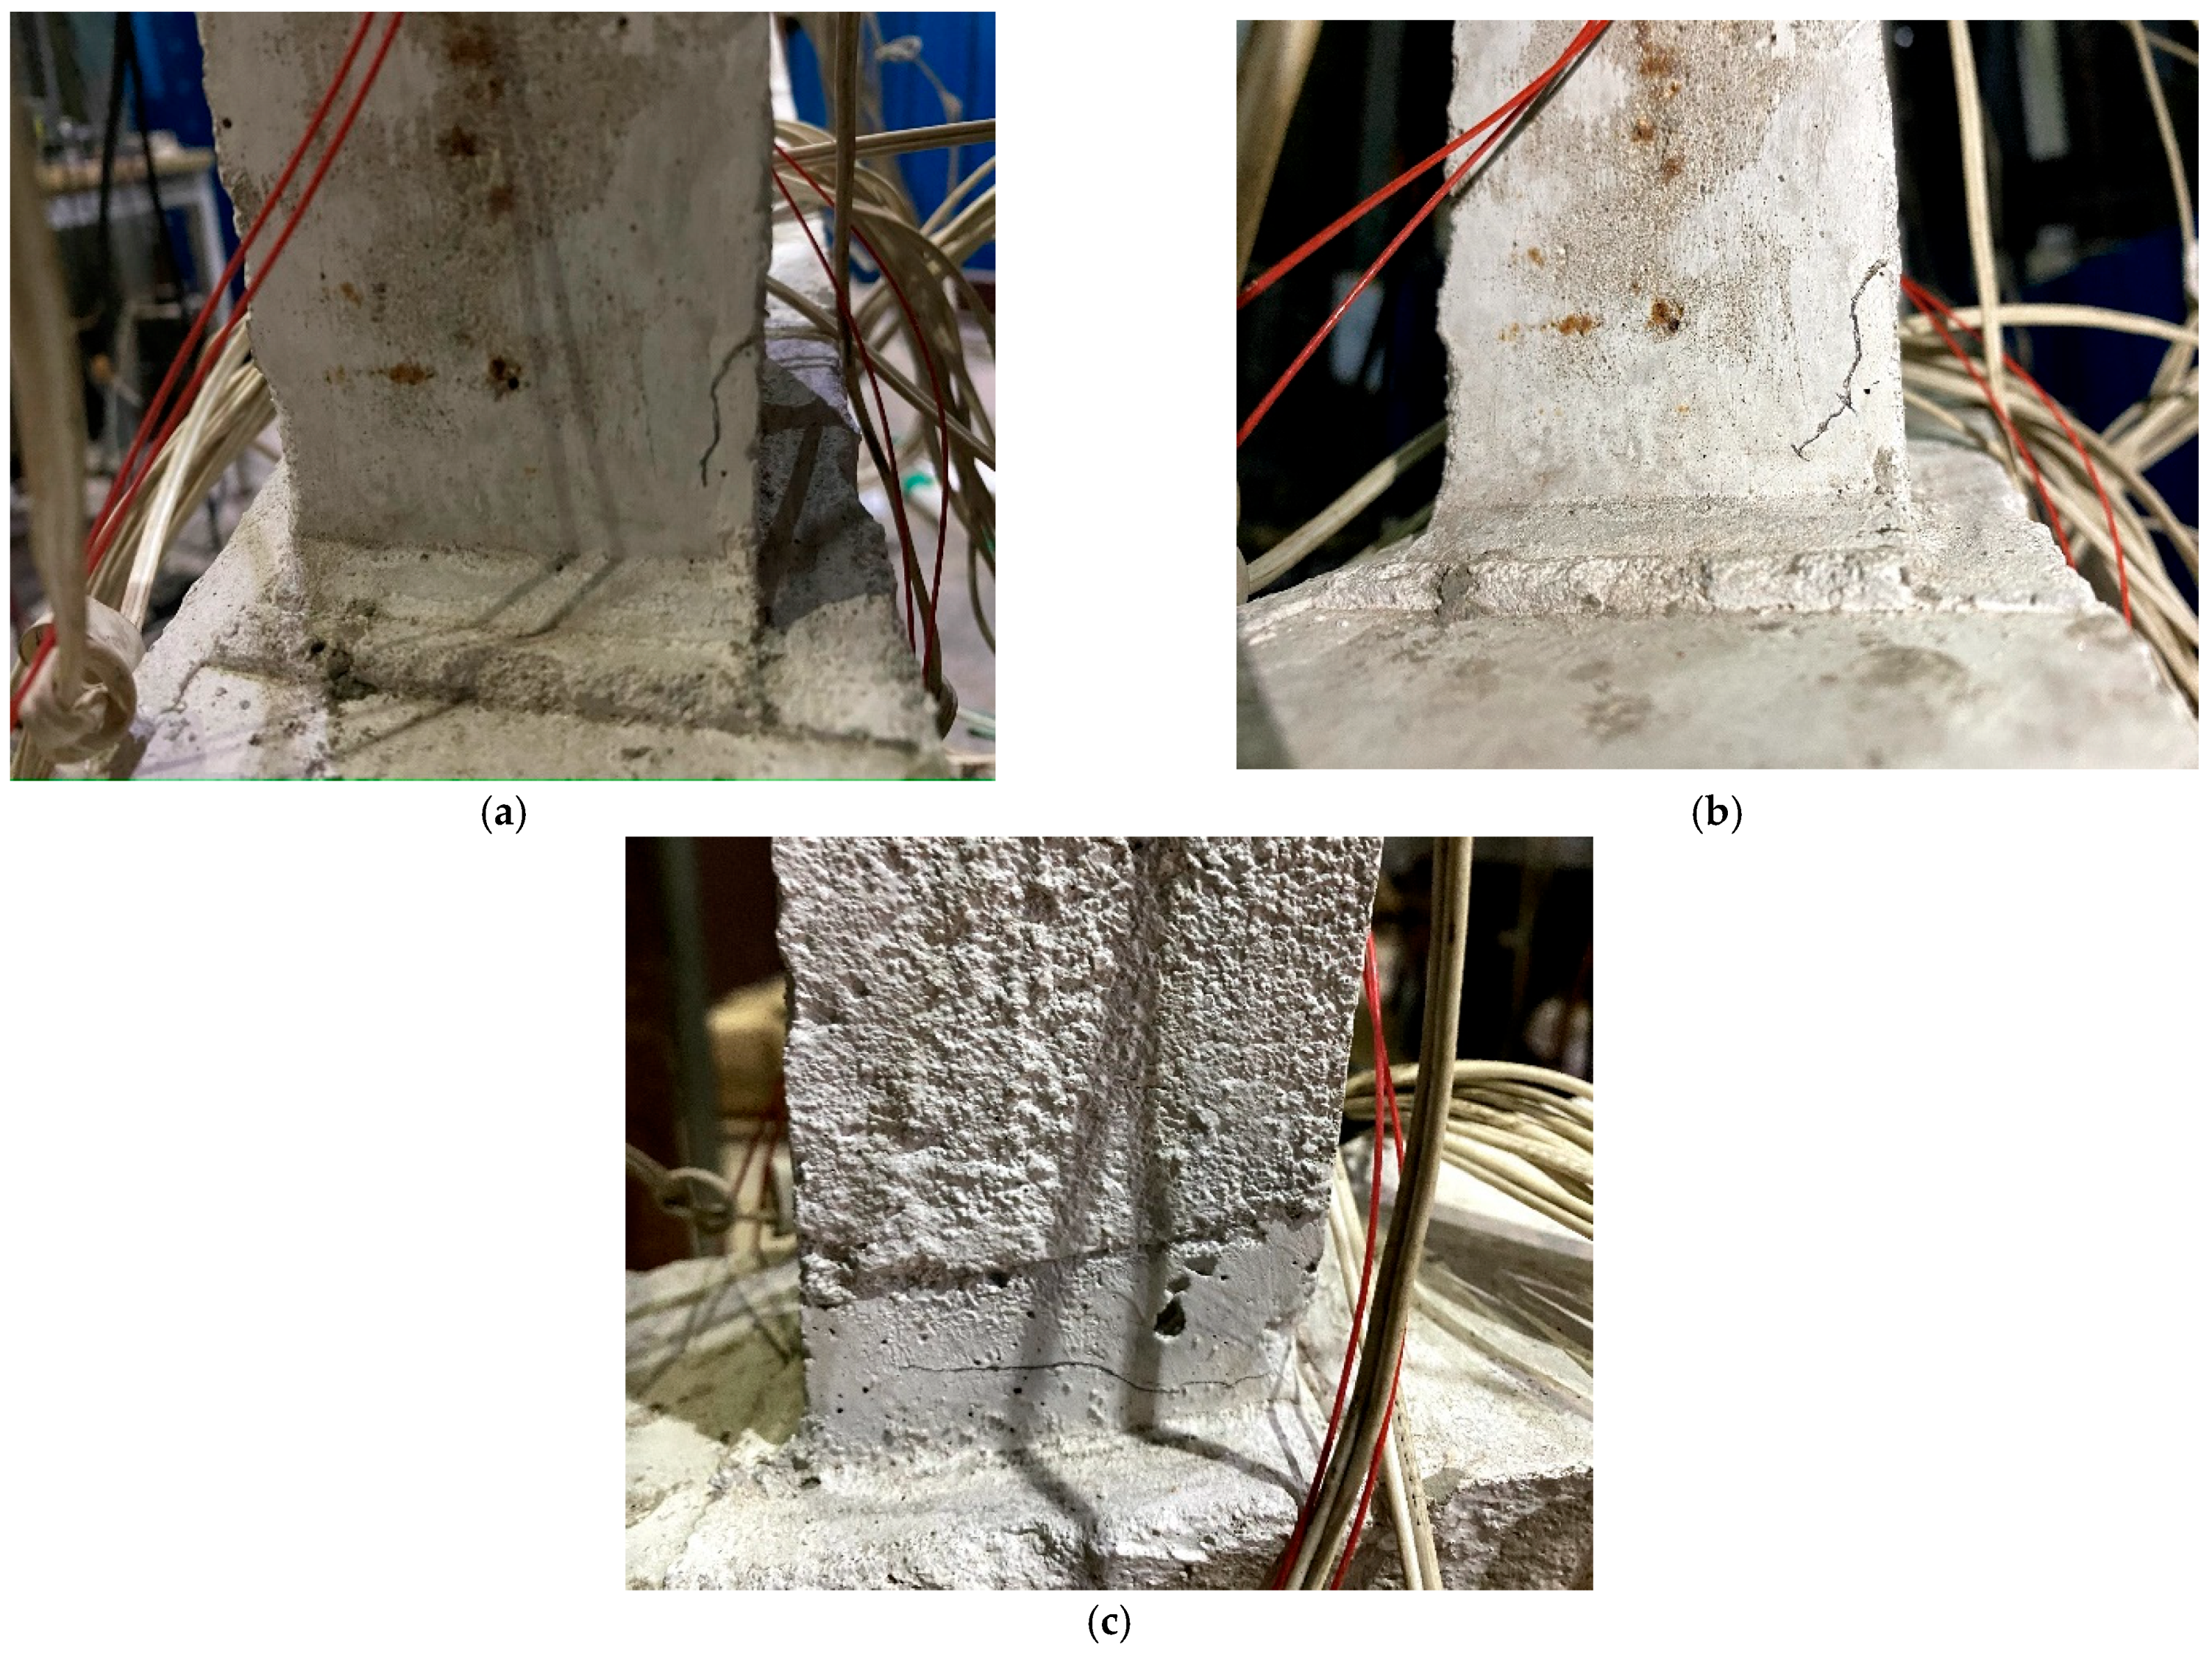
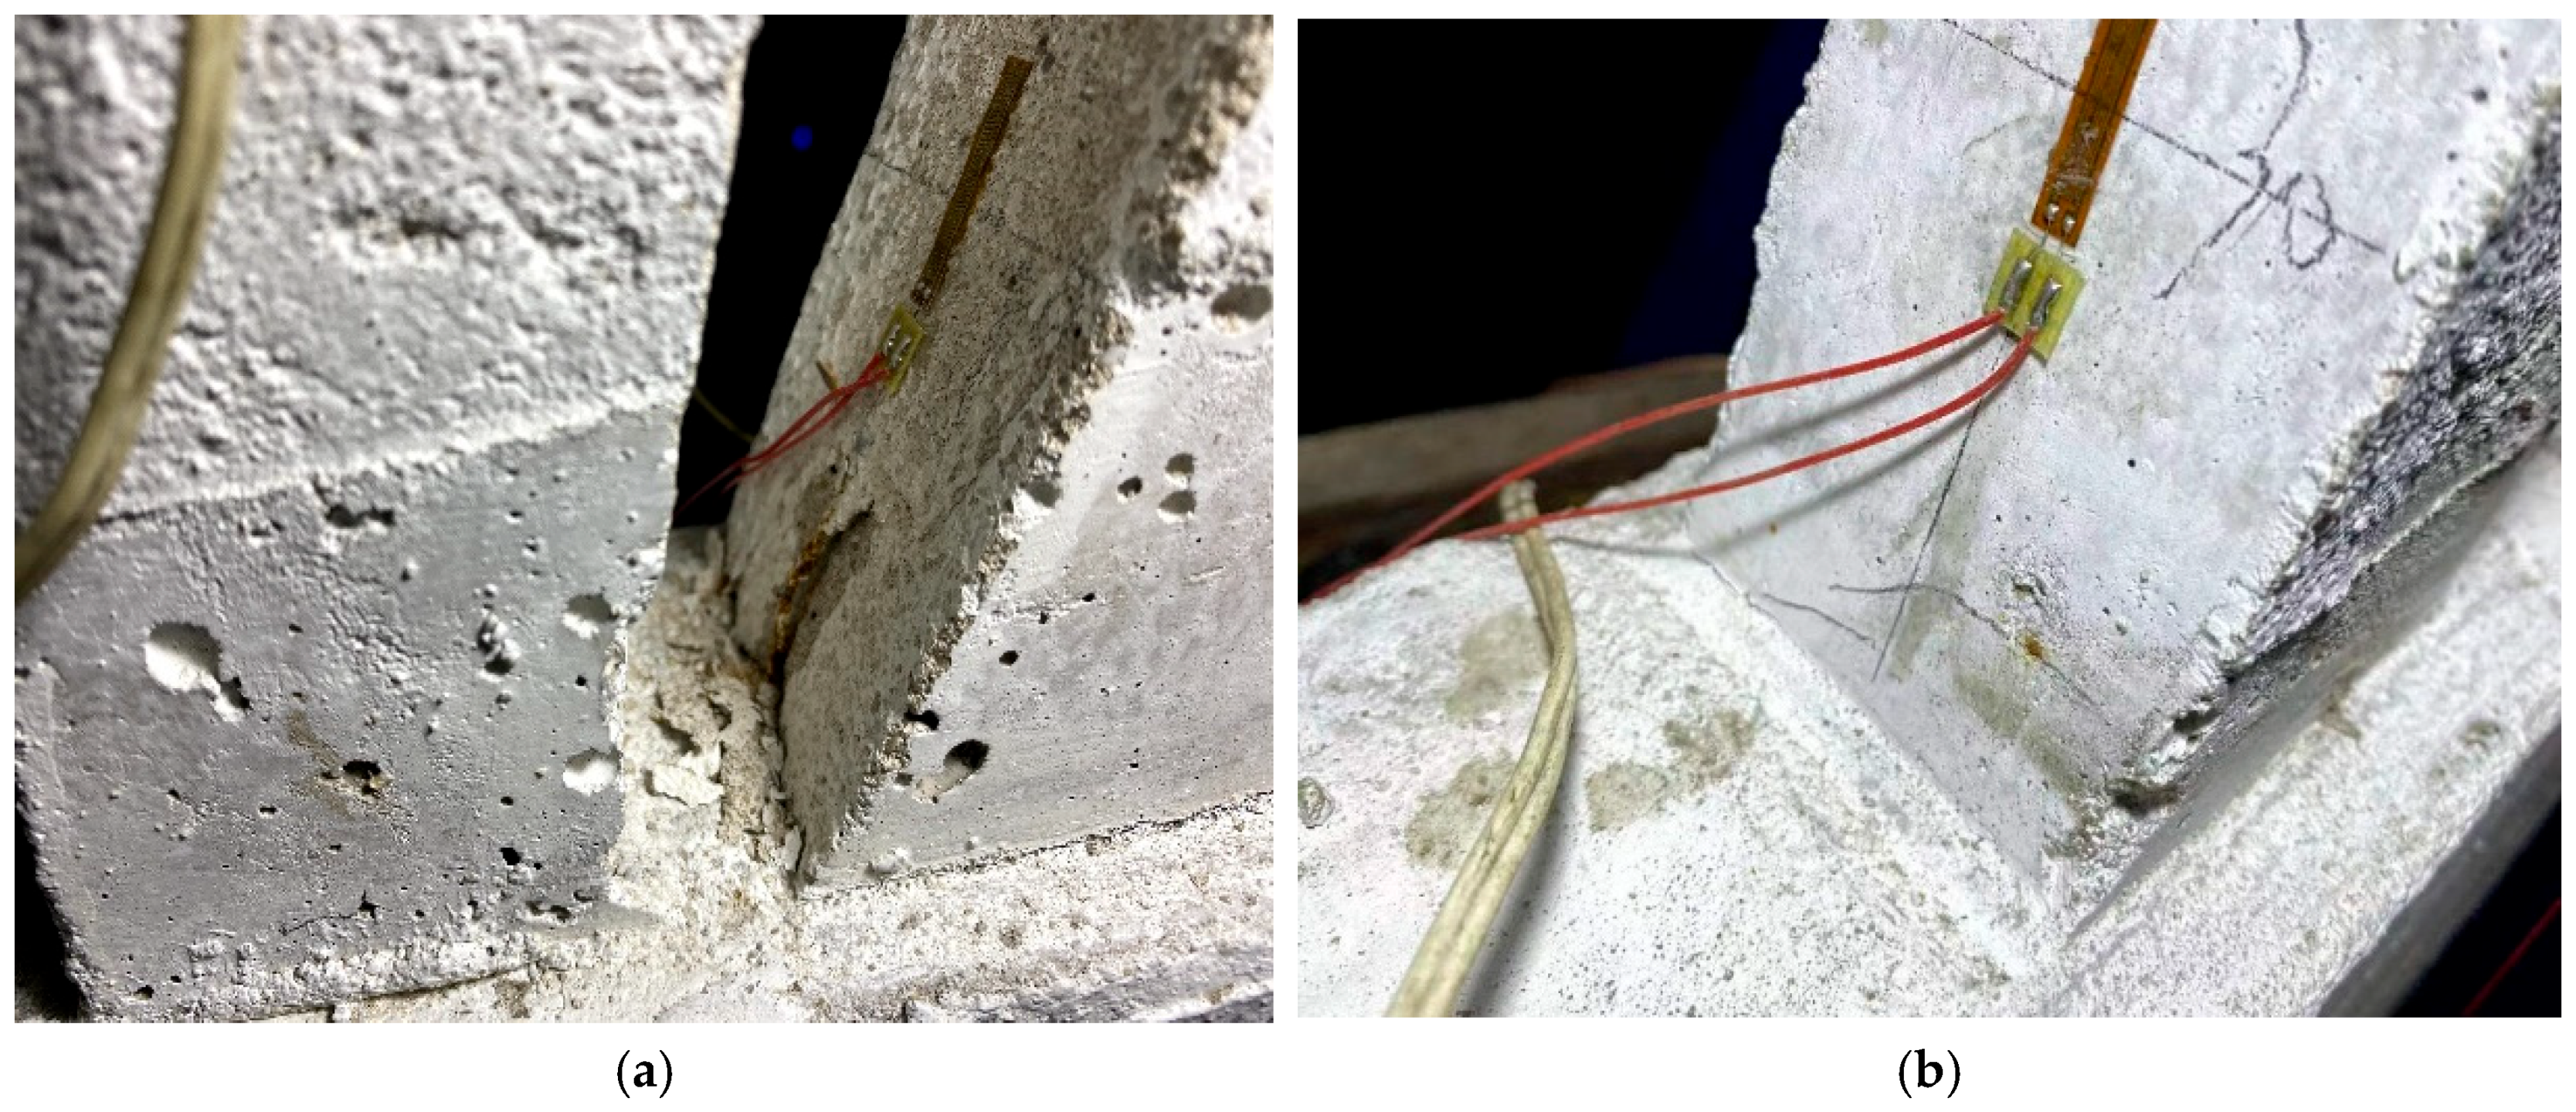
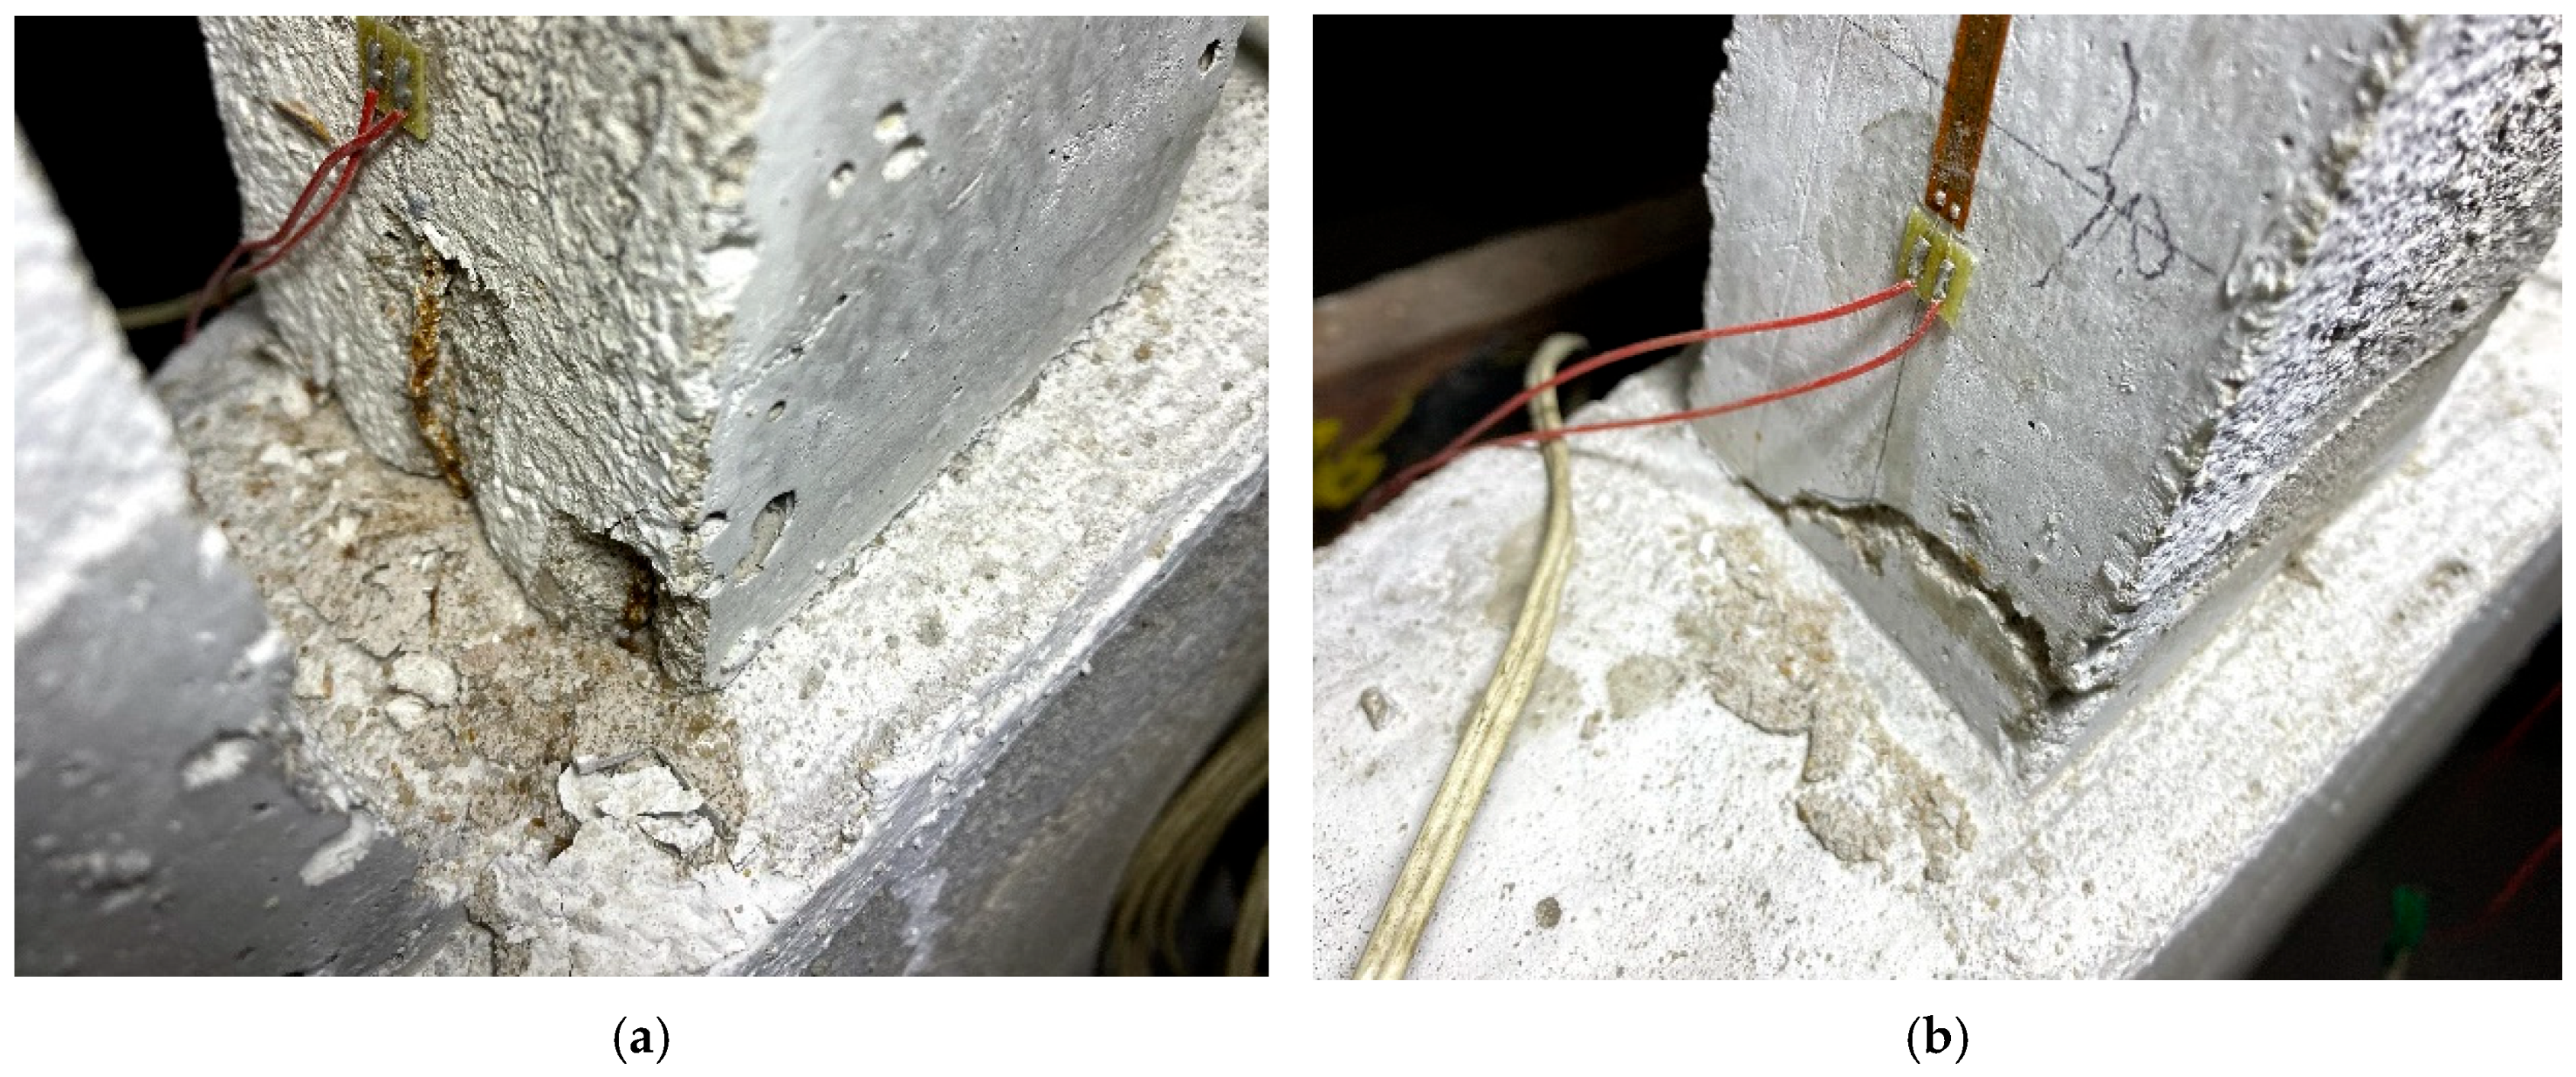
4.1. Damage of Pile
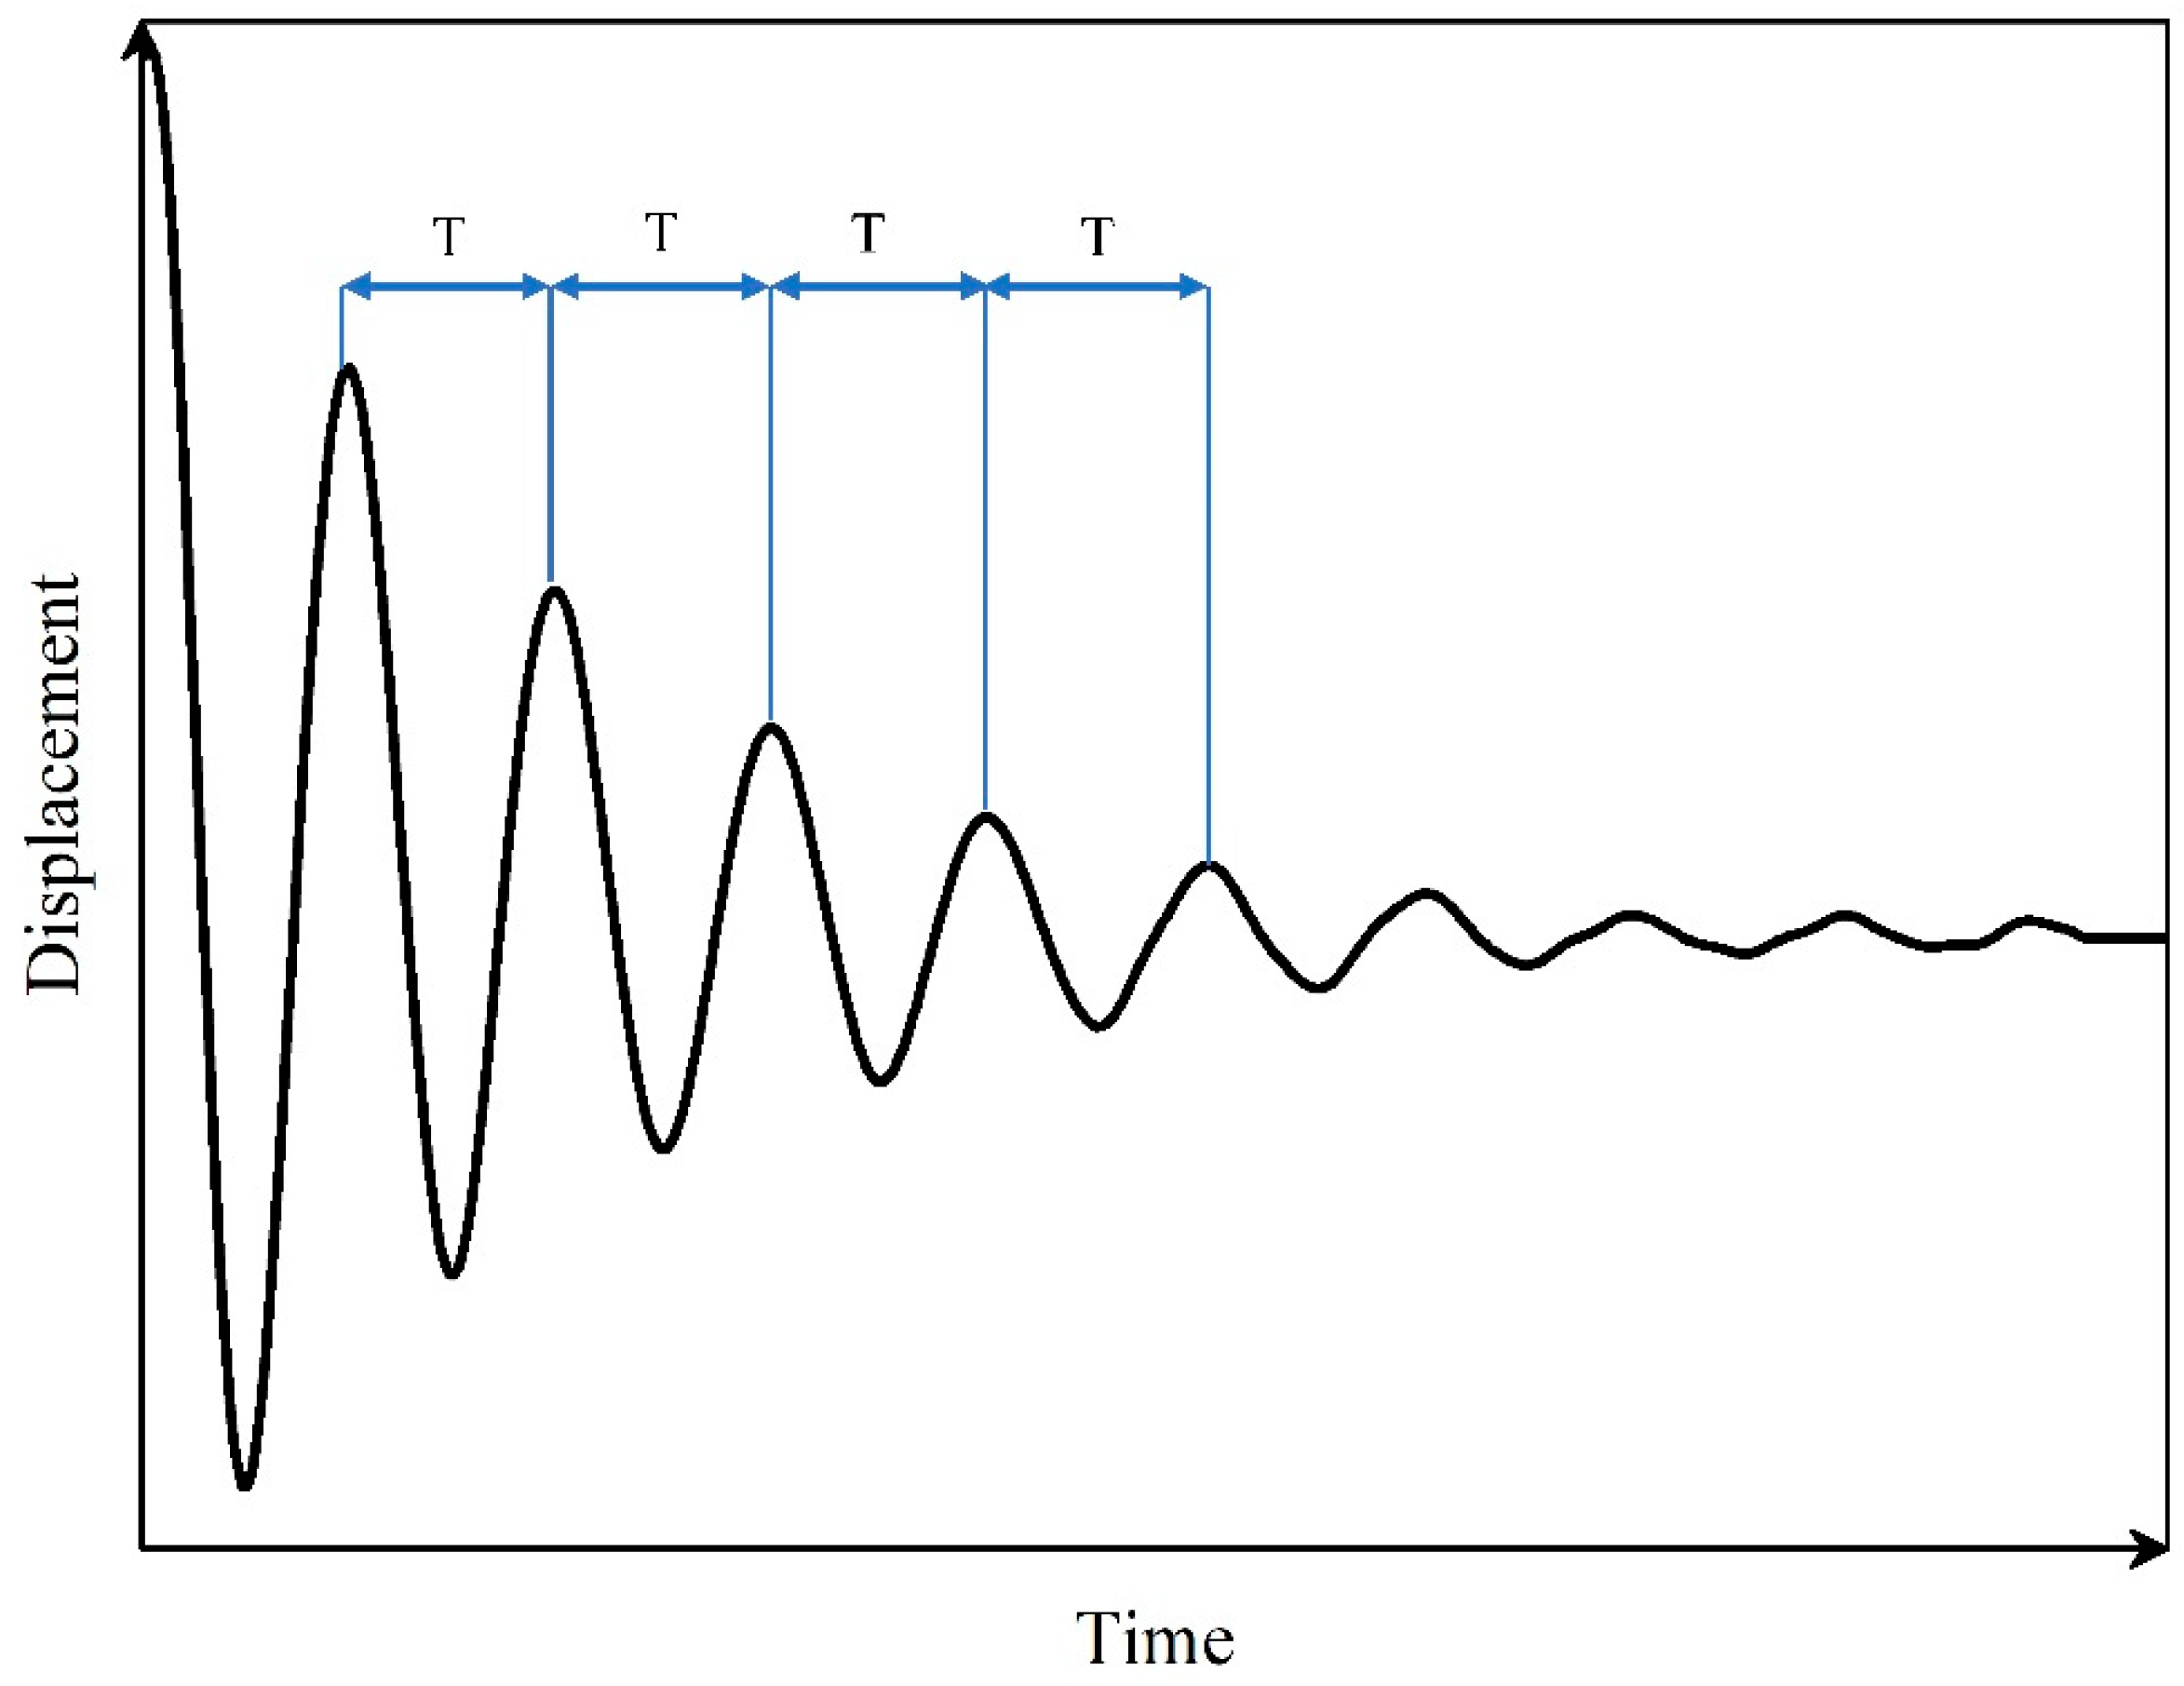
4.2. Displacement-Based Structural Dynamic Properties
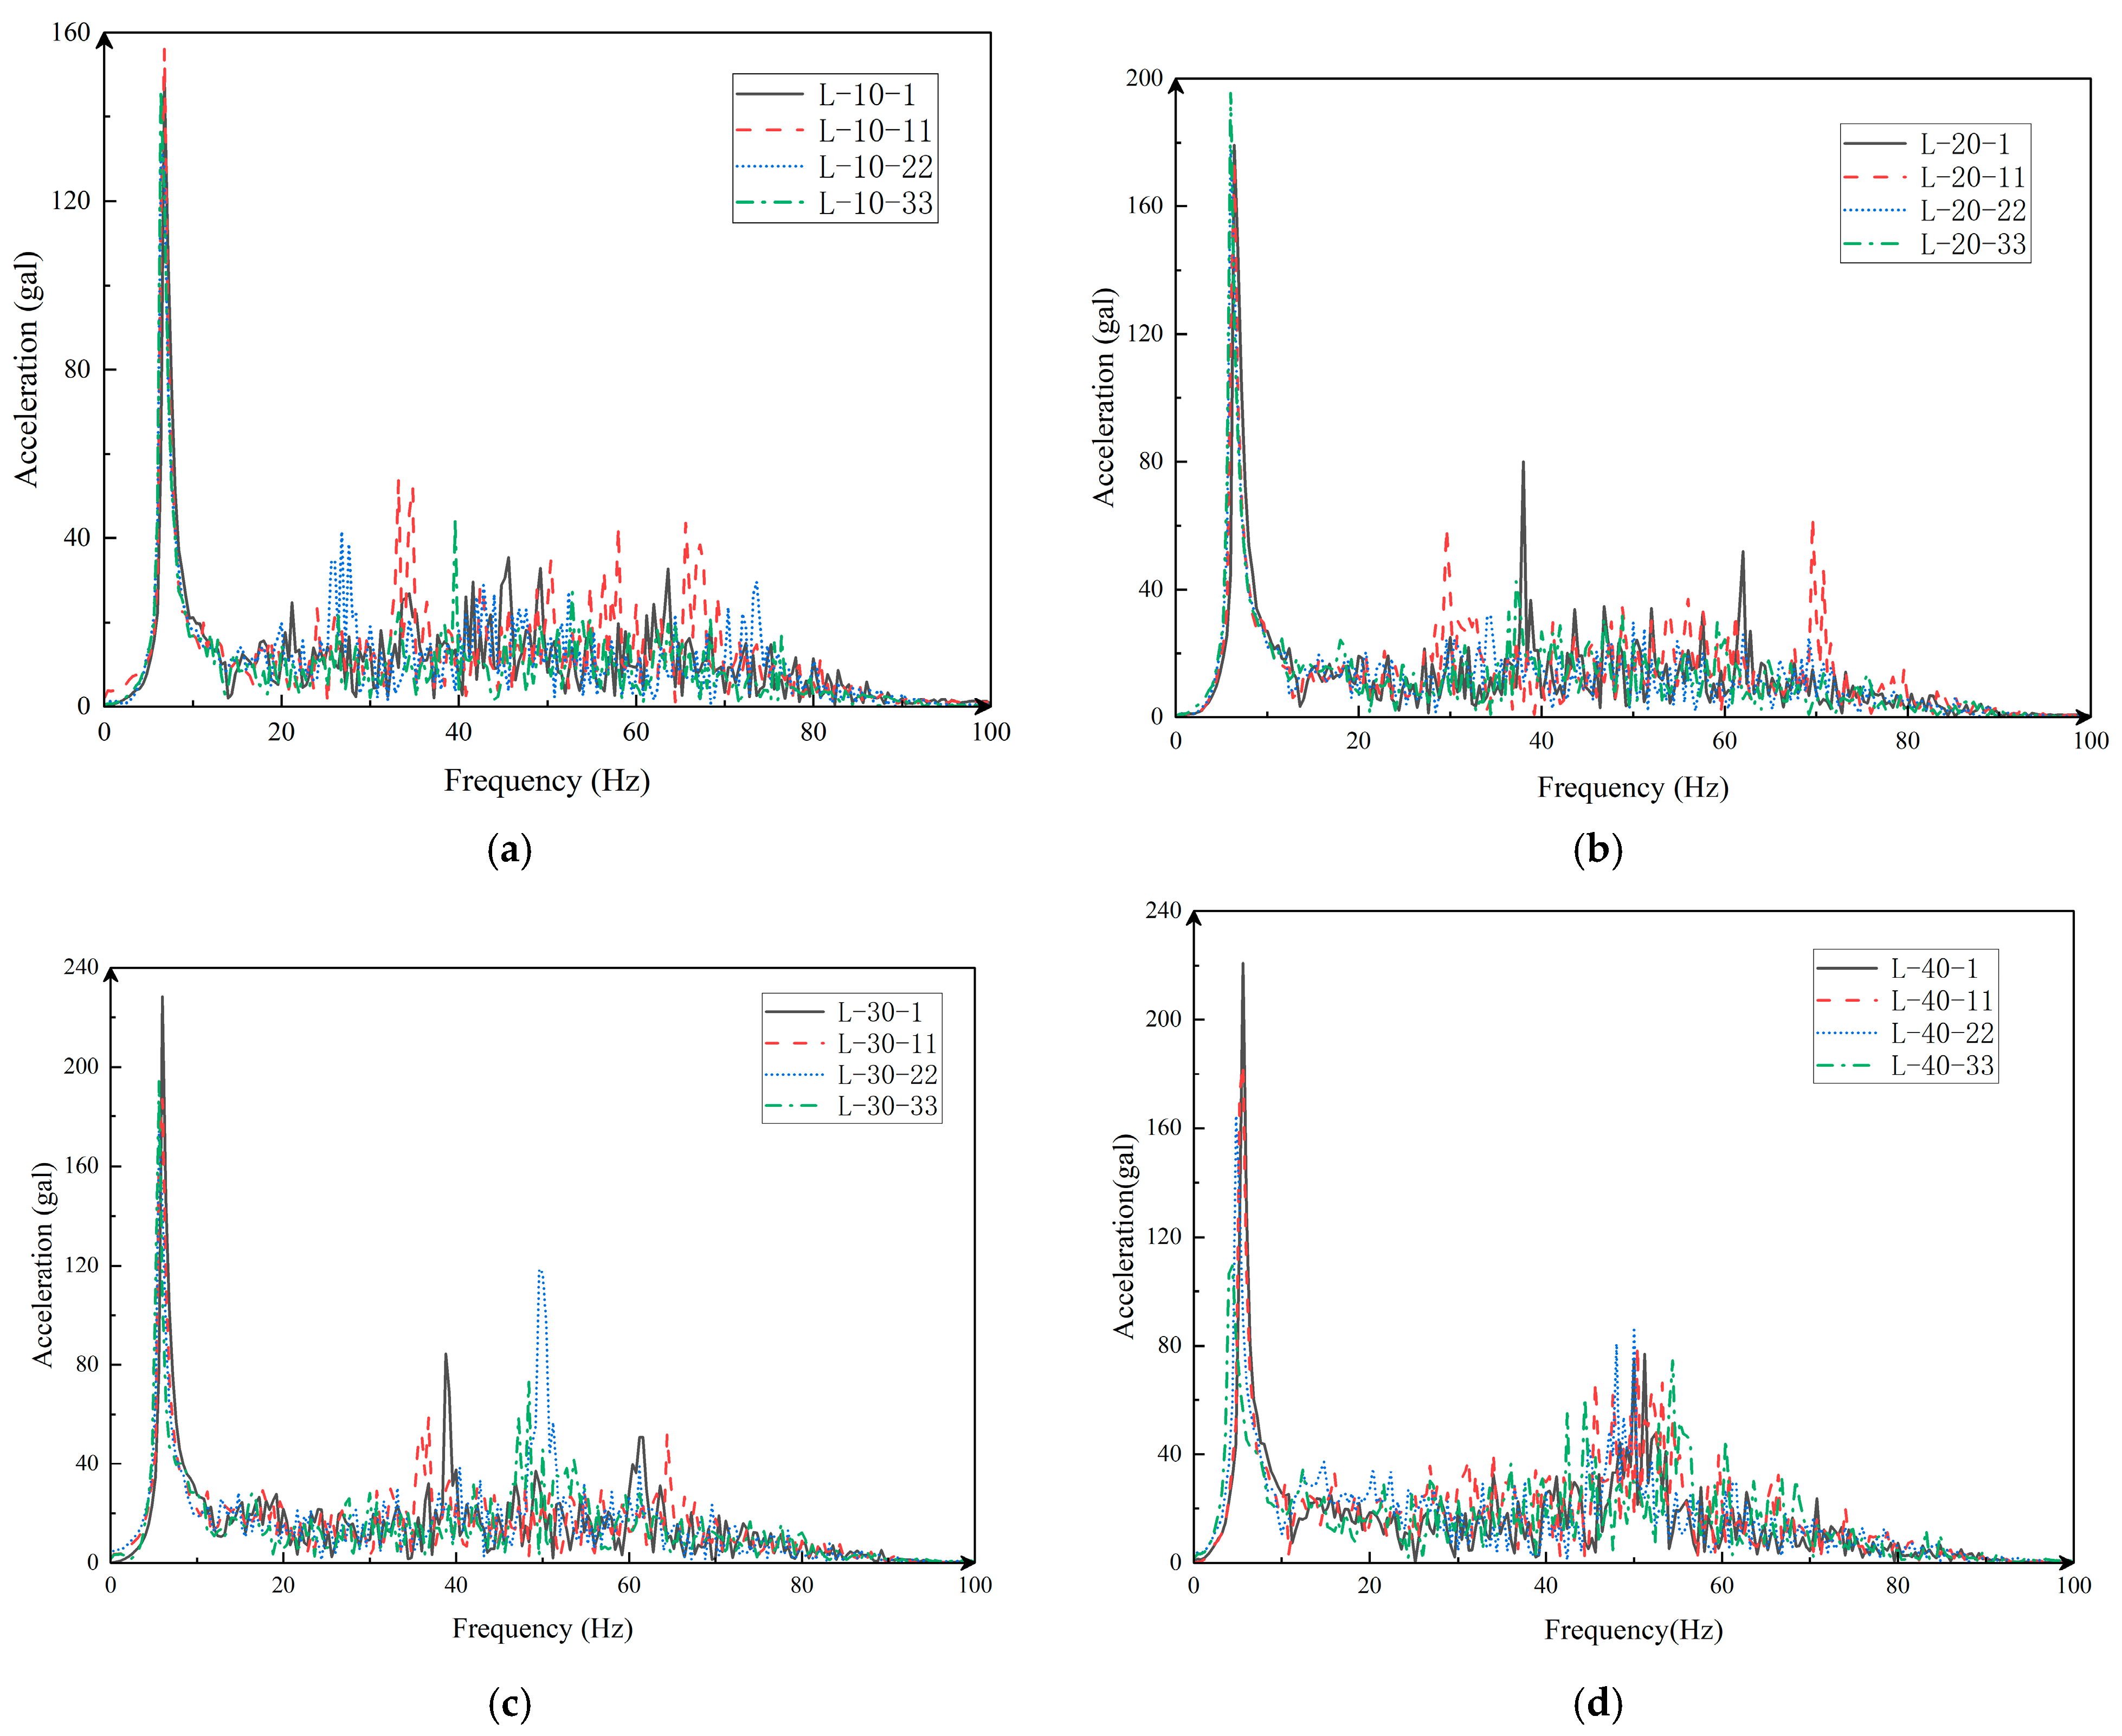
4.3. Acceleration-Based Structural Dynamic Properties
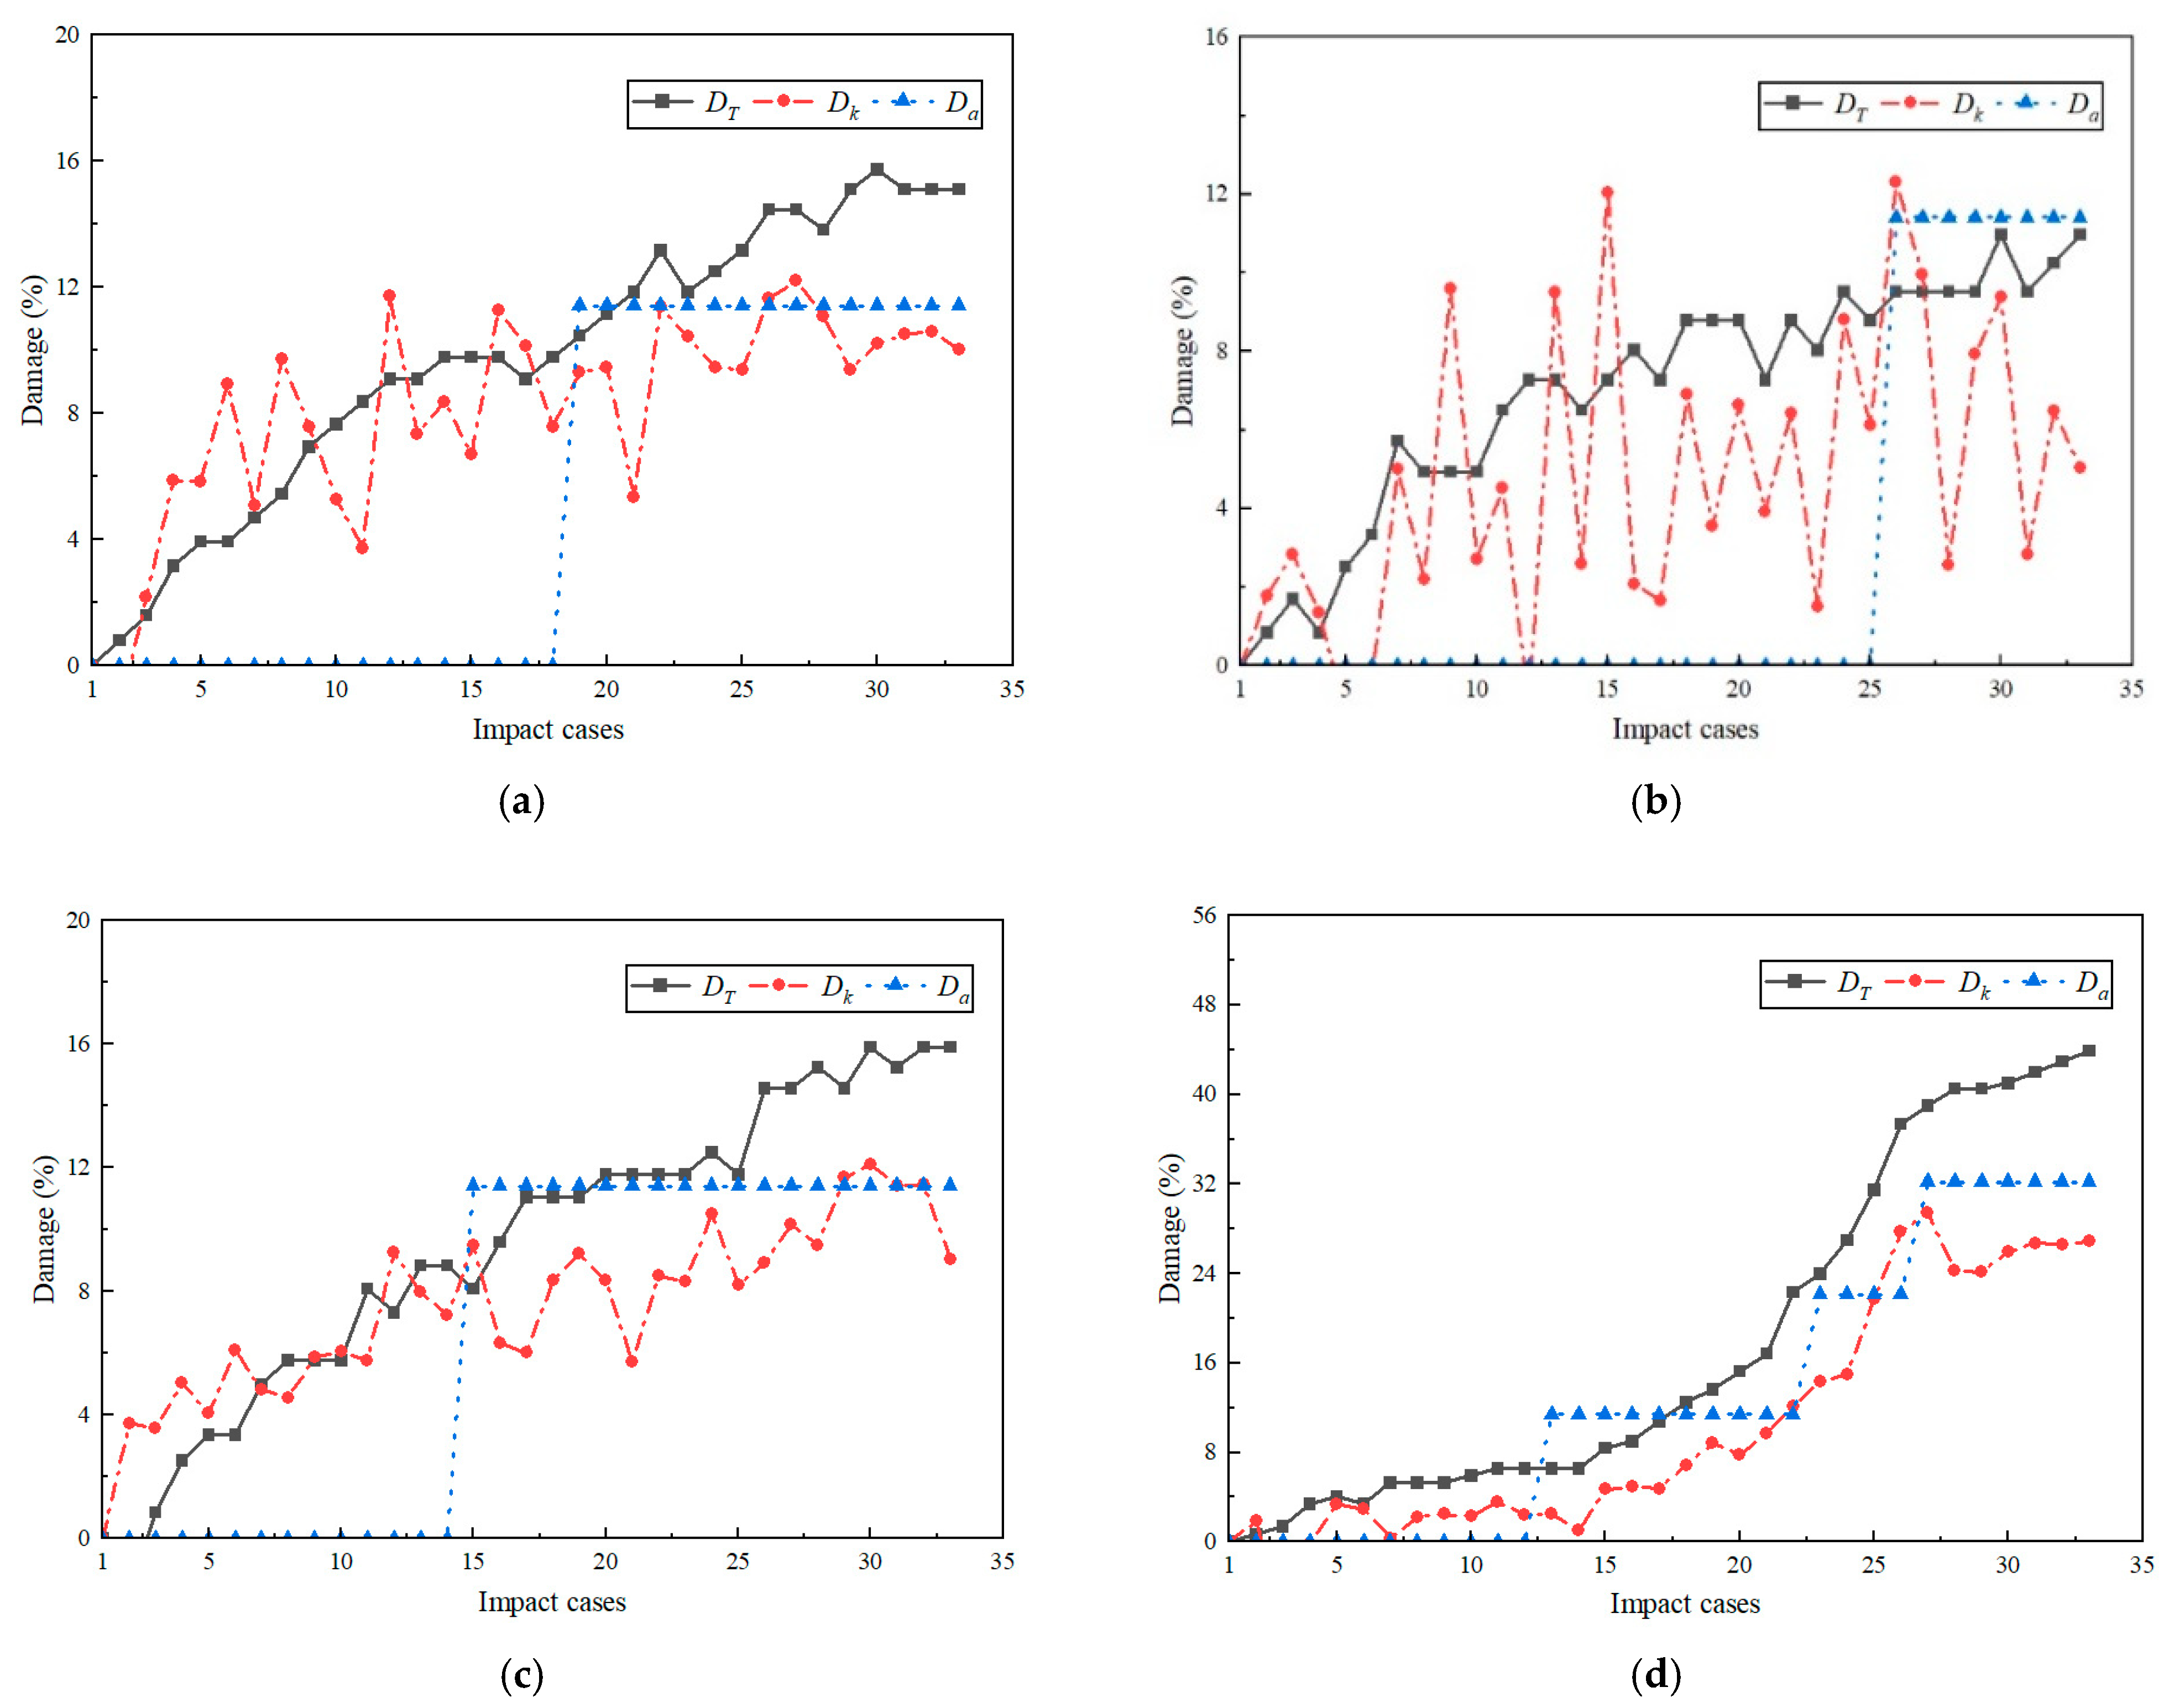
4.4. Damage Index
5. Conclusions
- (1)
- Damage to framed bents under horizontal impact loads mainly occurs at the bottom of the pile, and also occurs in the form of tensile damage. The inclined pile was damaged first. After the damage, the internal forces of the row frame were redistributed, and the damage to the straight piles showed properties from short piles to long piles. At the same time, the lateral force of the impact load will cause long straight piles to first experience lateral tensile damage. In subsequent similar tests, attention should be paid to the lateral restraint of the upper part of the rack.
- (2)
- Damage has a significant effect on the dynamic properties of the rack. The main symptoms are that an increase in damage decreases the self-oscillation period, increases the amplitude attenuation rate, and causes a decrease in first-order frequency after Fourier transformation based on acceleration data. At the same time, the precision of the Fourier spectrum frequency has a significant impact on identifying frequency changes. It is recommended that the sampling time can be increased in the future to increase the frequency precision after conversion.
- (3)
- Damage indexes based on stiffness, self-oscillation period, and acceleration can all be used to quantify rack damage. Affected by the precision of testing instruments, the stiffness data can reflect the damage trend, but they cannot accurately quantify the rack damage. The self-oscillation period of the structure can be easily obtained through a displacement meter, and at the same time, the damage index can better characterize the damage properties of the rack and quantify the damage degree, but the calculation results are too large. The damage index can effectively identify when cumulative damage has abruptly changed, while damage calculation results based on the first-order frequency are conservative.
Author Contributions
Funding
Institutional Review Board Statement
Informed Consent Statement
Data Availability Statement
Conflicts of Interest
References
- Liu, X.; Zhang, Y. Safety Assessment of Piled Wharf under Ship Impact force. Port Waterw. Eng. 2016, 4, 55–59. [Google Scholar]
- Xiao, F.; Hulsey, J.L.; Chen, G.S.; Xiang, Y. Optimal static strain sensor placement for truss bridges. Int. J. Distrib. Sens. Netw. 2017, 13, 1550147717707929. [Google Scholar] [CrossRef]
- Xiao, F.; Sun, H.; Mao, Y.; Chen, G.S. Damage identification of large-scale space truss structures based on stiffness separation method. Structures 2023, 53, 109–118. [Google Scholar] [CrossRef]
- Xiao, F.; Zhu, W.; Meng, X.; Chen, G.S. Parameter Identification of Frame Structures by considering Shear Deformation. Int. J. Distrib. Sens. Netw. 2023, 2023, 6631716. [Google Scholar] [CrossRef]
- Xiao, F.; Li, R.; Xing, L. Research on the Impact of Different Force Directions on the Mechanical Properties and Damage Evolution Law of Sandstone with Different Hole Diameters. Adv. Civ. Eng. 2021, 2021, 4247027. [Google Scholar] [CrossRef]
- Halder, P.; Manna, B.; Sur, A. Impact of Pile Head Rigidity on the Response of Piled Raft in Sand under Pseudo-Static Loading. Indian Geotech. J. 2020, 50, 810–824. [Google Scholar] [CrossRef]
- Cai, J.; Ye, J.-B.; Chen, Q.-J.; Liu, X.; Wang, Y.-Q. Dynamic behaviour of axially-loaded RC columns under horizontal impact loading. Eng. Struct. 2018, 168, 684–697. [Google Scholar] [CrossRef]
- Qu, H.; Li, G.; Chen, S.; Sun, J.; Sozen, M.A. Simplified Analysis model of Circular Concrete filled Steel Tube Specimen under Lateral Impact. J. Tongji Univ. (Nat. Sci.) 2011, 39, 35–41. [Google Scholar]
- Tang, J.P.; Xie, Y.F.; Liu, R.; Tang, W.Q. Research of the Pile Bent Property under the Horizontal Load. Appl. Mech. Mater. 2012, 204–208, 4465–4470. [Google Scholar] [CrossRef]
- Ye, J.-B.; Cai, J.; Liu, X.; Chen, Q.-J.; Zuo, Z.-L.; He, B.-Q. Experimental investigation of inclined RC pile groups under horizontal static and impact loads. Eng. Struct. 2021, 233, 111846. [Google Scholar] [CrossRef]
- Liu, L.; Chen, J.; Luo, C.; Hu, W. Dynamic Response and Damage Analysis of High Piled Wharf under Ship Impact. J. Harbin Eng. Univ. 2023, 44, 519–526. [Google Scholar]
- Zhao, L.; Zhang, F.; Peng, X.; Guo, J. Numerical simulation of dynamic response of wharf structures under underwater explosion impact. Eng. Blasting 2021, 27, 9. [Google Scholar]
- Yan, W.-J.; Ren, W.-X. Discussion of “Numerical methods for evaluating the sensitivity of element modal strain energy” [Finite elements in analysis and design 64 (2013) 13–23]. Finite Elem. Anal. Des. 2017, 137, 40–42. [Google Scholar] [CrossRef]
- Huang, Z.; Zang, C.; Zhang, G.; Friswell, M.I. Mode shape transformation for model error localization with modal strain energy. J. Sound Vib. 2020, 473, 115230. [Google Scholar] [CrossRef]
- Xu, M.; Wang, S.; Jiang, Y. Structural damage identification by a cross modal energy sensitivity based mode subset selection strategy. Mar. Struct. 2021, 77, 102968. [Google Scholar] [CrossRef]
- Hadjian Shahri, A.H.; Ghorbani-Tanha, A.K. Damage detection via closed-form sensitivity matrix of modal kinetic energy change ratio. J. Sound Vib. 2017, 401, 268–281. [Google Scholar] [CrossRef]
- Shu, Y.; Wu, J.; Zhou, S.; Wang, J.; Wang, W. Pile damage identification method for high-pile wharfs based on axial static strain distribution. Measurement 2021, 180, 109607. [Google Scholar] [CrossRef]
- Shu, Y.; Wu, J.; Zhou, S.; Wang, J. Identification of pile damage in high pile wharf by fiber Bragg grating sensor array. Opt. Precis. Eng. 2021, 29, 2349–2362. [Google Scholar] [CrossRef]
- Wang, Q.-M.; Zhu, R.-H.; Zheng, J.-H.; Wang, N.; Luo, M.-Y.; Che, Y.-F. A Method for the Damage Detection of Pile Foundation in High-Pile Wharf Based on A Curvature Mode Deletion Model. China Ocean Eng. 2020, 34, 871–880. [Google Scholar] [CrossRef]
- Khiem, N.T.; Hang, P.T.; Toan, L.K. Crack detection in pile by measurements of frequency response function. Nondestruct. Test. Eval. 2016, 31, 122–141. [Google Scholar] [CrossRef]
- Liu, H.; Li, H. Study on dynamic response of high- piled wharf under ship impact load considering pile-soil interaction. Earthq. Eng. Eng. Vib. 2015, 35, 50–57. [Google Scholar]
- Wang, Y.-Z.; He, L.-L. Simplified calculation methods for all-vertical-piled wharf in offshore deep water. China Ocean. Eng. 2017, 31, 182–191. [Google Scholar] [CrossRef]
- Xie, Y.; Liu, C.; Gao, S.; Tang, J.; Chen, Y. Lateral load bearing capacity of offshore high-piled wharf with batter piles. Ocean Eng. 2017, 142, 377–387. [Google Scholar] [CrossRef]
- Sun, X.; Wang, Y.; Zhao, B. Modal experiment of physical model of high pile wharf under environmental excitation. J. Vib. Meas. Diagn. 2013, 33, 263–268. [Google Scholar]
- Zhang, G.; Sun, X.; Wang, Q.; Zhang, Q. Damage diagnosis for high-piled wharf piles based on residual force vector. J. Vib. Shock. 2016, 35, 188–192. [Google Scholar]
- Cao, M.; Liu, J.; Ren, Q. Detection of small damages in foundation piles using optimal base wavelet. J. Vib. Shock. 2006, 25, 155–158. [Google Scholar]
- Xie, X. Research on Structural Damage Identification Technology of High-Pile Wharf Based on Dynamic Testing. China Water Transp. 2018, 18, 141–143. [Google Scholar]
- Qian, W.; Zhang, X.; Li, J.; Xing, J.; Xie, L. Damage Identification of Dock Bracing Structures Based on Kent Chaotic Bee Colony Algorithm. China Harb. Eng. 2017, 37, 42–47. [Google Scholar]
- Zhang, X.; Li, J.; Xing, J.; Wang, P.; Yang, Q. Damage Identification Method of Dock Bracing Based on Curvature Mode and Wavelet Transform. Water Transp. Eng. 2016, 6, 55–60. [Google Scholar]
- Li, X.; Su, J.; Ji, T.; Qin, W. Dynamic Damage Identification Method of High-Pile Wharf Piles. Water Transp. Eng. 2015, 10, 57. [Google Scholar]
- Chen, Z.; Chen, G. Structural dynamic response analysis using similitude theory and model test. J. Vib. Meas. Diagn. 2014, 34, 995–1000. [Google Scholar]
- Zhu, J.L.; Sun, L.T. Verification of m-method for determination of load on riles in soft-day ground. J. Tongji Univ. (Nat. Sci.) 2003, 31, 902–905. [Google Scholar]
- Wang, J.-P.; Su, J.-B.; Wu, F.; Zhang, Z.; Lv, Y. Lateral dynamic load tests of offshore piles based using the m-method. Ocean Eng. 2021, 220, 108413. [Google Scholar] [CrossRef]
- Zou, K.M.; Liu, X.P. Shear Distribution Coefficient Study of New Inland Large-Head Wharf Structure under Horizontal Force. Adv. Mater. Res. 2013, 639–640, 177–182. [Google Scholar] [CrossRef]
- Yue, C.; Zheng, Y. Shaking table test study on seismic behavior of underground structure with intermediate columns enhanced by concrete-filled steel tube (CFT). Soil Dyn. Earthq. Eng. 2019, 127, 105838. [Google Scholar] [CrossRef]
- Xiong, Z.; Chen, X.; Wang, Y.; Zhang, C.; Zhuge, Y. Shaking table tests on braced reinforced concrete frame structure across the earth fissure under earthquake. Struct. Des. Tall Spéc. Build. 2019, 28, e1559. [Google Scholar] [CrossRef]
- Yao, P.; Fang, H.; Zhu, L.; Zhu, J.; Han, J.; Wan, Y.; Zhang, X. Experimental study on the behavior of precast segmental piers under ship impact loading. Ocean Eng. 2022, 253, 111324. [Google Scholar] [CrossRef]


| Pile Number | 1 | 2 | 3 | 4 | 5 | 6 |
|---|---|---|---|---|---|---|
| Calculate Length | 14.40 | 13.00 | 11.40 | 12.40 | 9.80 | 8.55 |
| Soil Layer Serial No. | Soil Layer Name | Severe (KN/m3) | Adhesion (kPa) | Internal Friction Angle (°) | Soil Thickness (m) |
|---|---|---|---|---|---|
| 1 | Sandy silt | 19 | 5 | 37 | 5.8 |
| 2 | Clay | 17.5 | 11 | 14.5 | 7.0 |
| 3 | Silty clay | 19.8 | 0 | 19.0 | 5.9 |
| 4 | Sandy silt | 18.7 | 5 | 34.0 | 9.5 |
| Parameter | Symbol | Dimension | M | L | T |
|---|---|---|---|---|---|
| Stress | 1 | −1 | −2 | ||
| Force | F | 1 | 1 | −2 | |
| Cross-sectional area | A | 0 | 2 | 0 | |
| Density | 1 | −3 | 0 | ||
| Stiffness | K | 1 | 2 | −2 | |
| Acceleration | a | 0 | 1 | −2 |
| Physical Quantity | Similarity Criteria | Similarity Relation | Similarity Ratio |
|---|---|---|---|
| External Force F | 1/500 | ||
| Displacements | 1/5 | ||
| Cross-sectional area A | 1/100 | ||
| Stiffness k | 1/50 | ||
| Acceleration a | 2/1 |
| Rating | Silicate Cement | Sand | Lime | Water |
|---|---|---|---|---|
| C8 | 1 | 6.0 | 0.6 | 0.5–0.6 |
| Pile Number | 1 | 2 | 3 | 4 | 5 | 6 |
|---|---|---|---|---|---|---|
| Calculate Length | 1.44 | 1.30 | 1.14 | 1.24 | 0.98 | 0.86 |
| Working Conditions | 1 | 2 | 3 | 4 |
|---|---|---|---|---|
| Descending Height | 10 | 20 | 30 | 40 |
| Working Conditions | Impact Group | Period T (s) | Period Difference (s) | Difference Percentage (%) |
|---|---|---|---|---|
| L-10 | 1 | 0.152 | 0 | 0 |
| 11 | 0.152 | 0 | 0 | |
| 22 | 0.153 | 0.001 | 0.6 | |
| 33 | 0.155 | 0.002 | 1.3 | |
| L-20 | 1 | 0.160 | 0 | 0 |
| 11 | 0.160 | 0 | 0 | |
| 22 | 0.162 | 0.002 | 1.3 | |
| 33 | 0.165 | 0.003 | 1.9 | |
| L-30 | 1 | 0.166 | 0 | 0 |
| 11 | 0.172 | 0.006 | 3.6 | |
| 22 | 0.175 | 0.009 | 5.4 | |
| 33 | 0.183 | 0.017 | 9.8 | |
| L-40 | 1 | 0.182 | 0 | 0 |
| 11 | 0.187 | 0.005 | 2.7 | |
| 22 | 0.204 | 0.017 | 9.3 | |
| 33 | 0.242 | 0.06 | 32.9 |
| Working Conditions | Impact Group | Frequency f (Hz) | Frequency Difference (Hz) | Difference Percentage (%) |
|---|---|---|---|---|
| L-10 | 1 | 6.8 | 0 | 0 |
| 11 | 6.8 | 0 | 0 | |
| 22 | 6.8 | 0 | 0 | |
| 33 | 6.4 | −0.4 | −5.8 | |
| L-20 | 1 | 6.8 | 0 | 0 |
| 11 | 6.8 | 0 | 0 | |
| 22 | 6.4 | −0.4 | −5.8 | |
| 33 | 6.4 | −0.4 | −5.8 | |
| L-30 | 1 | 6.8 | 0 | 0 |
| 11 | 6.8 | 0 | 0 | |
| 22 | 6.4 | −0.4 | −5.8 | |
| 33 | 6.4 | −0.4 | −5.8 | |
| L-40 | 1 | 6.8 | 0 | 0 |
| 11 | 6.8 | 0 | 0 | |
| 22 | 6.4 | −0.8 | −11.6 | |
| 33 | 6.0 | −1.2 | −32.2 |
Disclaimer/Publisher’s Note: The statements, opinions and data contained in all publications are solely those of the individual author(s) and contributor(s) and not of MDPI and/or the editor(s). MDPI and/or the editor(s) disclaim responsibility for any injury to people or property resulting from any ideas, methods, instructions or products referred to in the content. |
© 2024 by the authors. Licensee MDPI, Basel, Switzerland. This article is an open access article distributed under the terms and conditions of the Creative Commons Attribution (CC BY) license (https://creativecommons.org/licenses/by/4.0/).
Share and Cite
Zheng, Y.; Xiao, F.; Zhang, R.; Pan, T.; Lan, X.; Xu, X.; Hou, C. Experimental Investigation and Damage Identification of High-Pile Wharf Framed Bents under Horizontal Impact Loads. Sensors 2024, 24, 563. https://doi.org/10.3390/s24020563
Zheng Y, Xiao F, Zhang R, Pan T, Lan X, Xu X, Hou C. Experimental Investigation and Damage Identification of High-Pile Wharf Framed Bents under Horizontal Impact Loads. Sensors. 2024; 24(2):563. https://doi.org/10.3390/s24020563
Chicago/Turabian StyleZheng, Yonglai, Fei Xiao, Ruxue Zhang, Tanbo Pan, Xin Lan, Xubing Xu, and Chenyu Hou. 2024. "Experimental Investigation and Damage Identification of High-Pile Wharf Framed Bents under Horizontal Impact Loads" Sensors 24, no. 2: 563. https://doi.org/10.3390/s24020563
APA StyleZheng, Y., Xiao, F., Zhang, R., Pan, T., Lan, X., Xu, X., & Hou, C. (2024). Experimental Investigation and Damage Identification of High-Pile Wharf Framed Bents under Horizontal Impact Loads. Sensors, 24(2), 563. https://doi.org/10.3390/s24020563