Abstract
In recent years, hydrogen energy has garnered attention as a potential solution for mitigating greenhouse gas emissions. However, concerns regarding the inherent risk of hydrogen gas leakage and potential explosions have necessitated the development of advanced sensors. Within our research group, we have innovated an ultrathin platinum (Pt) film hydrogen sensor that gauges resistance changes in Pt thin films when exposed to hydrogen gas. Notably, the sensitivity of each sensor is contingent upon the thickness of the Pt film. To address the challenge of detecting hydrogen using multiple sensors, we integrated the ultrathin Pt film as a resistance element within a twin-T type notch filter. This filter exhibits a distinctive reduction in output signals at a specific frequency. The frequency properties of the notch filter dynamically alter with changes in the resistance of the Pt film induced by hydrogen exposure. Consequently, the ultrathin Pt film hydrogen sensor monitors output signal variations around the notch frequency, responding to shifts in frequency properties. This innovative approach enables the electrical control of sensor sensitivity by adjusting the operating frequency in proximity to the notch frequency. Additionally, the simultaneous detection of hydrogen by multiple sensors was successfully achieved by interconnecting sensors with distinct notch frequencies in series.
1. Introduction
The excessive emission of greenhouse gases from fossil fuel usage is a critical contributor to global warming, causing environmental destruction and abnormal weather patterns. To combat this, renewable energy has emerged as a promising alternative, with hydrogen energy standing out due to its high efficiency and stable supply [1,2,3]. However, hydrogen gas (H2) presents safety concerns, given its potential for easy leakage and explosive reactions. Hence, the development of a sensor capable of early H2 detection is imperative for ensuring safety.
Various hydrogen sensors [4] are currently available, including metal oxide semiconductors (MOSs) [5,6], catalytic-combustion (CC) types [7,8,9], field-effect transistors (FETs) [10,11,12], and resistance change (RC) types [13,14]. The MOS-type sensor measures resistance changes on MOSs when exposed to H2. This sensor has advantages, such as fast response time and high sensitivity at 300 °C. The CC-type sensor measures the temperature change of a catalytic metal film, such as Pt and Pd, when exposed to H2. Despite being less influenced by ambient conditions, this sensor typically operates at higher temperatures, resulting in increased energy consumption for heating. In contrast, the FET-type sensor, operating at lower temperatures without a heater, offers lower energy consumption and relatively high sensitivity by measuring the change in the work function of the catalytic metal film on the gate electrode. However, its fabrication process is complex. The RC-type sensor, comprising Pd thin films on a substrate, has a simpler fabrication process than the FET-type sensor. It measures the resistance change of Pd due to H2 absorption, but Pd films may irreversibly degrade due to volume changes during absorption and dissociation of H2 [15].
In our research group, we have proposed and developed an ultrathin Pt film hydrogen sensor [16,17,18,19]. Pd films absorb hydrogen molecules and expand, but the state of Pt does not change with H2 exposure. Therefore, Pt film sensors are more durable against H2 exposure. H2 dissociates on the surface of Pt films, injecting electrons into Pt films and causing a decrease in resistance. Several studies have also explored sensors to detect H2 using metal-catalyzed gasochromism semiconductors [20]. Similar to those proposed herein, such sensors employ electrons generated by the catalytic reaction. These sensors use semiconductors, which makes it easy to tune their properties. However, those proposed here are based on single films, making their fabrication on polymers easy. Also, two challenges require attention in this sensor. First, variations in sensitivity among sensors arise from slight differences in Pt film thickness, posing a challenge for using multiple sensors in the same environment. Second, employing multiple sensors for hydrogen detection necessitates multiple power supplies and outputs. To overcome these challenges, we have developed a new sensor by incorporating ultrathin Pt films into a twin-T type notch filter circuit [21,22] as resistors. The objective is to create a sensor with adjustable sensitivity and the capability for simultaneous detection by multiple sensors. Additionally, for practical use, we assessed the detection limit of H2 and evaluated gas selectivity against H2.
2. Materials and Methods
Figure 1a illustrates the structure of the ultrathin Pt film hydrogen sensor, consisting of three layers: silicon, titanium nitride (TiN), and Pt. Using the sputtering method [23,24] in a vacuum (2.5 × 10⁻⁴ Pa), TiN and Pt were deposited on a silicon substrate, with thicknesses of 20 nm and 10 nm, respectively. The sensor was bonded to the substrate through a bonding wire. Figure 1b presents the equivalent circuit of the twin-T type notch filter circuit. In this study, the ultrathin Pt film hydrogen sensors were incorporated as resistors (R12 and R34) into a twin-T type notch filter circuit. This circuit is characterized by a reduction in output signals at a specific frequency, known as the notch frequency (), which can be determined by
where C is capacitance, and R is resistance.
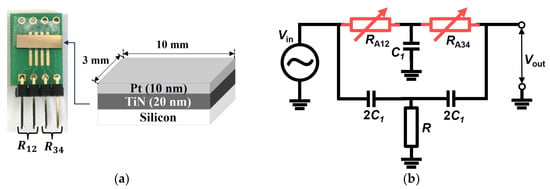
Figure 1.
(a) The structure of the ultrathin Pt film hydrogen sensor with a length of 3 mm and a width of 10 mm; (b) the equivalent circuit of a twin-T; a notch filter circuit combining a low pass filter and a high pass filter in a T-shaped connection.
Similar to the earlier-discussed ultrathin Pt film hydrogen sensors, the resistance decreases with increasing H2 concentration. Since the Pt film serves as the resistive component of the circuit, the notch frequency shifts upon exposure to H2. Figure 2 schematically illustrates the frequency dependence of amplitude and phase before and after H2 exposure, showing a slight increase in the notch frequency. Consequently, the concentration of H2 can be measured by assessing the amplitude and/or phase of the output signals () operating at the frequency (). The sensitivity (S) is given by the equation
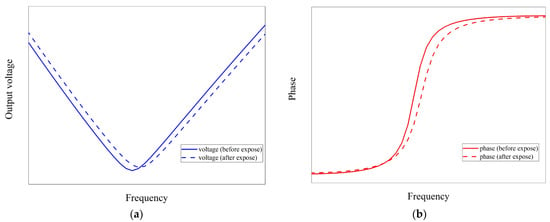
Figure 2.
Schematic depicting the frequency dependence of (a) amplitude and (b) phase before and after exposure to H2. The blue graph represents voltage, and the red graph represents phase as a function of frequency. The solid line corresponds to conditions before exposure to H2, while the dotted line represents conditions after exposure.
Since sensitivity depends on differential properties with frequency, it can be electrically controlled by altering the operating frequency.
The measurement system configuration is shown in Figure 3. Various gases were controlled using a gas switcher, and the flow rate was set to 1 L/min with a gas flow meter. The air gas was balanced by 20% oxygen and 80% nitrogen gas, maintaining a pressure of 1 atm, while H2 was balanced by the air gas. Precise H2 concentrations were achieved using a gas switcher. The ultrathin Pt film within the chamber was exposed to these gases, and the amplitude and phase of the output signals were measured by applying input from an AC voltage source.
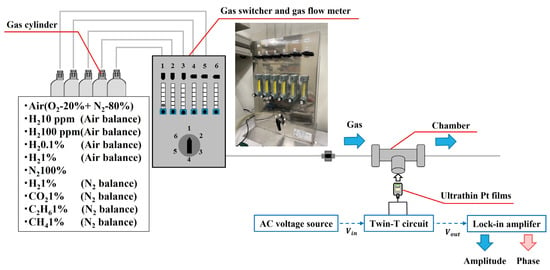
Figure 3.
Configuration of the measurement system. Various gases flow from gas cylinders to the chamber through a gas switcher.
As the sensor operates only at signal inputs near the notch frequency, the operation of multiple sensors is independent of frequency. Thus, simultaneous hydrogen detection by multiple sensors was achieved by connecting three sensors with distinct notch frequencies (Sensor A: = 1.2 kHz, Sensor B: = 12.7 kHz, Sensor C: = 58.2 kHz) in series for frequency division detection (Figure 4). During 5 min of exposure to air gas and H2, the output voltage was sampled for the composite wave signal of each sensor’s notch frequency. Frequency analyses were conducted using FFT. Additionally, the voltage was repeatedly sampled while the sensor was exposed to air gas and H2, and the power spectrum was measured at each frequency resolution ( [Hz]) in real-time. The number of samples was 4096, and the sampling rate was 30,000 [S/s].
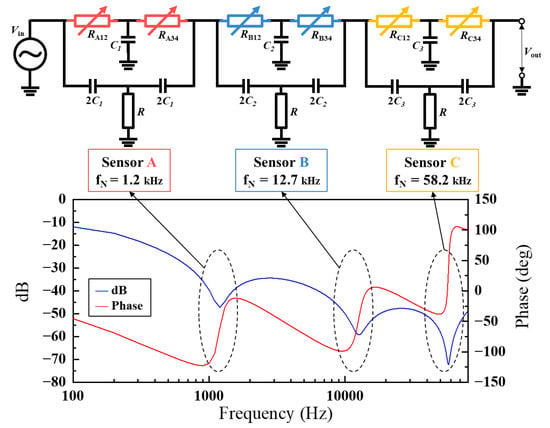
Figure 4.
The series circuit of the sensors with different notch frequencies (Sensor A: = 1.2 kHz, Sensor B: = 12.7 kHz, Sensor C: = 58.2 kHz) and the frequency response of the series circuit. The resistance of each ultrathin Pt film (RA, RB, and RC) was nearly the same, allowing each sensor to be designed for different notch frequencies by adjusting the elements in each circuit.
3. Results and Discussions
3.1. Electrical Control of Sensitivity
In previous investigations, the resistance change of the ultrathin Pt film sensor was quantified, revealing an approximate 1.5% alteration when exposed to H2 for 5 min [16]. In this study, the ultrathin Pt film sensor was integrated into a twin-T type notch filter circuit, and the resulting output signals were characterized by measuring both amplitude and phase. The change in amplitude (ΔV/V) can be given by
where V is the output voltage, and V0 is the voltage at the commencement of the measurement. The phase was initialized at 0 degrees. Figure 5 illustrates the temporal evolution of amplitude and phase (Δθ) at a notch frequency of 1.2 kHz. The changes in amplitude and phase were 2.8% and 4.8 degrees, respectively. Furthermore, the change in output signals from the sensor with the twin-T circuit was found to be 1.3% to 2.3% higher compared to the previous sensor. After H2 exposure, the sensor exhibited a long recovery time: it took more than 12 h for the output signals to recover and return to their original value after the gas supply switched from H2 to air. To overcome this problem, the sensor was subjected to thermal treatment by pulsed current injection [18].
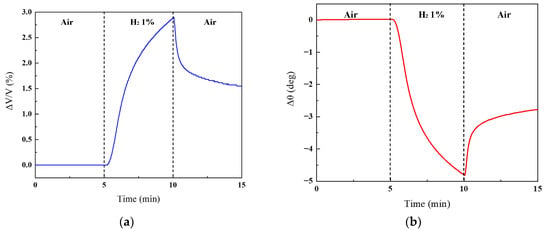
Figure 5.
Temporal evolution of (a) amplitude and (b) phase at the notch frequency of 1.2 kHz. The sensor was exposed to H2 for 5 min, with exposure to air gas for an additional 5 min before and after.
Figure 6 illustrates the amplitude and phase variation as a function of the circuit’s operating frequency when exposed to H2. The measurements involved adjusting the frequency in increments of 200 Hz, ranging from 200 Hz to 1400 Hz. The most significant change in amplitude occurred at 1.0 kHz, reaching 4.3%, while at the notch frequency of 1.2 kHz, it measured 2.9%. The amplitude increase at frequencies deviating from 1.2 kHz is attributed to the sensitivity (S) rise. However, excessive deviation from the notch frequency may prevent adequate signal attenuation by the twin-T circuit, resulting in reduced amplitude change. The maximum phase change was observed at 1.2 kHz, registering at 4.8 degrees, diminishing as the operating frequency moved away from the notch frequency. By finely tuning the operating frequency near the notch frequency, the changes of both the amplitude (2.9–4.3%) and phase (2 degrees to 4.8 degrees) could be adjusted. This outcome distinctly highlights the electrical regulation of sensor sensitivity through operating frequency manipulation.
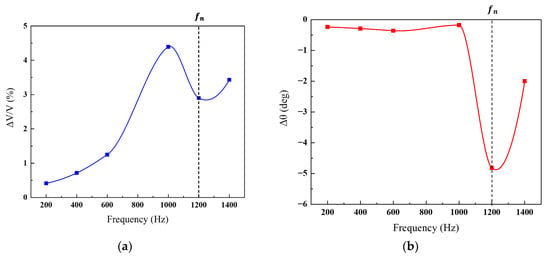
Figure 6.
Variation in (a) amplitude and (b) phase concerning the operating frequency of the circuit when the sensor was exposed to H2.
Figure 7 presents the gas selectivity under exposure to 1% nitrogen-based H2 and interfering gases for 5 min. Carbon dioxide, methane, and ethane served as interfering gases. Carbon monoxide and nitrogen oxides will also be explored in future studies. The change in H2 exposure was approximately 5%, whereas the exposure to interfering gases changed by only 0.02%, constituting less than one-hundredth of the change in H2 exposure. The sensor developed in this study operates at room temperature and remains unaffected by interfering gases, exhibiting selective reactivity exclusively with H2.
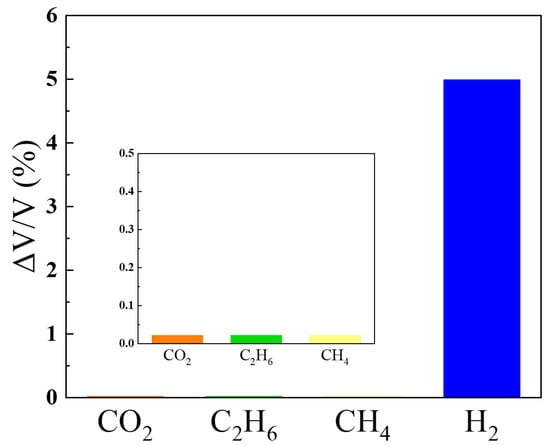
Figure 7.
Gas selectivity when exposed to 1% nitrogen-based H2 and interfering gases for 5 min.
Figure 8 depicts the detection limit for hydrogen concentration by varying the concentration by one digit. The results demonstrate a response to hydrogen concentrations as low as about 10 ppm. The change in amplitude increased with rising hydrogen concentration, measuring 0.02% at 10 ppm and 0.14% at 1000 ppm. Considering the lower explosive limit concentration of H2 in the air is 4%, the sensor developed in this study proves capable of detecting leaks before reaching hazardous levels.
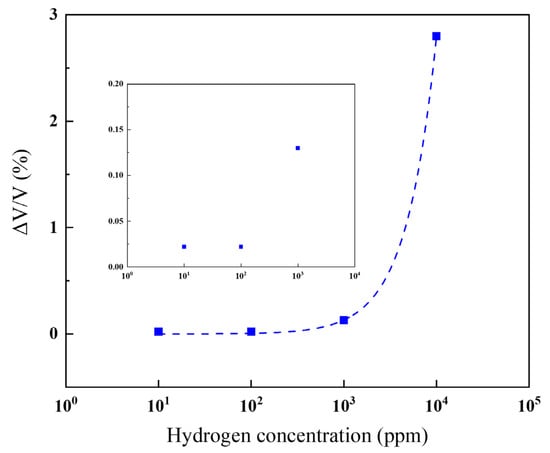
Figure 8.
Change in amplitude when the hydrogen concentration was varied by one digit.
3.2. Simultaneous Hydrogen Detection
Figure 9 presents the results of FFT analysis on the output signal of the composite wave input to the series circuit when air gas and H2 flowed into Sensor A. The change in amplitude at 1.2 kHz was 2.45%, while changes at 12.7 kHz and 58.1 kHz were 0.68% and 0.21%, respectively. Thus, the amplitude increased only at the operating frequency of Sensor A with hydrogen exposure. Table 1 details the change in amplitude at each frequency when H2 flowed into each sensor. The amplitude at the operating frequency of the sensor changed the most with the inflow of H2, suggesting that the ultrathin Pt film hydrogen sensor with a twin-T type notch filter could be employed in a series circuit for simultaneous hydrogen detection by multiple sensors.
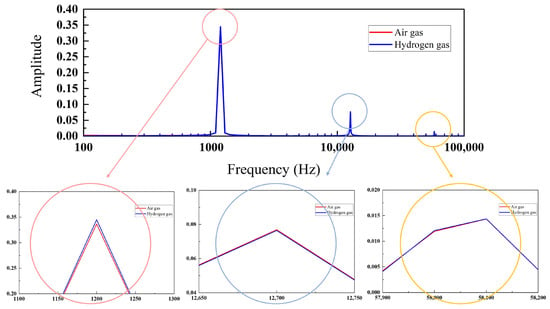
Figure 9.
Results of FFT analysis on the output signal of the composite wave input to the series circuit when air gas and H2 flowed into Sensor A.

Table 1.
Change in amplitude at each frequency when H2 flew into each sensor.
Figure 10a displays the spectrograms when Sensor A was exposed to H2. The horizontal axis represents time, the vertical axis indicates frequency, and the color code represents amplitude. Amplitudes at the frequency bands around 1.2, 12.7, and 58.2 kHz were larger than those at other frequencies. Figure 10b provides an enlarged view around 1.2 kHz. The amplitude remained constant from 0 to 300 s during exposure to the air gas. In contrast, the amplitude increased from 1.9 5 × 10⁻² to 2.10 × 10⁻² at 1175 Hz during 300–600 s when exposed to H2. This result indicates that Sensor A detected H2, and the hydrogen detection using this sensor could be visualized. On the other hand, the amplitude at the frequency bands around 12.7 kHz (Figure 10c) and around 58.2 kHz (Figure 10d) did not change as they were not exposed to H2. Only the amplitude of Sensor A exposed to H2 changed. Simultaneous hydrogen detection by multiple sensors in real-time is possible, making it easier to locate leaks.
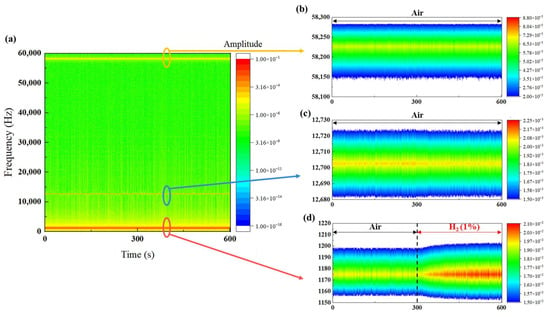
Figure 10.
(a) Spectrograms when Sensor A was exposed to H2; (b) enlarged view around 1.2 kHz; (c) enlarged view around 12.7 kHz; and (d) enlarged view around 58.2 kHz.
4. Conclusions
We developed a resistance change-type sensor utilizing an ultrathin Pt film. In this paper, a twin-T type notch filter sensor incorporating the ultrathin Pt film as a resistive element was fabricated. The objective was to adjust the sensitivity of the sensor and enable the simultaneous detection of H2 by multiple sensors. Designing multiple sensors with consistent sensitivity allows their use in the same environment. Moreover, by connecting twin-T-type notch filter sensors in series, the operation of each sensor is synchronized, leading to the creation of a system that functions only when the sensor is exposed to H2. This system would facilitate the safe handling of hydrogen in large-scale situations.
In future work, we aim to expand the number of series circuits to achieve multipoint simultaneous measurements through frequency multiplexing.
Author Contributions
Conceptualization, T.K.; methodology, T.K.; validation, S.W., Y.O., H.N., J.W., and T.K.; investigation, T.K. and S.W.; resources, T.K.; data curation, S.W., Y.O., and H.N.; writing—original draft preparation, S.W., Y.O., and H.N.; writing—review and editing, S.W. and T.K.; visualization, S.W.; supervision, T.K.; project administration, T.K.; funding acquisition, T.K. All authors have read and agreed to the published version of the manuscript.
Funding
This research received no external funding.
Institutional Review Board Statement
Not applicable.
Informed Consent Statement
Not applicable.
Data Availability Statement
The data that support the findings of this study are available from the corresponding author, [T.K.], upon reasonable request.
Conflicts of Interest
The authors declare no conflicts of interest.
References
- Momirlan, M.; Veziroglu, T.N. The properties of hydrogen as fuel tomorrow in sustainable energy system for a cleaner planet. Int. J. Hydrog. Energy 2005, 30, 795–802. [Google Scholar] [CrossRef]
- Marchenko, O.V.; Solomin, S.V. The future energy: Hydrogen versus electricity. Int. J. Hydrog. Energy 2015, 40, 3801–3805. [Google Scholar] [CrossRef]
- Stern, A.G. A new sustainable hydrogen clean energy paradigm. Int. J. Hydrog. Energy 2018, 43, 4244–4255. [Google Scholar] [CrossRef]
- Hübert, T.; Boon-Brett, L.; Black, G.; Banach, U. Hydrogen sensors—A review. Sens. Actuators B 2011, 157, 329–352. [Google Scholar] [CrossRef]
- Nasri, A.; Petrissans, M.; Fierro, V.; Celzard, A. Gas sensing based on organic composite materials: Review of sensor types, progresses and challenges. Mater. Sci. Semicond. Process. 2021, 128, 105744. [Google Scholar] [CrossRef]
- Çoban, Ö.; Tekmen, S.; Gür, E.; Tüzemen, S. High Optical Response NiO, Pd/NiO and Pd/WO3 Hydrogen Sen-sors. Int. J. Hydrogen Energy 2022, 47, 25454–25464. [Google Scholar] [CrossRef]
- Han, C.H.; Hong, D.W.; Han, S.-D.; Gwak, J.; Singh, K.C. Catalytic combustion type hydrogen gas sensor using TiO2 and UV-LED. Sens. Actuators B 2007, 125, 224–228. [Google Scholar] [CrossRef]
- Lee, E.B.; Hwang, I.S.; Cha, J.H.; Lee, H.J.; Lee, W.B.; Pak, J.J.; Lee, J.H.; Ju, B.K. Micromachined catalytic combustible hydrogen gas sensor. Sens. Actuators B 2011, 153, 392–397. [Google Scholar] [CrossRef]
- Katti, V.R.; Debnath, A.K.; Gadkari, S.C.; Gupta, S.K.; Sahni, V.C. Passivated thick film catalytic type H2 sensor operating at low temperature. Sens. Actuators B 2002, 84, 219–225. [Google Scholar] [CrossRef]
- Hong, S.; Wu, M.; Hong, Y.; Jeong, Y.; Jung, G.; Shin, W.; Park, J.; Kim, D.; Jang, D.; Lee, J.-H. FET-type gas sensors: A review. Sens. Actuators B 2021, 330, 129240. [Google Scholar] [CrossRef]
- Kwon, D.; Jung, G.; Shin, W.; Jeong, Y.; Hong, S.; Oh, S.; Kim, J.; Bae, J.-H.; Park, B.-G.; Lee, J.-H. Efficient fusion of spiking neural networks and FET-type gas sensors for a fast and reliable artificial olfactory system. Sens. Actuators B 2021, 345, 130419. [Google Scholar] [CrossRef]
- Andersson, M.; Pearce, R.; Lloyd Spetz, A. New generation SiC based field effect transistor gas sensors. Sens. Actuators B 2013, 179, 95–106. [Google Scholar] [CrossRef]
- Raghu, S.; Santhosh, P.N.; Ramaprabhu, S. Nanostructured palladium modified graphitic carbon nitride—High performance room temperature hydrogen sensor. Int. J. Hydrog. Energy 2016, 41, 20779–20786. [Google Scholar] [CrossRef]
- Shin, D.H.; Lee, J.S.; Jun, J.; An, J.H.; Kim, S.G.; Cho, K.H.; Jang, J. Flower-like palladium nanoclusters decorated graphene electrodes for ultrasensitive and flexible hydrogen gas sensing. Sci. Rep. 2015, 5, 12294. [Google Scholar] [CrossRef]
- Adams, B.D.; Chen, A. The role of palladium in a hydrogen economy. Mater. Today 2011, 14, 282–289. [Google Scholar] [CrossRef]
- Tsukada, K.; Kiwa, T.; Yamaguchi, T.; Migitaka, S.; Goto, Y.; Yokosawa, K. A study of fast response characteristics for hydrogen sensing with platinum FET sensor. Sens. Actuators B 2006, 114, 158–163. [Google Scholar] [CrossRef]
- Tsukada, K.; Inoue, H.; Katayama, F.; Sakai, K.; Kiwa, T. Changes in work function and electrical resistance of Pt thin films in the presence of hydrogen gas. Jpn. J. Appl. Phys. 2012, 51, 015701. [Google Scholar] [CrossRef]
- Tsukada, K.; Takeichi, S.; Sakai, K.; Kiwa, T. Ultrathin-film hydrogen gas sensor with nanostructurally modified surface. Jpn. J. Appl. Phys. 2014, 53, 076701. [Google Scholar] [CrossRef]
- Yamaguchi, T.; Kiwa, T.; Tsukada, K.; Yokosawa, K. Oxygen interference mechanism of platinum–FET hydrogen gas sensor. Sens. Actuators A 2007, 136, 244–248. [Google Scholar] [CrossRef]
- Longato, A.; Vanzan, M.; Colusso, E.; Corni, S.; Martucci, A. Enhancing Tungsten Oxide Gasochromism with Noble Metal Nanoparticles: The Importance of the Interface. Small 2023, 19, 2205522. [Google Scholar] [CrossRef]
- Jing, P.; Dan, H.; Qiyun, J. Optimal design on twin-T notch filter in electromagnetic exploration equipments. In Proceedings of the 2011 International Conference on Electric Information and Control Engineering, Wuhan, China, 15–17 April 2011; IEEE: New York, NY, USA, 2011; pp. 1510–1515. [Google Scholar]
- Panja, A.; Bhattacharya, A.; Banerjee, T.P. Design and analysis of notch depth for T-notch filter. In Proceedings of the 2020 National Conference on Emerging Trends on Sustainable Technology and Engineering Applications (NCETSTEA), Durgapur, India, 7–8 February 2020; IEEE: New York, NY, USA, 2020; pp. 1–4. [Google Scholar] [CrossRef]
- Das, K.C.; Ghosh, S.P.; Tripathy, N.; Kim, D.H.; Lee, T.I.; Myoung, J.M.; Kar, J.P. Evolution of microstructural and electrical properties of sputtered HfO2 ceramic thin films with RF power and substrate temperature. Ceram. Int. 2016, 42, 138–145. [Google Scholar] [CrossRef]
- Kerkache, L.; Layadi, A.; Dogheche, E.; Rémiens, D. Physical properties of RF sputtered ITO thin films and annealing effect. J. Phys. D Appl. Phys. 2006, 39, 184–189. [Google Scholar] [CrossRef]
Disclaimer/Publisher’s Note: The statements, opinions and data contained in all publications are solely those of the individual author(s) and contributor(s) and not of MDPI and/or the editor(s). MDPI and/or the editor(s) disclaim responsibility for any injury to people or property resulting from any ideas, methods, instructions or products referred to in the content. |
© 2024 by the authors. Licensee MDPI, Basel, Switzerland. This article is an open access article distributed under the terms and conditions of the Creative Commons Attribution (CC BY) license (https://creativecommons.org/licenses/by/4.0/).