


An IoT System for Air Pollution Monitoring with Safe Data Transmission


Abstract
1. Introduction
- project of an IoT system for air pollution monitoring,
- use of a data transmission security protocol,
- adaptation of MQTT and Amelia protocols for securing communication,
- automated and informal security analysis of the Amelia protocol adaptation.
2. Related Works
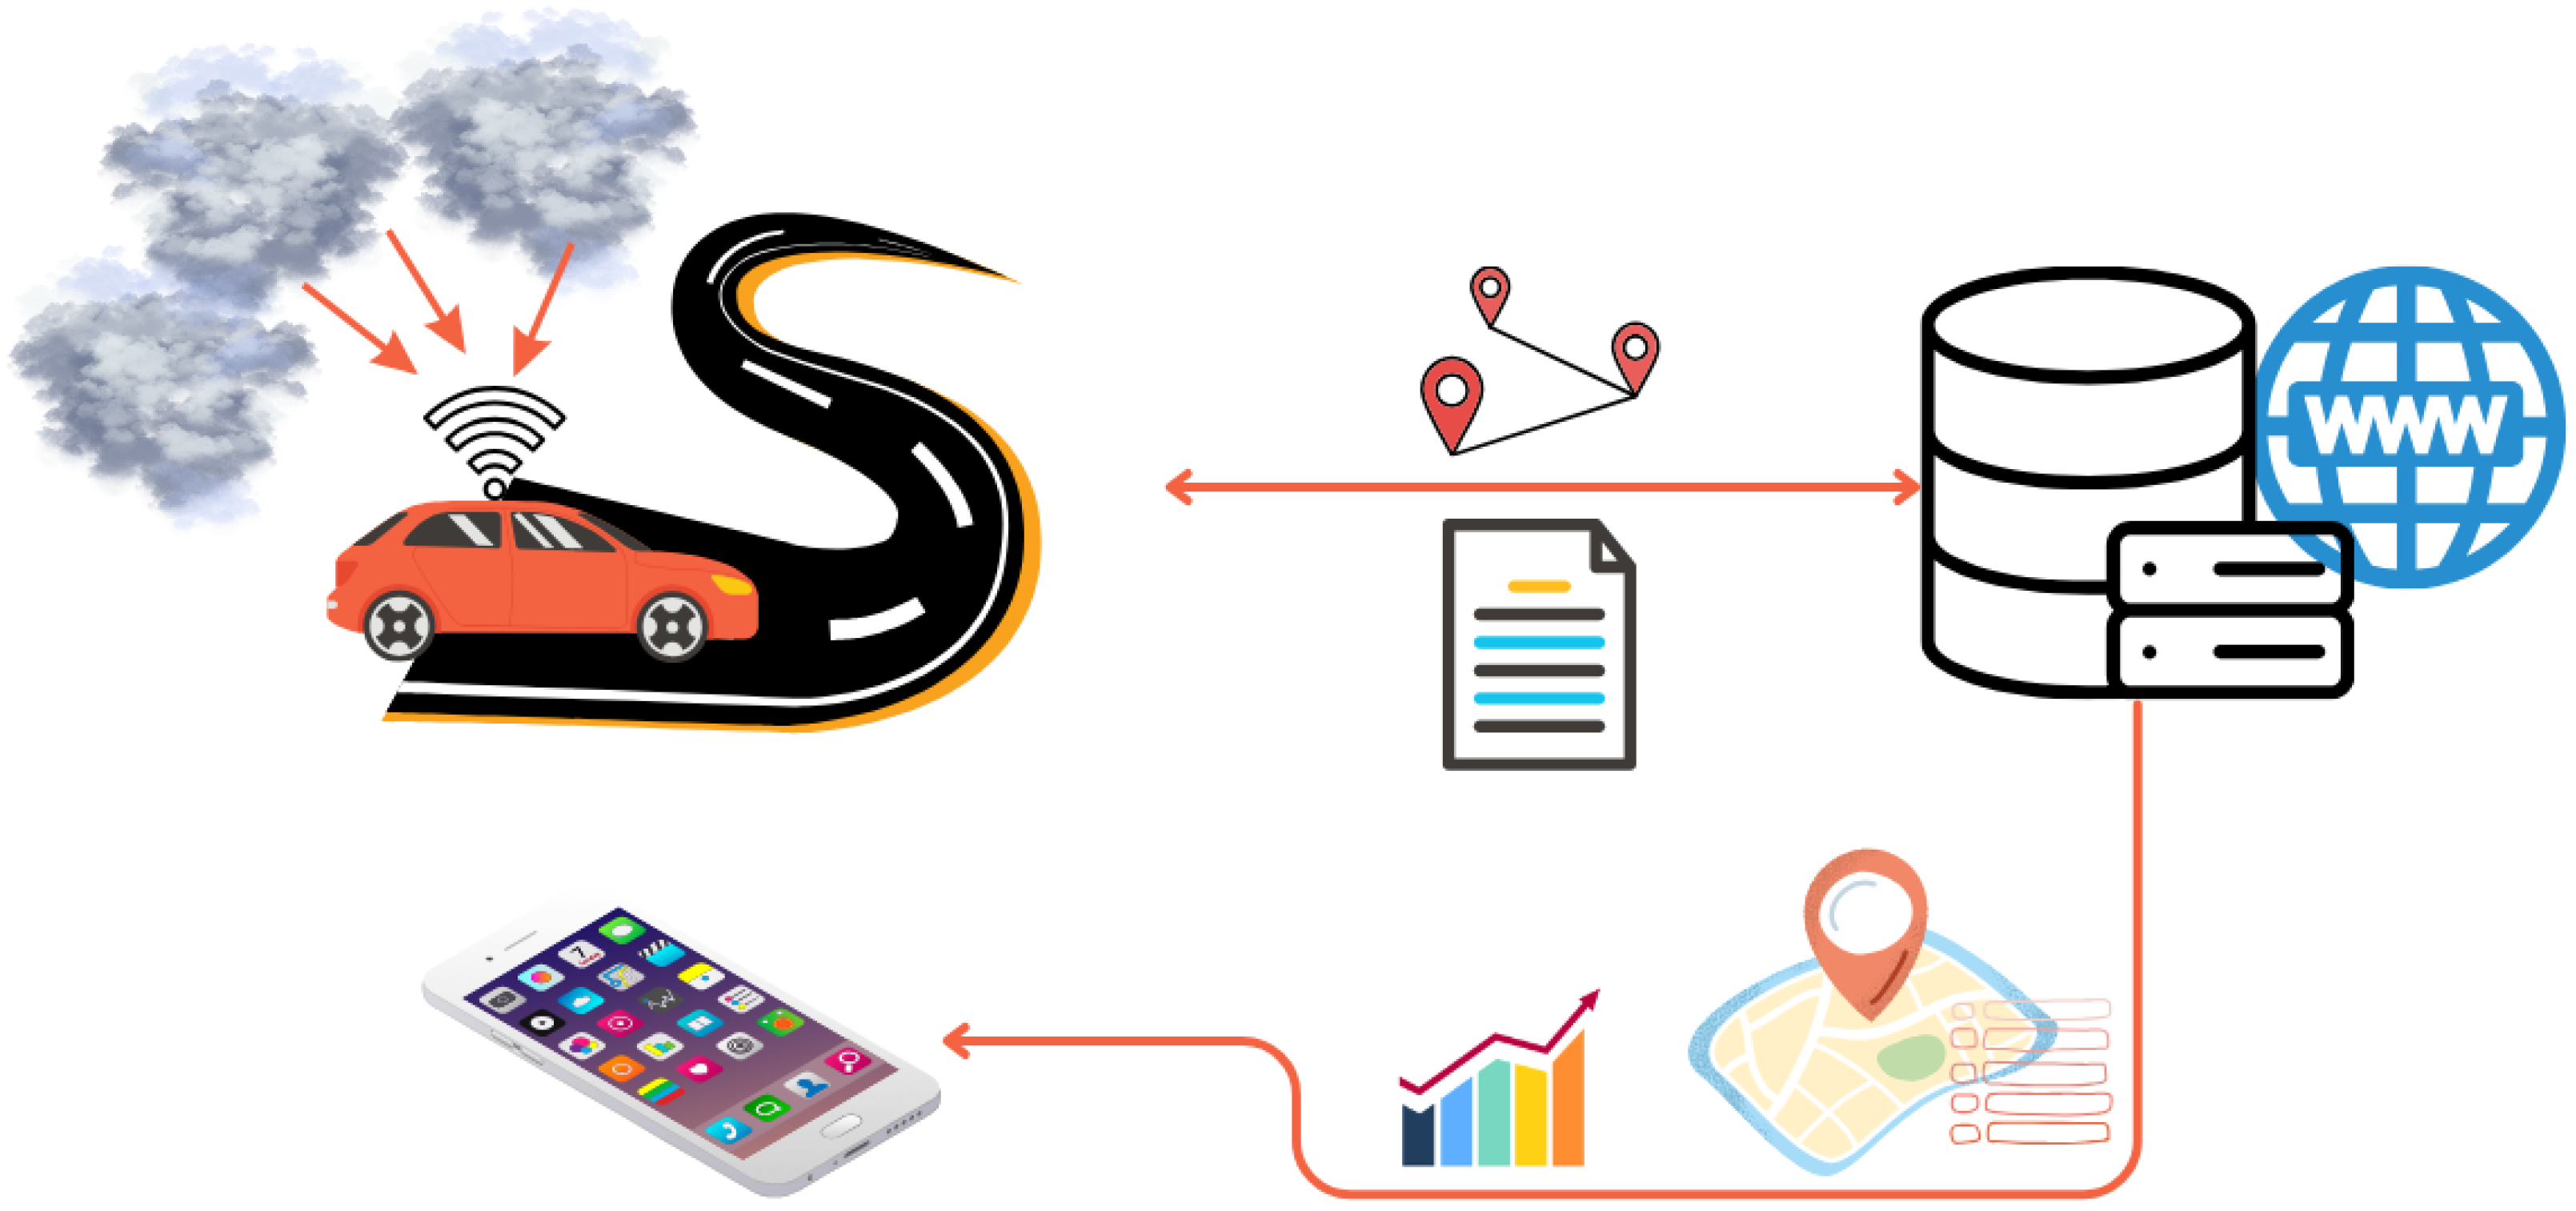
3. Proposed IoT System
3.1. System Structure
- means the message M encrypted by key K,
- means the autonomous vehicle,
- means the central server,
- is a AV’s text identifier,
- is a AV’s timestamp,
- is the public key of u of the protocol participant, for example, the key is the public key of the central server,
- stands for the numeric user identifier,
- means the execution of the hash function on the ciphertext ,
- means the timestamp generated by the central server for the unique user identifier .
- means the message M encrypted by key K,
- means the autonomous vehicle,
- means the central server,
- is the text identifier of the user u,
- is the public key of u of the participant of the protocol; for example, the key is the AV’s public key,
- stands for the numeric user identifier,
- means the execution of the hash function on the ciphertext ,
- means the timestamp generated by the central server for the unique user identifier ,
- means a data file with information about air quality,
- is a symmetric session key shared between AV and CS.
- time of generating confidential information: ,
- time of composing the message: ,
- asymmetric encryption or decryption time: ,
- symmetric encryption or decryption time: ,
- minimal delay in the network: ,
- maximal delay in the network: ,
- execution time of the hash function: .
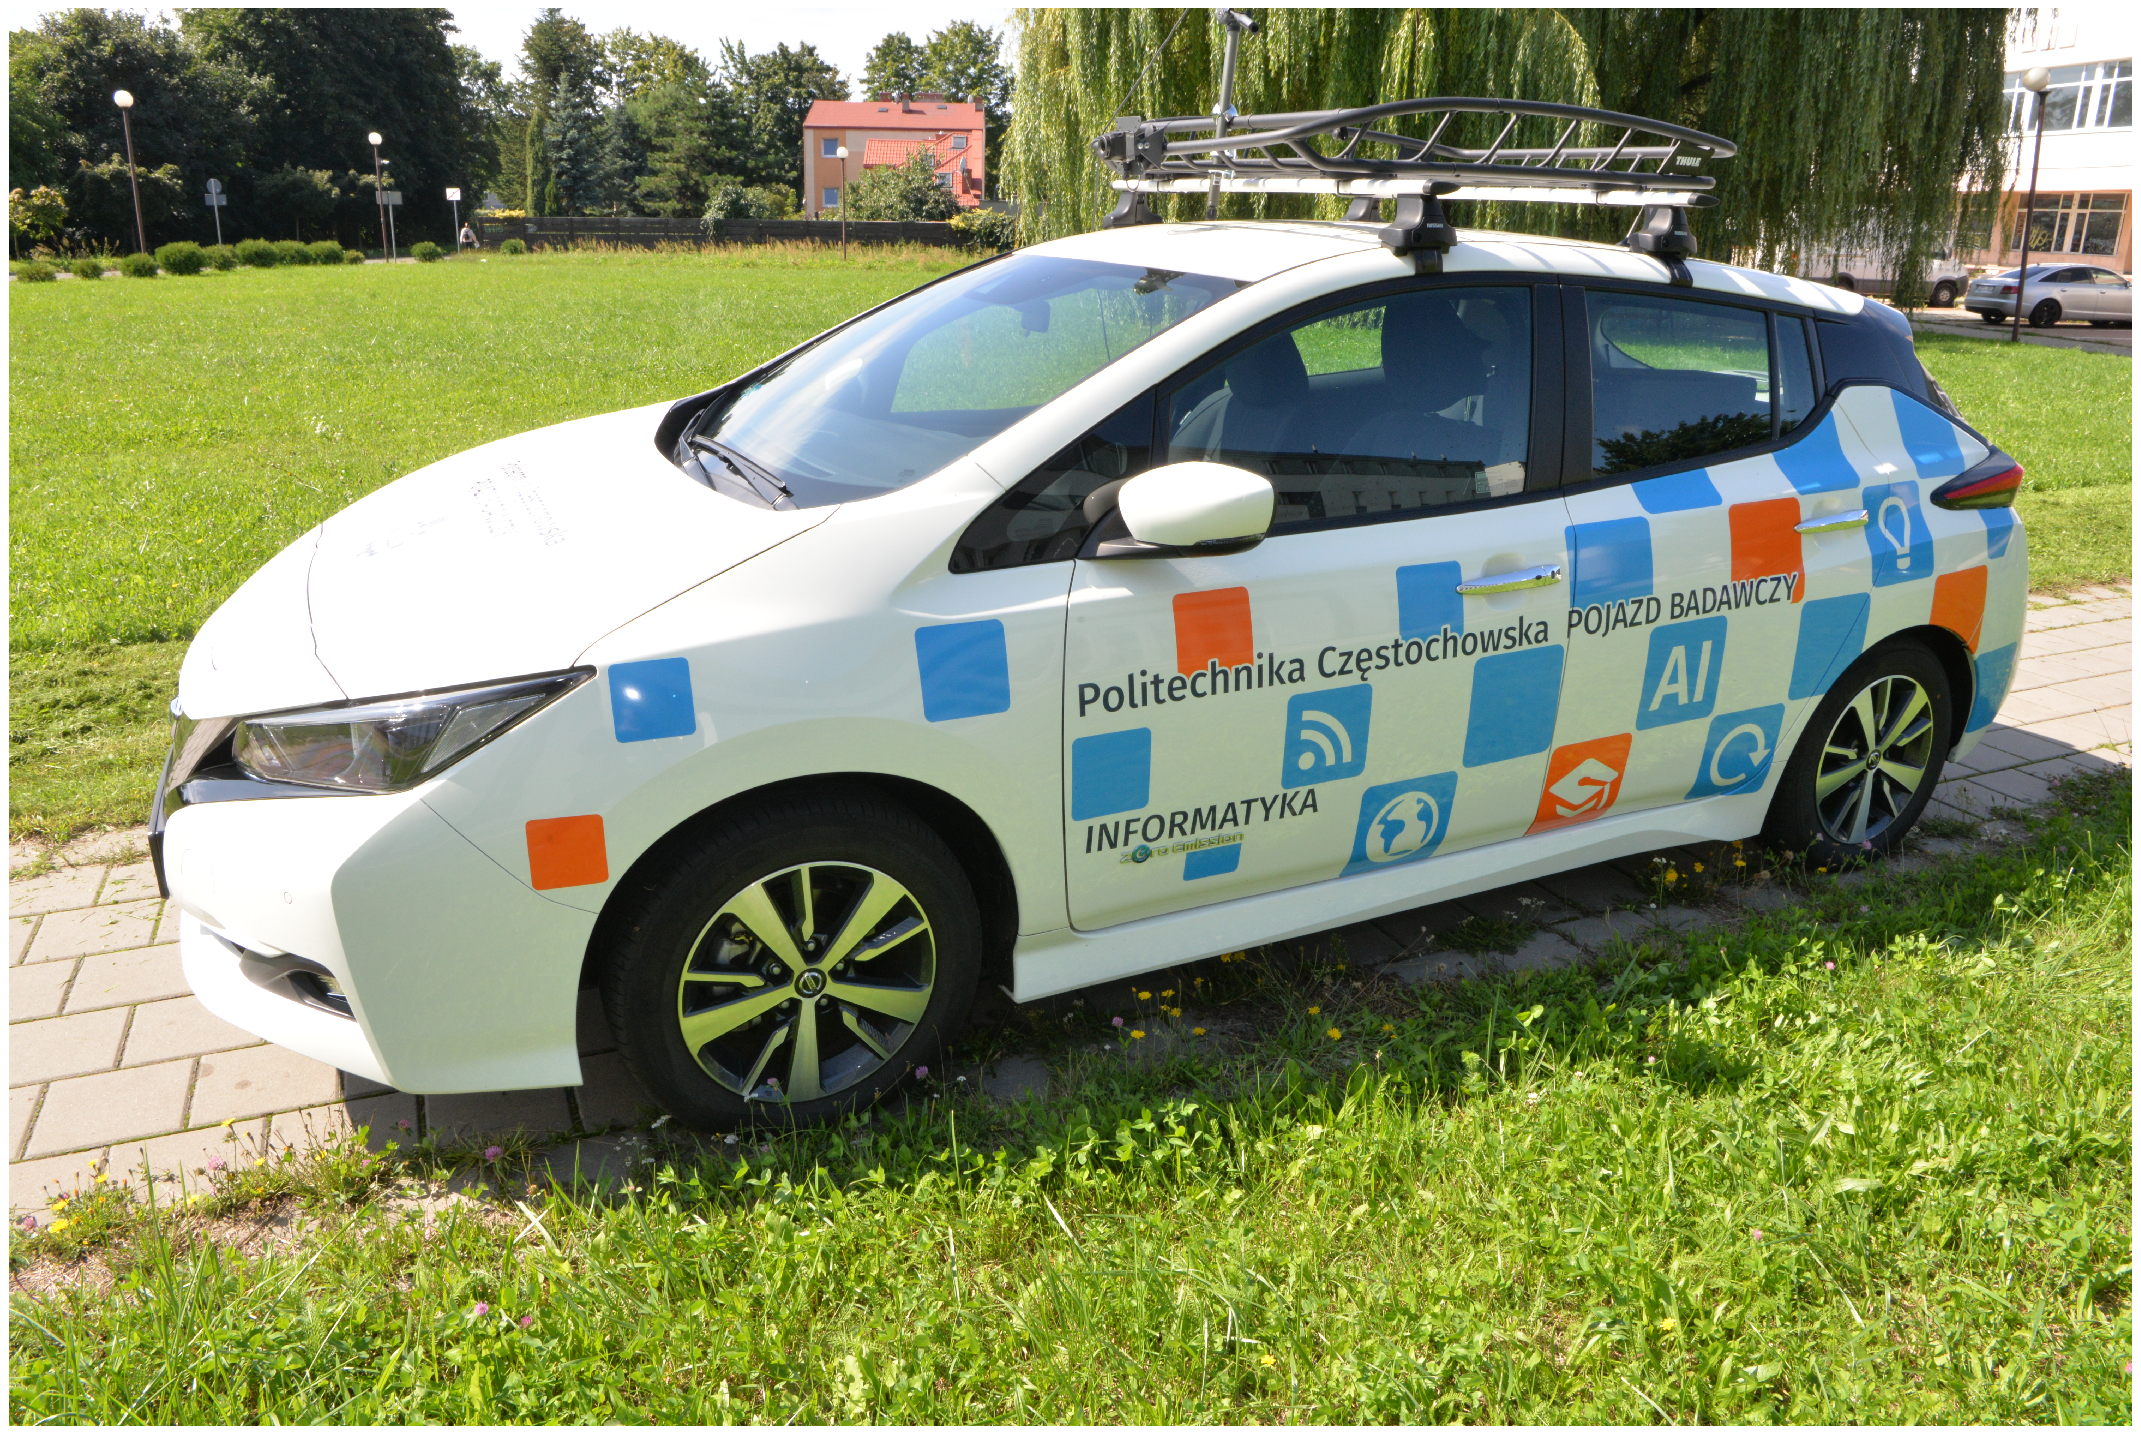
3.2. Vehicle
3.3. Instruments
- a measuring module with a built-in suspended dust measurement system,
- a measuring module with gas sensors working in a pump system.
- dust range from 0 to 1999.9 μg/m3, sensitivity 0.3 μg/m3
- dust range from 0 to 999.9 μg/m3
- Volatile Organic Compounds PID 10.6 eV detection range: 0 ppm to 50 ppm, photoionization method,
- range from 1 to 500 ppm, the electrochemical method
- range from 0 to 20 ppm, the electrochemical method
- range 0 to 20 ppm, the electrochemical method
- range from 0 to 50 ppm, the electrochemical method
- temperature −40 °C to 85 °C, resolution 0.1 °C
- humidity from 0 to 100
- pressure from 300 hPa to 1100 hPa, accuracy 100 Pa
- GPS position (GNSS) accuracy up to 1.5 m
- GSM/3G/LTE module
- WiFi 2.4/5.8 GHz 802.11an.
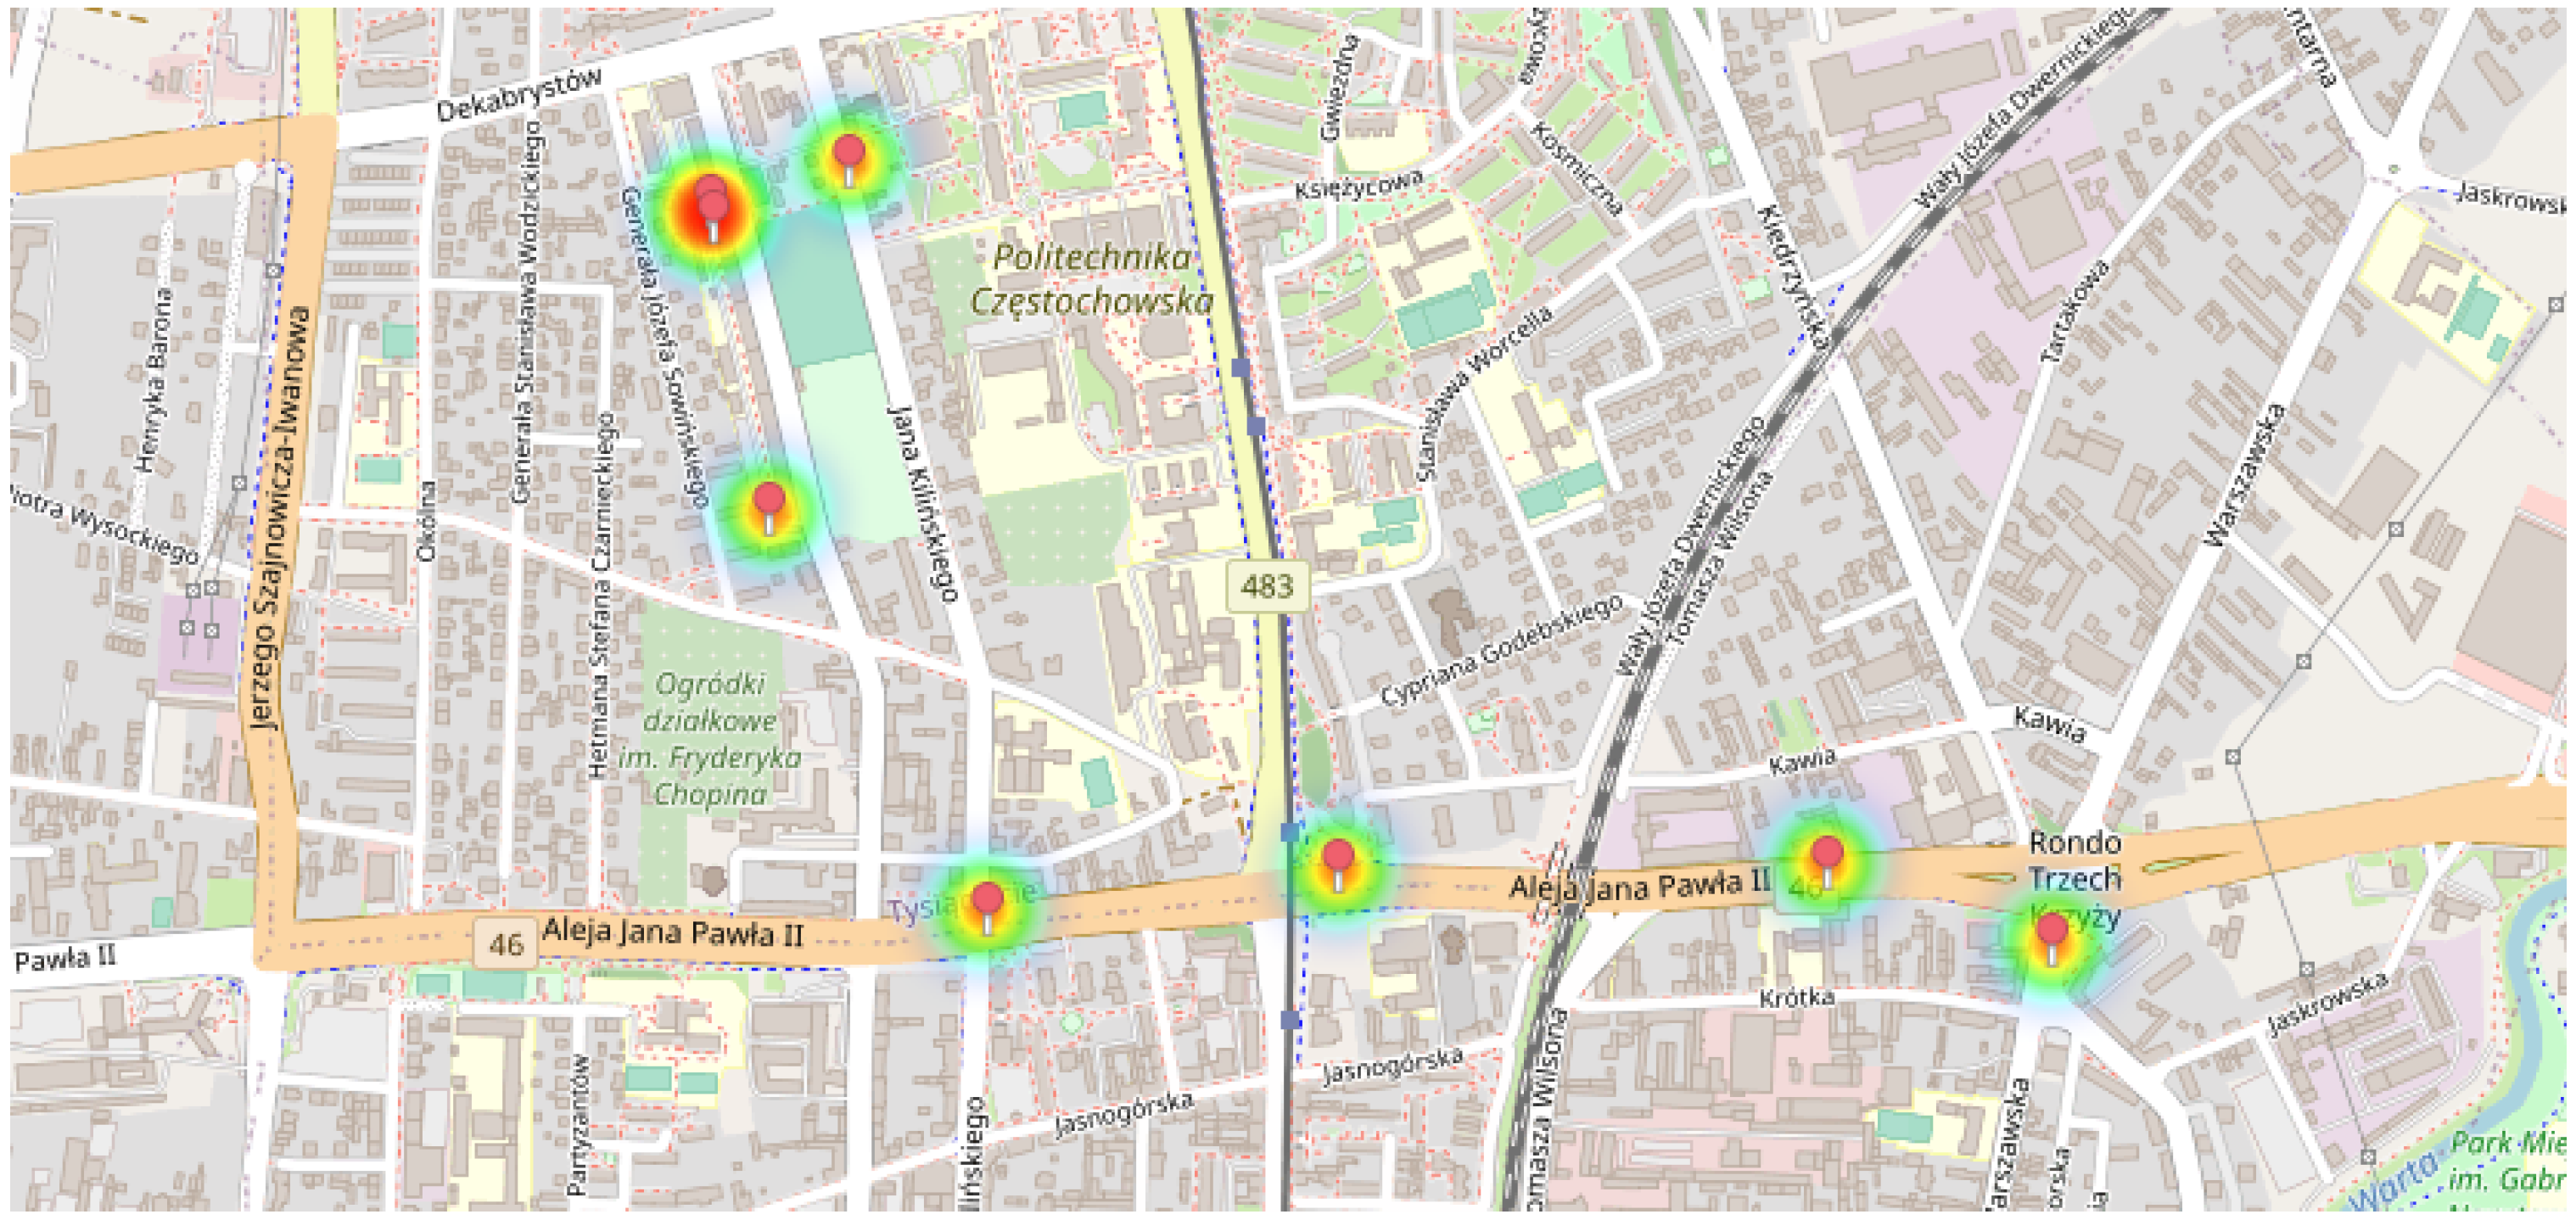
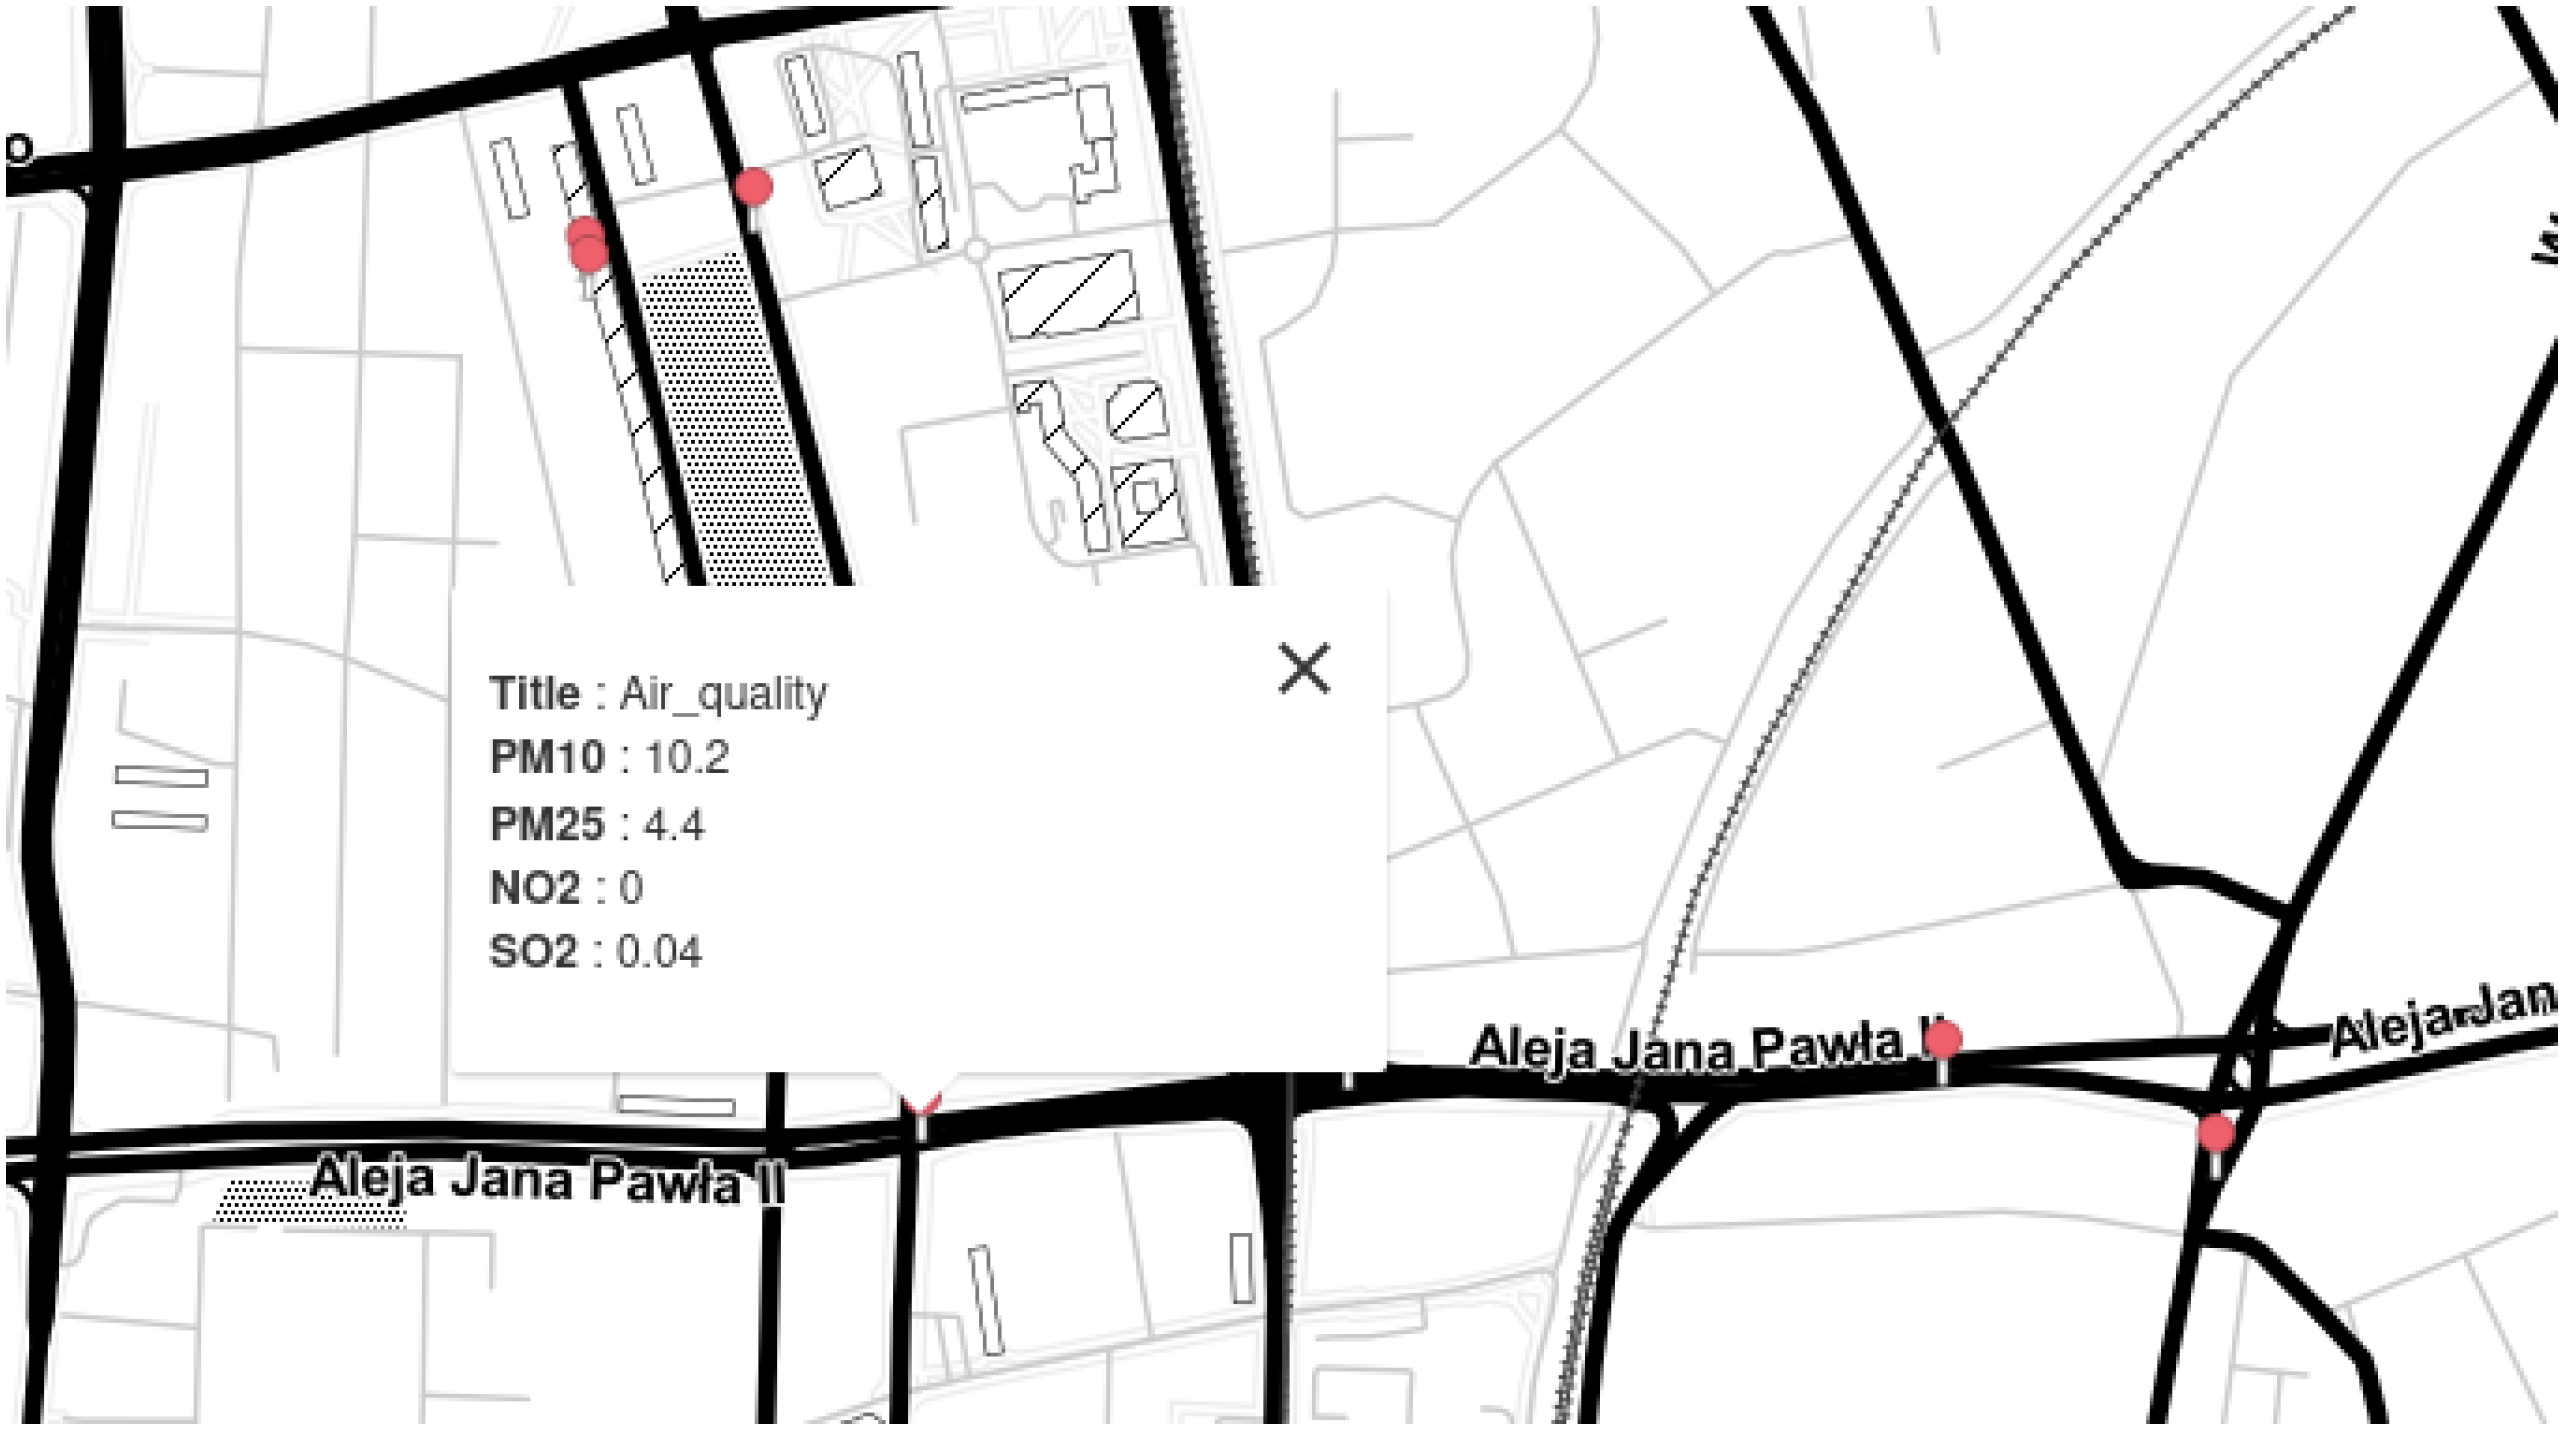
3.4. Results
4. Conclusions
Author Contributions
Funding
Institutional Review Board Statement
Informed Consent Statement
Data Availability Statement
Conflicts of Interest
Abbreviations
| WHO | World Health Organization |
| nitrogen oxides | |
| nitrogen dioxide | |
| sulfur dioxide | |
| ozone | |
| CO | carbon monoxide |
| PH | particulate matter |
| carbon dioxide | |
| VOC | Volatile Organic Compounds |
| IoT | Internet of Things |
| GPS | Global Positioning System |
| GNSS | Global Navigation Satellite Systems |
| AQI | Air Quality of System |
| LPG | Liquefied Petroleum Gas |
| AV | Autonomous Vehicle |
| MQTT | Message Queue Telemetry Transport |
| GSM | Groupe Spécial Mobile |
| 3G | Third Generation |
| LTE | Long Term Evolution |
| LAT | Latitude |
| LON | Longitude |
| ALT | Altitude |
| PID | Photoionization Detectors are used for the detection volatiles at the |
| parts-per-million (ppm) | |
| Temp | Temperature |
| Press | Pressure |
| Hum | Humanity |
References
- Bobulski, J.; Szymoniak, S.; Pasternak, K. Air pollution monitoring and information distribution system. In Pattern Classification, Image Processing and Communications: Proceedings of the CORES and IP&C Conferences; Burduk, R., Choras, M., Kozik, R., Ksieniewicz, P., Marciniak, T., Trajdos, P., Eds.; Lecture Notes in Networks and Systems, 766; Springer: Cham, Switzerland, 2023; pp. 185–192. [Google Scholar]
- Velasco, R.P.; Jarosińska, D. Update of the WHO global air quality guidelines: Systematic reviews—An introduction. Environ. Int. 2022, 170, 107556. [Google Scholar] [CrossRef] [PubMed]
- Leung, D.Y.C. Outdoor-indoor air pollution in urban environment: Challenges and opportunity. Front. Environ. Sci. 2015, 2. [Google Scholar] [CrossRef]
- Kampa, M.; Castanas, E. Human health effects of air pollution. Environ. Pollut. 2008, 151, 362–367. [Google Scholar] [CrossRef] [PubMed]
- WHO. Available online: https://www.who.int/data/gho/data/indicators/indicator-details/GHO/ambient-air-pollution-attributable-deaths (accessed on 23 March 2023).
- de Gennaro, G.; Dambruoso, P.R.; Loiotile, A.D.; Di Gilio, A.; Giungato, P.; Tutino, M.; Marzocca, A.; Mazzone, A.; Palmisani, J.; Porcelli, F. Indoor air quality in schools. Environ. Chem. Lett. 2014, 12, 467–482. [Google Scholar] [CrossRef]
- WHO. Available online: https://www.who.int/data/gho/data/indicators/indicator-details/GHO/household-air-pollution-attributable-deaths (accessed on 23 March 2023).
- Gubbi, J.; Buyya, R.; Marusic, S.; Palaniswami, M. Internet of Things (IoT): A vision, architectural elements, and future directions. Future Gener. Comput. Syst. 2013, 29, 1645–1660. [Google Scholar] [CrossRef]
- Alvarez-Campana, M.; López, G.; Vázquez, E.; Villagrá, V.A.; Berrocal, J. Smart CEI moncloa: An iot-based platform for people flow and environmental monitoring on a Smart University Campus. Sensors 2017, 17, 2856. [Google Scholar] [CrossRef] [PubMed]
- Taştan, M.; Gökozan, H. Real-time monitoring of indoor air quality with internet of things-based E-nose. Appl. Sci. 2019, 9, 3435. [Google Scholar] [CrossRef]
- Marques, G.; Pitarma, R. A cost-effective air quality supervision solution for enhanced living environments through the internet of things. Electronics 2019, 8, 170. [Google Scholar] [CrossRef]
- Cowell, N.; Chapman, L.; Bloss, W.; Srivastava, D.; Bartington, S.; Singh, A. Particulate matter in a lockdown home: Evaluation, calibration, results and health risk from an IoT enabled low-cost sensor network for residential air quality monitoring. Environ. Sci. Atmos. 2023, 3, 65–84. [Google Scholar] [CrossRef]
- Zhang, D.; Woo, S.S. Real time localized air quality monitoring and prediction through mobile and fixed IoT sensing network. IEEE Access 2020, 8, 89584–89594. [Google Scholar] [CrossRef]
- Martín-Baos, J.Á.; Rodriguez-Benitez, L.; García-Ródenas, R.; Liu, J. IoT based monitoring of air quality and traffic using regression analysis. Appl. Soft Comput. 2022, 115, 108282. [Google Scholar] [CrossRef]
- Barthwal, A. A Markov chain–based IoT system for monitoring and analysis of urban air quality. Environ. Monit. Assess. 2023, 195, 195–235. [Google Scholar] [CrossRef] [PubMed]
- Paithankar, D.N.; Pabale, A.R.; Kolhe, R.V.; William, P.; Yawalkar, P.M. Framework for implementing air quality monitoring system using LPWA-based IoT technique. Meas. Sens. 2023, 26, 100709. [Google Scholar] [CrossRef]
- Naik, U.U.; Salgaokar, S.R.; Jambhale, S. IOT based air pollution monitoring system. Int. J. Sci. Res. Eng. Trends 2023, 9, 835–838. [Google Scholar]
- Bobulski, J.; Kubanek, M. Vehicle for plastic garbage gathering. In Proceedings of the 2021 International Conference on Electrical, Computer, Communications and Mechatronics Engineering (ICECCME), Mauritius, 7–8 October 2021. [Google Scholar]
- Zeghida, H.; Boulaiche, M.; Chikh, R. Securing MQTT protocol for IoT environment using IDS based on ensemble learning. Int. J. Inf. Secur. 2023, 22, 1075–1086. [Google Scholar] [CrossRef]
- Alshammari, H.H. The Internet of Things healthcare monitoring system based on MQTT protocol. Alex. Eng. J. 2023, 69, 275–287. [Google Scholar] [CrossRef]
- Szymoniak, S. Amelia—A new security protocol for protection against false links. Comput. Commun. 2021, 179, 73–81. [Google Scholar] [CrossRef]
- Yang, M.; Li, B.; Yan, Z. MAC Technology of IEEE 802.11 ax: Progress and Tutorial. Mob. Netw. Appl. 2021, 26, 1122–1136. [Google Scholar] [CrossRef]
- Rochim, A.F.; Harijadi, B.; Purbanugraha, Y.P.; Fuad, S.; Nugroho, K.A. Performance comparison of wireless protocol IEEE 802.11 ax vs 802.11ac. In Proceedings of the 2020 International Conference on Smart Technology and Applications (ICoSTA), Surabaya, Indonesia, 20 February 2020; pp. 1–5. [Google Scholar]
- Szymoniak, S. Security protocols analysis including various time parameters. Math. Biosci. Eng. MBE 2021, 18, 1136–1153. [Google Scholar] [CrossRef] [PubMed]


| Parameter | Registration Phase | Authentiction and Communication Phase |
|---|---|---|
| Minimal step time | 9 | 11 |
| Minimal step time | 14 | 16 |
| Minimal step time | 8 | 10 |
| Maximal step time | 8 | 10 |
| Maximal step time | 10 | 12 |
| Maximal step time | 7 | 9 |
| Minimal session time | 31 | 25 |
| Maximal session time | 37 | 31 |
| Timeout for step | 10 | 9 |
| Timeout for step | 26 | 21 |
| Timeout for step | 37 | 31 |
| Time | LAT | LON | ALT | NO2 | SO2 | NO | PID | Temp | Press | Hum | ||
|---|---|---|---|---|---|---|---|---|---|---|---|---|
| [°] | [°] | [m] | [μg/m3] | [μg/m3] | [ppm] | [ppm] | [ppm] | [ppm] | [°C] | [hPa] | [%] | |
| 14.11.2022 08:46 | 51.253555 | 22.563112 | 0 | 9.2 | 5.4 | 0.129 | 0 | 0.097 | 0.199 | 8.88 | 1007.26 | 68.89 |
| 14.11.2022 08:45 | 51.253555 | 22.563112 | 0 | 9.2 | 5.4 | 0.129 | 0 | 0.097 | 0.199 | 8.88 | 1007.26 | 68.89 |
| 14.11.2022 08:44 | 51.253555 | 22.563112 | 179.6 | 8.1 | 4.3 | 0.12 | 0 | 0.11 | 0.195 | 8.76 | 1007.06 | 68.9 |
| 14.11.2022 08:43 | 51.253135 | 22.560657 | 183.2 | 6.9 | 3.7 | 0.136 | 0 | 0.223 | 0.198 | 9.04 | 1007.17 | 68.27 |
| 14.11.2022 08:41 | 51.251875 | 22.551793 | 191.4 | 9.9 | 4.8 | 0.078 | 0 | 0.123 | 0.187 | 9.51 | 1006.38 | 66.89 |
| 14.11.2022 08:40 | 51.250048 | 22.552458 | 198.5 | 7.6 | 4.4 | 0.142 | 0 | 0.171 | 0.182 | 9.63 | 1004.89 | 65.52 |
| 14.11.2022 08:39 | 51.249043 | 22.554722 | 192.2 | 11.2 | 4.9 | 0.249 | 0 | 0.858 | 0.207 | 9.68 | 1005.28 | 65.99 |
| 14.11.2022 08:38 | 51.249638 | 22.55818 | 199.4 | 8.6 | 4.6 | 0.116 | 0 | 0.284 | 0.183 | 9.82 | 1004.94 | 65.06 |
| 14.11.2022 08:37 | 51.251273 | 22.558928 | 182.1 | 9 | 4.8 | 0.097 | 0 | 0.353 | 0.181 | 9.94 | 1006.06 | 64.2 |
| 14.11.2022 08:36 | 51.253255 | 22.561388 | 172.2 | 9.1 | 4.7 | 0.071 | 0 | 0.106 | 0.173 | 10.21 | 1007.28 | 62.32 |
| 14.11.2022 08:35 | 51.253255 | 22.561388 | 172.2 | 19.5 | 10.9 | 0.076 | 0 | 0.259 | 0.176 | 10.61 | 1007.33 | 61.47 |
| 14.11.2022 08:34 | 51.253093 | 22.563277 | 171.9 | 7.9 | 4.7 | 0.157 | 0 | 0.12 | 0.172 | 11.1 | 1007.52 | 58.85 |
| 14.11.2022 08:33 | 51.253477 | 22.56299 | 177.8 | 7.1 | 3.8 | 0.073 | 0 | 0.101 | 0.17 | 11.86 | 1007.43 | 55.57 |
| Time | LAT | LON | ALT | PM10 | NO2 | SO2 | NO | PID | Temp | Press | Hum | |
|---|---|---|---|---|---|---|---|---|---|---|---|---|
| [°] | [°] | [m] | [μg/m3] | [μg/m3] | [ppm] | [ppm] | [ppm] | [ppm] | [°C] | [hPa] | [%] | |
| 2023-05-08 14:00 | 50.823513 | 19.11048 | 240.1 | 4.8 | 1.9 | 0 | 0.067 | 0.25 | 0.175 | 19.96 | 998.15 | 24.68 |
| 2023-05-08 13:59 | 50.823378 | 19.110498 | 243.6 | 5.9 | 1.7 | 0 | 0.063 | 0.263 | 0.177 | 19.3 | 998.13 | 25.94 |
| 2023-05-08 13:58 | 50.820803 | 19.111305 | 254.5 | 5.6 | 2.2 | 0 | 0.043 | 0.29 | 0.172 | 18.86 | 998.68 | 24.56 |
| 2023-05-08 13:56 | 50.823888 | 19.112418 | 315.1 | 4.5 | 1.8 | 0 | 0.058 | 0.319 | 0.179 | 20.78 | 998.37 | 22.78 |
| 2023-05-08 13:55 | 50.817292 | 19.114335 | 258.9 | 10.2 | 4.4 | 0 | 0.04 | 0.606 | 0.186 | 21.38 | 999.04 | 22.15 |
| 2023-05-08 13:54 | 50.817657 | 19.119252 | 263 | 11.1 | 2.8 | 0 | 0.027 | 0.399 | 0.185 | 22.84 | 999.26 | 20.24 |
| 2023-05-08 13:53 | 50.817695 | 19.12604 | 264.9 | 5.6 | 2.2 | 0 | 0.077 | 0.395 | 0.189 | 24.51 | 999.19 | 19.46 |
| 2023-05-08 13:52 | 50.817007 | 19.1292 | 260.0 | 7.8 | 2 | 0 | 0.076 | 0.332 | 0.188 | 24.52 | 999.57 | 18.93 |
| 2023-05-08 13:51 | 50.811723 | 19.130872 | 255.1 | 6.3 | 2.3 | 0 | 0.054 | 0.98 | 0.196 | 25.28 | 999.51 | 18.29 |
| 2023-05-08 13:50 | 50.811863 | 19.129823 | 254.8 | 5.4 | 2.1 | 0 | 0.069 | 0.324 | 0.191 | 25.42 | 999.44 | 17.82 |
| 2023-05-08 13:48 | 50.811735 | 19.123877 | 272.7 | 5.7 | 2.1 | 0 | 0.086 | 0.452 | 0.203 | 26.69 | 998.62 | 17.21 |
| 2023-05-08 13:47 | 50.811838 | 19.12062 | 264.3 | 8.5 | 2.8 | 0 | 0.07 | 0.409 | 0.205 | 26.85 | 998.57 | 17.18 |
| 2023-05-08 13:37 | 50.811457 | 19.113898 | 263.5 | 4.9 | 2.2 | 0 | 0.117 | 0.456 | 0.24 | 19.33 | 998.48 | 24.41 |
| 2023-05-08 13:31 | 50.806778 | 19.103398 | 273.5 | 5.5 | 2.3 | 0 | 0.233 | 0.69 | 0.305 | 16.54 | 997.53 | 29.27 |
| 2023-05-08 13:30 | 50.805333 | 19.103503 | 271.7 | 7.9 | 3 | 0 | 0.253 | 0.662 | 0.319 | 16.56 | 998.03 | 28.75 |
| 2023-05-08 13:29 | 50.806027 | 19.103187 | 270.9 | 7.1 | 2.3 | 0 | 0.3 | 0.882 | 0.337 | 17.09 | 997.9 | 28.29 |
| 2023-05-08 13:28 | 50.80842 | 19.103825 | 270.2 | 6.1 | 2.2 | 0 | 0.355 | 0.998 | 0.368 | 17.37 | 997.4 | 28.09 |
| 2023-05-08 13:27 | 50.810742 | 19.104067 | 268.0 | 6.3 | 2.1 | 0 | 0.404 | 0.729 | 0.37 | 17.69 | 997.61 | 26.86 |
| 2023-05-08 13:26 | 50.812808 | 19.104128 | 266.6 | 5.4 | 1.8 | 0 | 0.509 | 1.033 | 0.405 | 18.42 | 997.45 | 25.82 |
| 2023-05-08 13:25 | 50.817035 | 19.105248 | 267.4 | 5.3 | 1.7 | 0 | 0.687 | 0.881 | 0.44 | 19.13 | 998.57 | 25.4 |
| 2023-05-08 13:24 | 50.81727 | 19.112653 | 269.5 | 4.8 | 1.4 | 0 | 0.992 | 1.118 | 0.459 | 20.35 | 998.96 | 23.28 |
| 2023-05-08 13:23 | 50.820793 | 19.11131 | 282.5 | 4.8 | 1.7 | 0 | 2.172 | 1.68 | 0.509 | 22.02 | 998.56 | 22.18 |
| 2023-05-08 13:22 | 50.822162 | 19.110895 | 275.6 | 5.9 | 2.1 | 0 | 14.246 | 3.834 | 0.63 | 23.52 | 998.31 | 23.01 |
Disclaimer/Publisher’s Note: The statements, opinions and data contained in all publications are solely those of the individual author(s) and contributor(s) and not of MDPI and/or the editor(s). MDPI and/or the editor(s) disclaim responsibility for any injury to people or property resulting from any ideas, methods, instructions or products referred to in the content. |
© 2024 by the authors. Licensee MDPI, Basel, Switzerland. This article is an open access article distributed under the terms and conditions of the Creative Commons Attribution (CC BY) license (https://creativecommons.org/licenses/by/4.0/).
Share and Cite
Bobulski, J.; Szymoniak, S.; Pasternak, K. An IoT System for Air Pollution Monitoring with Safe Data Transmission. Sensors 2024, 24, 445. https://doi.org/10.3390/s24020445
Bobulski J, Szymoniak S, Pasternak K. An IoT System for Air Pollution Monitoring with Safe Data Transmission. Sensors. 2024; 24(2):445. https://doi.org/10.3390/s24020445
Chicago/Turabian StyleBobulski, Janusz, Sabina Szymoniak, and Kamila Pasternak. 2024. "An IoT System for Air Pollution Monitoring with Safe Data Transmission" Sensors 24, no. 2: 445. https://doi.org/10.3390/s24020445
APA StyleBobulski, J., Szymoniak, S., & Pasternak, K. (2024). An IoT System for Air Pollution Monitoring with Safe Data Transmission. Sensors, 24(2), 445. https://doi.org/10.3390/s24020445