
A Deep Learning Approach for Autonomous Compression Damage Identification in Fiber-Reinforced Concrete Using Piezoelectric Lead Zirconate Titanate Transducers

 ,
,  ,
,  ,
, 

Abstract
1. Introduction
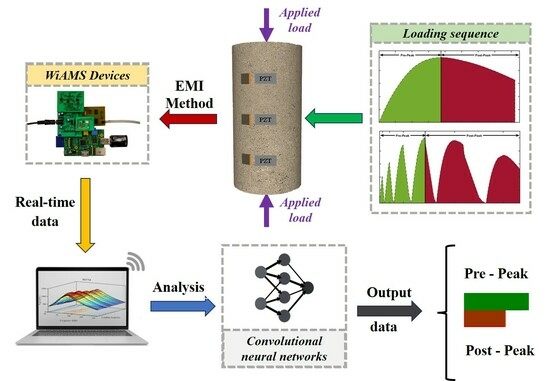
2. Methodology
2.1. Electromechanical Impedance Technique
| Harmonic alternating voltage | Electric current | ||
| Resistance | Reactance | ||
| Thickness of PZT patch | Half-length of the PZT patch | ||
| Spring constant | Complex Young’s modulus of the elasticity at constant electric field | ||
| Effective mechanical impedance | Effective structural impedance | ||
| Angular frequency | Complex electric permittivity at constant stress | ||
| Piezoelectric strain coefficient | |||
| The imaginary unit | Poisson’s ratio |
2.2. 1-D CNN for Damage Identification
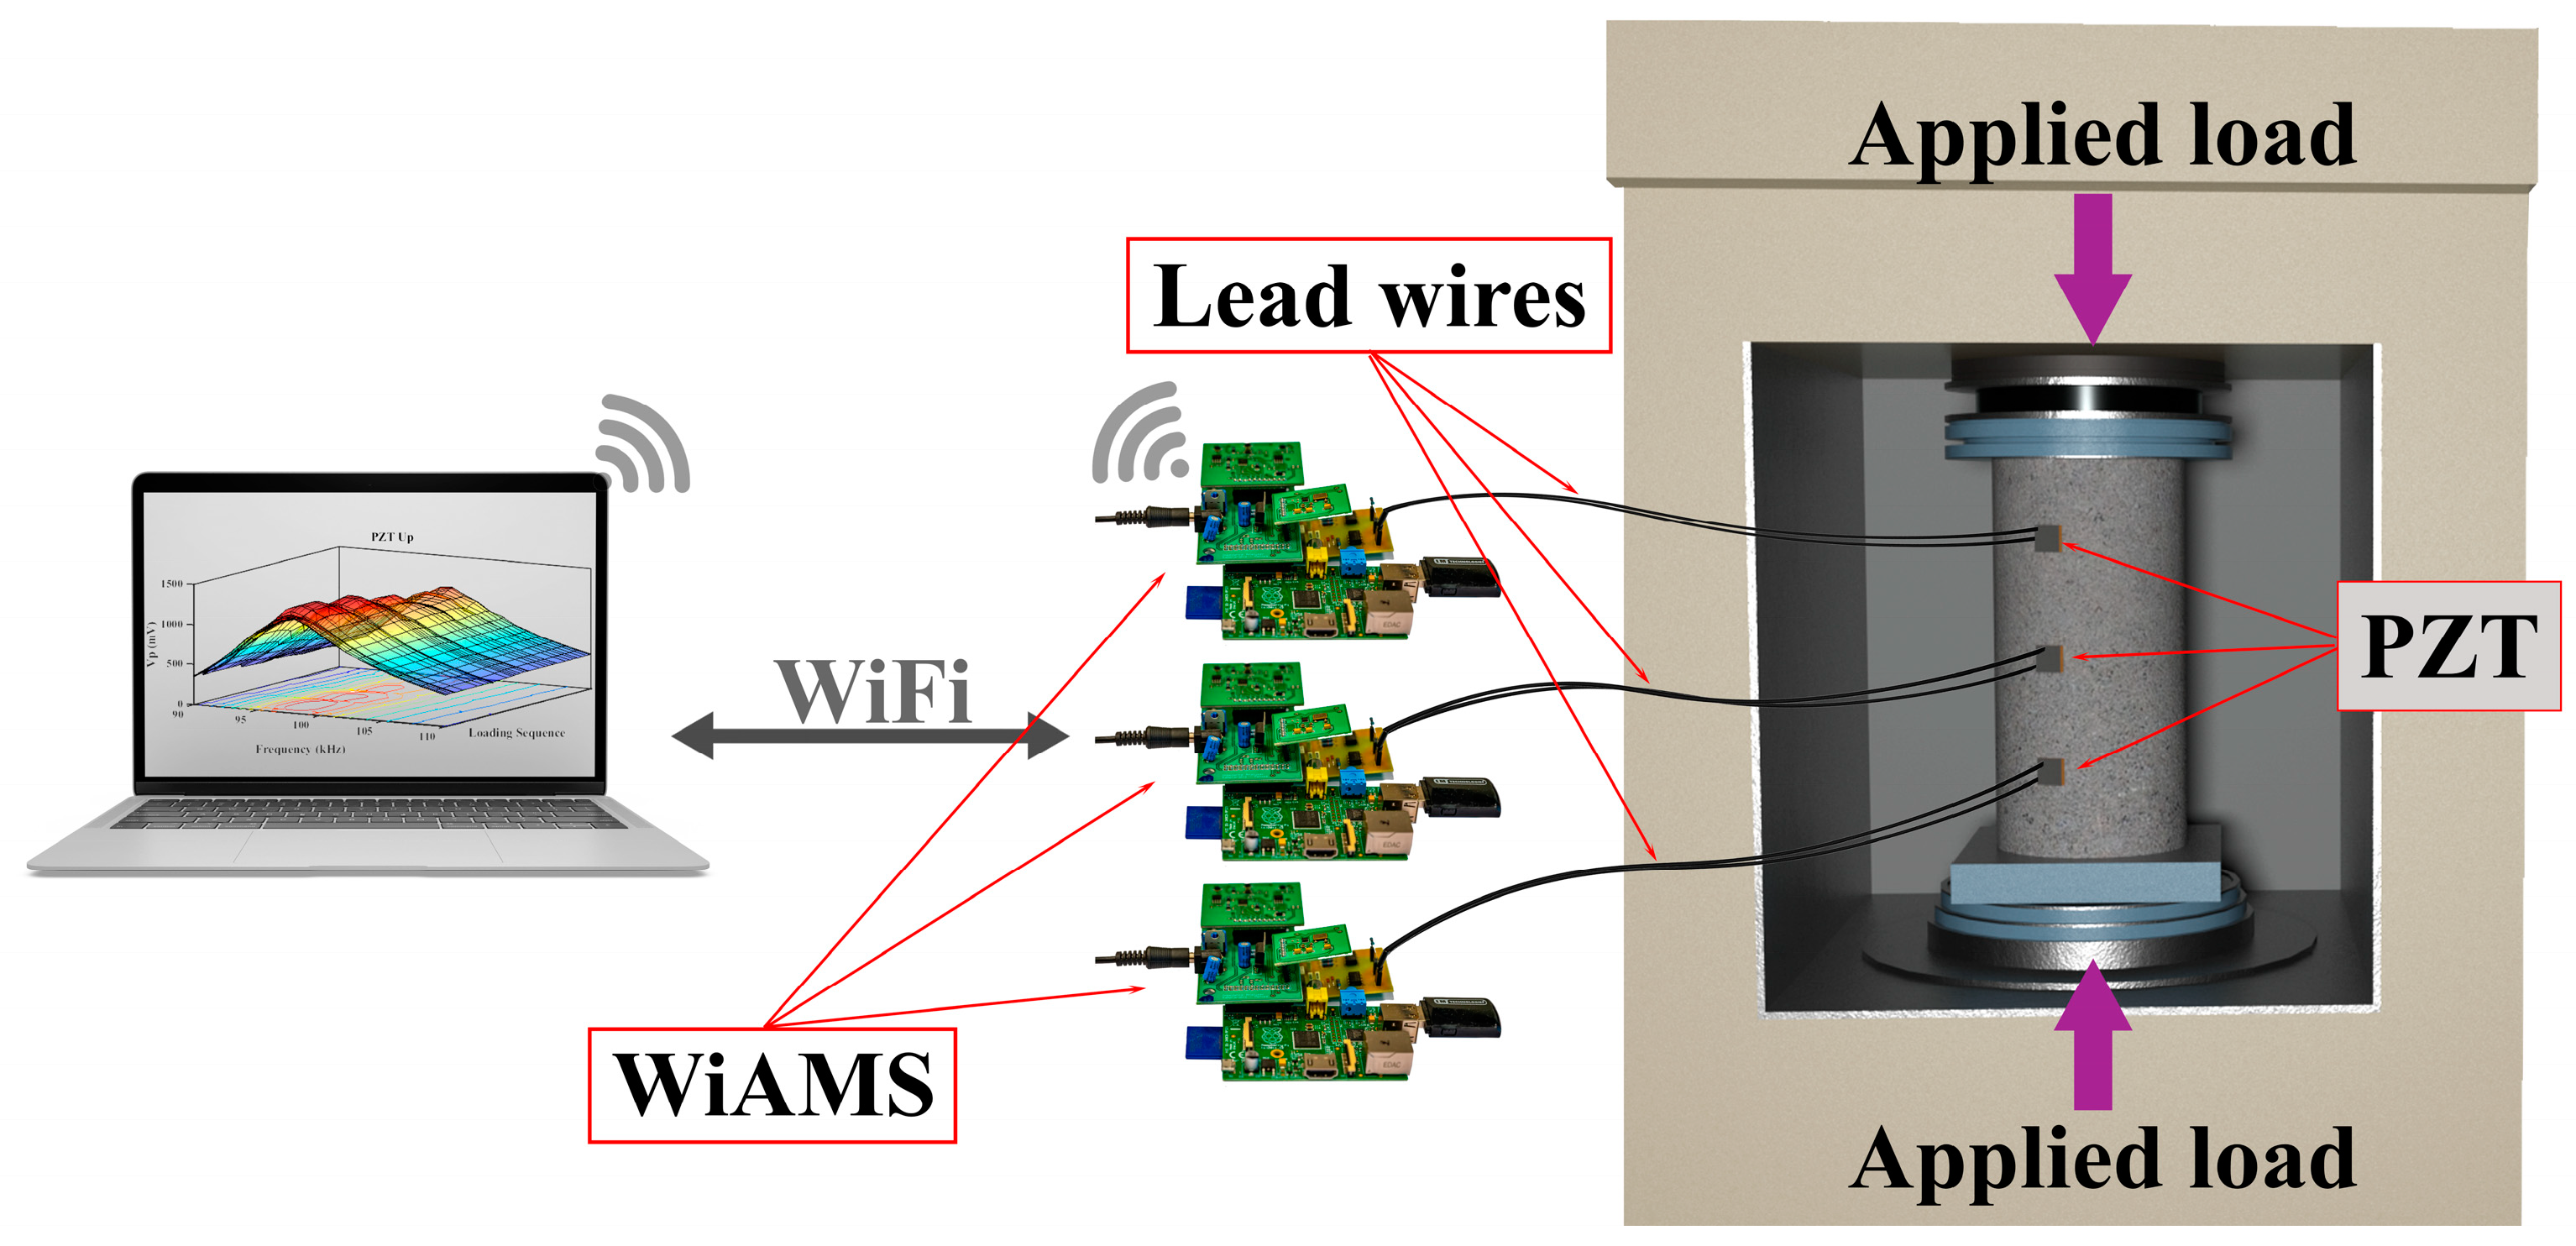
3. Experimental Investigation
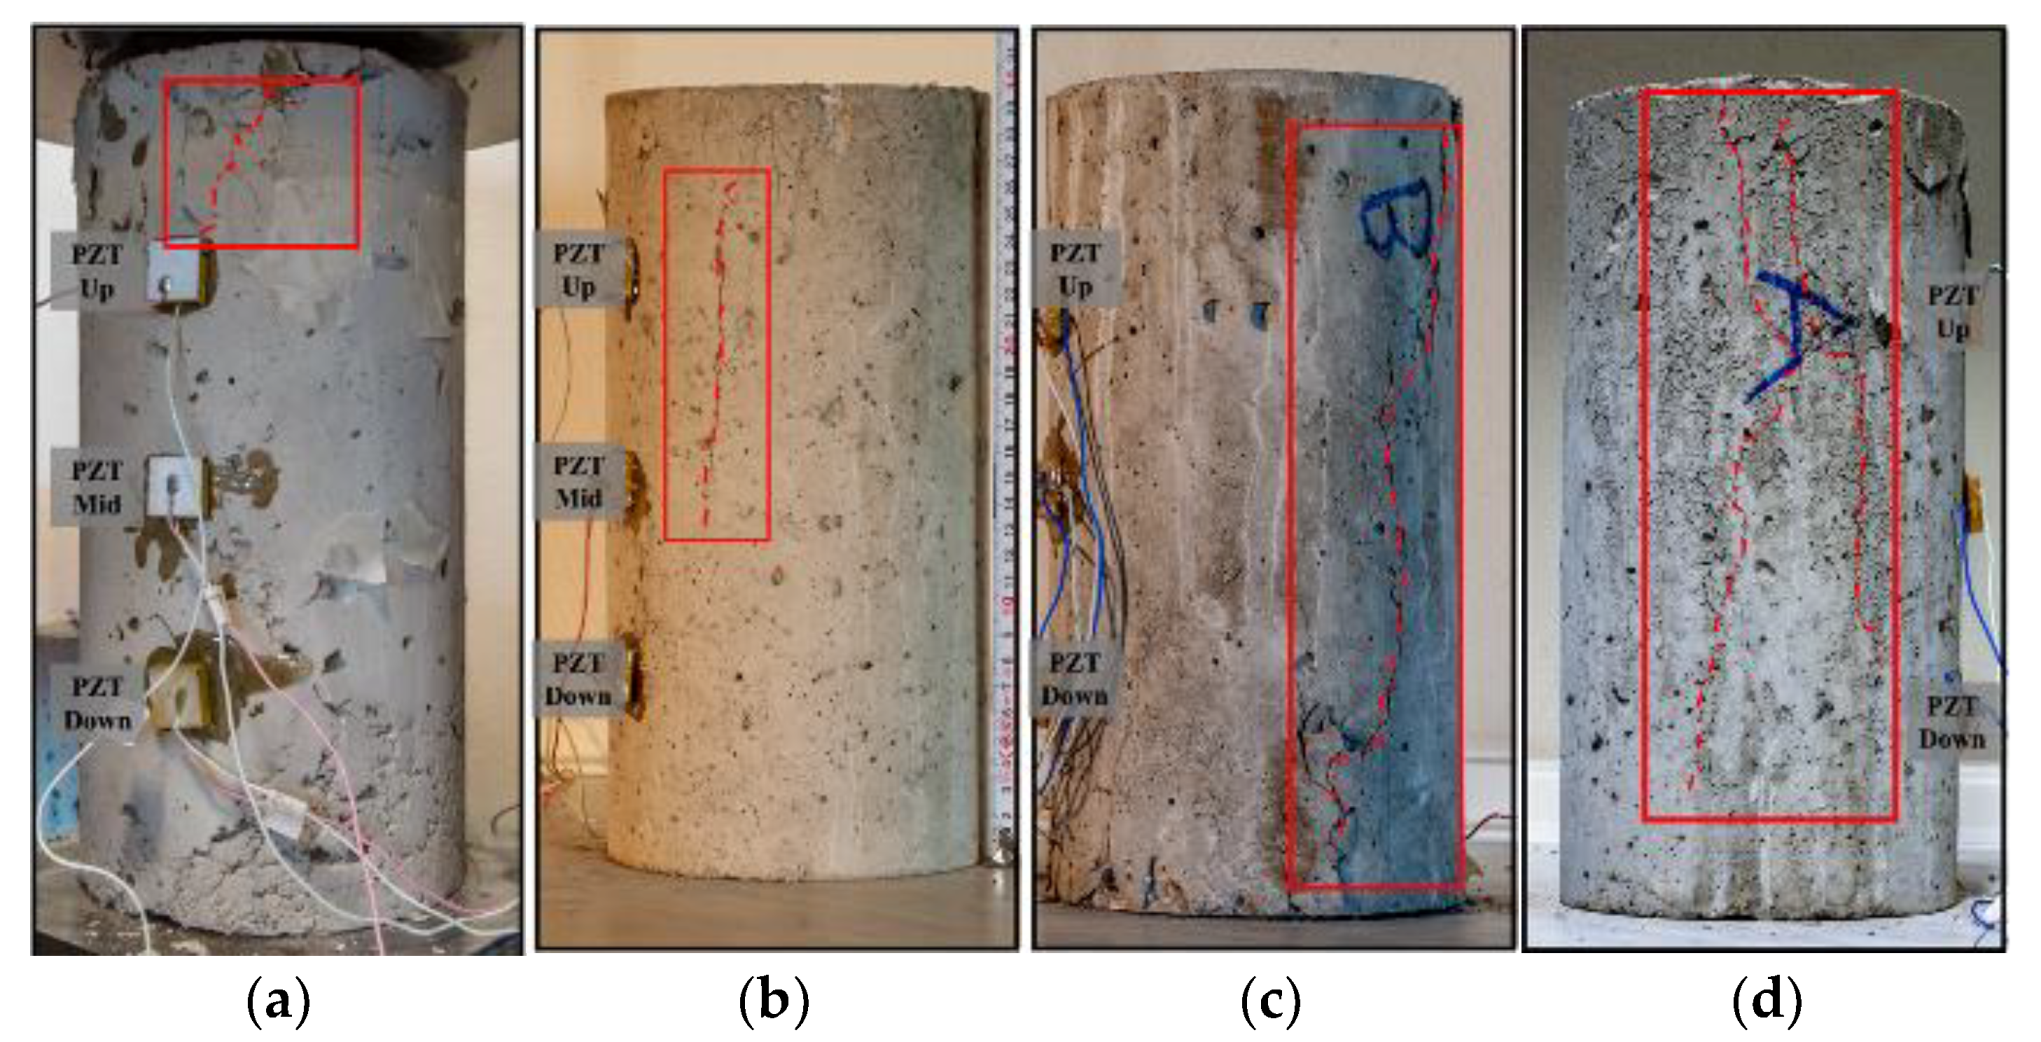
3.1. Materials and Specimens
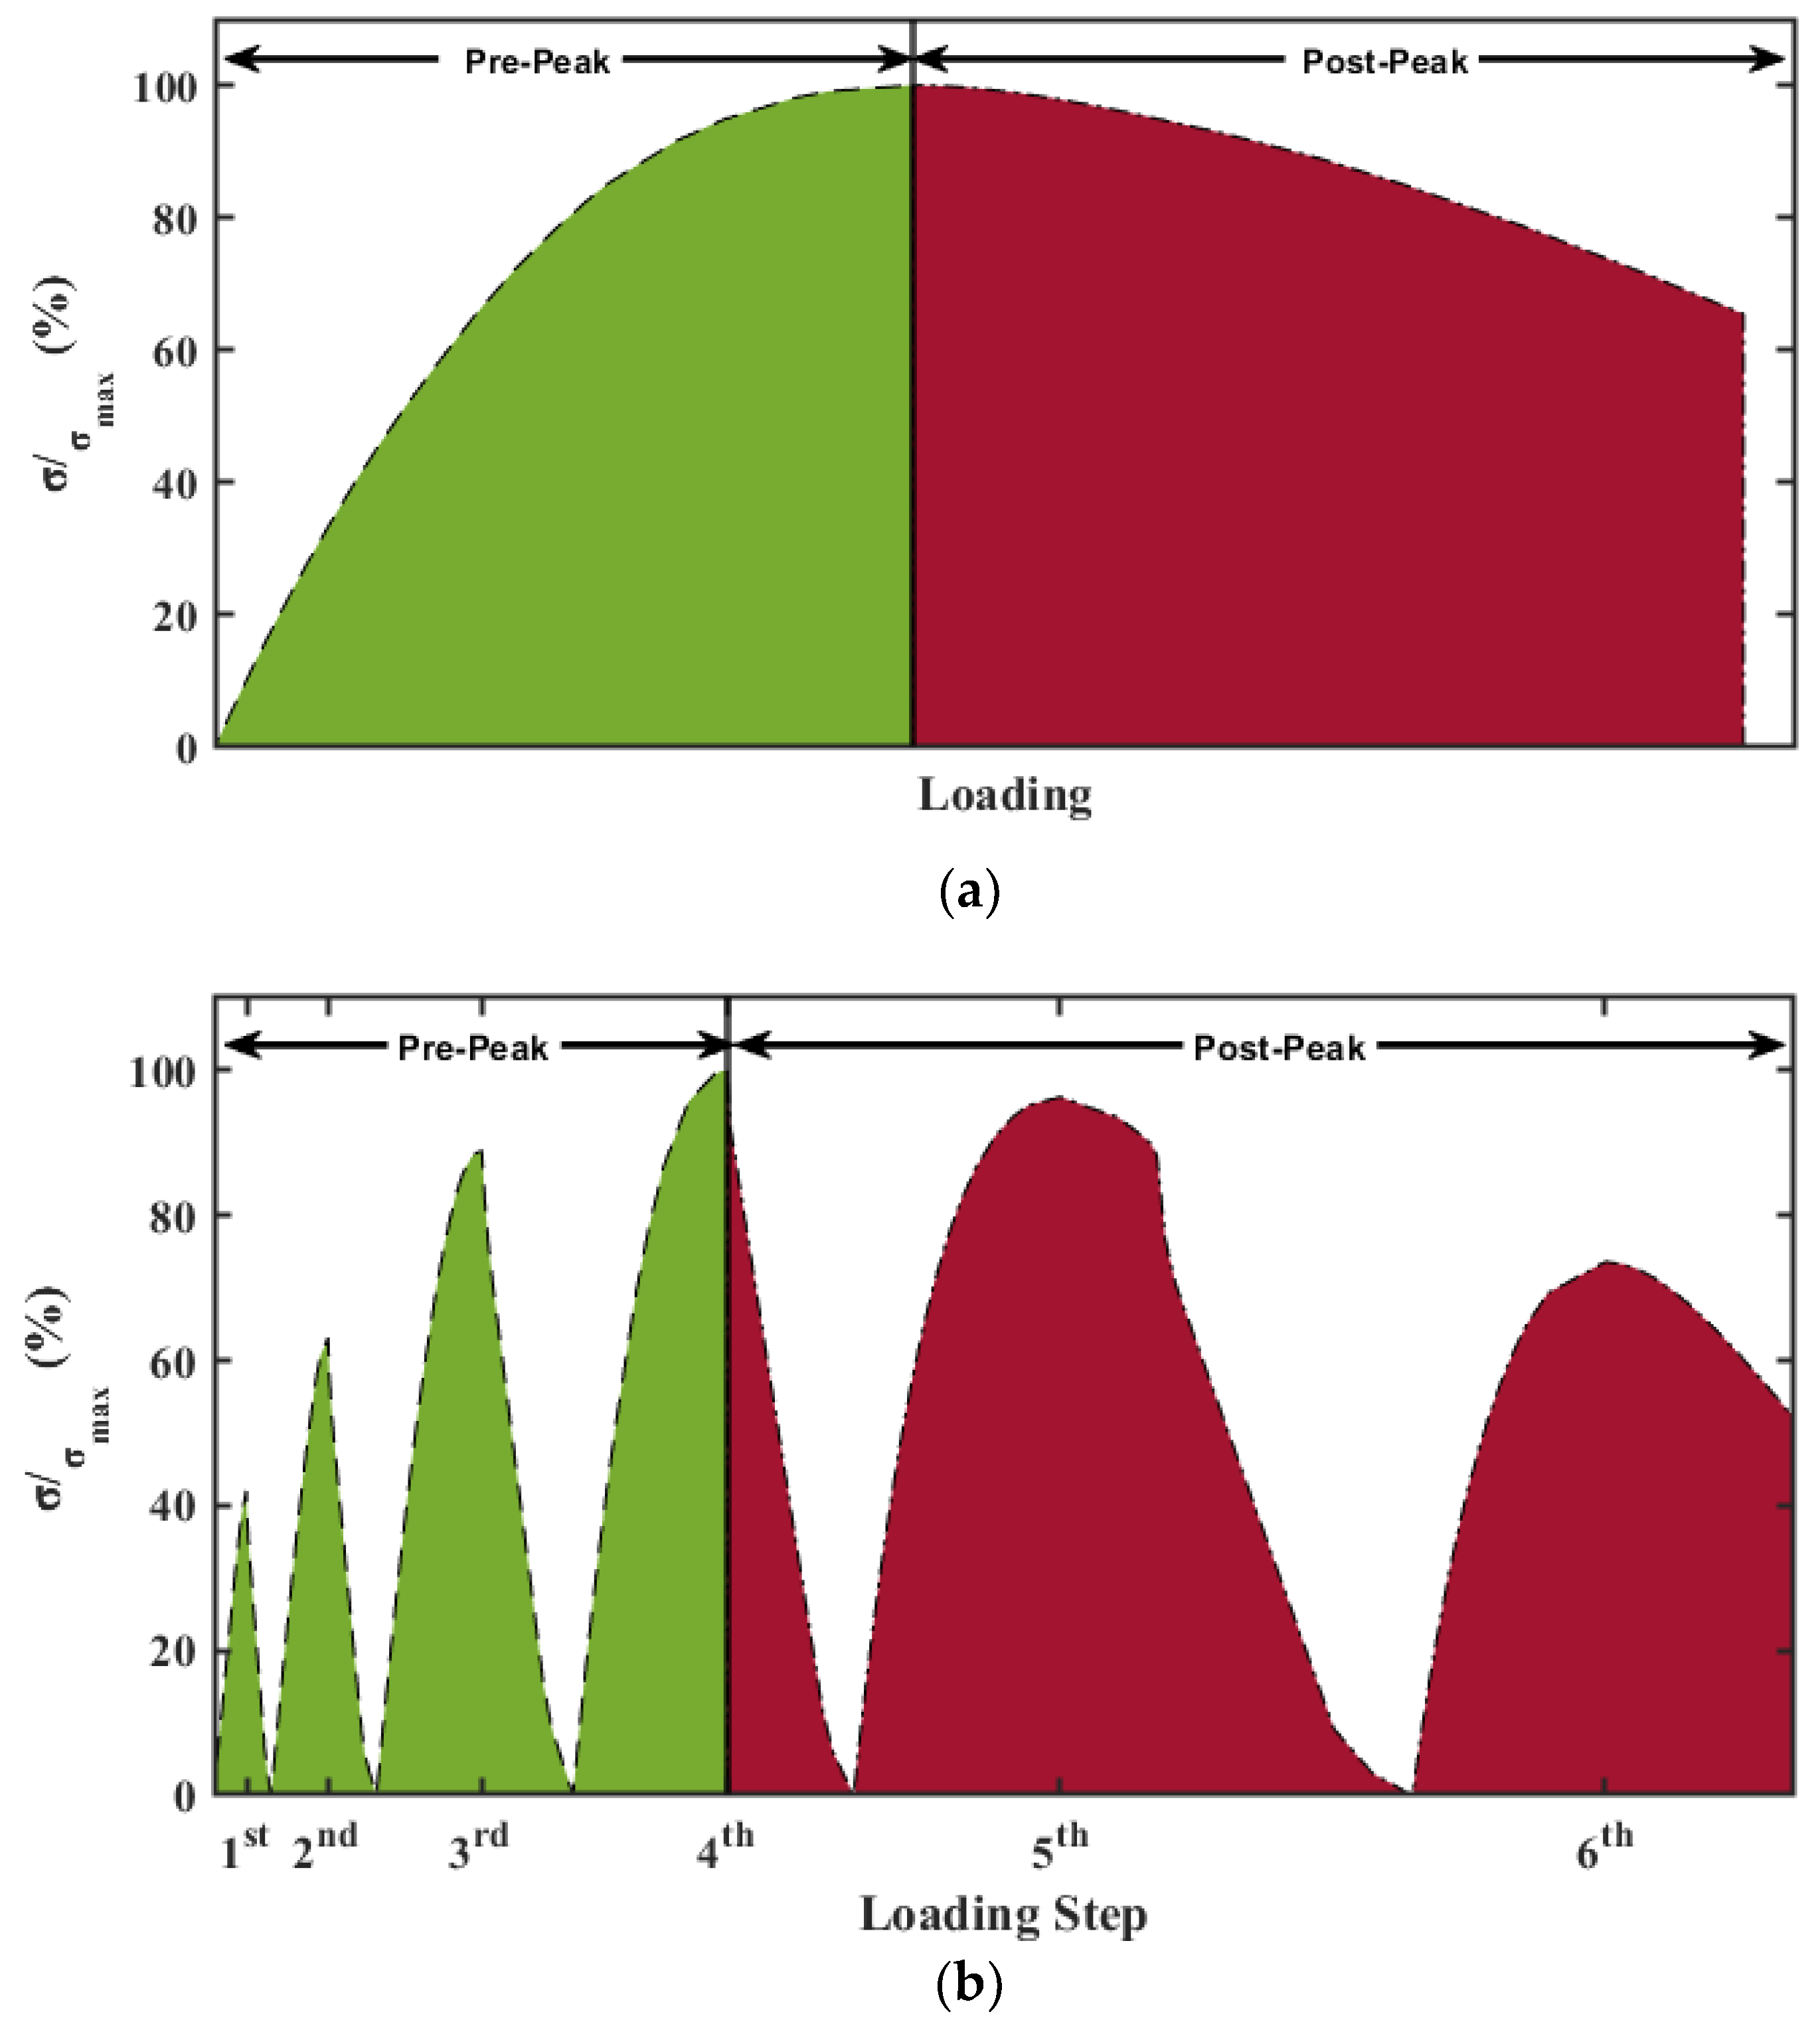
3.2. Compression Test and Data Acquisition for SHM
4. Results
4.1. Evaluation Protocol and Experimental Setup
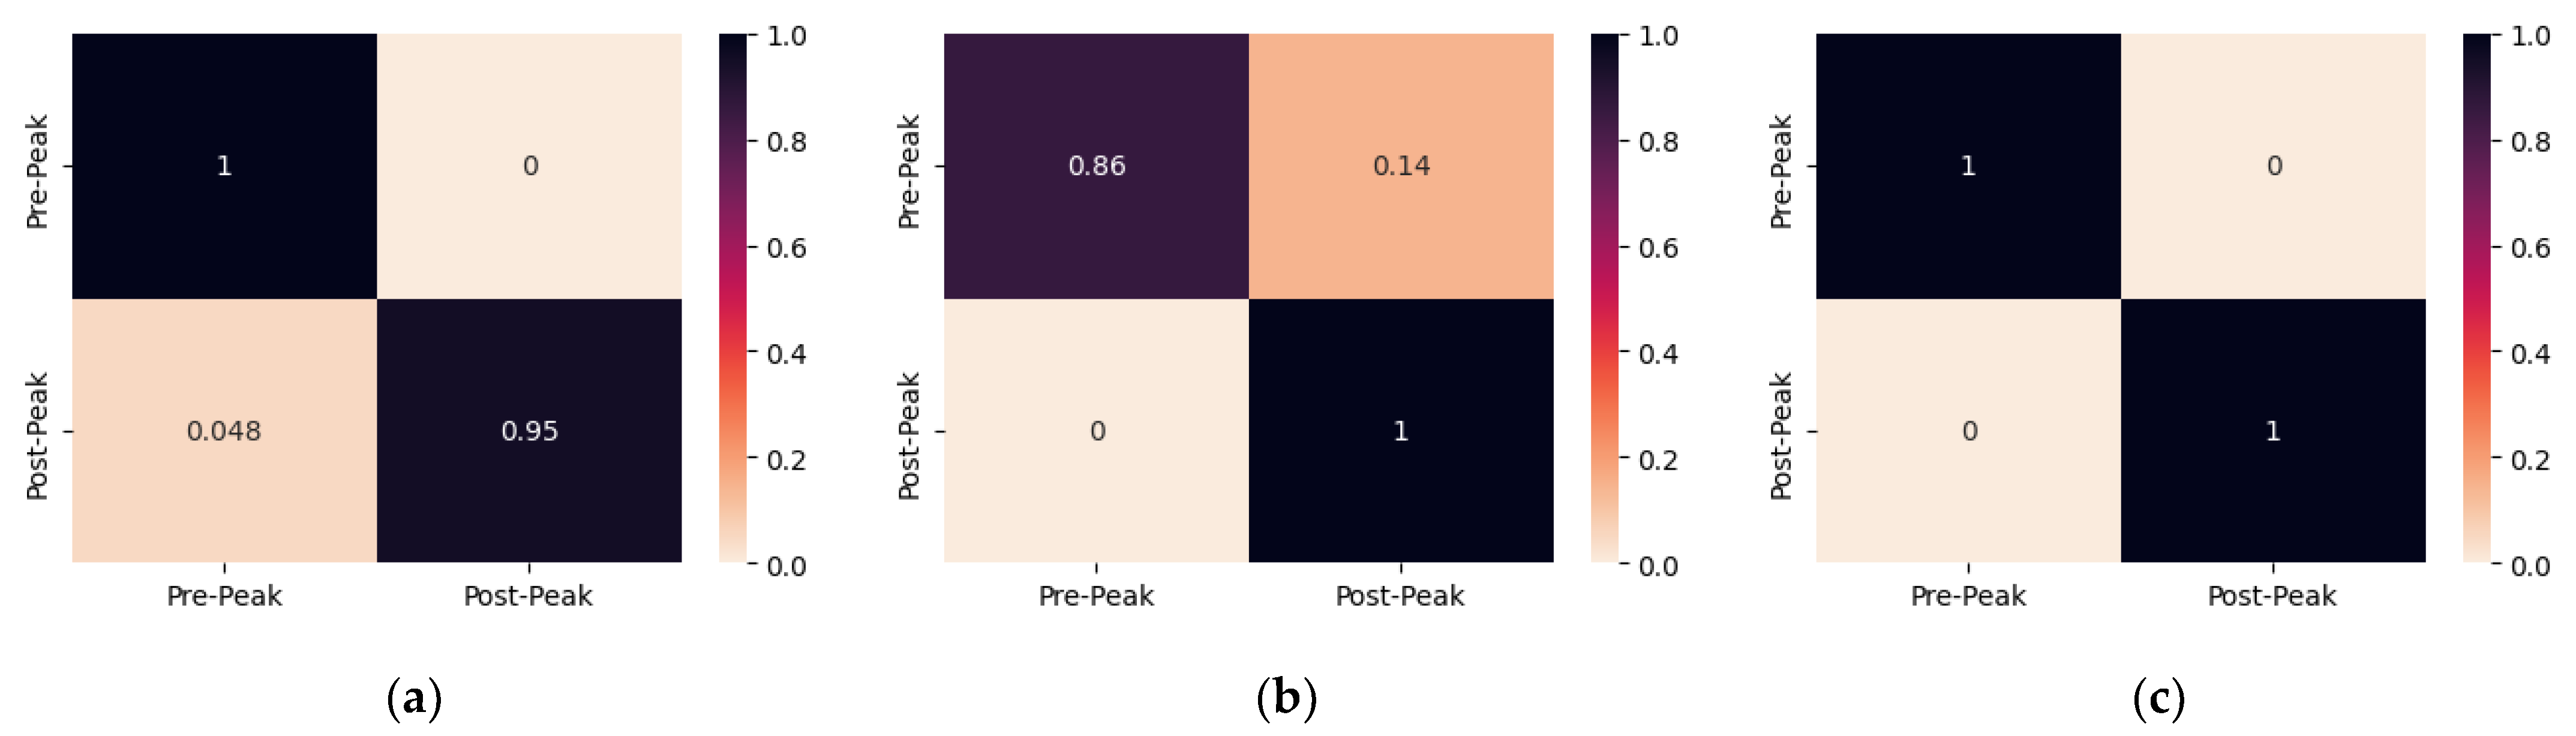
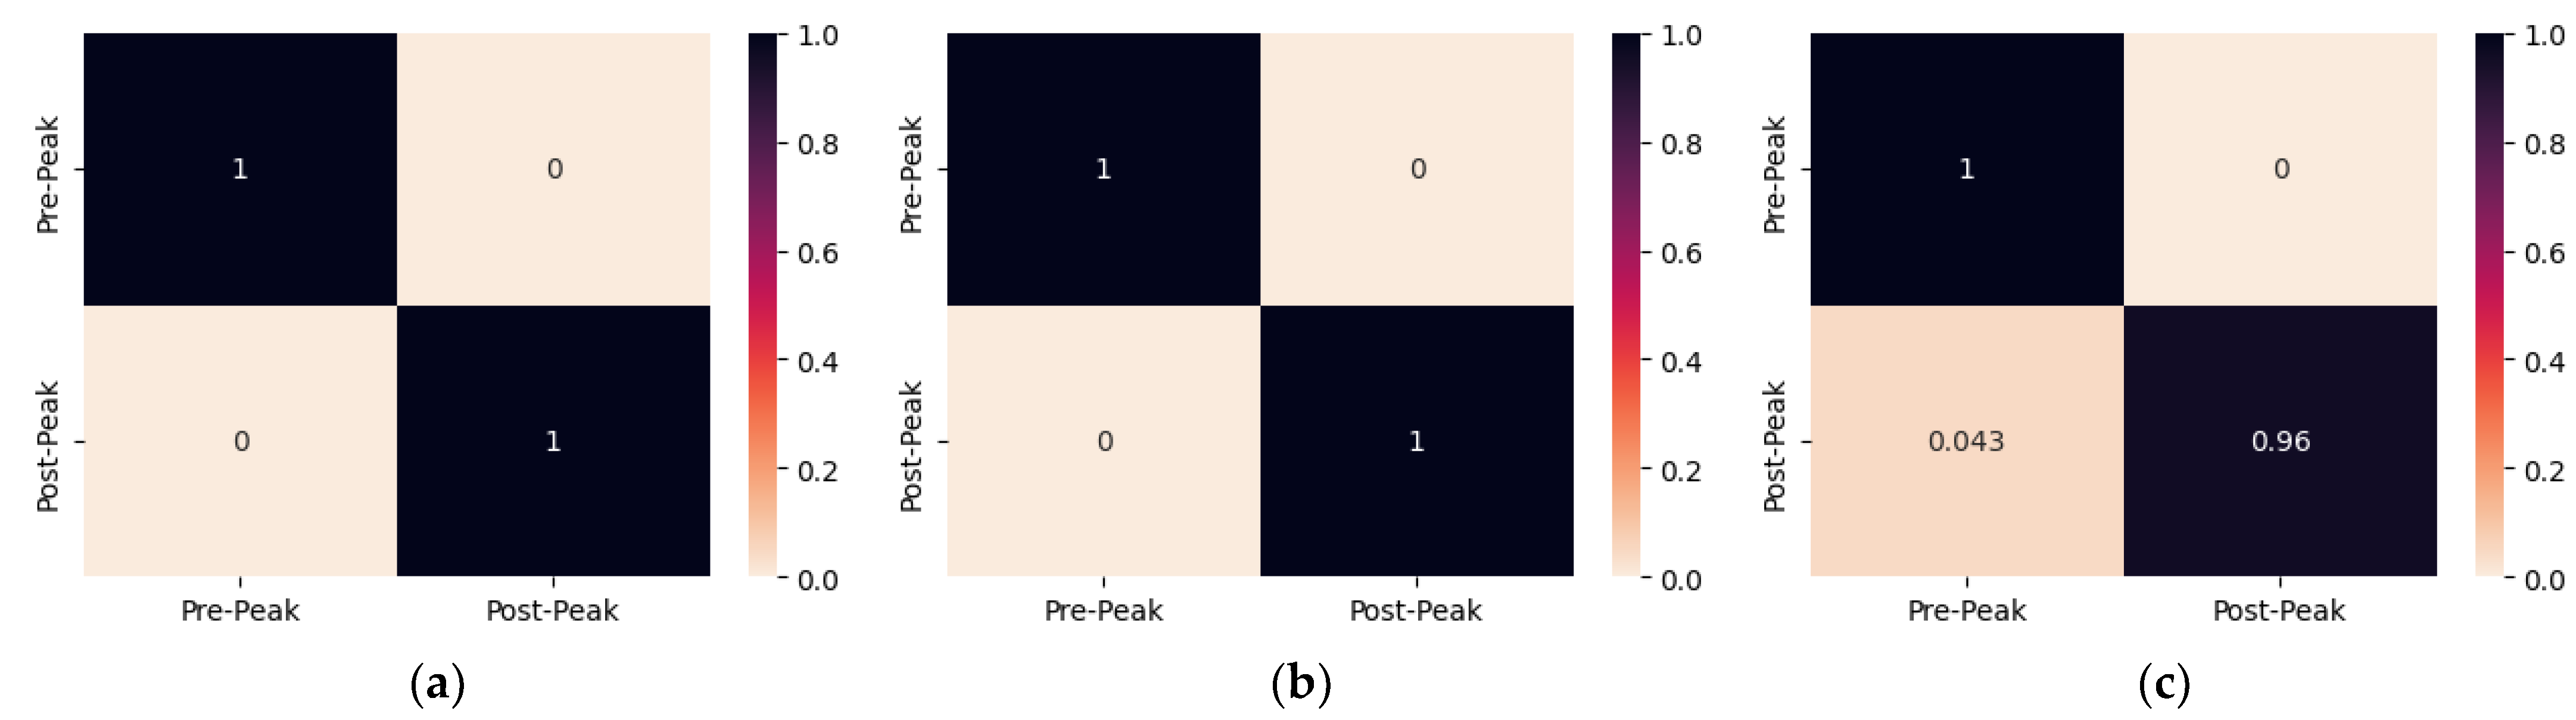
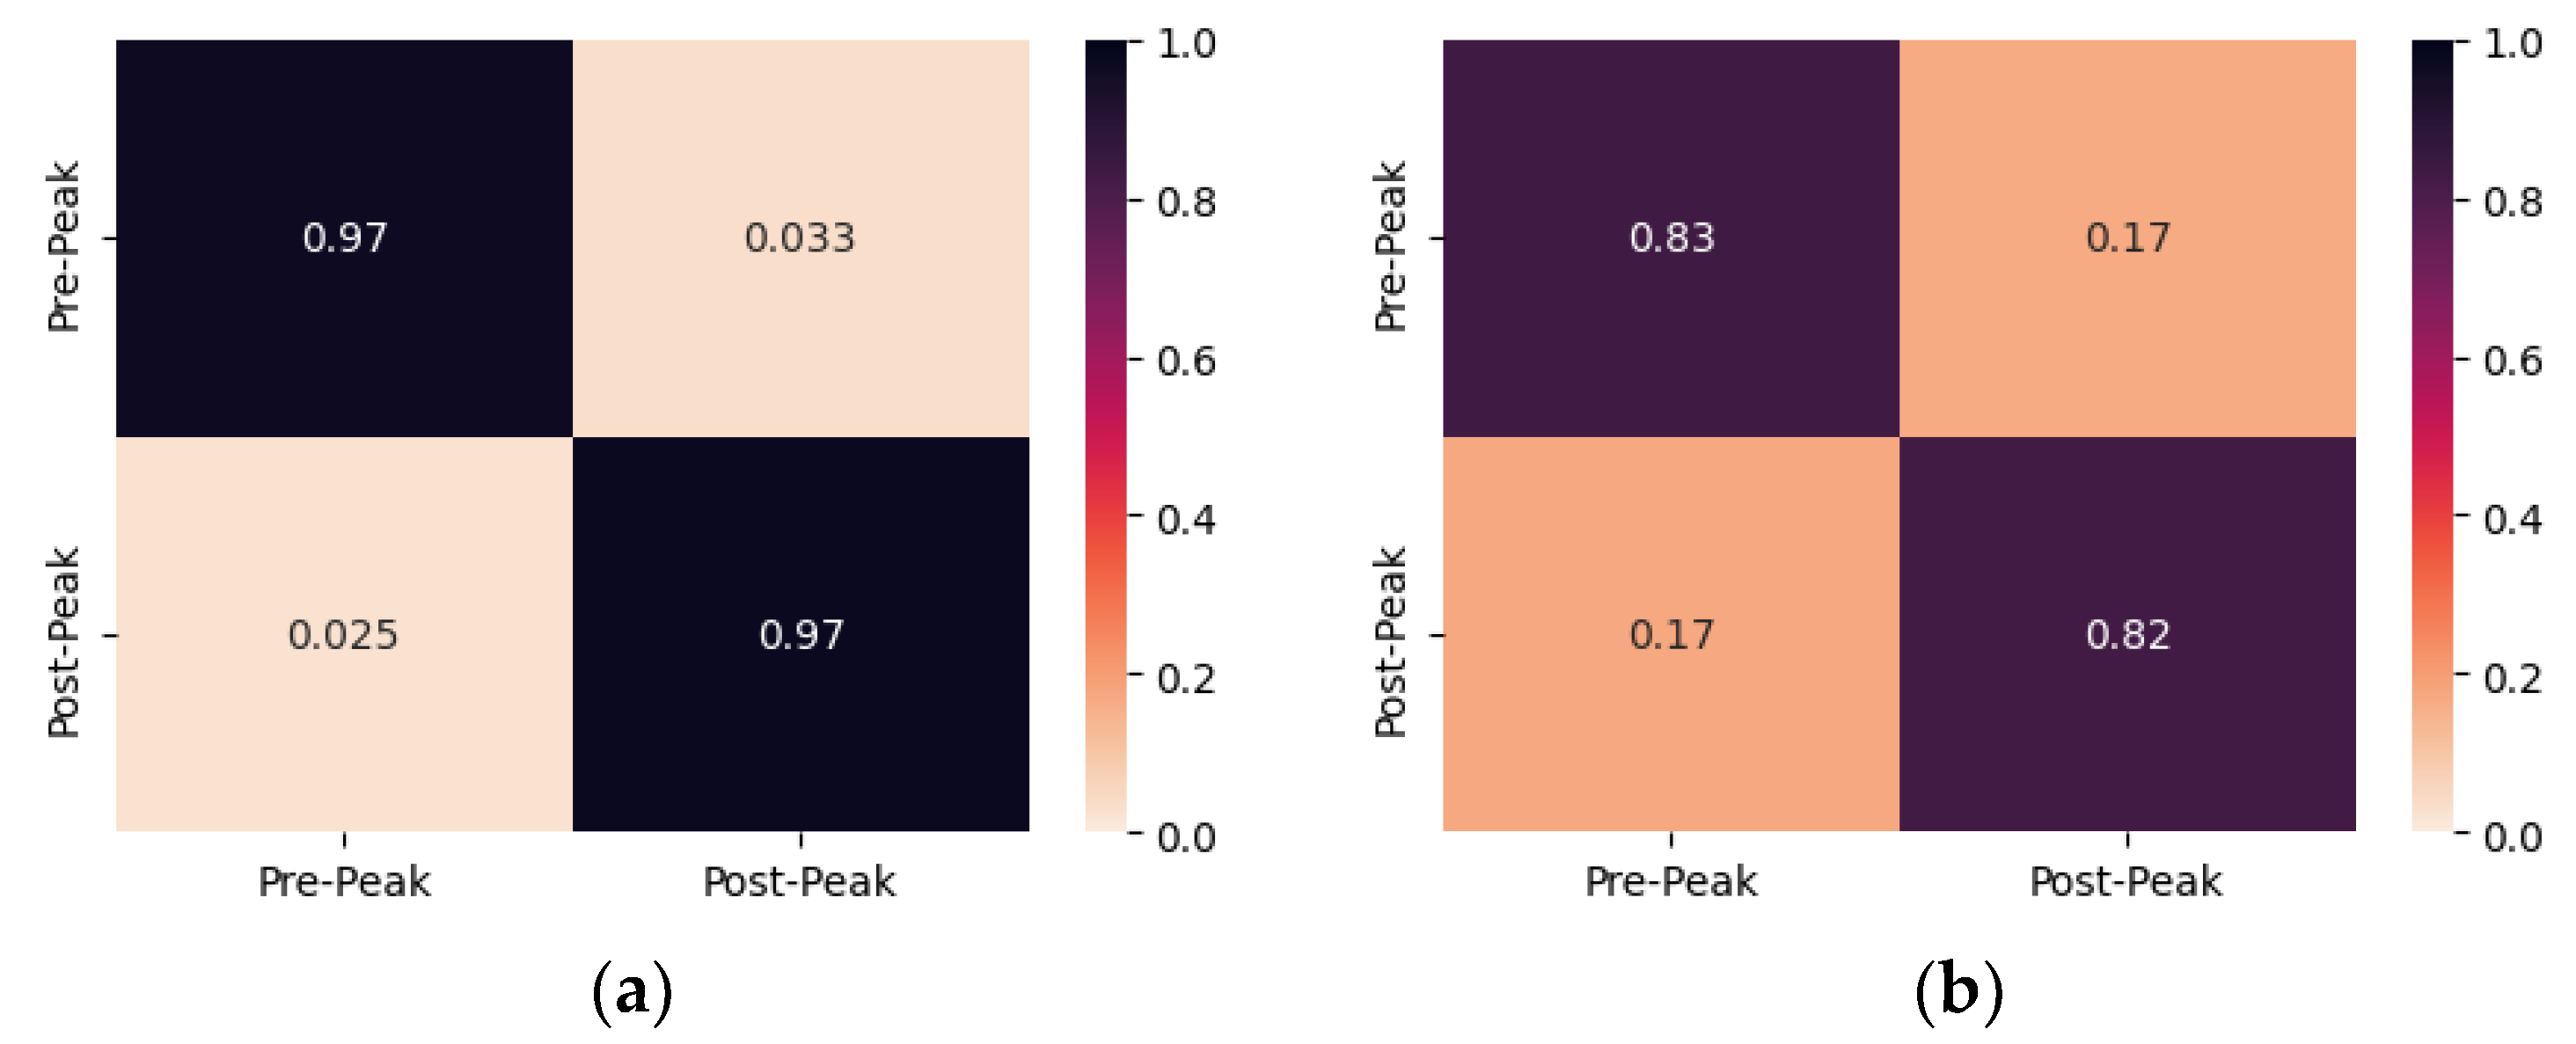
4.2. Performance Evaluation of the Proposed CNN Model for Damage Identification of Compression Loading
5. Conclusions
Author Contributions
Funding
Institutional Review Board Statement
Informed Consent Statement
Data Availability Statement
Conflicts of Interest
References
- Naoum, M.C.; Sapidis, G.M.; Papadopoulos, N.A.; Voutetaki, M.E. An Electromechanical Impedance-Based Application of Realtime Monitoring for the Load-Induced Flexural Stress and Damage in Fiber-Reinforced Concrete. Fibers 2023, 11, 34. [Google Scholar] [CrossRef]
- Signorini, C.; Volpini, V. Mechanical Performance of Fiber Reinforced Cement Composites Including Fully-Recycled Plastic Fibers. Fibers 2021, 9, 16. [Google Scholar] [CrossRef]
- Shafei, B.; Kazemian, M.; Dopko, M.; Najimi, M. State-of-the-Art Review of Capabilities and Limitations of Polymer and Glass Fibers Used for Fiber-Reinforced Concrete. Materials 2021, 14, 409. [Google Scholar] [CrossRef] [PubMed]
- Altammar, H.; Dhingra, A.; Salowitz, N. Ultrasonic Sensing and Actuation in Laminate Structures Using Bondline-Embedded D35 Piezoelectric Sensors. Sensors 2018, 18, 3885. [Google Scholar] [CrossRef] [PubMed]
- Zhang, X.; Zhang, L.; Liu, L.; Huo, L. Prestress Monitoring of a Steel Strand in an Anchorage Connection Using Piezoceramic Transducers and Time Reversal Method. Sensors 2018, 18, 4018. [Google Scholar] [CrossRef] [PubMed]
- Halabe, U.B.; Vasudevan, A.; Klinkhachorn, P.; GangaRao, H.V.S. Detection of Subsurface Defects in Fiber Reinforced Polymer Composite Bridge Decks Using Digital Infrared Thermography. Nondestruct. Test. Eval. 2007, 22, 155–175. [Google Scholar] [CrossRef]
- Milovanović, B.; Gaši, M.; Gumbarević, S. Principal Component Thermography for Defect Detection in Concrete. Sensors 2020, 20, 3891. [Google Scholar] [CrossRef]
- Kordatos, E.Z.; Aggelis, D.G.; Matikas, T.E. Monitoring mechanical damage in structural materials using complimentary NDE techniques based on thermography and acoustic emission. Comp Part B Eng. 2012, 43, 2676–2686. [Google Scholar] [CrossRef]
- Mpalaskas, A.C.; Matikas, T.E.; Aggelis, D.G.; Alver, N. Acoustic Emission for Evaluating the Reinforcement Effectiveness in Steel Fiber Reinforced Concrete. Appl. Sci. 2021, 11, 3850. [Google Scholar] [CrossRef]
- Zaki, A.; Chai, H.; Aggelis, D.; Alver, N. Non-Destructive Evaluation for Corrosion Monitoring in Concrete: A Review and Capability of Acoustic Emission Technique. Sensors 2015, 15, 19069–19101. [Google Scholar] [CrossRef]
- Mei, H.; Haider, M.; Joseph, R.; Migot, A.; Giurgiutiu, V. Recent Advances in Piezoelectric Wafer Active Sensors for Structural Health Monitoring Applications. Sensors 2019, 19, 383. [Google Scholar] [CrossRef]
- Wu, T.; Liu, G.; Fu, S.; Xing, F. Recent Progress of Fiber-Optic Sensors for the Structural Health Monitoring of Civil Infrastructure. Sensors 2020, 20, 4517. [Google Scholar] [CrossRef] [PubMed]
- Peng, Y.; Qi, W.; Chen, Y.; Mai, R.; Madawala, U.K. Wireless Sensor Power Supply Based on Eddy Currents for Structural Health Monitoring. IEEE Trans. Ind. Electron. 2023, 1–10. [Google Scholar] [CrossRef]
- Hire, J.H.; Hosseini, S.; Moradi, F. Optimum PZT Patch Size for Corrosion Detection in Reinforced Concrete Using the Electromechanical Impedance Technique. Sensors 2021, 21, 3903. [Google Scholar] [CrossRef] [PubMed]
- Morwal, T.; Bansal, T.; Azam, A.; Talakokula, V. Monitoring Chloride-Induced Corrosion in Metallic and Reinforced/Prestressed Concrete Structures Using Piezo Sensors-Based Electro-Mechanical Impedance Technique: A Review. Measurement 2023, 218, 113102. [Google Scholar] [CrossRef]
- Talakokula, V.; Bhalla, S.; Gupta, A. Corrosion Assessment of Reinforced Concrete Structures Based on Equivalent Structural Parameters Using Electro-Mechanical Impedance Technique. J. Intell. Mater. Syst. Struct. 2014, 25, 484–500. [Google Scholar] [CrossRef]
- Ai, D.; Du, L.; Li, H.; Zhu, H. Corrosion Damage Identification for Reinforced Concrete Beam Using Embedded Piezoelectric Transducer: Numerical Simulation. Measurement 2022, 192, 110925. [Google Scholar] [CrossRef]
- Ai, D.; Zhu, H.; Luo, H. Sensitivity of Embedded Active PZT Sensor for Concrete Structural Impact Damage Detection. Constr. Build. Mater. 2016, 111, 348–357. [Google Scholar] [CrossRef]
- Ai, D.; Yang, Z.; Li, H.; Zhu, H. Heating-Time Effect on Electromechanical Admittance of Surface-Bonded PZT Sensor for Concrete Structural Monitoring. Measurement 2021, 184, 109992. [Google Scholar] [CrossRef]
- Ai, D.; Cheng, J. A Deep Learning Approach for Electromechanical Impedance Based Concrete Structural Damage Quantification Using Two-Dimensional Convolutional Neural Network. Mech. Syst. Signal Process. 2023, 183, 109634. [Google Scholar] [CrossRef]
- Tseng, K.K.; Wang, L. Smart Piezoelectric Transducers for In Situ Health Monitoring of Concrete. Smart Mater. Struct. 2004, 13, 1017–1024. [Google Scholar] [CrossRef]
- Papadopoulos, N.A.; Naoum, M.C.; Sapidis, G.M.; Chalioris, C.E. Cracking and Fiber Debonding Identification of Concrete Deep Beams Reinforced with C-FRP Ropes against Shear Using a Real-Time Monitoring System. Polymers 2023, 15, 473. [Google Scholar] [CrossRef] [PubMed]
- Zapris, A.G.; Naoum, M.C.; Kytinou, V.K.; Sapidis, G.M.; Chalioris, C.E. Fiber Reinforced Polymer Debonding Failure Identification Using Smart Materials in Strengthened T-Shaped Reinforced Concrete Beams. Polymers 2023, 15, 278. [Google Scholar] [CrossRef] [PubMed]
- Murad, Y.; Abdel-Jabar, H. Flexural Behavior of RC Beams Made with Electric PVC Wires and Steel Fibers. Pract. Period. Struct. Des. Constr. 2021, 26, 04021040. [Google Scholar] [CrossRef]
- Bhalla, S.; Kaur, N. Prognosis of Low-Strain Fatigue Induced Damage in Reinforced Concrete Structures Using Embedded Piezo-Transducers. Int. J. Fatigue 2018, 113, 98–112. [Google Scholar] [CrossRef]
- Kaur, H.; Singla, S. Non-Destructive Testing to Detect Multiple Cracks in Reinforced Concrete Beam Using Electromechanical Impedance Technique. Mater. Today Proc. 2022, 65, 1193–1199. [Google Scholar] [CrossRef]
- Kaur, H.; Singla, S. Assessment of Reinforced Concrete Beam with Electro-Mechanical Impedance Technique Based on Piezoelectric Transducers. Arab. J. Sci. Eng. 2023, 48, 13449–13463. [Google Scholar] [CrossRef]
- Jinesh, N.; Shankar, K. Sub-Structural Parameter Identification Including Cracks of Beam Structure Using PZT Patch. Inter. J. Comput. Methods Eng. Sci. Mech. 2019, 20, 115–129. [Google Scholar] [CrossRef]
- Perera, R.; Torres, L.; Ruiz, A.; Barris, C.; Baena, M. An EMI-Based Clustering for Structural Health Monitoring of NSM FRP Strengthening Systems. Sensors 2019, 19, 3775. [Google Scholar] [CrossRef]
- Ai, D.; Luo, H.; Wang, C.; Zhu, H. Monitoring of the Load-Induced RC Beam Structural Tension/Compression Stress and Damage Using Piezoelectric Transducers. Eng. Struct. 2018, 154, 38–51. [Google Scholar] [CrossRef]
- Haq, M.; Bhalla, S.; Naqvi, T. Piezo-Impedance Based Fatigue Damage Monitoring of Restrengthened Concrete Frames. Compos. Struct. 2022, 280, 114868. [Google Scholar] [CrossRef]
- Karayannis, C.G.; Golias, E.; Naoum, M.C.; Chalioris, C.E. Efficacy and Damage Diagnosis of Reinforced Concrete Columns and Joints Strengthened with FRP Ropes Using Piezoelectric Transducers. Sensors 2022, 22, 8294. [Google Scholar] [CrossRef] [PubMed]
- Naoum, M.; Sapidis, G.; Papadopoulos, N.; Golias, E.; Chalioris, C. Structural Health Monitoring of Reinforced Concrete Beam-Column Joints Using Piezoelectric Transducers. In International RILEM Conference on Synergising Expertise towards Sustainability and Robustness of Cement-Based Materials and Concrete Structures; Jędrzejewska, A., Kanavaris, F., Azenha, M., Benboudjema, F., Schlicke, D., Eds.; RILEM Bookseries; Springer Nature: Cham, Switzerland, 2023; Volume 43, pp. 945–956. ISBN 978-3-031-33210-4. [Google Scholar]
- Kocherla, A.; Subramaniam, K.V.L. Stress and Damage Localization Monitoring in Fiber-Reinforced Concrete Using Surface-Mounted PZT Sensors. Meas. Sci. Technol. 2020, 31, 024004. [Google Scholar] [CrossRef]
- Kocherla, A.; Duddi, M.; Subramaniam, K.V.L. Embedded PZT Sensors for Monitoring Formation and Crack Opening in Concrete Structures. Measurement 2021, 182, 109698. [Google Scholar] [CrossRef]
- Narayanan, A.; Kocherla, A.; Subramaniam, K.V.L. PZT Sensor Array for Local and Distributed Measurements of Localized Cracking in Concrete. Smart Mater. Struct. 2018, 27, 075049. [Google Scholar] [CrossRef]
- Naoum, M.C.; Papadopoulos, N.A.; Voutetaki, M.E.; Chalioris, C.E. Structural Health Monitoring of Fiber-Reinforced Concrete Prisms with Polyolefin Macro-Fibers Using a Piezoelectric Materials Network under Various Load-Induced Stress. Buildings 2023, 13, 2465. [Google Scholar] [CrossRef]
- Narayanan, A.; Subramaniam, K.V.L. Sensing of Damage and Substrate Stress in Concrete Using Electro-Mechanical Impedance Measurements of Bonded PZT Patches. Smart Mater. Struct. 2016, 25, 095011. [Google Scholar] [CrossRef]
- Zhang, C.; Yan, Q.; Panda, G.P.; Wu, W.; Song, G.; Vipulanandan, C. Real-Time Monitoring Stiffness Degradation of Hardened Cement Paste under Uniaxial Compression Loading through Piezoceramic-Based Electromechanical Impedance Method. Constr. Build. Mater. 2020, 256, 119395. [Google Scholar] [CrossRef]
- Voutetaki, M.E.; Naoum, M.C.; Papadopoulos, N.A.; Chalioris, C.E. Cracking Diagnosis in Fiber-Reinforced Concrete with Synthetic Fibers Using Piezoelectric Transducers. Fibers 2022, 10, 5. [Google Scholar] [CrossRef]
- Kocherla, A.; Subramaniam, K.V.L. Embedded Smart PZT-Based Sensor for Internal Damage Detection in Concrete under Applied Compression. Measurement 2020, 163, 108018. [Google Scholar] [CrossRef]
- Ai, D.; Mo, F.; Han, Y.; Wen, J. Automated Identification of Compressive Stress and Damage in Concrete Specimen Using Convolutional Neural Network Learned Electromechanical Admittance. Eng. Struct. 2022, 259, 114176. [Google Scholar] [CrossRef]
- Wang, Z.; Chen, D.; Zheng, L.; Huo, L.; Song, G. Influence of Axial Load on Electromechanical Impedance (EMI) of Embedded Piezoceramic Transducers in Steel Fiber Concrete. Sensors 2018, 18, 1782. [Google Scholar] [CrossRef] [PubMed]
- Perera, R.; Huerta, M.C.; Baena, M.; Barris, C. Analysis of FRP-Strengthened Reinforced Concrete Beams Using Electromechanical Impedance Technique and Digital Image Correlation System. Sensors 2023, 23, 8933. [Google Scholar] [CrossRef]
- Pham, Q.-Q.; Dang, N.-L.; Ta, Q.-B.; Kim, J.-T. Optimal Localization of Smart Aggregate Sensor for Concrete Damage Monitoring in PSC Anchorage Zone. Sensors 2021, 21, 6337. [Google Scholar] [CrossRef] [PubMed]
- Sevillano, E.; Sun, R.; Gil, A.; Perera, R. Interfacial Crack-Induced Debonding Identification in FRP-Strengthened RC Beams from PZT Signatures Using Hierarchical Clustering Analysis. Compos. Part B Eng. 2016, 87, 322–335. [Google Scholar] [CrossRef]
- Park, S.; Lee, J.-J.; Yun, C.-B.; Inman, D.J. Electro-Mechanical Impedance-Based Wireless Structural Health Monitoring Using PCA-Data Compression and k-Means Clustering Algorithms. J. Intell. Mater. Syst. Struct. 2008, 19, 509–520. [Google Scholar] [CrossRef]
- Min, J.; Park, S.; Yun, C.-B.; Lee, C.-G.; Lee, C. Impedance-Based Structural Health Monitoring Incorporating Neural Network Technique for Identification of Damage Type and Severity. Eng. Struct. 2012, 39, 210–220. [Google Scholar] [CrossRef]
- de Oliveira, M.; Monteiro, A.; Vieira Filho, J. A New Structural Health Monitoring Strategy Based on PZT Sensors and Convolutional Neural Network. Sensors 2018, 18, 2955. [Google Scholar] [CrossRef]
- Yu, Y.; Rashidi, M.; Samali, B.; Mohammadi, M.; Nguyen, T.N.; Zhou, X. Crack Detection of Concrete Structures Using Deep Convolutional Neural Networks Optimized by Enhanced Chicken Swarm Algorithm. Struct. Health Monit. 2022, 21, 2244–2263. [Google Scholar] [CrossRef]
- Lee, J.Y.; Sim, C.; Detweiler, C.; Barnes, B. Computer-Vision Based UAV Inspection for Steel Bridge Connections. In Proceedings of the Structural Health Monitoring 2019, Stanford, CA, USA, 10–12 September 2019; DEStech Publications, Inc.: Lancaster, PA, USA, 2019. [Google Scholar]
- Providakis, C.; Tsistrakis, S.; Voutetaki, M.; Tsompanakis, J.; Stavroulaki, M.; Agadakos, J.; Kampianakis, E.; Pentes, G.; Liarakos, E. An Innovative Active Sensing Platform for Wireless Damage Monitoring of Concrete Structures. Curr. Smart Mater. 2016, 1, 49–62. [Google Scholar] [CrossRef]
- Maurya, K.K.; Rawat, A.; Jha, G. Smart Materials and Electro-Mechanical Impedance Technique: A Review. Mater. Today Proc. 2020, 33, 4993–5000. [Google Scholar] [CrossRef]
- LeCun, Y.; Bengio, Y.; Hinton, G. Deep Learning. Nature 2015, 521, 436–444. [Google Scholar] [CrossRef] [PubMed]
- Kansizoglou, I.; Bampis, L.; Gasteratos, A. Deep Feature Space: A Geometrical Perspective. IEEE Trans. Pattern Anal. Mach. Intell. 2022, 44, 6823–6838. [Google Scholar] [CrossRef] [PubMed]
- Pang, G.; Shen, C.; Cao, L.; Hengel, A.V.D. Deep Learning for Anomaly Detection: A Review. ACM Comput. Surv. 2022, 54, 1–38. [Google Scholar] [CrossRef]
- Kansizoglou, I.; Misirlis, E.; Tsintotas, K.; Gasteratos, A. Continuous Emotion Recognition for Long-Term Behavior Modeling through Recurrent Neural Networks. Technologies 2022, 10, 59. [Google Scholar] [CrossRef]
- Jimenez-Guarneros, M.; Morales-Perez, C.; Rangel-Magdaleno, J.D.J. Diagnostic of Combined Mechanical and Electrical Faults in ASD-Powered Induction Motor Using MODWT and a Lightweight 1-D CNN. IEEE Trans. Ind. Inform. 2022, 18, 4688–4697. [Google Scholar] [CrossRef]
- Cheadle, C.; Vawter, M.P.; Freed, W.J.; Becker, K.G. Analysis of Microarray Data Using Z Score Transformation. J. Mol. Diagn. 2003, 5, 73–81. [Google Scholar] [CrossRef]
- Agarap, A.F. Deep Learning Using Rectified Linear Units (ReLU). arXiv 2018, arXiv:1803.08375. [Google Scholar] [CrossRef]
- Ioffe, S.; Szegedy, C. Batch Normalization: Accelerating Deep Network Training by Reducing Internal Covariate Shift. arXiv 2015, arXiv:1502.03167. [Google Scholar]
- ASTM C192; Practice for Making and Curing Concrete Test Specimens in the Laboratory. ASTM: West Conshohocken, PA, USA, 2004.
- ASTM C39; Standard Test Method for Compressive Strength of Cylindrical Concrete Specimens. ASTM: West Conshohocken, PA, USA, 2004.
- Kearns, M.; Ron, D. Algorithmic Stability and Sanity-Check Bounds for Leave-One-out Cross-Validation. In Proceedings of the Tenth Annual Conference on Computational Learning Theory—COLT’97, Nashville, TN, USA, 6–9 July 1997; ACM Press: New York, NY, USA, 1997; pp. 152–162. [Google Scholar]
- Wong, T.-T. Performance Evaluation of Classification Algorithms by K-Fold and Leave-One-out Cross Validation. Pattern Recognit. 2015, 48, 2839–2846. [Google Scholar] [CrossRef]
- Kingma, D.P.; Ba, J. Adam: A Method for Stochastic Optimization. arXiv 2014, arXiv:1412.6980. [Google Scholar] [CrossRef]
- Glorot, X.; Bengio, Y. Understanding the Difficulty of Training Deep Feedforward Neural Networks. In Proceedings of the Proceedings of the Thirteenth International Conference on Artificial Intelligence and Statistics, Chia Laguna Resort, Sardinia, Italy, 13–15 May 2010; Teh, Y.W., Titterington, M., Eds.; PMLR: Sardinia, Italy, 2010; Volume 9, pp. 249–256. [Google Scholar]
- Oikonomou, K.M.; Kansizoglou, I.; Gasteratos, A. A Hybrid Reinforcement Learning Approach with a Spiking Actor Network for Efficient Robotic Arm Target Reaching. IEEE Robot. Autom. Lett. 2023, 8, 3007–3014. [Google Scholar] [CrossRef]


| Layer | Kernel Size | Number of Kernels |
|---|---|---|
| Conv1D | 5 | 6 |
| BatchNorm | - | - |
| Conv1D | 5 | 16 |
| BatchNorm | - | - |
| Conv1D | 5 | 16 |
| BatchNorm | - | - |
| Fully Connected | 144 | 64 |
| BatchNorm | - | - |
| Fully Connected | 64 | 2 |
| Softmax | - | - |
| Parameter | Value | Units |
|---|---|---|
| Density | 7800 | |
| Poisson ratio | 0.34 | - |
| Relative permittivity | 2400 | - |
| Relative permittivity | 1980 | - |
| Piezoelectric charge coefficient | −210 | |
| Piezoelectric charge coefficient | 500 | |
| Mechanical quality factor | 100 | - |
| Dielectric loss factor | 20 | |
| Curie temperature | 250 | °C |
| Specimen ID | PZT Patch | Accuracy (%) | Accuracy [μ ± σ] (%) |
|---|---|---|---|
| 1 | Up | 96.43 | 97.62 ± 2.06 |
| Mid | 96.43 | ||
| Down | 100.00 | ||
| 2 | Up | 100.00 | 98.81 ± 2.06 |
| Mid | 100.00 | ||
| Down | 96.43 | ||
| 3 | Up | 95.39 | 91.54 ± 5.44 |
| Down | 87.69 | ||
| 4 | Up | 97.14 | 90.00 ± 10.10 |
| Down | 82.86 | ||
| Overall [μ ± σ] | Up | 97.24 ± 1.98 | 95.24 ± 5.64 |
| Mid | 98.22 ± 2.52 | ||
| Down | 91.75 ± 7.86 |
Disclaimer/Publisher’s Note: The statements, opinions and data contained in all publications are solely those of the individual author(s) and contributor(s) and not of MDPI and/or the editor(s). MDPI and/or the editor(s) disclaim responsibility for any injury to people or property resulting from any ideas, methods, instructions or products referred to in the content. |
© 2024 by the authors. Licensee MDPI, Basel, Switzerland. This article is an open access article distributed under the terms and conditions of the Creative Commons Attribution (CC BY) license (https://creativecommons.org/licenses/by/4.0/).
Share and Cite
Sapidis, G.M.; Kansizoglou, I.; Naoum, M.C.; Papadopoulos, N.A.; Chalioris, C.E. A Deep Learning Approach for Autonomous Compression Damage Identification in Fiber-Reinforced Concrete Using Piezoelectric Lead Zirconate Titanate Transducers. Sensors 2024, 24, 386. https://doi.org/10.3390/s24020386
Sapidis GM, Kansizoglou I, Naoum MC, Papadopoulos NA, Chalioris CE. A Deep Learning Approach for Autonomous Compression Damage Identification in Fiber-Reinforced Concrete Using Piezoelectric Lead Zirconate Titanate Transducers. Sensors. 2024; 24(2):386. https://doi.org/10.3390/s24020386
Chicago/Turabian StyleSapidis, George M., Ioannis Kansizoglou, Maria C. Naoum, Nikos A. Papadopoulos, and Constantin E. Chalioris. 2024. "A Deep Learning Approach for Autonomous Compression Damage Identification in Fiber-Reinforced Concrete Using Piezoelectric Lead Zirconate Titanate Transducers" Sensors 24, no. 2: 386. https://doi.org/10.3390/s24020386
APA StyleSapidis, G. M., Kansizoglou, I., Naoum, M. C., Papadopoulos, N. A., & Chalioris, C. E. (2024). A Deep Learning Approach for Autonomous Compression Damage Identification in Fiber-Reinforced Concrete Using Piezoelectric Lead Zirconate Titanate Transducers. Sensors, 24(2), 386. https://doi.org/10.3390/s24020386