
Efficacy of PZT Sensors Network Different Configurations in Damage Detection of Fiber-Reinforced Concrete Prisms under Repeated Loading


Abstract
1. Introduction
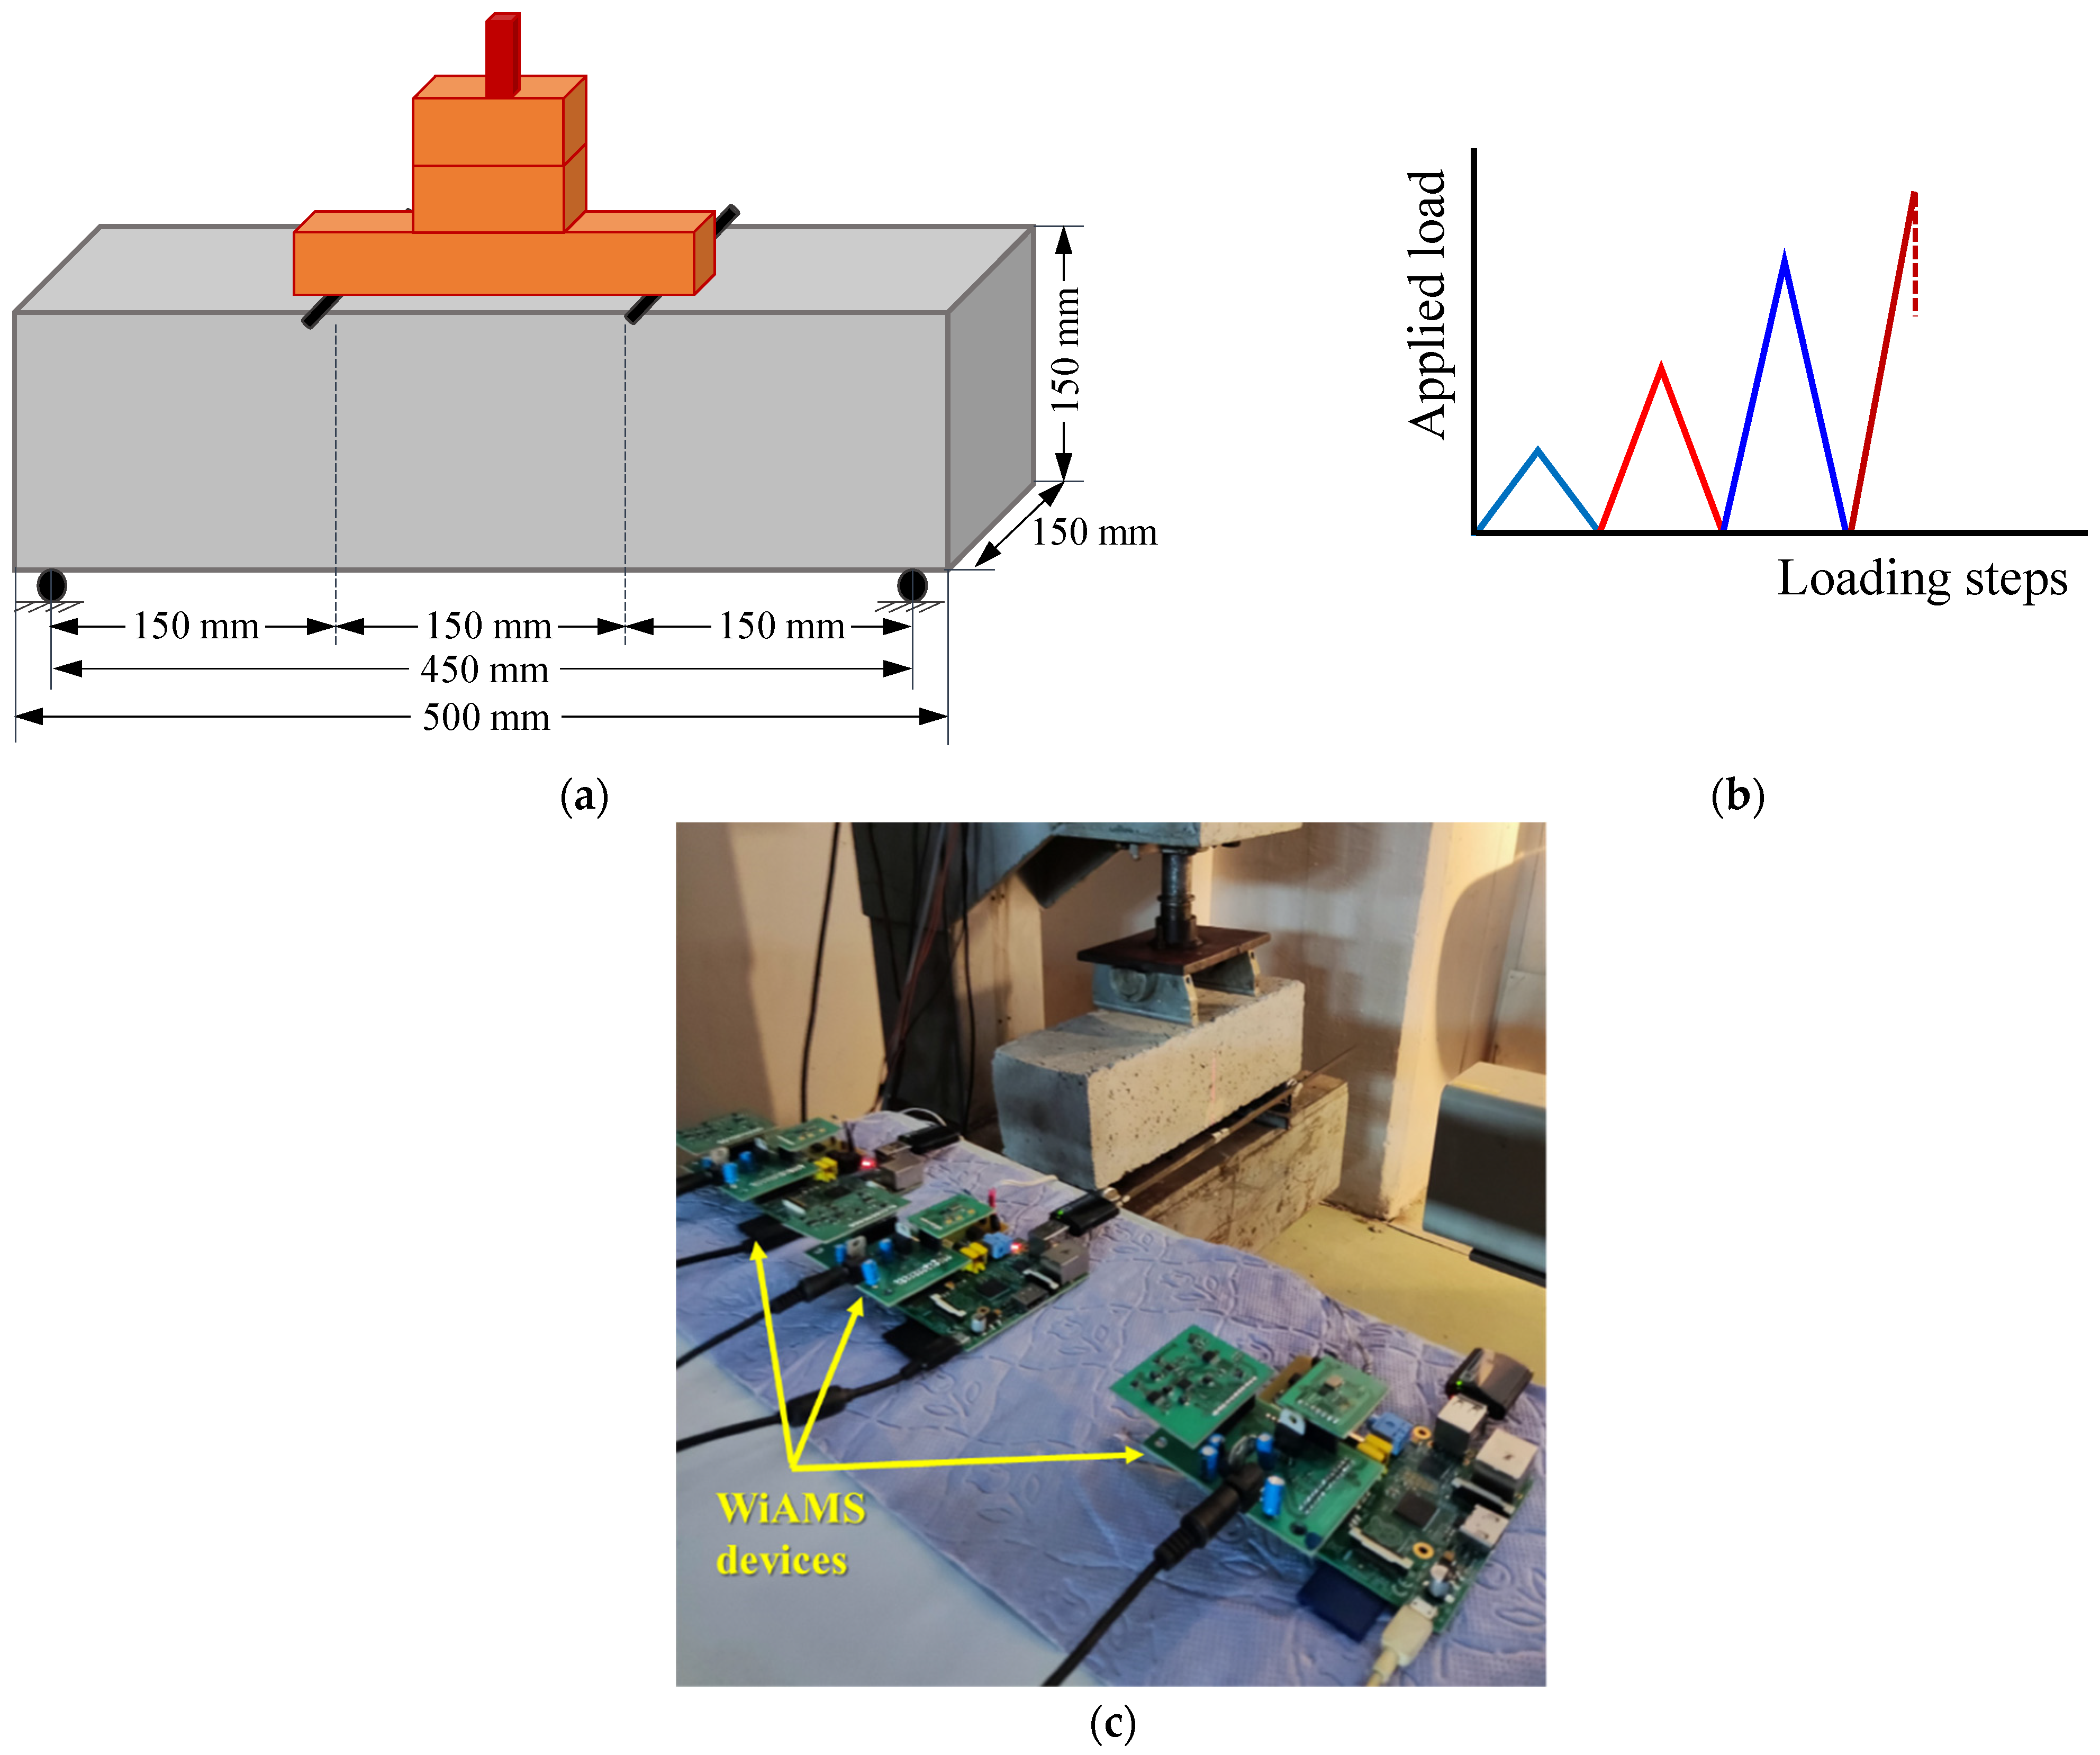
2. Experimental Program
2.1. Materials and Preparation
2.2. Tests and Specimens
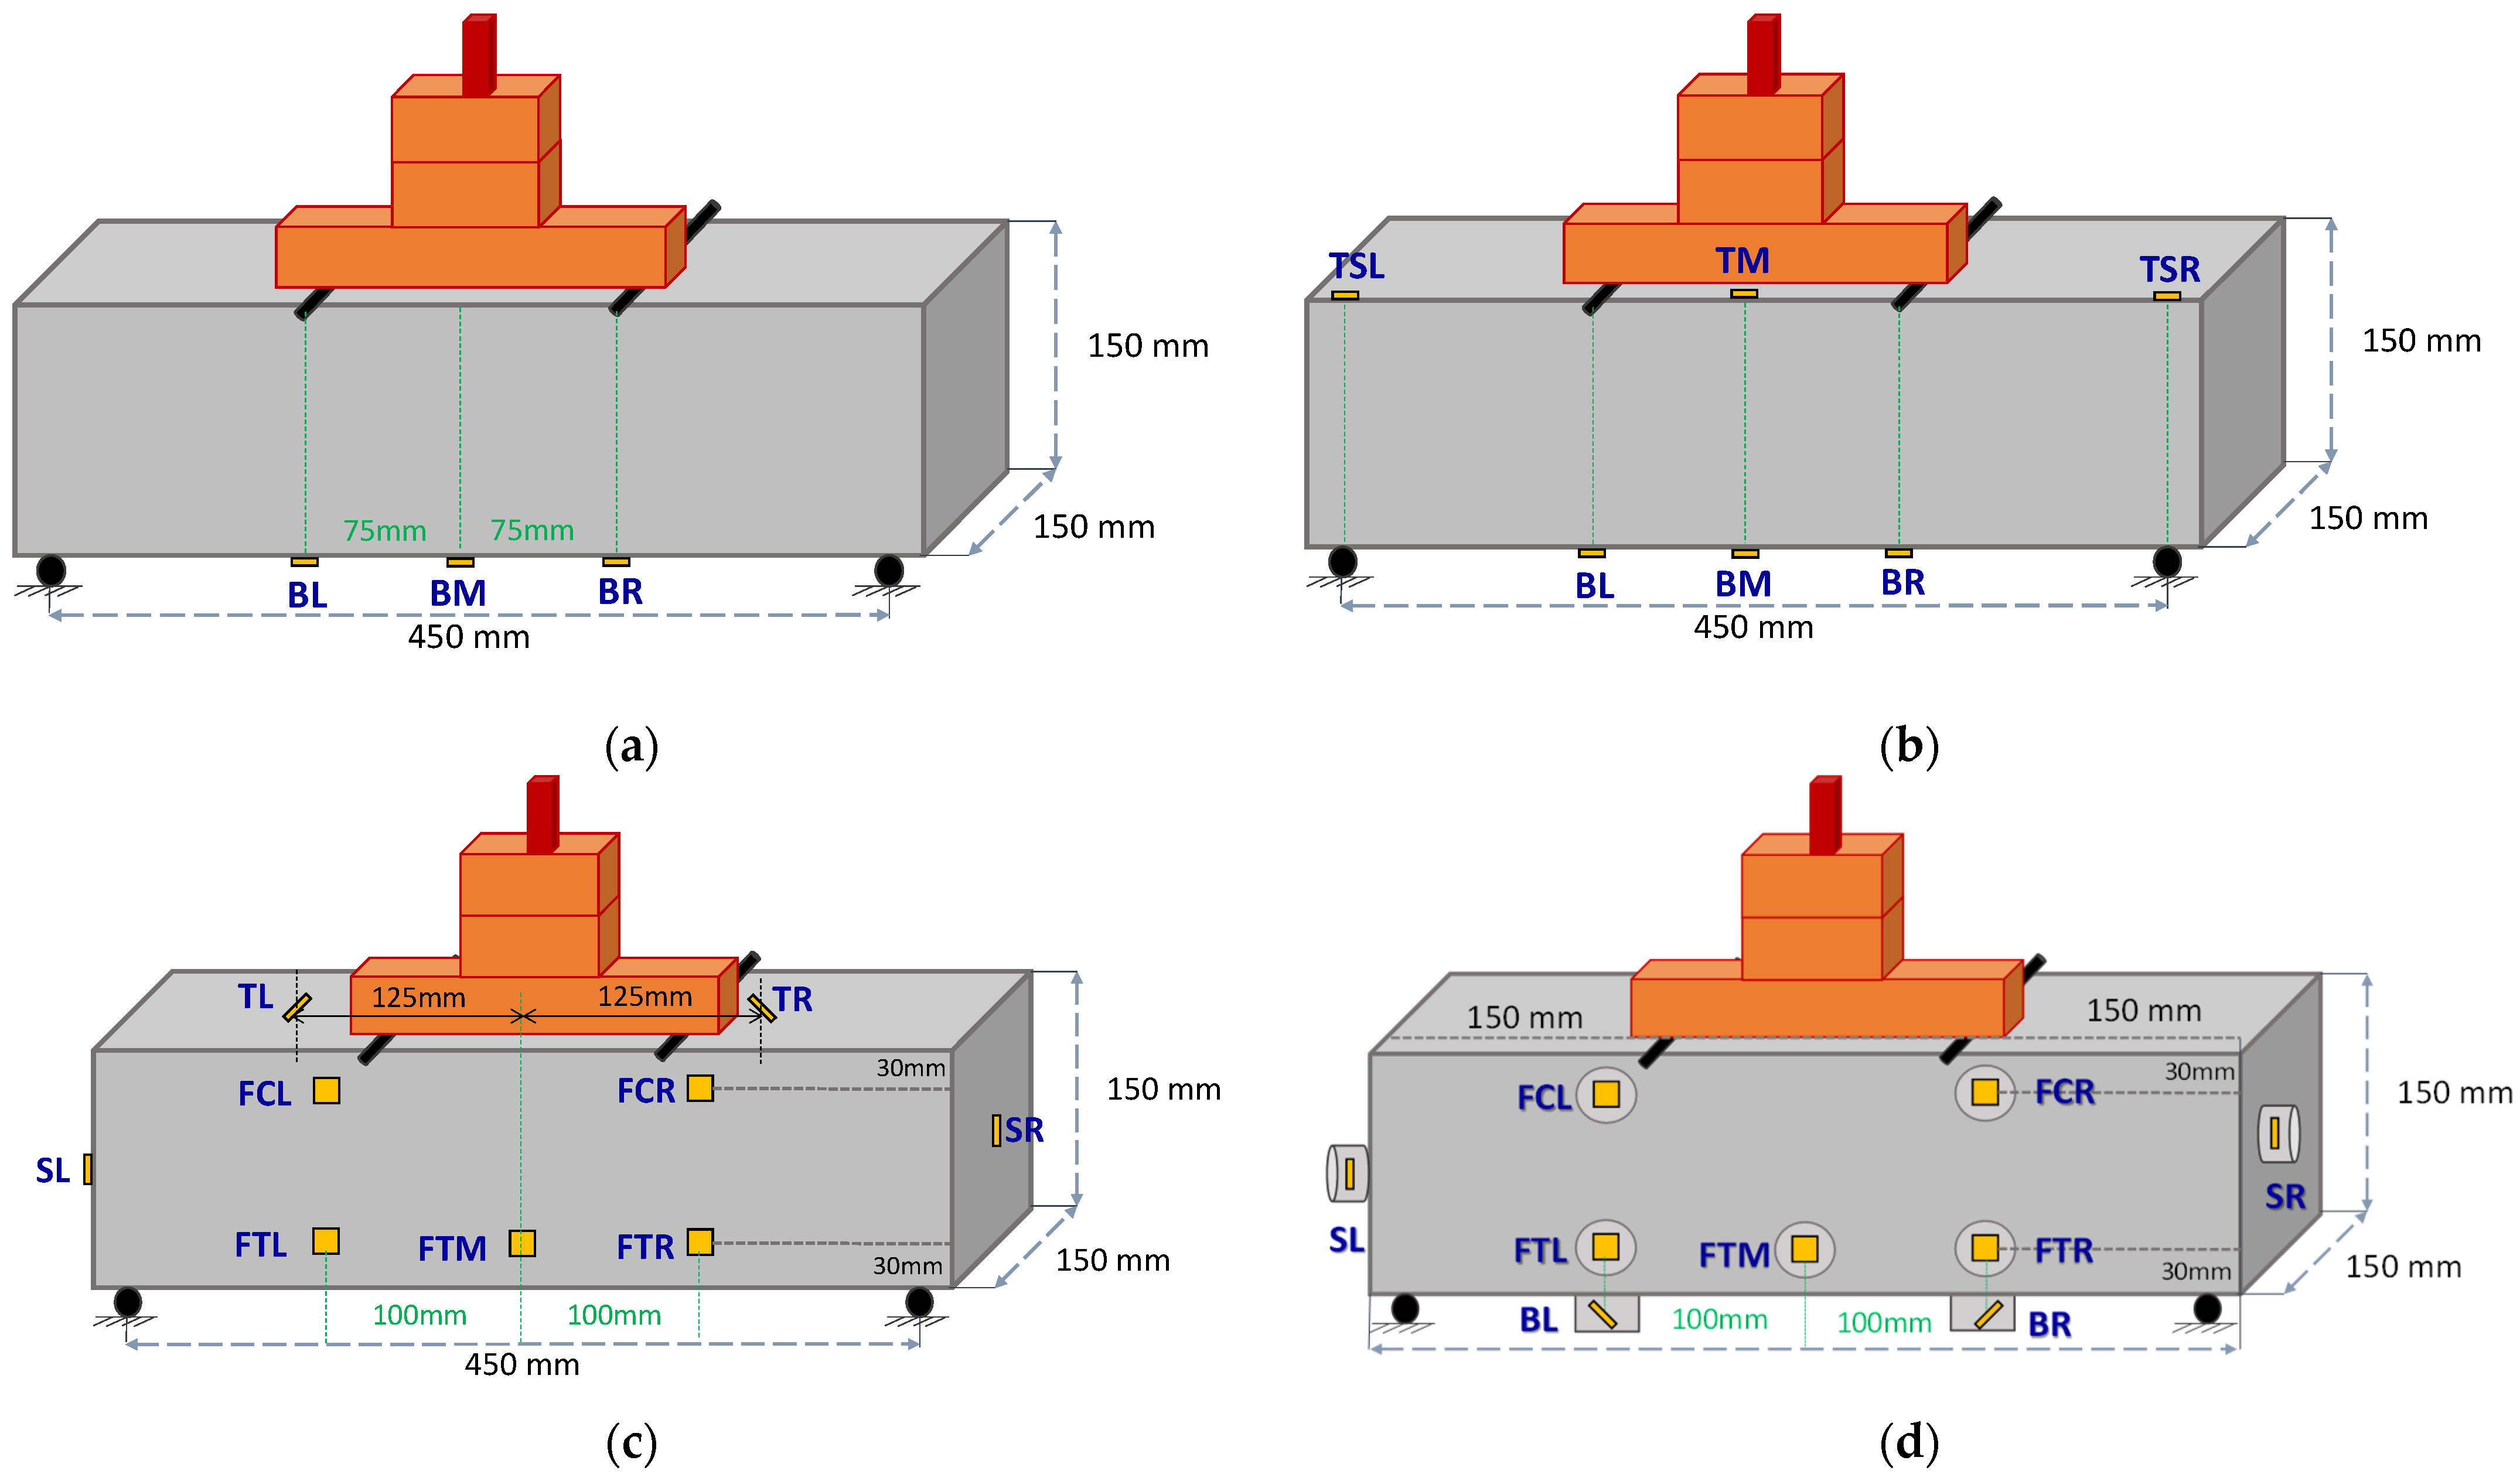
2.3. SHM Method and PZT Sensor’s Network
- Surface Epoxy-Bonded PZT Patches
- Epoxy-Inclined PZT Patches in Grooved Notches
- Cement Paste-Coated PZTs
- The angle of PZT Polarization Relative to Crack Direction
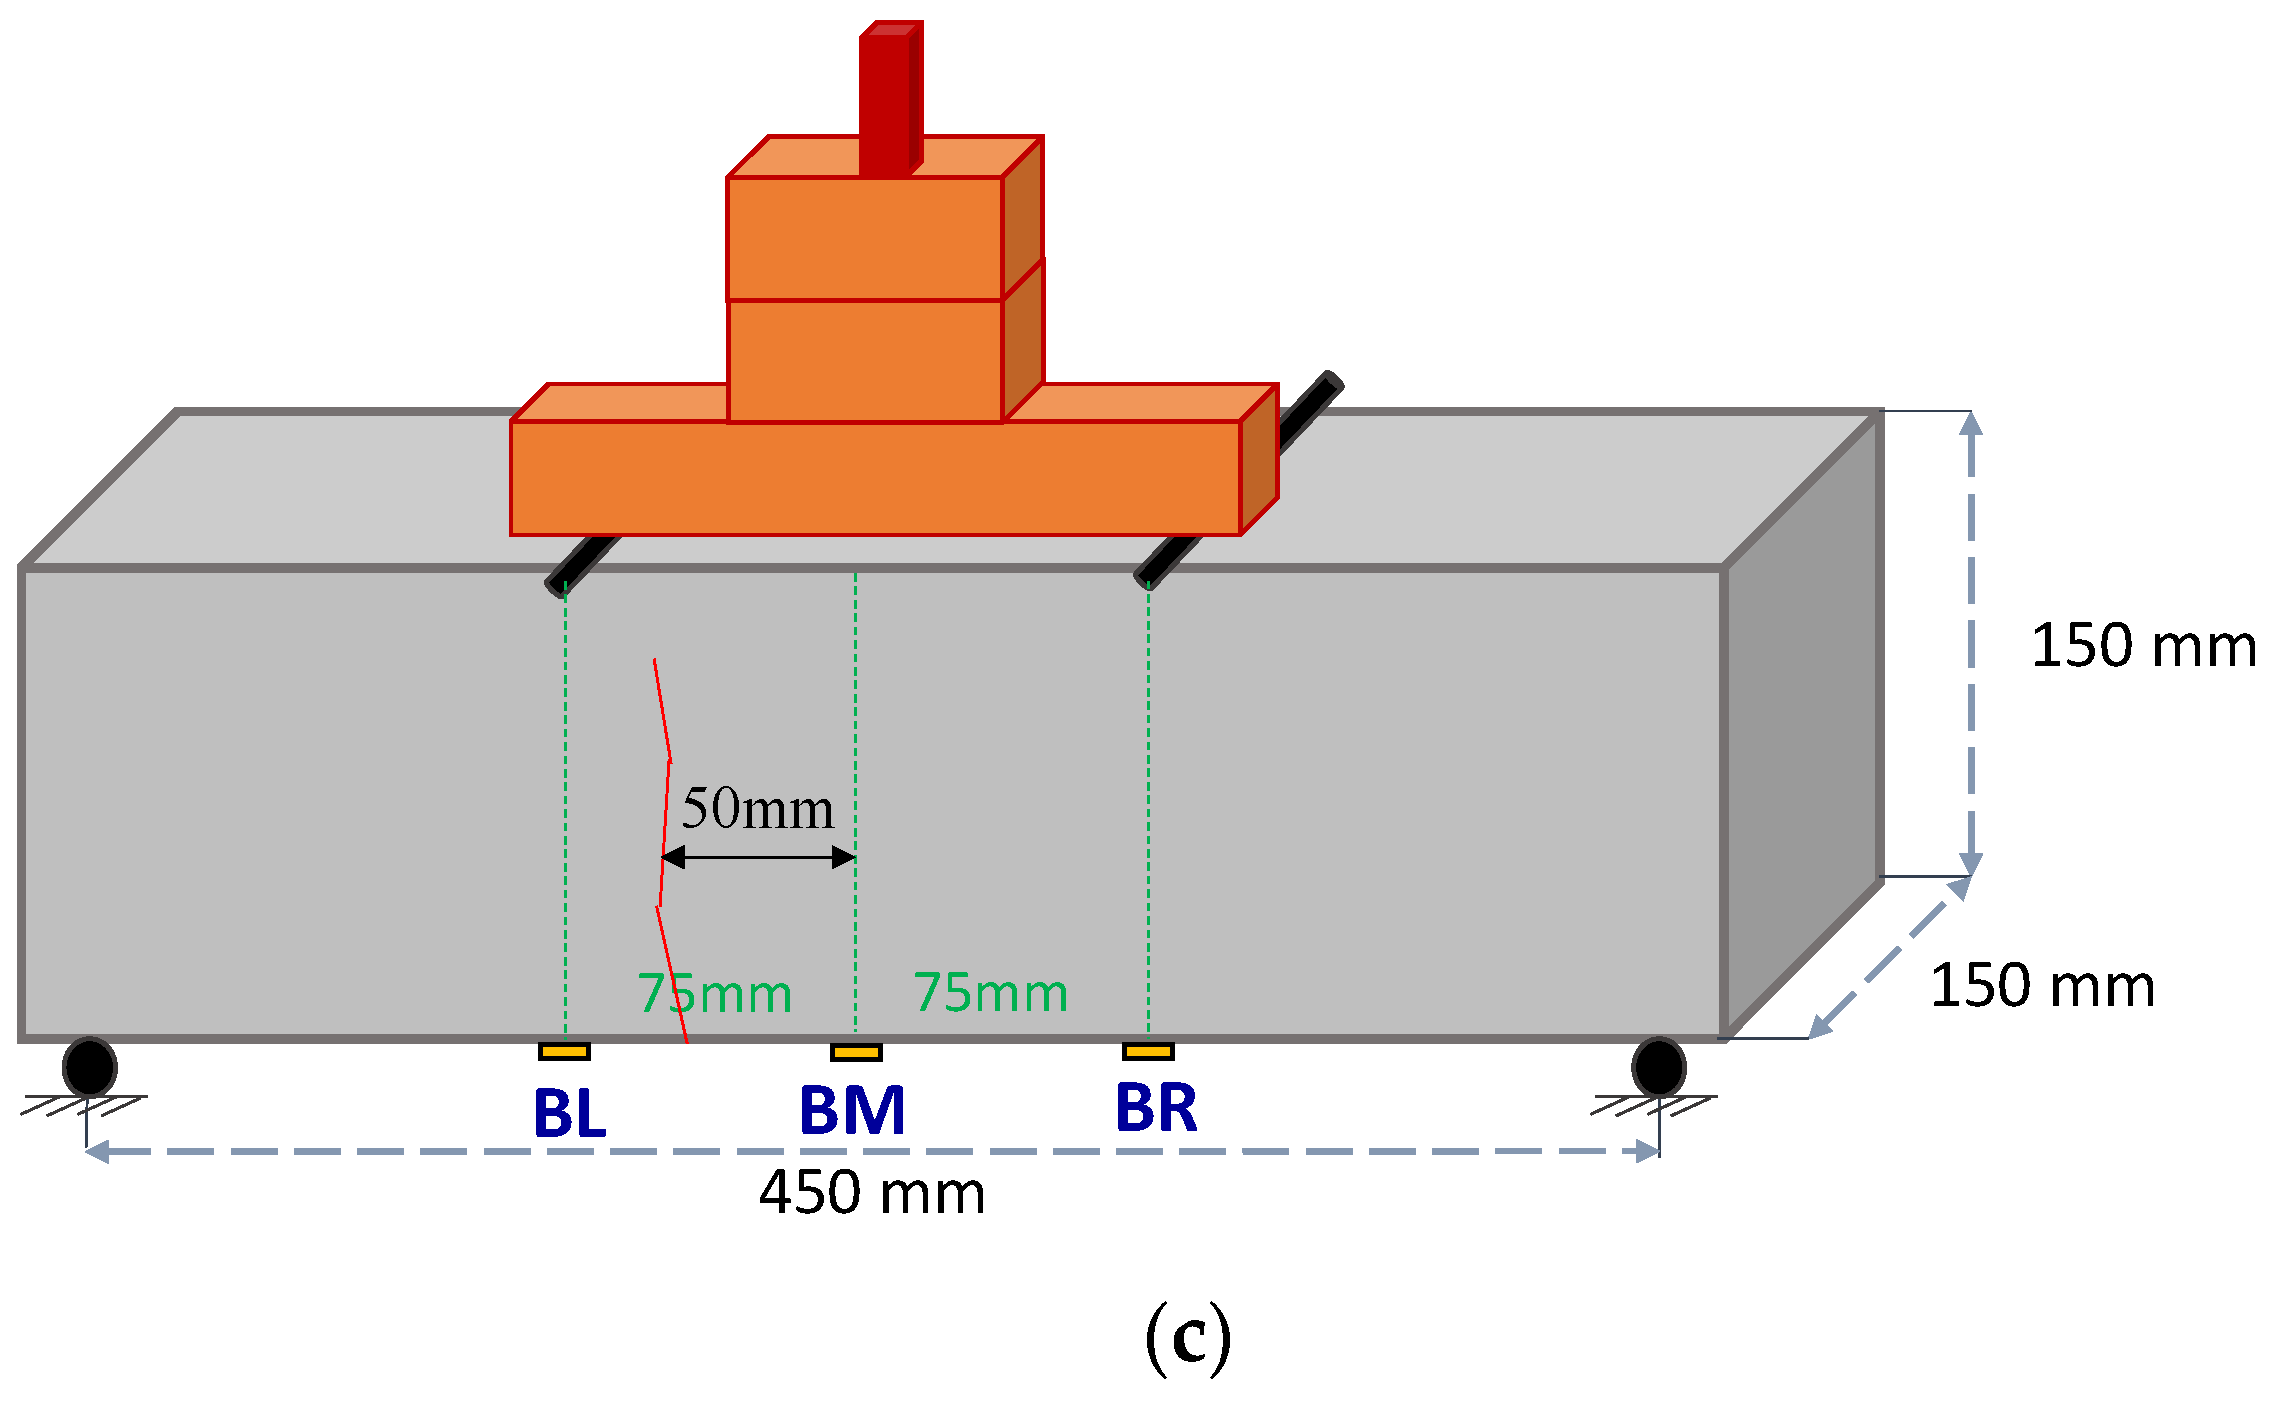
- Three PZT patches were epoxy-bonded to the bottom surface of the prism; one on the middle of the surface (BM: Bottom Mid), one on the right side (BR: Bottom Right), and one on the left side (BL: Bottom Left), both at a distance of 75 mm from the middle of the specimen, directly opposite to the two loading points.
- Three PZT patches were epoxy-bonded to the bottom surface of the prism; one on the middle of the surface (BM: Bottom Mid), one on the right side (BR: Bottom Right), and one on the left side (BL: Bottom Left), both at a distance of 75 mm from the middle of the specimen, directly opposite to the loading points.
- One PZT patch was epoxy-bonded in the middle of the top surface of the prism (TM: Top Mid).
- Two PZT patches were epoxy-bonded to the left and right on the top surface, directly opposite each support (TSL: Top Support Left) and (TSR: Top Support Right).
- One PZT patch was epoxy-bonded in the middle of the facade of the specimen and the tension zone (FTM: Facade Tension Middle).
- Two PZT patches were epoxy-bonded on the right side of the façade of the prism at a 100 mm distance from the middle of the specimen; one in the tension zone (FTR: Facade Tension Right) and one in the compression zone (FCR: Facade Compression Right).
- Two PZT patches were epoxy-bonded on the left side of the prism facade, positioned 100 mm away from the specimen’s center; one patch was placed in the tension zone (FTL: Facade Tension Left) and the other in the compression zone (FCL: Facade Compression Left).
- Additionally, two PZT patches were epoxy-bonded at the mid-height and mid-width of each end-free side of the prism; one on the right side (SR: Side Right) and one on the left side (SL: Side Left). Two PZT patches were inclined epoxy-bonded at a distance of 125 mm left and right from the mid-point of the top surface (TIL: Top Inclined Left) and (TIR: Top Inclined Right), respectively.
- A single cement paste-coated PZT patch was bonded to the center of the specimen’s facade in the tension zone (FTM: Facade Tension Middle).
- Two cement paste-coated PZT patches were attached to the right side of the prism’s facade, 100 mm from the specimen’s center; one was placed in the tension zone (FTR: Facade Tension Right) and the other in the compression zone (FCR: Facade Compression Right).
- Two cement paste-coated PZT patches were similarly bonded to the left side of the prism’s facade, also 100 mm from the specimen’s center; one in the tension zone (FTL: Facade Tension Left) and one in the compression zone (FCL: Facade Compression Left).
- On the bottom of the prism, two cement paste-coated PZT patches were bonded, one on the right side (BR: Bottom Right) and one on the left side (BL: Bottom Left), each positioned 100 mm from the specimen’s center. Both sensors (BL and BR) were cast at a predefined 45° angle.
- Finally, two cement paste-coated PZT patches were attached at the mid-height and mid-width of each side of the prism; one on the right side (SR: Side Right) and one on the left side (SL: Side Left).
2.4. Quantitative Assessment of Damage
3. Results and Discussion
3.1. Analysis of Voltage and Indices
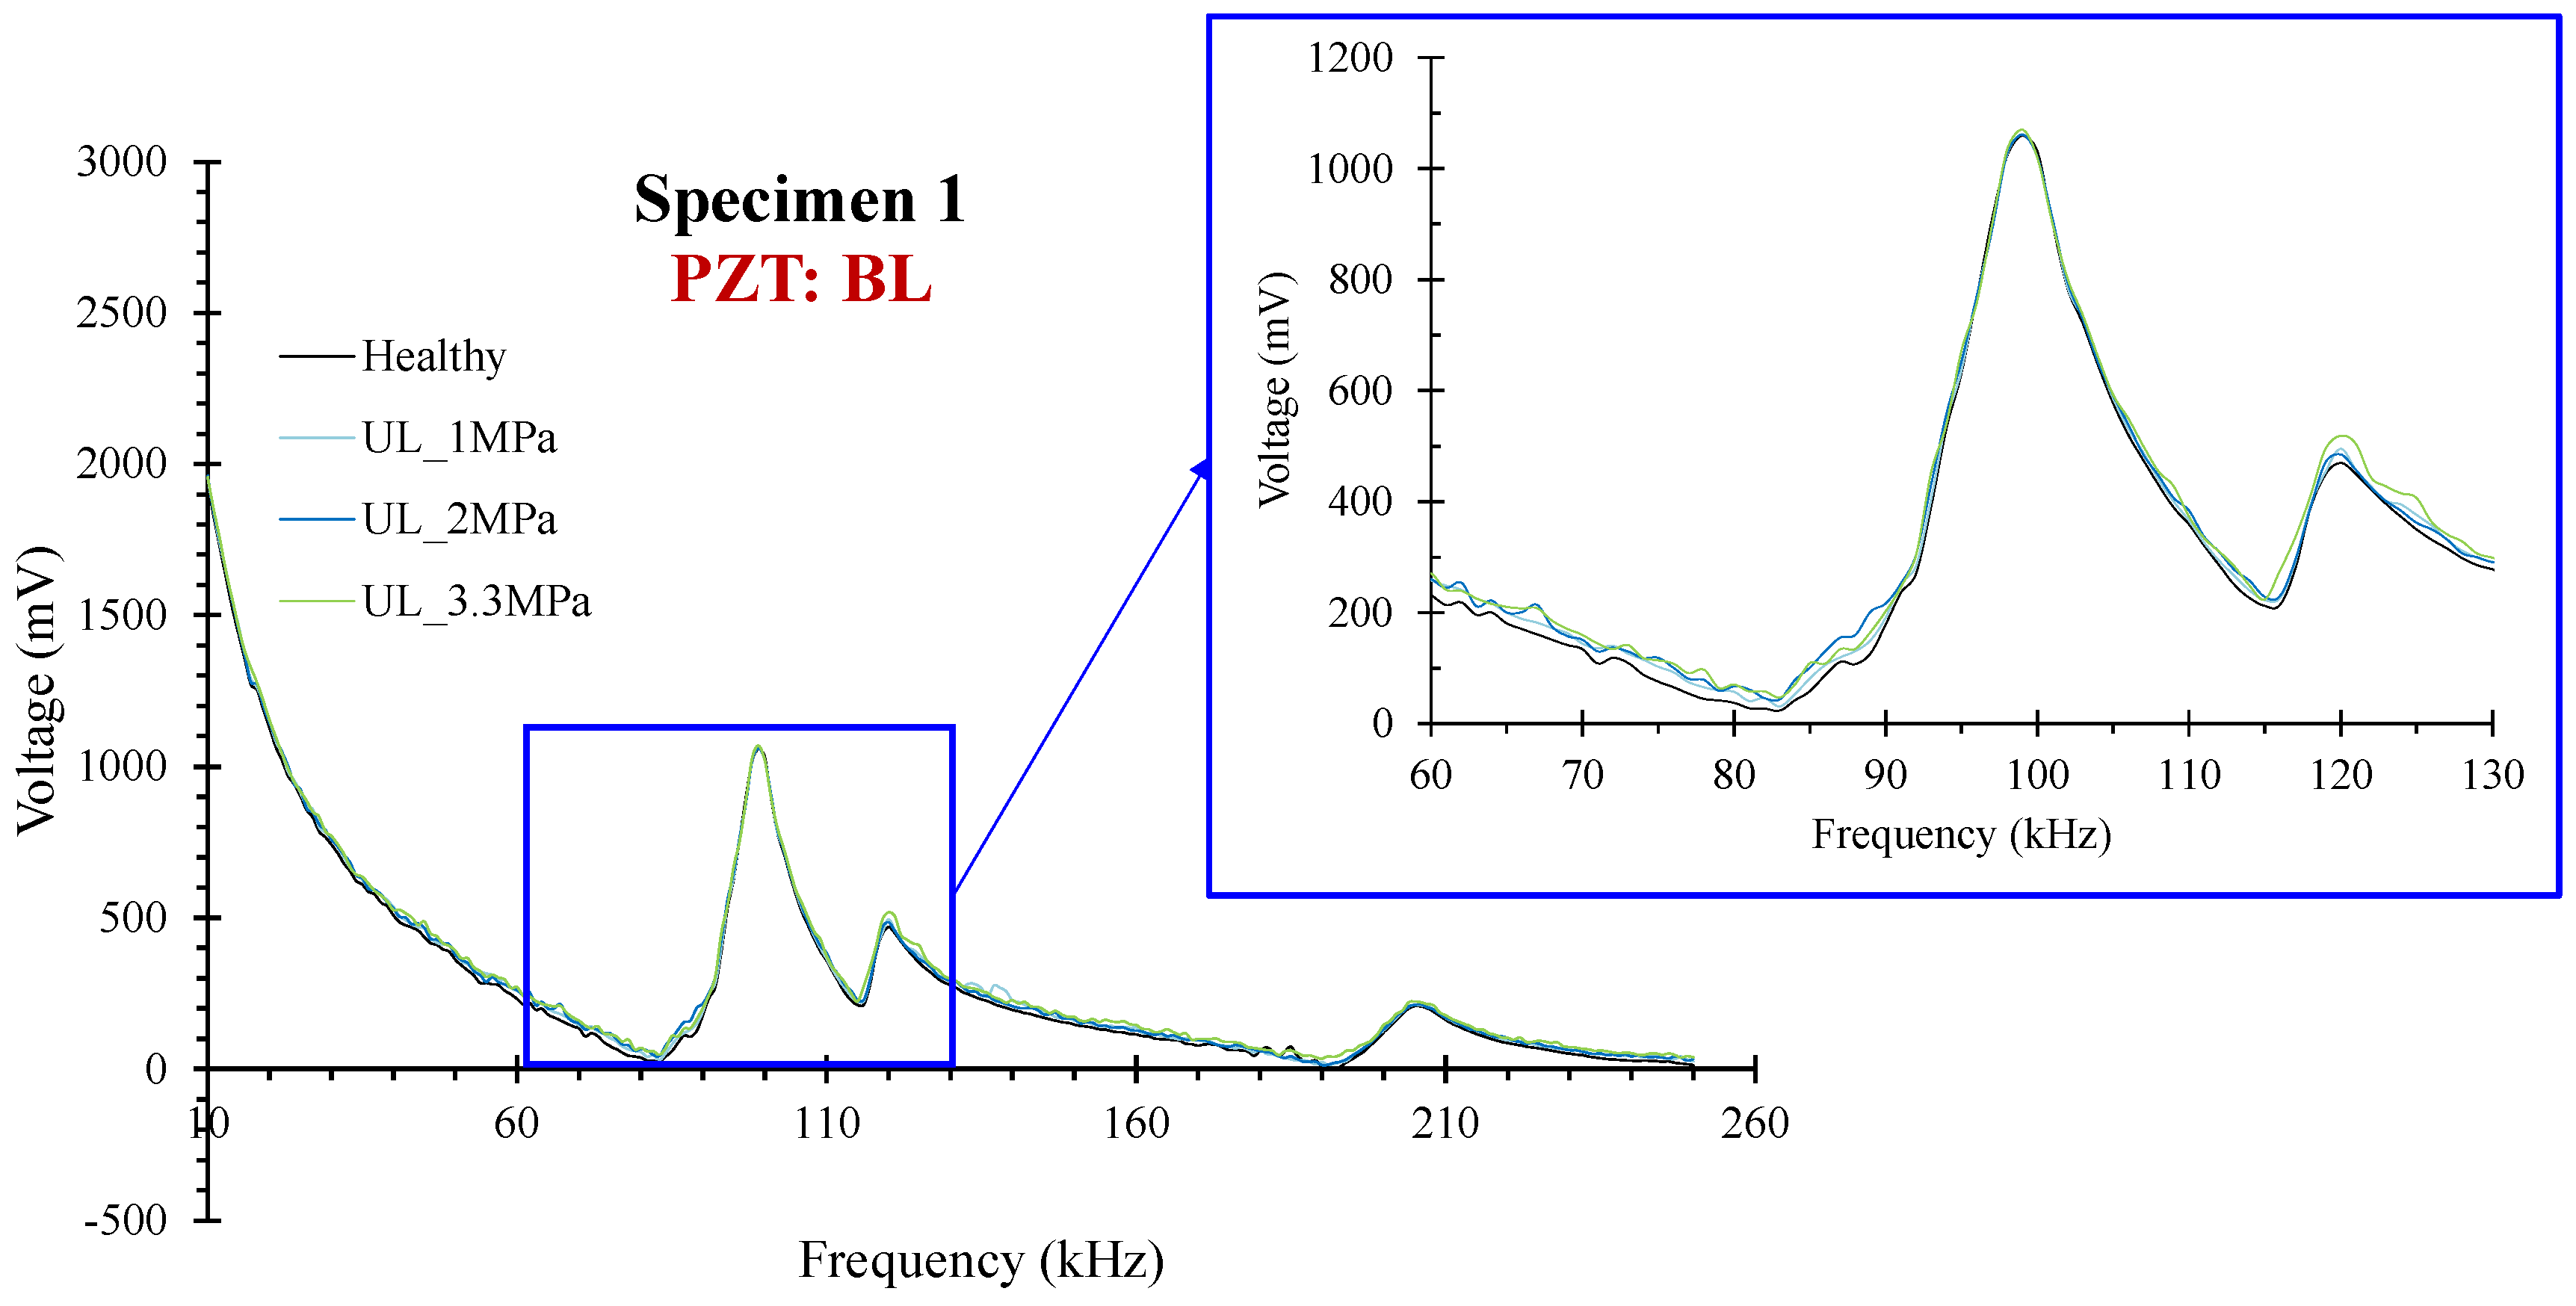
- (a) BL and BR and (b) BM and BL sensors.
- (a) BL and BR, (b) BM and TM, and (c) TSR and TSL sensors.
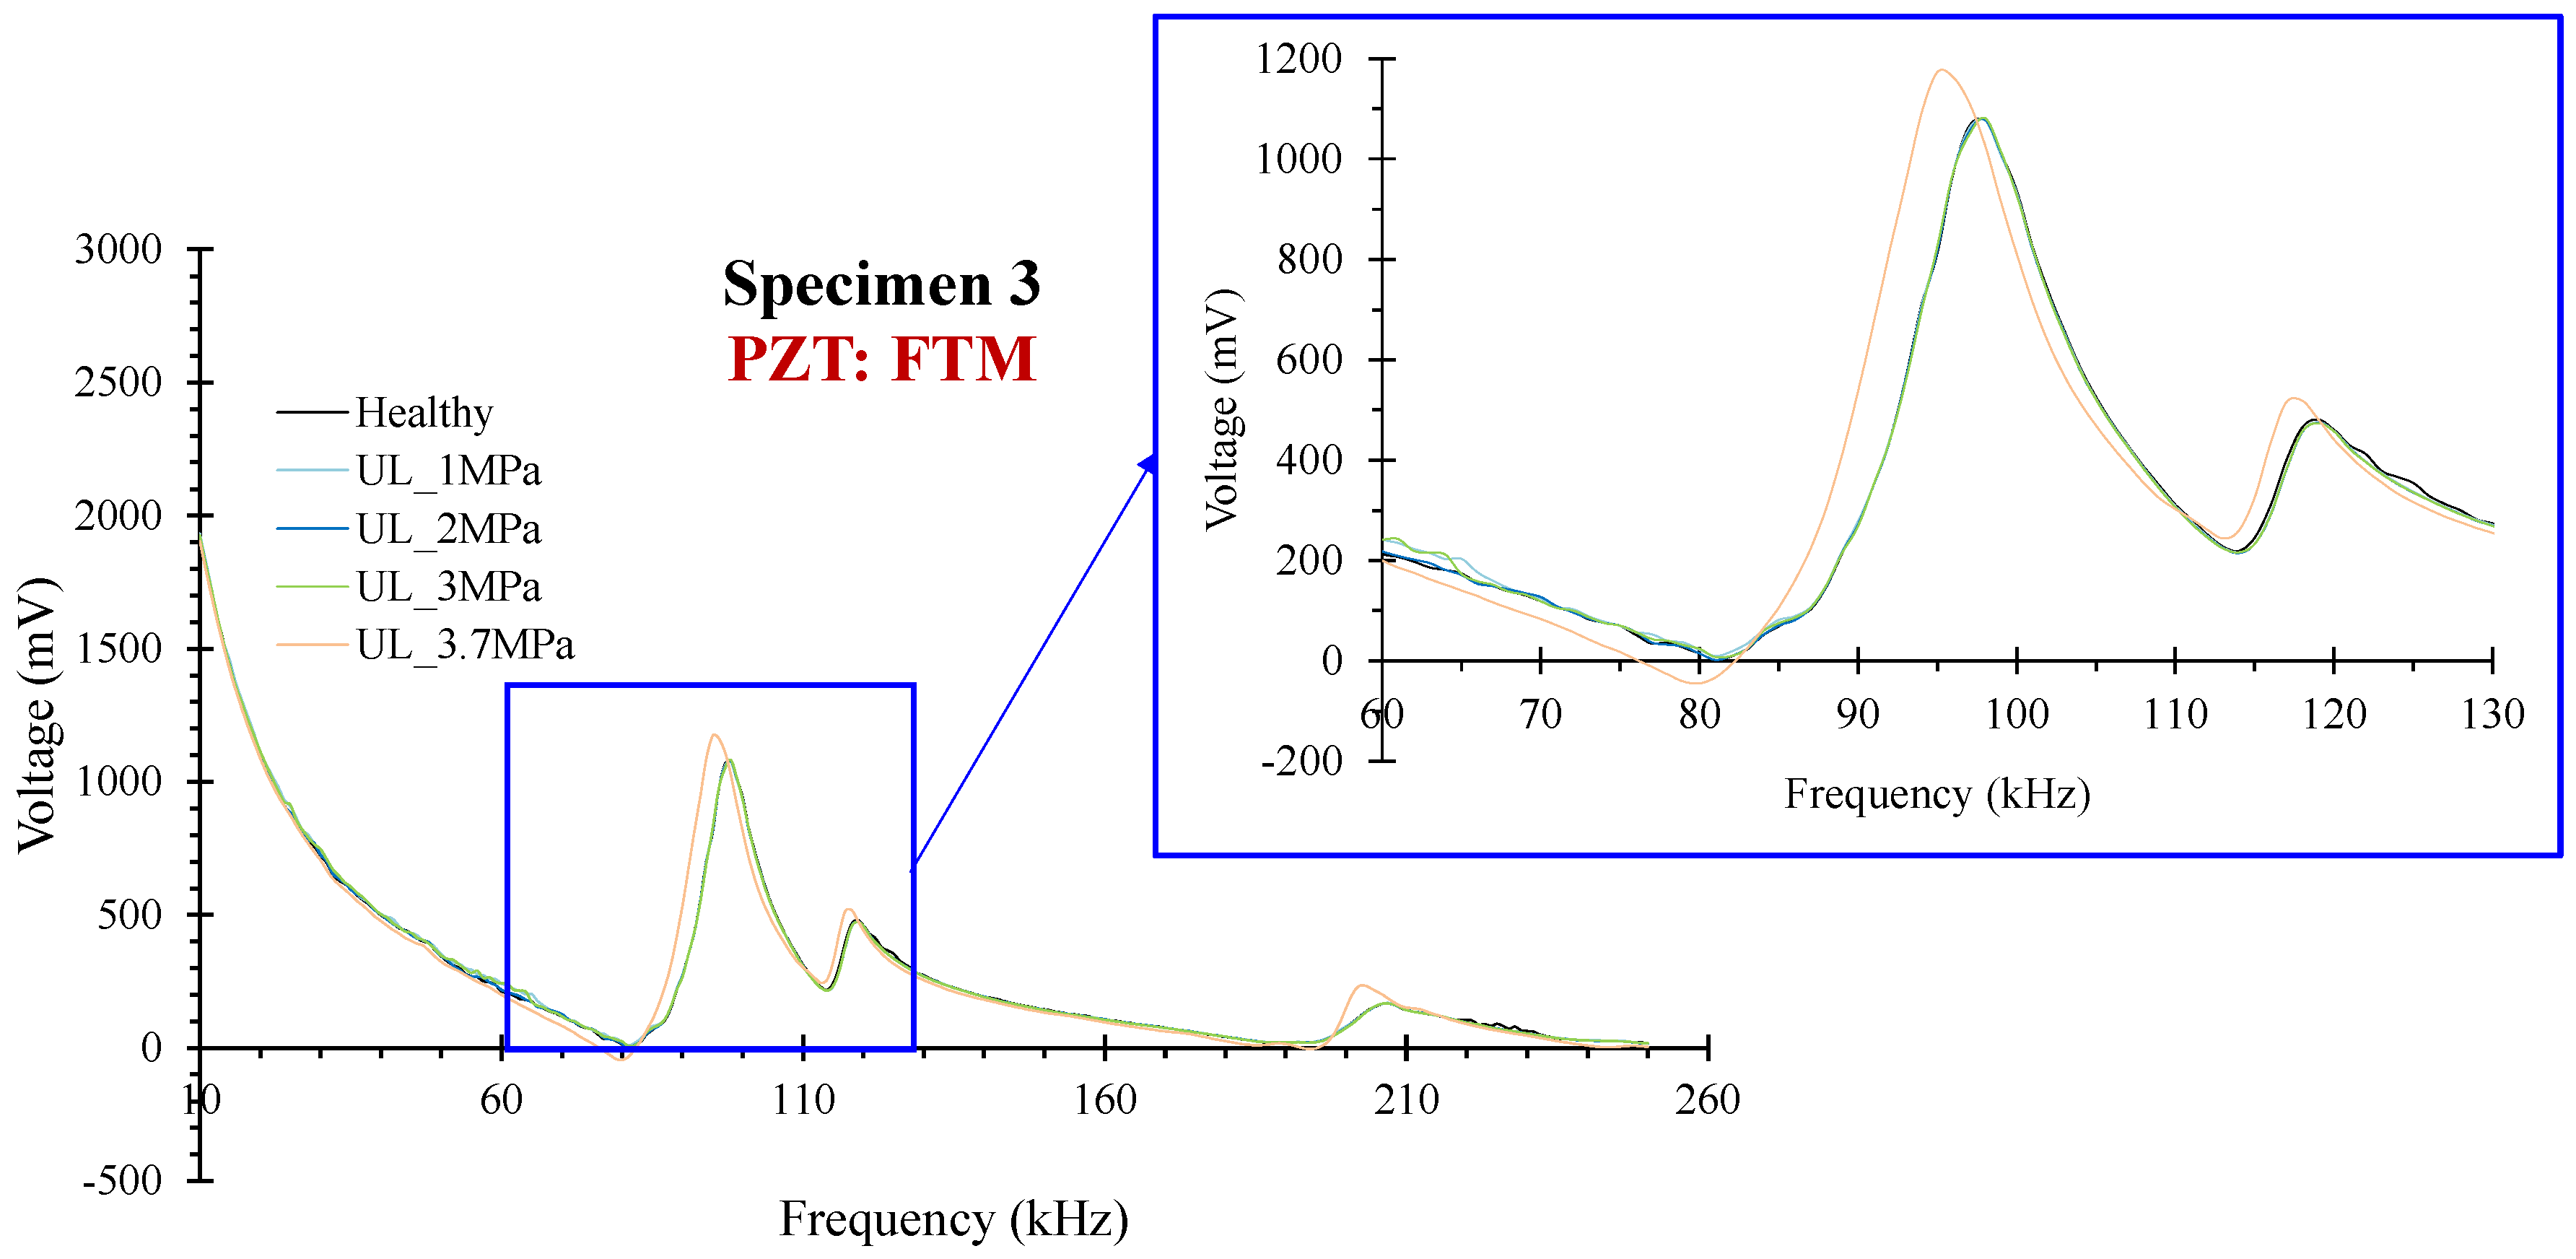
- (a) FTL, FTR, and FTM, (b) FCL and FCR, (c) TIL and TIR, and (d) SL and SR
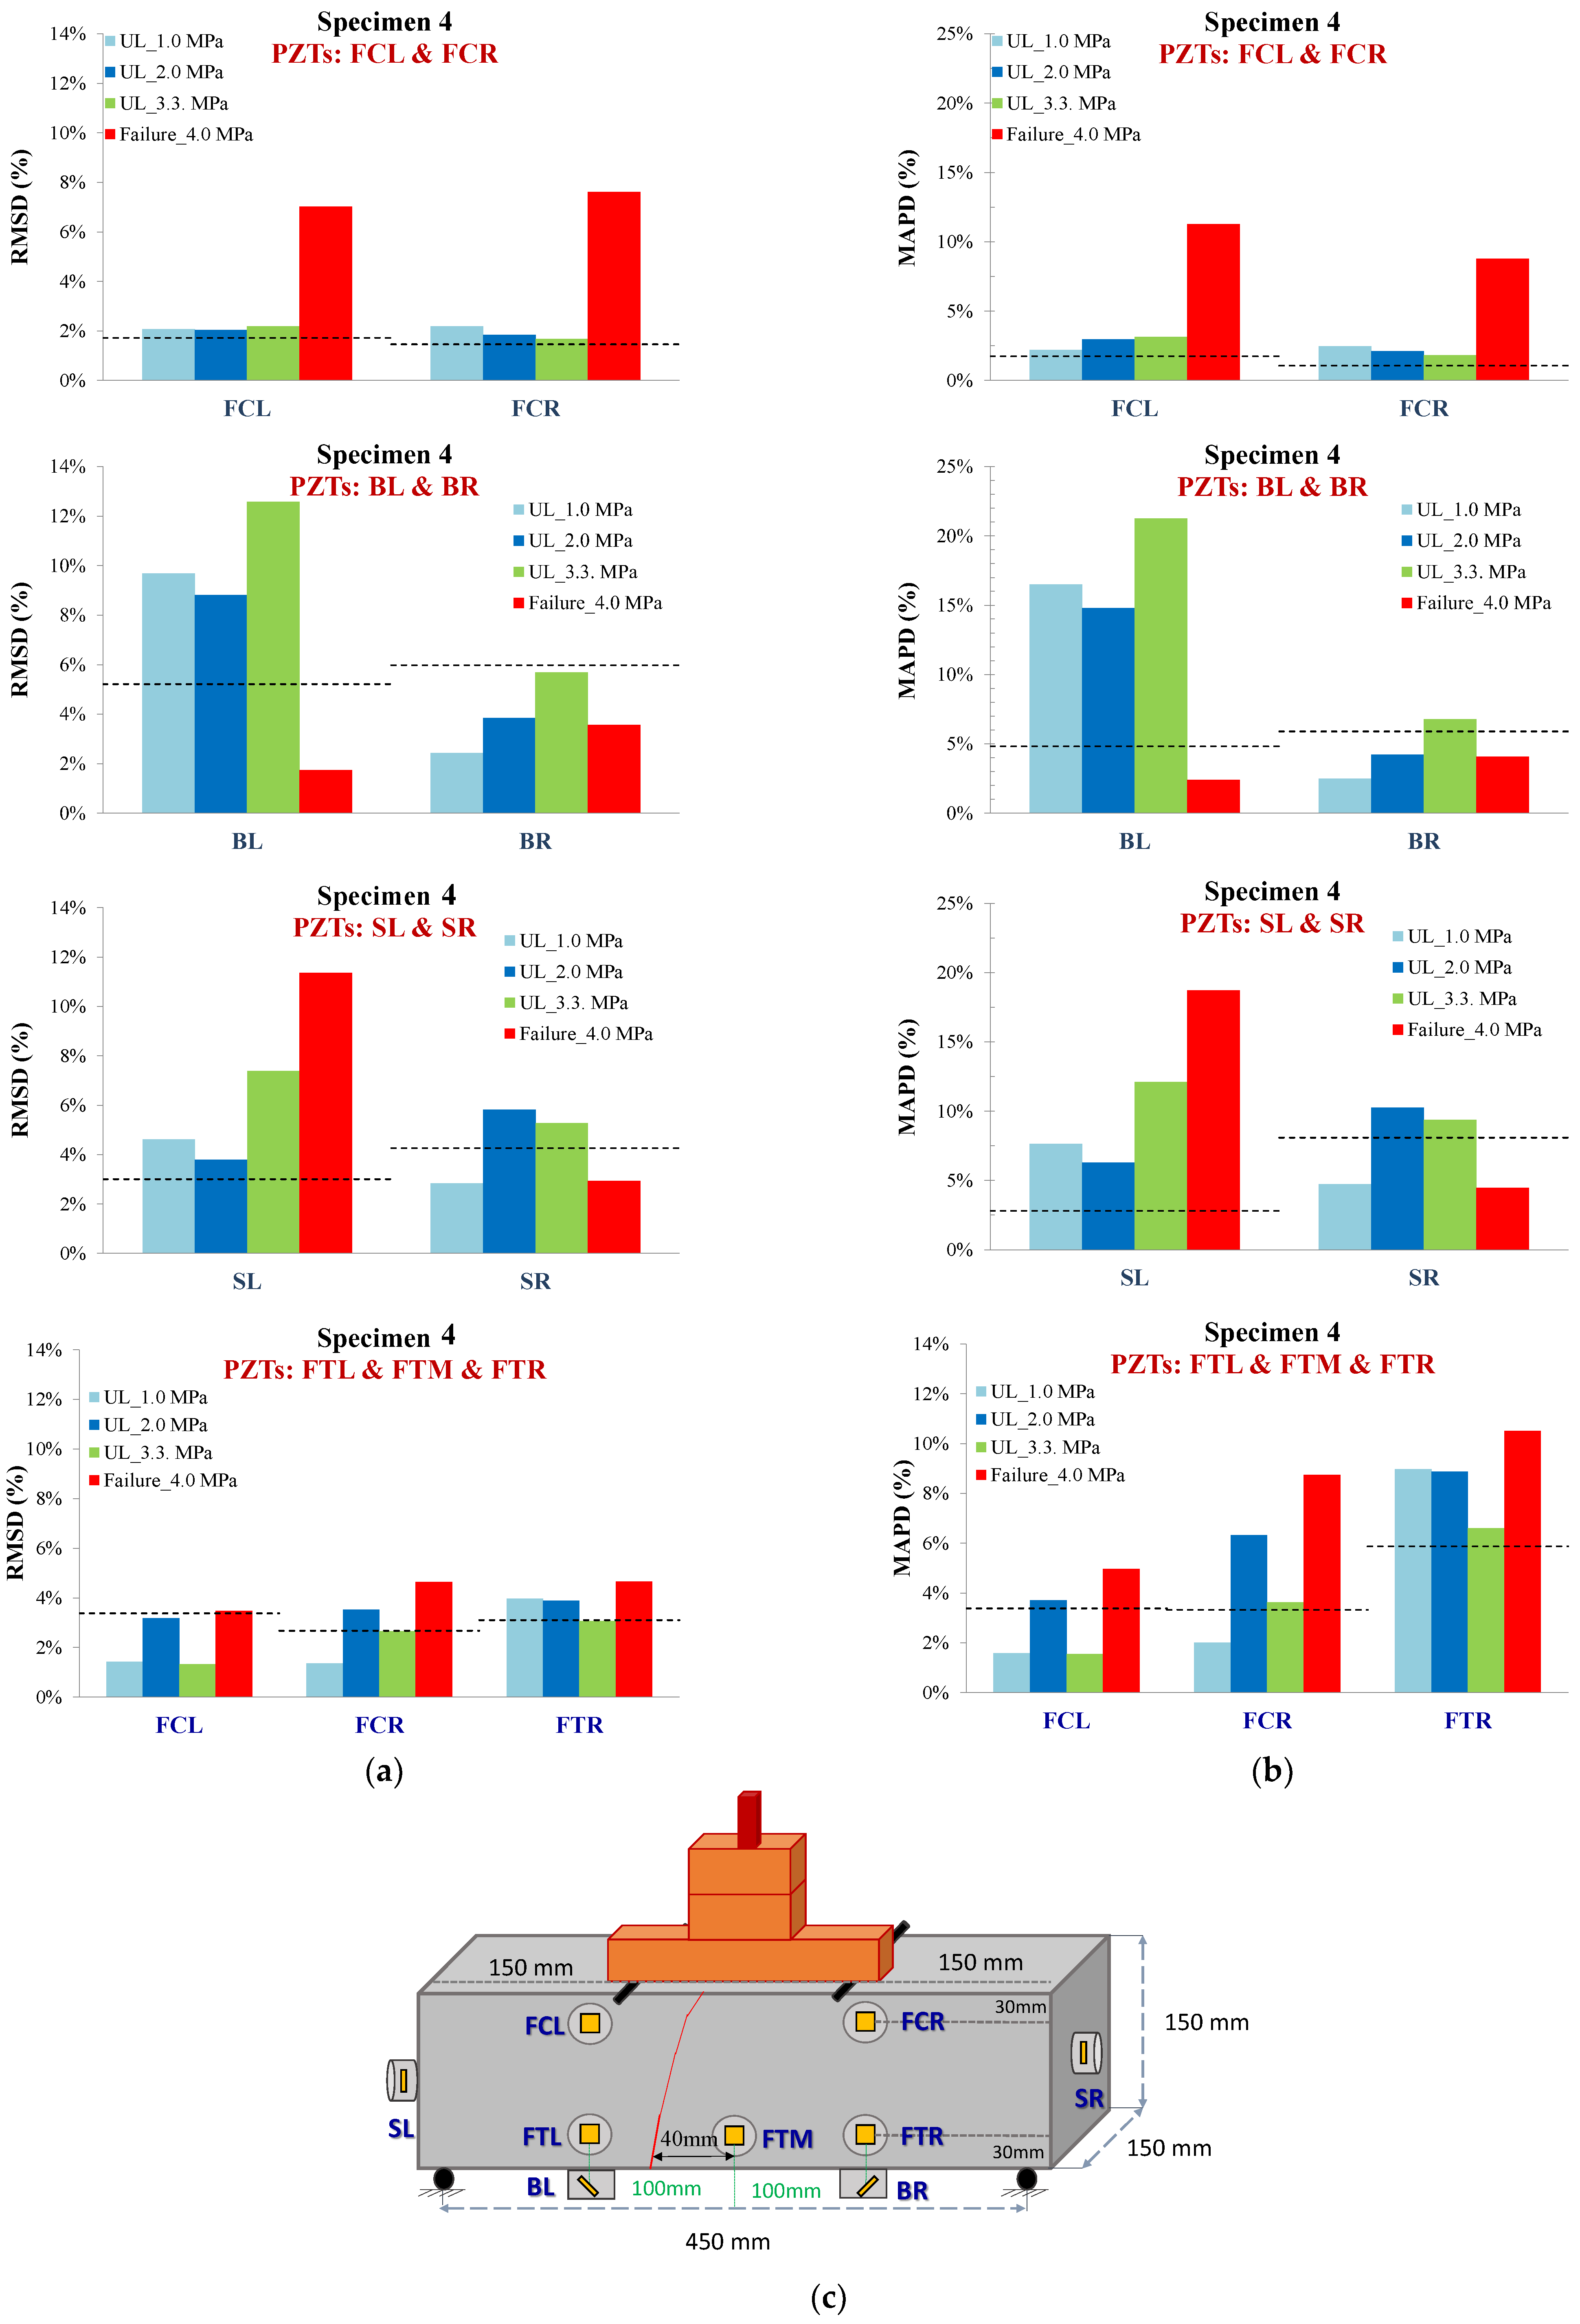
- (a) FTL, FTR, and FTM, (b) FCL and FCR, (c) BL and BR, and (d) SL and SR
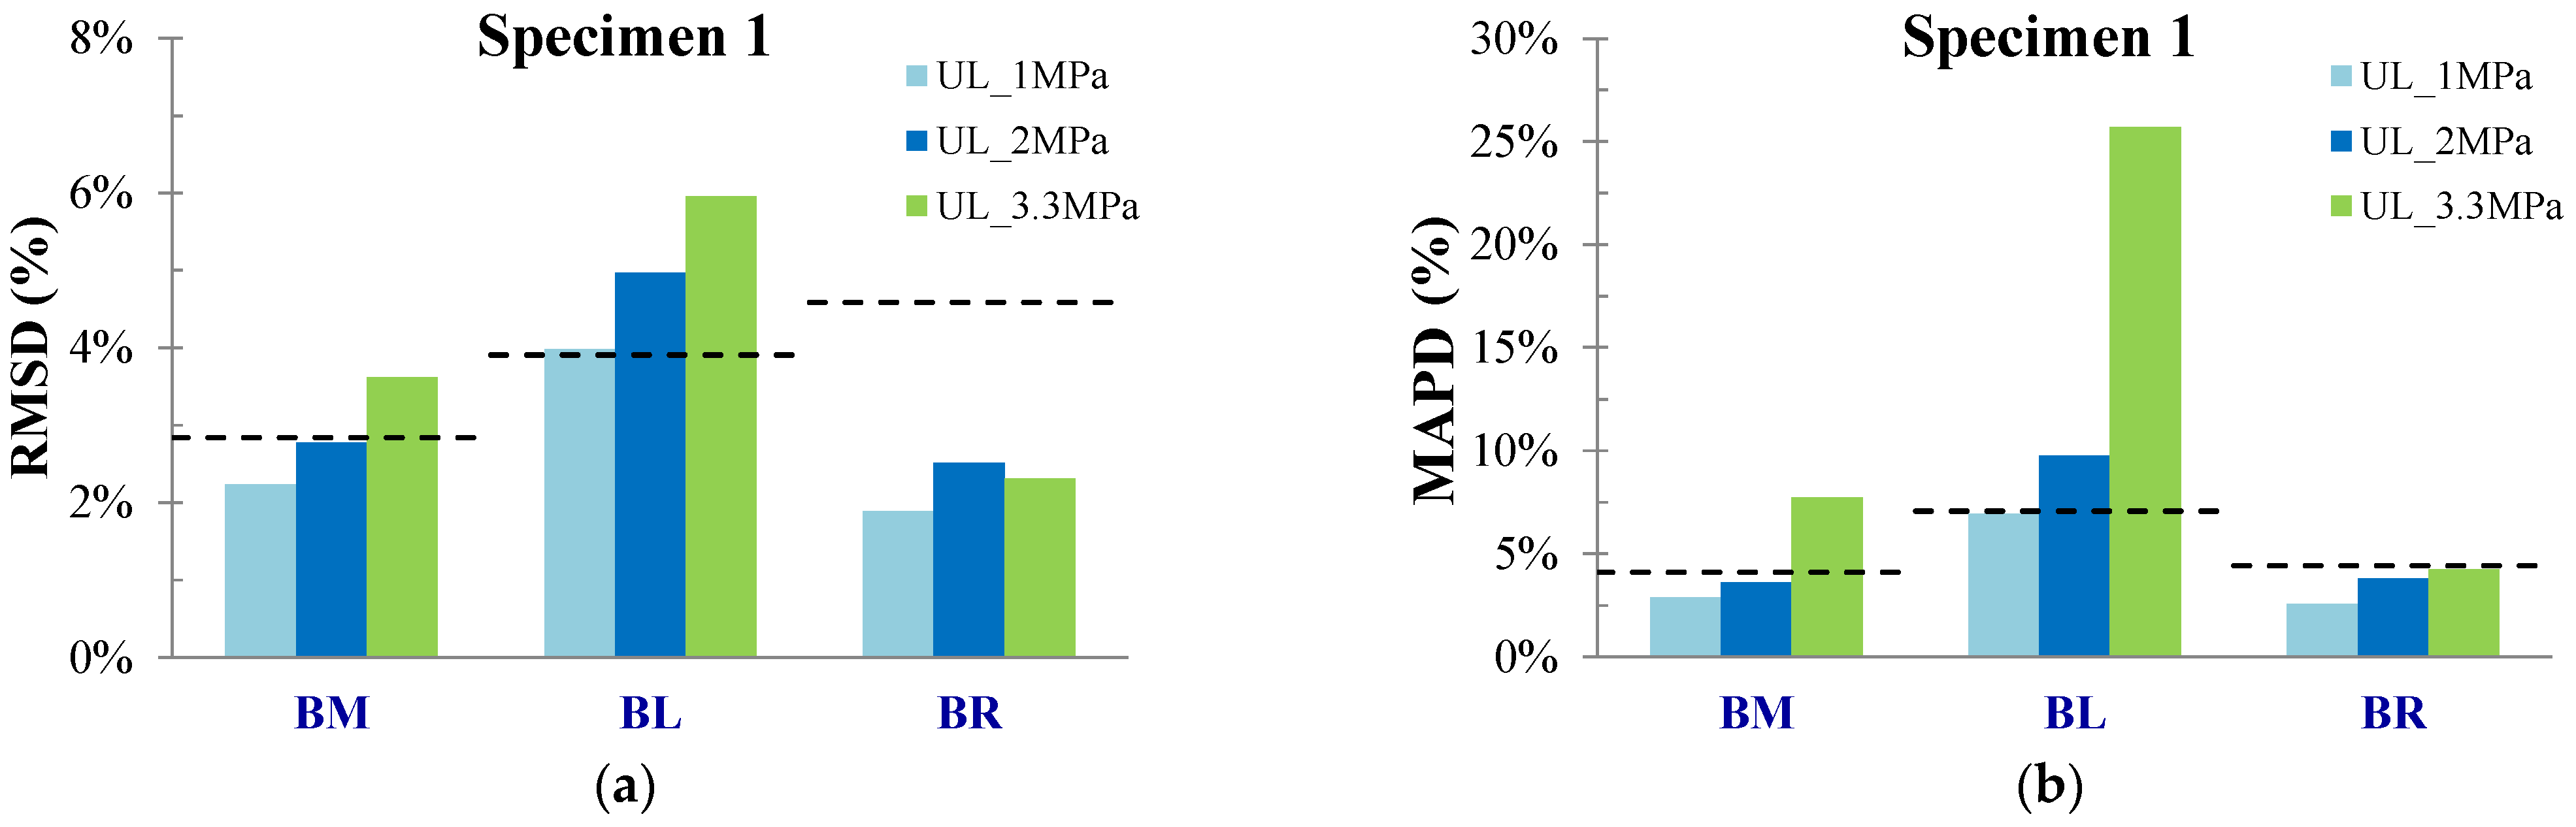
3.1.1. Specimen 1
3.1.2. Specimen 2
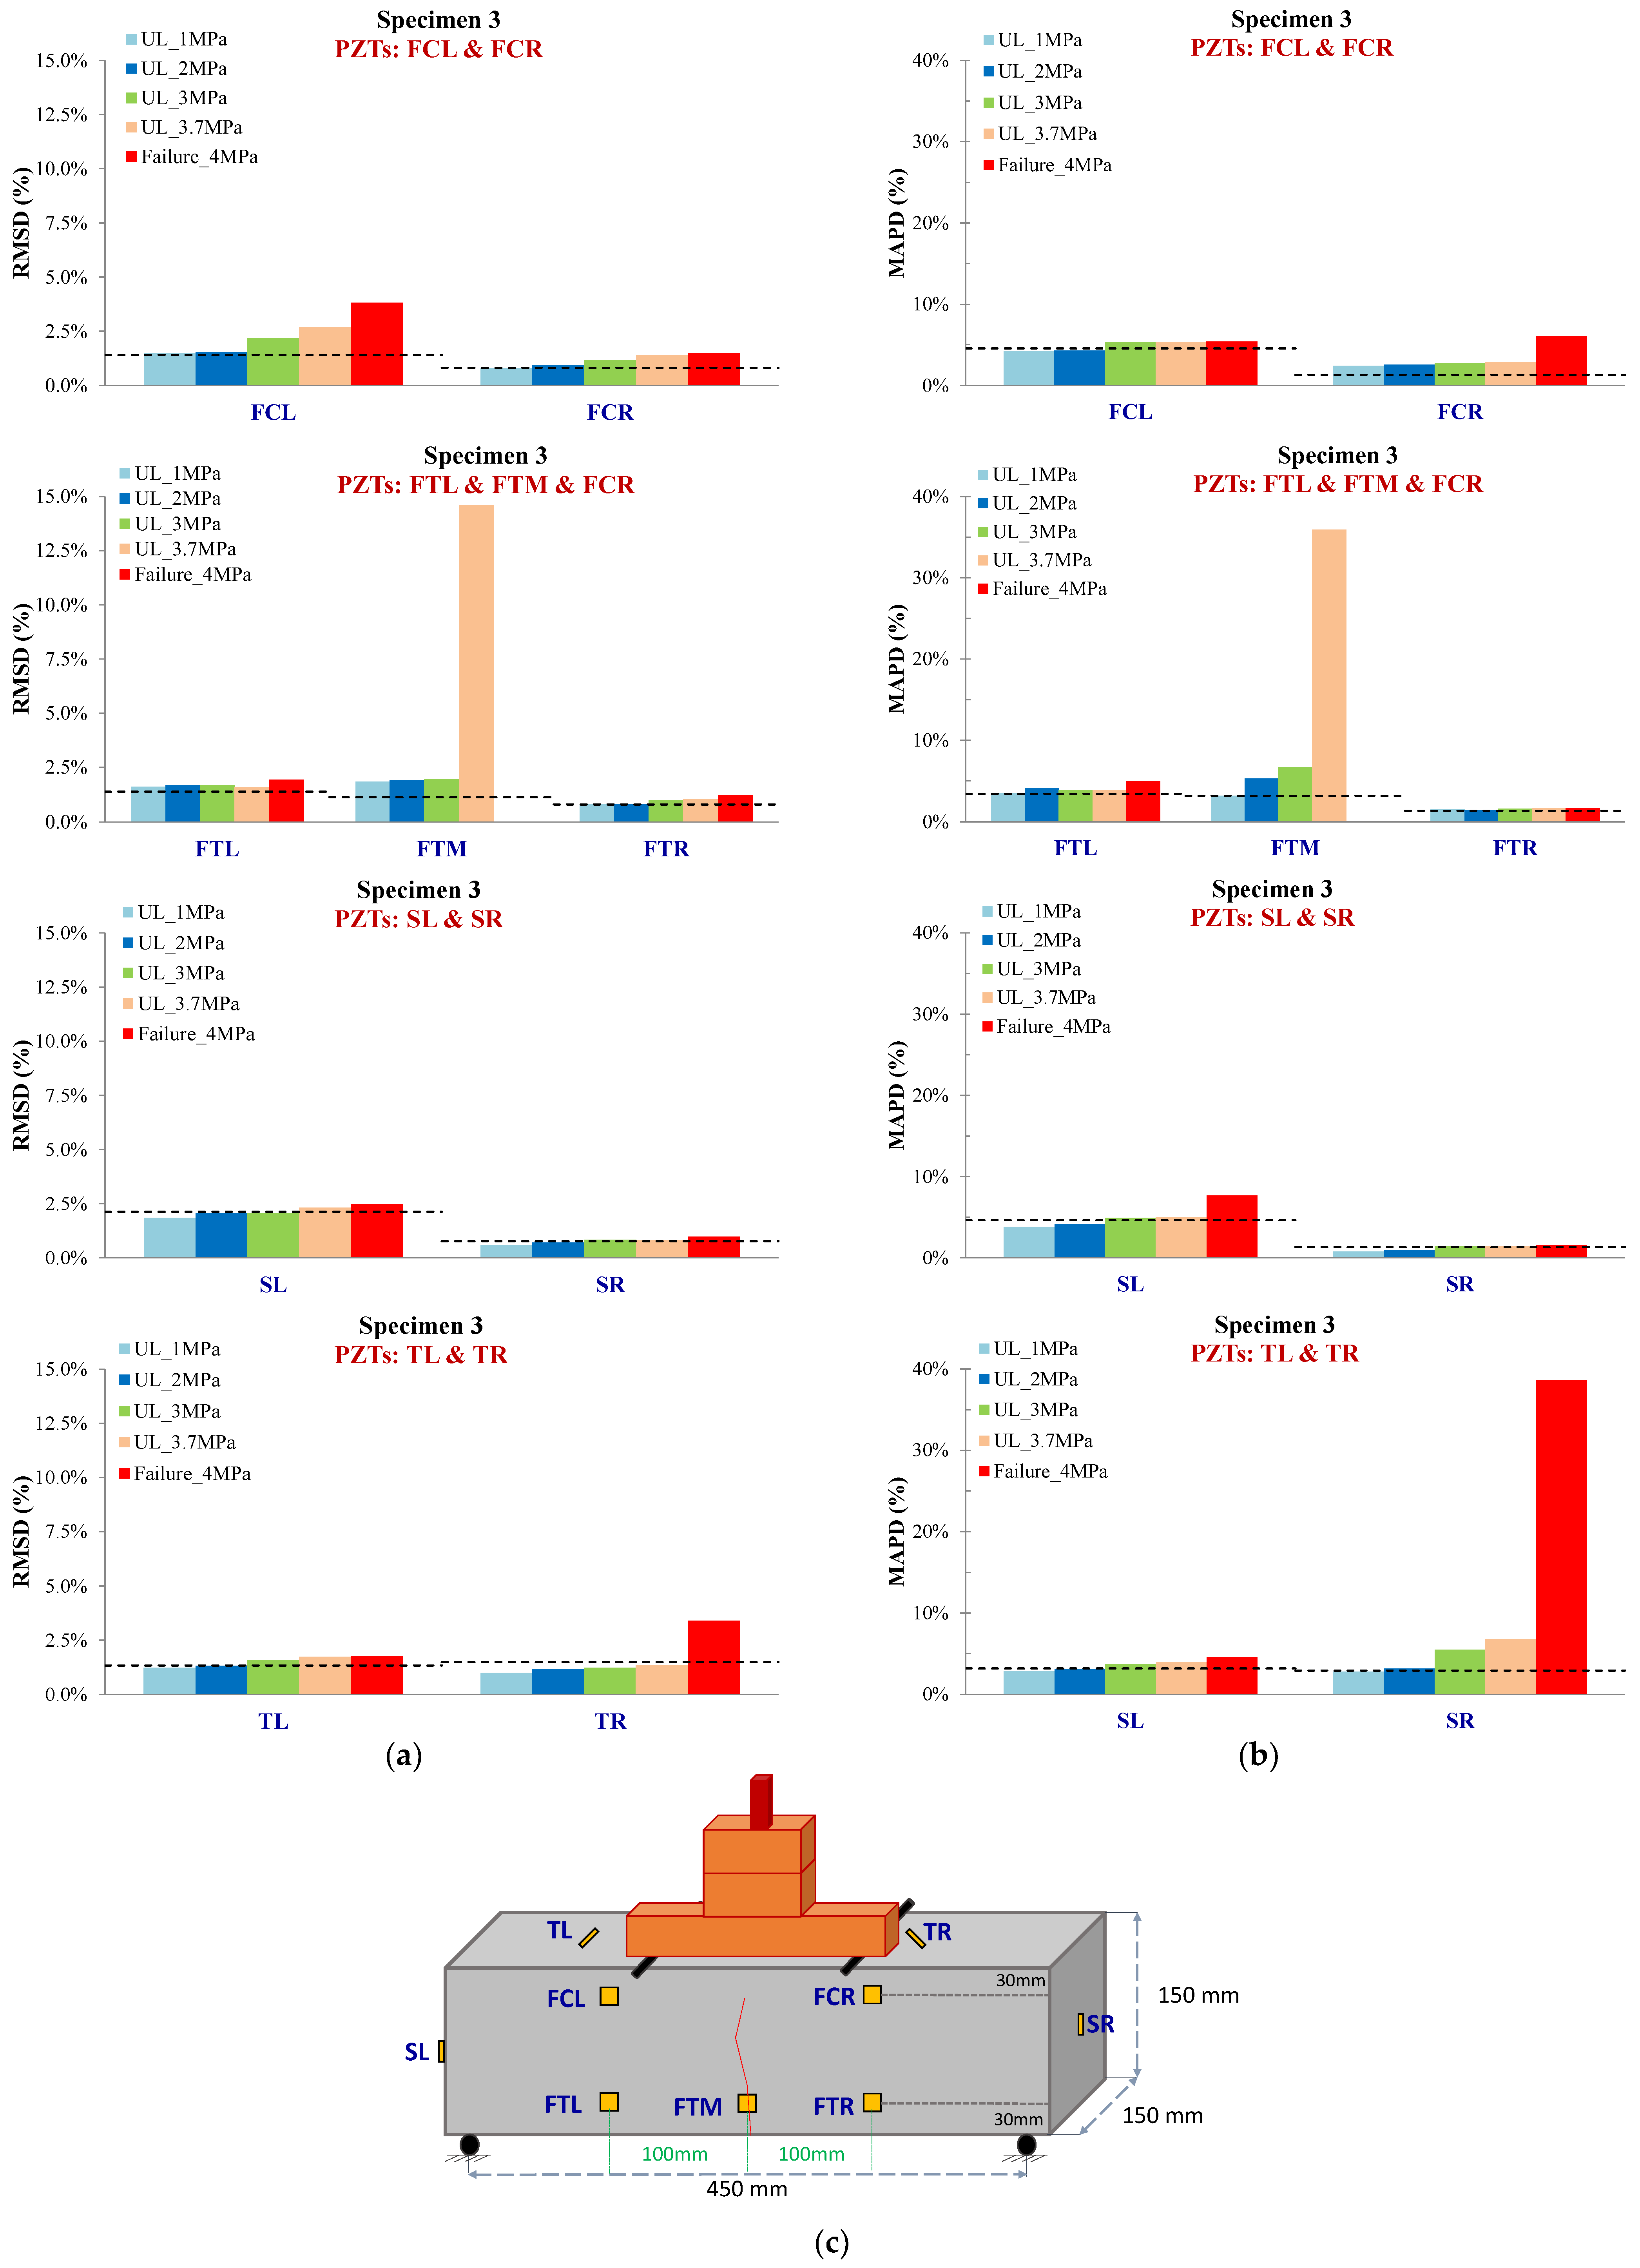
3.1.3. Specimen 3
3.1.4. Specimen 4
4. Conclusions
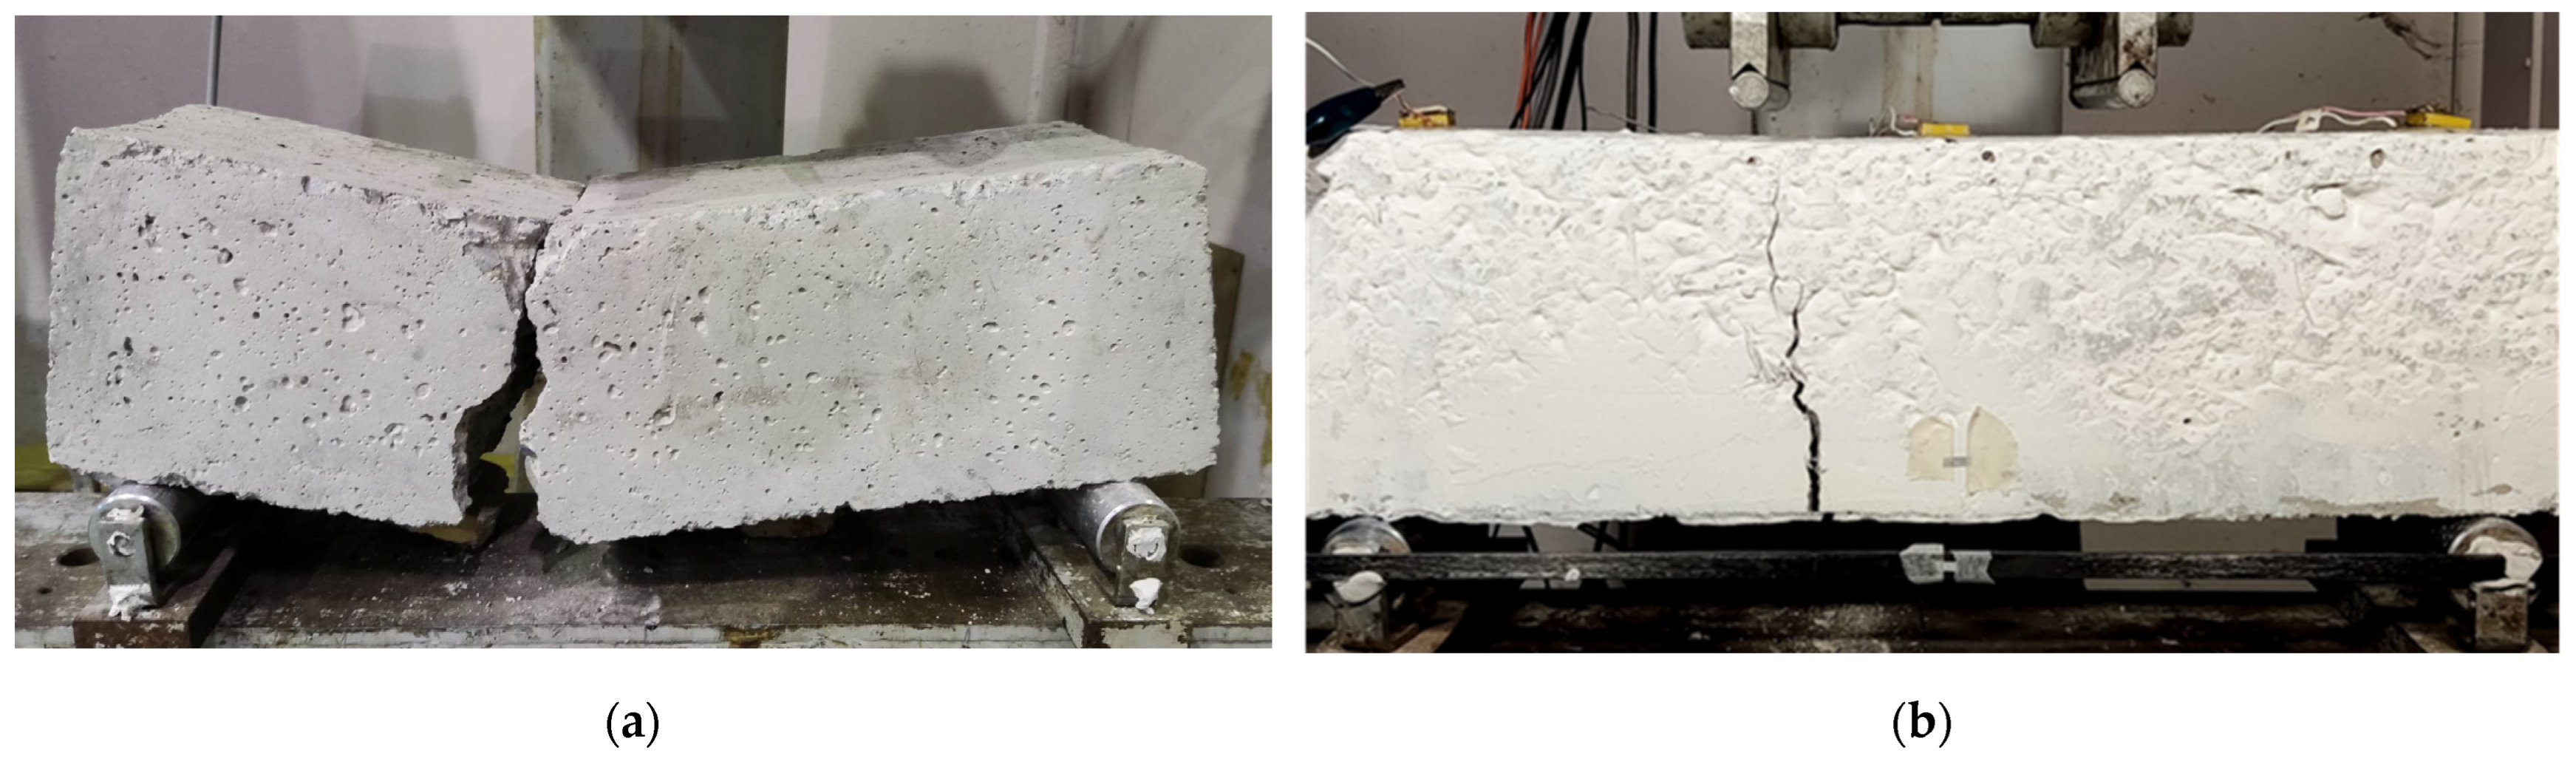
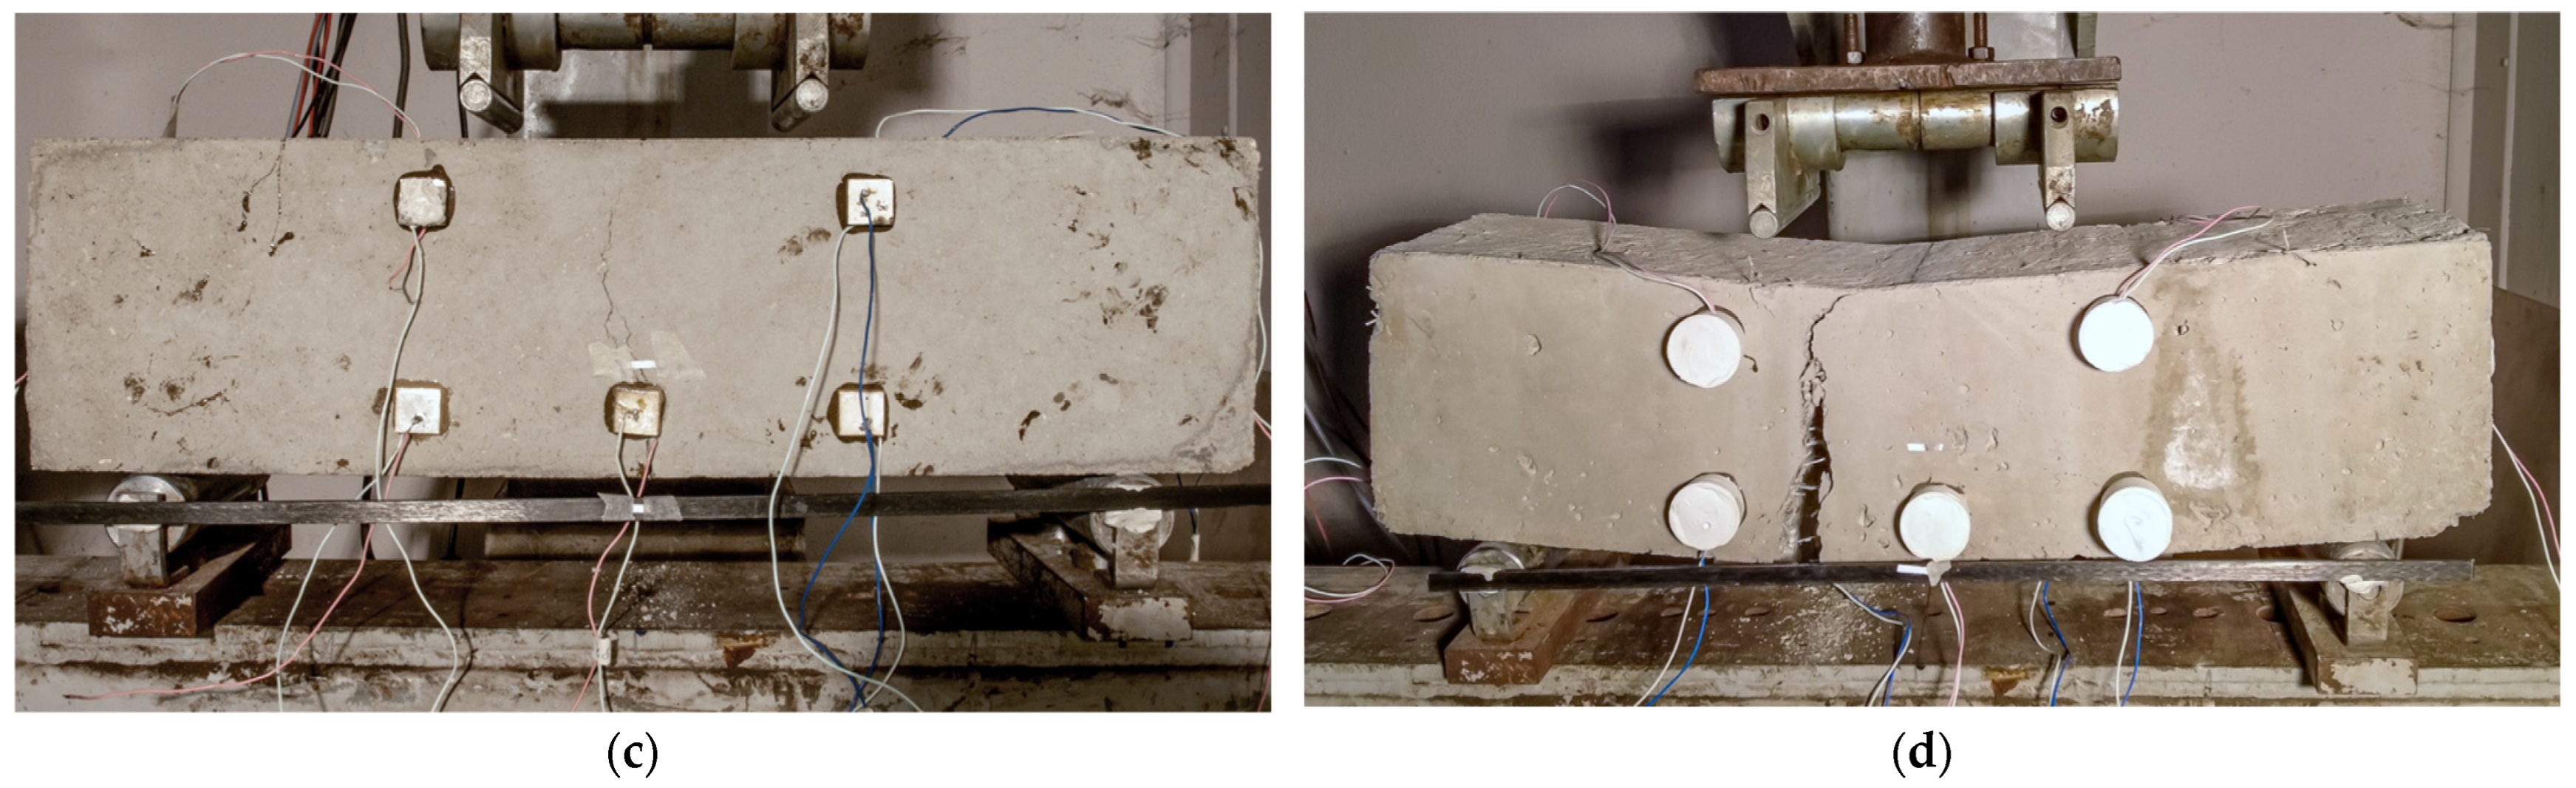
- SFRC specimens exhibited higher values of loading compared to the PC one. Further, SFRC specimens led to a more controlled brittle failure with a repairable cracking pattern, compared to the PC, where the specimen was separated into two individual sections.
- The SHM system’s effectiveness in damage diagnosis in a four-point bending test of SFRC specimens using voltage responses of specially mounted piezoelectric sensors has been experimentally investigated. Four different regions of PZTs application have been examined: (a) on the front face, (b) at the bottom surface, (c) at the top surface, and (d) at the free-end sides of the specimens.
- Damage diagnosis has been attempted using values of the known statistical RMSD and MAPD indices to improve the efficiency and accuracy of the applied technique.
- UCL threshold value has been implemented to enhance the accuracy of the measurements, evaluating the significance of each PZT patch individually. Hence, determining each patch’s sensitivity is crucial to establishing a reliable SHM monitoring technique by sifting the extracted indices.
- Voltage responses of the PZT acquired from the test measurements showed obvious discrepancies between the healthy state and the examined loading levels for each specimen. These differences indicate the presence of a potential abnormality. The implementation of the UCL threshold assists in determining that values below UCL are judged as insignificant, values slightly higher than the UCL need further examination, and considerably higher values constitute indications of potential damage.
- It has been found that approaching the final failure, the indices’ values of the contiguous PZTs are rationally trending upwards. Thereupon, most of the examined PZTs’ responses exhibited such a performance.
- It is emphasized that the indices’ values of the PZT BL mounted to the bottom surface of the specimens at a predefined angle of around 45° show elevated monitoring performance. Moreover, there are promising indications that the monitoring efficiency of the PZT sensor is inseparably linked with its sufficient positioning to the examined host structure. In addition, the closer to 90° is the angle formed between the formed crack and the polarization direction of the PZT, the more the monitoring efficiency increases. Therefore, the acquired measurements of the PZT sensors mounted to such locations could help enhance damage diagnosis performance and constitute indicators of prediction of the forthcoming failure at early damage stages.
- In the case of specimen 4, and following the previous conclusion, PZT SL mounted to the left side of the prism showed better results due to the angle of the crack formed, which is slightly inclined towards the left span of the prism.
- This study’s results concentrated on evaluating the efficiency of the PZT sensor’s network configuration. Further relevant investigation is needed to examine similar and multiple configuration types to enhance the proposed method’s reliability.
- Additional experiments are necessary to enhance the standardization procedures of the applied SHM technique. Furthermore, it is important to conduct further research using the proposed SHM technique on various structural elements and materials to build a comprehensive database. By applying statistical and data analysis to this database, a procedure similar to vulnerability curves can be developed, allowing for the baseline assessment of the current integrity of structural elements. Thus, the proposed method could be applied to existing structures with essential impact. Furthermore, combining NDT methods, SHM technique, and Finite Element simulations can also be tools for determining the current structural integrity.
Author Contributions
Funding
Institutional Review Board Statement
Informed Consent Statement
Data Availability Statement
Conflicts of Interest
References
- Sun, D.; Huang, C.; Cao, Z.; Wu, K.; Zhang, L. Reliability Assessment of Concrete under External Sulfate Attack. Case Stud. Constr. Mater. 2021, 15, e00690. [Google Scholar] [CrossRef]
- Ren, J.; Zhang, L.; San Nicolas, R. Degradation of Alkali-Activated Slag and Fly Ash Mortars under Different Aggressive Acid Conditions. J. Mater. Civ. Eng. 2021, 33, 04021140. [Google Scholar] [CrossRef]
- Cuenca, E.; Ferrara, L. Self-Healing Capacity of Fiber Reinforced Cementitious Composites. State of the Art and Perspectives. KSCE J. Civ. Eng. 2017, 21, 2777–2789. [Google Scholar] [CrossRef]
- Martinelli, E.; Lima, C.; Pepe, M.; Caggiano, A.; Faella, C. Post-Cracking Response of Hybrid Recycled/Industrial Steel Fiber-Reinforced Concrete. In Proceedings of the SP-326: Durability and Sustainability of Concrete Structures (DSCS-2018), Moscow, Russia, 6–7 June 2018. [Google Scholar] [CrossRef]
- Nana, W.S.A.; Tran, H.V.; Goubin, T.; Kubisztal, G.; Bennani, A.; Bui, T.T.; Cardia, G.; Limam, A. Behaviour of Macro-Synthetic Fibers Reinforced Concrete: Experimental, Numerical and Design Code Investigations. Structures 2021, 32, 1271–1286. [Google Scholar] [CrossRef]
- Caggiano, A.; Gambarelli, S.; Martinelli, E.; Nisticò, N.; Pepe, M. Experimental Characterization of the Post-Cracking Response in Hybrid Steel/Polypropylene Fiber-Reinforced Concrete. Constr. Build. Mater. 2016, 125, 1035–1043. [Google Scholar] [CrossRef]
- Guerini, V.; Conforti, A.; Plizzari, G.; Kawashima, S. Influence of Steel and Macro-Synthetic Fibers on Concrete Properties. Fibers 2018, 6, 47. [Google Scholar] [CrossRef]
- Yousefi, M.; Khandestani, R.; Gharaei-Moghaddam, N. Flexural Behavior of Reinforced Concrete Beams Made of Normal and Polypropylene Fiber-Reinforced Concrete Containing Date Palm Leaf Ash. Structures 2022, 37, 1053–1068. [Google Scholar] [CrossRef]
- Shi, F.; Pham, T.M.; Hao, H.; Hao, Y. Post-Cracking Behaviour of Basalt and Macro Polypropylene Hybrid Fibre Reinforced Concrete with Different Compressive Strengths. Constr. Build. Mater. 2020, 262, 120108. [Google Scholar] [CrossRef]
- Jalal, A.; Hakim, L.; Shafiq, N. Mechanical and Post-Cracking Characteristics of Fiber Reinforced Concrete Containing Copper-Coated Steel and PVA Fibers in 100% Cement and Fly Ash Concrete. Appl. Sci. 2021, 11, 1048. [Google Scholar] [CrossRef]
- Smarzewski, P. Study of Toughness and Macro/Micro-Crack Development of Fibre-Reinforced Ultra-High Performance Concrete After Exposure to Elevated Temperature. Materials 2019, 12, 1210. [Google Scholar] [CrossRef] [PubMed]
- Conforti, A.; Zerbino, R.; Plizzari, G.A. Influence of Steel, Glass and Polymer Fibers on the Cracking Behavior of Reinforced Concrete Beams under Flexure. Struct. Concr. 2019, 20, 133–143. [Google Scholar] [CrossRef]
- Bencardino, F.; Nisticò, M.; Verre, S. Experimental Investigation and Numerical Analysis of Bond Behavior in SRG-Strengthened Masonry Prisms Using UHTSS and Stainless-Steel Fibers. Fibers 2020, 8, 8. [Google Scholar] [CrossRef]
- Shafei, B.; Kazemian, M.; Dopko, M.; Najimi, M. State-of-the-Art Review of Capabilities and Limitations of Polymer and Glass Fibers Used for Fiber-Reinforced Concrete. Materials 2021, 14, 409. [Google Scholar] [CrossRef] [PubMed]
- Zhou, S.; Xie, L.; Jia, Y.; Wang, C. Review of Cementitious Composites Containing Polyethylene Fibers as Repairing Materials. Polymers 2020, 12, 2624. [Google Scholar] [CrossRef]
- Tawfik, M.; El-said, A.; Deifalla, A.; Awad, A. Mechanical Properties of Hybrid Steel-Polypropylene Fiber Reinforced High Strength Concrete Exposed to Various Temperatures. Fibers 2022, 10, 53. [Google Scholar] [CrossRef]
- Chalioris, C.E.; Panagiotopoulos, T.A. Flexural Analysis of Steel Fibre-Reinforced Concrete Members. Comput. Concr. 2018, 22, 11–25. [Google Scholar] [CrossRef]
- Sridhar, R.; Prasad, D.R. Damage Assessment of Functionally Graded Reinforced Concrete Beams Using Hybrid Fiber Engineered Cementitious Composites. Structures 2019, 20, 832–847. [Google Scholar] [CrossRef]
- Kytinou, V.K.; Chalioris, C.E.; Karayannis, C.G.; Elenas, A. Effect of Steel Fibers on the Hysteretic Performance of Concrete Beams with Steel Reinforcement—Tests and Analysis. Materials 2020, 13, 2923. [Google Scholar] [CrossRef] [PubMed]
- Murad, Y.; Abdel-Jabar, H. Flexural Behavior of RC Beams Made with Electric PVC Wires and Steel Fibers. Pract. Period. Struct. Des. Constr. 2021, 26, 04021040. [Google Scholar] [CrossRef]
- Zheng, D.; Wu, R.; Sufian, M.; Kahla, N.B.; Atig, M.; Deifalla, A.F.; Accouche, O.; Azab, M. Flexural Strength Prediction of Steel Fiber-Reinforced Concrete Using Artificial Intelligence. Materials 2022, 15, 5194. [Google Scholar] [CrossRef]
- Torres, J.A.; Lantsoght, E.O.L. Influence of Fiber Content on Shear Capacity of Steel Fiber-Reinforced Concrete Beams. Fibers 2019, 7, 102. [Google Scholar] [CrossRef]
- Murad, Y.; Abdel-Jabbar, H. Shear Behavior of RC Beams Prepared with Basalt and Polypropylene Fibers. Case Stud. Constr. Mater. 2022, 16, e00835. [Google Scholar] [CrossRef]
- Voutetaki, M.E.; Papadopoulos, N.A.; Angeli, G.M.; Providakis, C.P. Investigation of a New Experimental Method for Damage Assessment of RC Beams Failing in Shear Using Piezoelectric Transducers. Eng. Struct. 2016, 114, 226–240. [Google Scholar] [CrossRef]
- Soh, C.K.; Tseng, K.K.-H.; Bhalla, S.; Gupta, A. Performance of Smart Piezoceramic Patches in Health Monitoring of a RC Bridge. Smart Mater. Struct. 2000, 9, 533–542. [Google Scholar] [CrossRef]
- Mei, H.; Haider, M.; Joseph, R.; Migot, A.; Giurgiutiu, V. Recent Advances in Piezoelectric Wafer Active Sensors for Structural Health Monitoring Applications. Sensors 2019, 19, 383. [Google Scholar] [CrossRef]
- Thomoglou, A.K.; Fantidis, J.G.; Voutetaki, M.E.; Metaxa, Z.S.; Chalioris, C.E. Mechanical Characterization of Nano-Reinforced Mortar: X-Ray Micro-CT for 3D Imaging of Microstructure. Eng. Proc. 2023, 41, 4. [Google Scholar] [CrossRef]
- Anjneya, K.; Roy, K. Response Surface-Based Structural Damage Identification Using Dynamic Responses. Structures 2021, 29, 1047–1058. [Google Scholar] [CrossRef]
- Patil, S.; Mallikarjuna Reddy, D. Impact Damage Assessment in Carbon Fiber Reinforced Composite Using Vibration-Based New Damage Index and Ultrasonic C-Scanning Method. Structures 2020, 28, 638–650. [Google Scholar] [CrossRef]
- Mpalaskas, A.C.; Matikas, T.E.; Aggelis, D.G.; Alver, N. Acoustic Emission for Evaluating the Rein-1021 Forcement Effectiveness in Steel Fiber Reinforced Concrete. Appl. Sci. 2021, 11, 3850. [Google Scholar] [CrossRef]
- Mpalaskas, A.C.; Matikas, T.E.; Aggelis, D.G. Acoustic Emission of Fire Damaged Fiber Reinforced 1027 Concrete. In Smart Materials and Nondestructive Evaluation for Energy Systems 2016; SPIE: Bellingham, WA, USA, 2016. [Google Scholar] [CrossRef]
- Mpalaskas, A.C.; Matikas, T.E.; Aggelis, D.G. Acoustic Monitoring for the Evaluation of Concrete Structures and Materials. In Acoustic Emission and Related Non-Destructive Evaluation Techniques in the Fracture Mechanics of Concrete; Elsevier: Amsterdam, The Netherlands, 2021; pp. 257–280. [Google Scholar] [CrossRef]
- Gharehbaghi, V.R.; Noroozinejad Farsangi, E.; Yang, T.Y.; Hajirasouliha, I. Deterioration and Damage Identification in Building Structures Using a Novel Feature Selection Method. Structures 2021, 29, 458–470. [Google Scholar] [CrossRef]
- Khan, S.M.; Hanif, M.U.; Khan, A.; Hassan, M.U.; Javanmardi, A.; Ahmad, A. Damage Assessment of Reinforced Concrete Beams Using Cost-Effective MEMS Accelerometers. Structures 2022, 41, 602–618. [Google Scholar] [CrossRef]
- Sokhangou, F.; Sorelli, L.; Chouinard, L.; Dey, P.; Conciatori, D. Detecting Multiple Damages in UHPFRC Beams through Modal Curvature Analysis. Sensors 2024, 24, 971. [Google Scholar] [CrossRef] [PubMed]
- Sapidis, G.M.; Kansizoglou, I.; Naoum, M.C.; Papadopoulos, N.A.; Chalioris, C.E. A Deep Learning Approach for Autonomous Compression Damage Identification in Fiber-Reinforced Concrete Using Piezoelectric Lead Zirconate Titanate Transducers. Sensors 2024, 24, 386. [Google Scholar] [CrossRef] [PubMed]
- Pereira, L.; Mesquita, E.; Alberto, N.; Melo, J.; Marques, C.; Antunes, P.; André, P.S.; Varum, H. Fiber Bragg Grating Sensors for Reinforcing Bar Slippage Detection and Bond-Slip Gradient Characterization. Sensors 2022, 22, 8866. [Google Scholar] [CrossRef] [PubMed]
- Hu, J.; Tang, F.; Li, T.; Li, G.; Li, H.-N. A Strain Transfer Model for Detection of Pitting Corrosion and Loading Force of Steel Rebar with Distributed Fiber Optic Sensor. Sensors 2023, 23, 8142. [Google Scholar] [CrossRef]
- Amaya, A.; Sierra-Pérez, J. Toward a Structural Health Monitoring Methodology for Concrete Structures under Dynamic Loads Using Embedded FBG Sensors and Strain Mapping Techniques. Sensors 2022, 22, 4569. [Google Scholar] [CrossRef]
- Alj, I.; Quiertant, M.; Khadour, A.; Grando, Q.; Benzarti, K. Application of Distributed Optical Fiber Sensing Technology to the Detection and Monitoring of Internal Swelling Pathologies in Massive Concrete Blocks. Sensors 2022, 22, 7797. [Google Scholar] [CrossRef]
- Perera, R.; Torres, L.; Díaz, F.J.; Barris, C.; Baena, M. Analysis of the Impact of Sustained Load and Temperature on the Performance of the Electromechanical Impedance Technique through Multilevel Machine Learning and FBG Sensors. Sensors 2021, 21, 5755. [Google Scholar] [CrossRef] [PubMed]
- Ramli, J.; Coulson, J.; Martin, J.; Nagaratnam, B.; Poologanathan, K.; Cheung, W.M. Crack Detection and Localisation in Steel-Fibre-Reinforced Self-Compacting Concrete Using Triaxial Accelerometers. Sensors 2021, 21, 2044. [Google Scholar] [CrossRef] [PubMed]
- Sam-Daliri, O.; Faller, L.-M.; Farahani, M.; Roshanghias, A.; Araee, A.; Baniassadi, M.; Oberlercher, H.; Zangl, H. Impedance Analysis for Condition Monitoring of Single Lap CNT-Epoxy Adhesive Joint. Int. J. Adhes. Adhes. 2019, 88, 59–65. [Google Scholar] [CrossRef]
- Gao, K.; Zhang, Z.; Weng, S.; Zhu, H.; Yu, H.; Peng, T. Review of Flexible Piezoresistive Strain Sensors in Civil Structural Health Monitoring. Appl. Sci. 2022, 12, 9750. [Google Scholar] [CrossRef]
- Yang, Y.; Divsholi, B.S. Sub-Frequency Interval Approach in Electromechanical Impedance Technique for Concrete Structure Health Monitoring. Sensors 2010, 10, 11644–11661. [Google Scholar] [CrossRef]
- Huo, L.; Cheng, H.; Kong, Q.; Chen, X. Bond-Slip Monitoring of Concrete Structures Using Smart Sensors—A Review. Sensors 2019, 19, 1231. [Google Scholar] [CrossRef] [PubMed]
- Yang, Y.; Lim, Y.Y.; Soh, C.K. Practical Issues Related to the Application of the Electromechanical Impedance Technique in the Structural Health Monitoring of Civil Structures: II. Numerical Verification. Smart Mater. Struct. 2008, 17, 035009. [Google Scholar] [CrossRef]
- Karegar, M.; Bidgoli, M.R.; Mazaheri, H. Smart Control and Seismic Analysis of Concrete Frames with Piezoelectric Layer Based on Mathematical Modelling and Numerical Method. Structures 2021, 32, 1171–1179. [Google Scholar] [CrossRef]
- Chalioris, C.E.; Karayannis, C.G.; Angeli, G.M.; Papadopoulos, N.A.; Favvata, M.J.; Providakis, C.P. Applications of Smart Piezoelectric Materials in a Wireless Admittance Monitoring System (WiAMS) to Structures—Tests in RC Elements. Case Stud. Constr. Mater. 2016, 5, 1–18. [Google Scholar] [CrossRef]
- Naoum, M.C.; Sapidis, G.M.; Papadopoulos, N.A.; Voutetaki, M.E. An Electromechanical Impedance-Based Application of Realtime Monitoring for the Load-Induced Flexural Stress and Damage in Fiber-Reinforced Concrete. Fibers 2023, 11, 34. [Google Scholar] [CrossRef]
- Naoum, M.C.; Papadopoulos, N.A.; Voutetaki, M.E.; Chalioris, C.E. Structural Health Monitoring of Fiber-Reinforced Concrete Prisms with Polyolefin Macro-Fibers Using a Piezoelectric Materials Network under Various Load-Induced Stress. Buildings 2023, 13, 2465. [Google Scholar] [CrossRef]
- Papadopoulos, N.A.; Naoum, M.C.; Sapidis, G.M.; Chalioris, C.E. Resilient and Sustainable Structures through EMI-Based SHM Evaluation of an Innovative C-FRP Rope Strengthening Technique. Appl. Mech. 2024, 5, 405–419. [Google Scholar] [CrossRef]
- Sevillano, E.; Sun, R.; Gil, A.; Perera, R. Interfacial Crack-Induced Debonding Identification in FRP-Strengthened RC Beams from PZT Signatures Using Hierarchical Clustering Analysis. Compos. Part B Eng. 2016, 87, 322–335. [Google Scholar] [CrossRef]
- Perera, R.; Torres, L.; Ruiz, A.; Barris, C.; Baena, M. An EMI-Based Clustering for Structural Health Monitoring of NSM FRP Strengthening Systems. Sensors 2019, 19, 3775. [Google Scholar] [CrossRef] [PubMed]
- Liu, H.; Lyu, X.; Zhang, Y.; Luo, G.; Li, W. Bending Resistance and Failure Type Evaluation of Basalt Fiber RPC Beam Affected by Notch and Interfacial Damage Using Acoustic Emission. Appl. Sci. 2020, 10, 1138. [Google Scholar] [CrossRef]
- Providakis, C.; Tsistrakis, S.; Voutetaki, M.; Tsompanakis, J.; Stavroulaki, M.; Agadakos, J.; Kampianakis, E.; Pentes, G.; Liarakos, E. An Innovative Active Sensing Platform for Wireless Damage Monitoring of Concrete Structures. CSM 2016, 1, 49–62. [Google Scholar] [CrossRef]
- Chalioris, C.E.; Kytinou, V.K.; Voutetaki, M.E.; Karayannis, C.G. Flexural Damage Diagnosis in Reinforced Concrete Beams Using a Wireless Admittance Monitoring System—Tests and Finite Element Analysis. Sensors 2021, 21, 679. [Google Scholar] [CrossRef]
- Naoum, M.; Sapidis, G.; Papadopoulos, N.; Golias, E.; Chalioris, C. Structural Health Monitoring of Reinforced Concrete Beam-Column Joints Using Piezoelectric Transducers. In International RILEM Conference on Synergising Expertise towards Sustainability and Robustness of Cement-Based Materials and Concrete Structures; Jędrzejewska, A., Kanavaris, F., Azenha, M., Benboudjema, F., Schlicke, D., Eds.; Springer Nature: Cham, Switzerland, 2023; pp. 945–956. [Google Scholar]
- Wang, Z.; Chen, D.; Zheng, L.; Huo, L.; Song, G. Influence of Axial Load on Electromechanical Impedance (EMI) of Embedded Piezoceramic Transducers in Steel Fiber Concrete. Sensors 2018, 18, 1782. [Google Scholar] [CrossRef]
- Voutetaki, M.E.; Naoum, M.C.; Papadopoulos, N.A.; Chalioris, C.E. Cracking Diagnosis in Fiber-Reinforced Concrete with Synthetic Fibers Using Piezoelectric Transducers. Fibers 2022, 10, 5. [Google Scholar] [CrossRef]
- Cao, Y.; Zandi, Y.; Rahimi, A.; Petković, D.; Denić, N.; Stojanović, J.; Spasić, B.; Vujović, V.; Amine Khadimallah, M.; Assilzadeh, H. Evaluation and Monitoring of Impact Resistance of Fiber Reinforced Concrete by Adaptive Neuro Fuzzy Algorithm. Structures 2021, 34, 3750–3756. [Google Scholar] [CrossRef]
- DIN EN 206:2021-06; Concrete—Specification, Performance, Production and Conformity; German version EN 206:2013+A2:2021. DIN German Institute for Standardization: Berlin, Germany, 2021.
- ASTM 78 ASTM C 78–94; Standard Test Method for Flexural Strength of Concrete (Using Simple Beam with Third-Point Loading). ASTM: West Conshohocken, PA, USA, 2002.


| Mix Proportion (Cement: Water: Fine Aggregate: Coarse Aggregate) | Density (Kg m−3) | Compressive Strength (MPa) | Young’s modulus (GPa) | Modulus of Rupture (MPa) | |||
|---|---|---|---|---|---|---|---|
| Spec. 1 | Spec. 2 | Spec. 3 | Spec. 4 | ||||
| 1:0.52:2.4:2 | 2355 | 46 | 32 | 3.3 | 5.1 | 4.0 | 4.0 |
| Type (Name) | Length (mm) | Equivalent Diameter (mm) | Young’s Modulus (GPa) | Tensile Strength (MPa) |
|---|---|---|---|---|
| SikaFiber Force 50 | 50 | 0.715 | 6 | 430 |
| Cycle | Max. Load/Cycle (MPa) | Ultimate Damage Level (UL) | Percentage of the Flexural Max Strength | |
|---|---|---|---|---|
| Specimen 1 | 1 | 1.0 MPa | UL_1 MPa | 30% |
| 2 | 2.0 MPa | UL_2 MPa | 60% | |
| 3 | 3.3 MPa | Failure_3.3 MPa | Failure (max strength) | |
| Specimen 2 | 1 | 1.0 MPa | UL_1 MPa | 20% |
| 2 | 2.0 MPa | UL_2 MPa | 39% | |
| 3 | 3.0 MPa | UL_3.0 MPa | 59% | |
| 4 | 5.1 MPa | Failure_5.1 MPa | Failure (max strength) | |
| Specimen 3 | 1 | 1.0 MPa | UL_1 MPa | 25% |
| 2 | 2.0 MPa | UL_2 MPa | 50% | |
| 3 | 3.7 MPa | UL_3.7 MPa | 93% | |
| 4 | 4.0 MPa | Failure_4.0 MPa | Failure (max strength) | |
| Specimen 4 | 1 | 1.0 MPa | UL_1 MPa | 25% |
| 2 | 2.0 MPa | UL_2 MPa | 50% | |
| 3 | 3.3 MPa | UL_3.3 MPa | 83% | |
| 4 | 4.0 MPa | Failure_4.0 MPa | Failure (max strength) |
Disclaimer/Publisher’s Note: The statements, opinions and data contained in all publications are solely those of the individual author(s) and contributor(s) and not of MDPI and/or the editor(s). MDPI and/or the editor(s) disclaim responsibility for any injury to people or property resulting from any ideas, methods, instructions or products referred to in the content. |
© 2024 by the authors. Licensee MDPI, Basel, Switzerland. This article is an open access article distributed under the terms and conditions of the Creative Commons Attribution (CC BY) license (https://creativecommons.org/licenses/by/4.0/).
Share and Cite
Naoum, M.C.; Papadopoulos, N.A.; Sapidis, G.M.; Voutetaki, M.E. Efficacy of PZT Sensors Network Different Configurations in Damage Detection of Fiber-Reinforced Concrete Prisms under Repeated Loading. Sensors 2024, 24, 5660. https://doi.org/10.3390/s24175660
Naoum MC, Papadopoulos NA, Sapidis GM, Voutetaki ME. Efficacy of PZT Sensors Network Different Configurations in Damage Detection of Fiber-Reinforced Concrete Prisms under Repeated Loading. Sensors. 2024; 24(17):5660. https://doi.org/10.3390/s24175660
Chicago/Turabian StyleNaoum, Maria C., Nikos A. Papadopoulos, George M. Sapidis, and Maristella E. Voutetaki. 2024. "Efficacy of PZT Sensors Network Different Configurations in Damage Detection of Fiber-Reinforced Concrete Prisms under Repeated Loading" Sensors 24, no. 17: 5660. https://doi.org/10.3390/s24175660
APA StyleNaoum, M. C., Papadopoulos, N. A., Sapidis, G. M., & Voutetaki, M. E. (2024). Efficacy of PZT Sensors Network Different Configurations in Damage Detection of Fiber-Reinforced Concrete Prisms under Repeated Loading. Sensors, 24(17), 5660. https://doi.org/10.3390/s24175660