


Biomarkers in Cancer Detection, Diagnosis, and Prognosis


Abstract
1. Introduction
2. Challenges Associated with Detecting Early-Stage Tumors
3. Biomarkers in Cancer Detection, Diagnosis, and Prognosis
3.1. Biofluid Biomarkers
3.2. Imaging Biomarkers
3.3. Needle Biopsy
3.4. Tissue Imaging
4. Types of Cancer Biomarkers
4.1. Genetic Biomarkers
4.1.1. Mutations and Gene Alterations
4.1.2. Gene Expression Profiles
4.1.3. DNA as a Cancer Biomarker
4.1.4. RNA as a Cancer Biomarker

4.1.5. Epigenetics as a Cancer Biomarker
4.2. Protein Biomarkers
Proteins as Cancer Biomarkers
4.3. Metabolic Biomarkers
4.3.1. Metabolites and Metabolic Pathways
4.3.2. Metabolic Imaging Techniques
4.3.3. Molecular Probes and Contrast Agents
4.4. Cells as Cancer Biomarkers
4.4.1. Circulating Tumor Cells as Cancer Biomarkers
4.4.2. Immune Cells as Cancer Biomarkers
4.4.3. Cancer Stem Cells as Cancer Biomarkers
4.5. Lamins as Cancer Biomarkers
4.6. Galectins as Cancer Biomarkers
4.7. Carbohydrate Antigens as Cancer Biomarkers
4.8. Viruses as Cancer Biomarkers
4.9. Exosomes as a Cancer Biomarker
4.10. Lipids as Cancer Biomarkers
5. Clinical Classification of Cancer Biomarkers
5.1. Screening and Diagnostic Biomarkers
5.2. Prognostic Biomarkers
5.2.1. Predicting Disease Progression and Patient Outcomes
- Breast Cancer:
- a.
- Hormone Receptor Status: The presence or absence of estrogen receptor (ER), progesterone receptor (PR), and human epidermal growth factor receptor 2 (HER2) can help determine the prognosis and guide treatment decisions [384].
- b.
- Ki-67: A high expression of the Ki-67 protein, a marker of cellular proliferation, is associated with more aggressive breast cancer and poorer prognosis [385].
- c.
- Oncotype DX: A genomic test that analyzes the expression of a panel of genes to predict the risk of recurrence and guide the use of chemotherapy in early-stage breast cancer [386].
- Colorectal Cancer:
- a.
- Microsatellite Instability (MSI): Tumors with high levels of MSI have a better prognosis and are associated with a higher response rate to immune checkpoint inhibitors [387].
- b.
- Carcinoembryonic Antigen (CEA): Elevated levels of CEA in the blood are associated with advanced disease and poorer prognosis in colorectal cancer [388].
- c.
- BRAF V600E Mutation: Patients with colorectal cancer harboring this mutation have a worse prognosis and may respond differently to certain treatments [389].
- Lung Cancer:
- a.
- EGFR Mutation: Non-small-cell lung cancer (NSCLC) patients with EGFR mutations tend to have a better prognosis and may respond well to targeted therapies [390].
- b.
- ALK Rearrangement: NSCLC patients with ALK gene rearrangements have a better prognosis and are highly responsive to ALK inhibitors [391].
- c.
- PD-L1 Expression: Higher levels of PD-L1 expression in tumor cells are associated with a better response to immune checkpoint inhibitors in NSCLC [392].
- Prostate Cancer:
- a.
- Prostate-Specific Antigen (PSA): PSA levels in the blood can provide information about the prognosis of prostate cancer, with higher levels often indicating a worse prognosis [393].
- b.
- Gleason Score: This scoring system evaluates the histological appearance of prostate cancer cells and helps predict the aggressiveness and prognosis of the disease [394].
- c.
- Androgen Receptor (AR) Expression: High levels of AR expression in prostate cancer cells are associated with a worse prognosis and resistance to androgen deprivation therapy [395].
5.2.2. Tumor Staging and Grading Systems
- Breast Cancer:
- a.
- Estrogen Receptor (ER) and Progesterone Receptor (PR) Status: ER-positive and PR-positive breast cancers tend to have a better prognosis compared to ER-negative and PR-negative tumors [396].
- b.
- Human Epidermal Growth Factor Receptor 2 (HER2) Expression: HER2-positive breast cancers are associated with a more aggressive disease and poorer prognosis [397].
- c.
- Ki-67: High levels of Ki-67, a marker of cellular proliferation, indicate a more aggressive tumor and are associated with poorer prognosis [385].
- Prostate Cancer:
- a.
- Gleason Score: The Gleason scoring system evaluates the microscopic appearance of prostate cancer cells, with higher scores indicating a more aggressive tumor and poorer prognosis [398].
- b.
- Prostate-Specific Antigen (PSA) Velocity: The rate of change in PSA levels over time can help predict the risk of disease progression and metastasis [399].
- c.
- PTEN Loss: The loss of the PTEN gene, which regulates cell growth and division, is associated with a higher Gleason score and more aggressive prostate cancer [400].
- Colorectal Cancer:
- a.
- Microsatellite Instability (MSI): Tumors with high levels of MSI are associated with a better prognosis and a lower risk of disease recurrence.
- b.
- BRAF V600E Mutation: Colorectal cancer patients with the BRAF V600E mutation have a worse prognosis and a higher likelihood of disease recurrence.
- c.
- KRAS Mutation: Specific KRAS mutations can indicate a more aggressive tumor and a poorer response to certain treatments [401].
- Lung Cancer:
- a.
- TNM Staging: The TNM system incorporates tumor size (T), lymph node involvement (N), and metastasis (M) to determine the stage of lung cancer and predict prognosis.
- b.
- Epidermal Growth Factor Receptor (EGFR) Mutation: EGFR mutations are associated with a better prognosis and higher response rates to targeted therapies in lung cancer.
- c.
- ALK Rearrangement: Lung cancer patients with ALK gene rearrangements have a better prognosis and are highly responsive to ALK inhibitors.
5.3. Predictive Biomarkers
6. Conventional Cancer Diagnostic Modes
7. Emerging Technologies and Techniques
7.1. Liquid Biopsy
7.2. Single-Cell Analysis
7.3. Artificial Intelligence and Machine Learning
- FDA-approved AI
8. Challenges and Future Directions
Author Contributions
Funding
Institutional Review Board Statement
Informed Consent Statement
Data Availability Statement
Conflicts of Interest
References
- Allegra, C.J.; Jessup, J.M.; Somerfield, M.R.; Hamilton, S.R.; Hammond, E.H.; Hayes, D.F.; McAllister, P.K.; Morton, R.F.; Schilsky, R.L. American Society of Clinical Oncology provisional clinical opinion: Testing for KRAS gene mutations in patients with metastatic colorectal carcinoma to predict response to anti–epidermal growth factor receptor monoclonal antibody therapy. J. Clin. Oncol. 2009, 27, 2091–2096. [Google Scholar] [CrossRef]
- Allred, D.C. Commentary: Hormone receptor testing in breast cancer: A distress signal from Canada. Oncologist 2008, 13, 1134–1136. [Google Scholar] [CrossRef]
- Baggerly, K.A.; Morris, J.S.; Coombes, K.R. Reproducibility of SELDI-TOF protein patterns in serum: Comparing datasets from different experiments. Bioinformatics 2004, 20, 777–785. [Google Scholar] [CrossRef]
- Bang, Y.-J.; Van Cutsem, E.; Feyereislova, A.; Chung, H.C.; Shen, L.; Sawaki, A.; Lordick, F.; Ohtsu, A.; Omuro, Y.; Satoh, T. Trastuzumab in combination with chemotherapy versus chemotherapy alone for treatment of HER2-positive advanced gastric or gastro-oesophageal junction cancer (ToGA): A phase 3, open-label, randomised controlled trial. Lancet 2010, 376, 687–697. [Google Scholar] [CrossRef]
- Bossuyt, P.M.; Reitsma, J.B.; Bruns, D.E.; Gatsonis, C.A.; Glasziou, P.P.; Irwig, L.M.; Moher, D.; Rennie, D.; De Vet, H.C.; Lijmer, J.G. The STARD statement for reporting studies of diagnostic accuracy: Explanation and elaboration. Ann. Intern. Med. 2003, 138, W1–W12. [Google Scholar] [CrossRef]
- Burstein, H.J.; Mangu, P.B.; Somerfield, M.R.; Schrag, D.; Samson, D.; Holt, L.; Zelman, D.; Ajani, J.A. American Society of Clinical Oncology clinical practice guideline update on the use of chemotherapy sensitivity and resistance assays. J. Clin. Oncol. 2011, 29, 3328–3330. [Google Scholar] [CrossRef]
- Carlson, R.W.; Allred, D.C.; Anderson, B.O.; Burstein, H.J.; Carter, W.B.; Edge, S.B.; Erban, J.K.; Farrar, W.B.; Forero, A.; Giordano, S.H. Invasive breast cancer. J. Natl. Compr. Cancer Netw. 2011, 9, 136–222. [Google Scholar] [CrossRef]
- Cristofanilli, M.; Budd, G.T.; Ellis, M.J.; Stopeck, A.; Matera, J.; Miller, M.C.; Reuben, J.M.; Doyle, G.V.; Allard, W.J.; Terstappen, L.W. Circulating tumor cells, disease progression, and survival in metastatic breast cancer. N. Engl. J. Med. 2004, 351, 781–791. [Google Scholar] [CrossRef]
- Domchek, S.M.; Friebel, T.M.; Singer, C.F.; Evans, D.G.; Lynch, H.T.; Isaacs, C.; Garber, J.E.; Neuhausen, S.L.; Matloff, E.; Eeles, R. Association of risk-reducing surgery in BRCA1 or BRCA2 mutation carriers with cancer risk and mortality. JAMA 2010, 304, 967–975. [Google Scholar] [CrossRef]
- Early Breast Cancer Trialists’ Collaborative Group. Relevance of breast cancer hormone receptors and other factors to the efficacy of adjuvant tamoxifen: Patient-level meta-analysis of randomised trials. Lancet 2011, 378, 771–784. [Google Scholar] [CrossRef]
- Easton, D.F.; Ford, D.; Bishop, D.T. Breast and ovarian cancer incidence in BRCA1-mutation carriers. Breast Cancer Linkage Consortium. Am. J. Hum. Genet. 1995, 56, 265. [Google Scholar] [PubMed]
- Fisher, B.; Costantino, J.P.; Wickerham, D.L.; Redmond, C.K.; Kavanah, M.; Cronin, W.M.; Vogel, V.; Robidoux, A.; Dimitrov, N.; Atkins, J.; et al. Tamoxifen for prevention of breast cancer: Report of the National Surgical Adjuvant Breast and Bowel Project P-1 Study. JNCI J. Natl. Cancer Inst. 1998, 90, 1371–1388. [Google Scholar] [CrossRef] [PubMed]
- Freidlin, B.; McShane, L.M.; Korn, E.L. Randomized clinical trials with biomarkers: Design issues. J. Natl. Cancer Inst. 2010, 102, 152–160. [Google Scholar] [CrossRef] [PubMed]
- Hammarström, S. The carcinoembryonic antigen (CEA) family: Structures, suggested functions and expression in normal and malignant tissues. Semin. Cancer Biol. 1999, 9, 67–81. [Google Scholar] [CrossRef] [PubMed]
- Imperiale, T.F.; Ransohoff, D.F.; Itzkowitz, S.H.; Levin, T.R.; Lavin, P.; Lidgard, G.P.; Ahlquist, D.A.; Berger, B.M. Multitarget stool DNA testing for colorectal-cancer screening. N. Engl. J. Med. 2014, 370, 1287–1297. [Google Scholar] [CrossRef] [PubMed]
- Serganova, I.; Blasberg, R.G. Molecular imaging with reporter genes: Has its promise been delivered? J. Nucl. Med. 2019, 60, 1665–1681. [Google Scholar] [CrossRef] [PubMed]
- Gilad, A.A.; Shapiro, M.G. Molecular imaging in synthetic biology, and synthetic biology in molecular imaging. Mol. Imaging Biol. 2017, 19, 373–378. [Google Scholar] [CrossRef] [PubMed]
- Condeelis, J.; Weissleder, R. In vivo imaging in cancer. Cold Spring Harb. Perspect. Biol. 2010, 2, a003848. [Google Scholar] [CrossRef]
- Cho, W.C. Contribution of oncoproteomics to cancer biomarker discovery. Mol. Cancer 2007, 6, 25. [Google Scholar] [CrossRef]
- Siravegna, G.; Marsoni, S.; Siena, S.; Bardelli, A. Integrating liquid biopsies into the management of cancer. Nat. Rev. Clin. Oncol. 2017, 14, 531–548. [Google Scholar] [CrossRef]
- Pantel, K.; Alix-Panabières, C. Circulating tumour cells in cancer patients: Challenges and perspectives. Trends Mol. Med. 2010, 16, 398–406. [Google Scholar] [CrossRef] [PubMed]
- Bardelli, A.; Pantel, K. Liquid biopsies, what we do not know (yet). Cancer Cell 2017, 31, 172–179. [Google Scholar] [CrossRef] [PubMed]
- Tan, G.H.; Nason, G.; Ajib, K.; Woon, D.T.S.; Herrera-Caceres, J.; Alhunaidi, O.; Perlis, N. Smarter screening for prostate cancer. World J. Urol. 2019, 37, 991–999. [Google Scholar] [CrossRef] [PubMed]
- Gahan, P.; Stroun, M. The biology of circulating nucleic acids in plasma and serum (CNAPS). In Extracellular Nucleic Acids; Springer: Berlin/Heidelberg, Germany, 2010; pp. 167–189. [Google Scholar]
- Porto-Mascarenhas, E.C.; Assad, D.X.; Chardin, H.; Gozal, D.; Canto, G.D.L.; Acevedo, A.C.; Guerra, E.N.S. Salivary biomarkers in the diagnosis of breast cancer: A review. Crit. Rev. Oncol./Hematol. 2017, 110, 62–73. [Google Scholar] [CrossRef] [PubMed]
- Lawrence, H.P. Salivary markers of systemic disease: Noninvasive diagnosis of disease and monitoring of general health. J.-Can. Dent. Assoc. 2002, 68, 170–175. [Google Scholar] [PubMed]
- Zhang, L.; Farrell, J.J.; Zhou, H.; Elashoff, D.; Akin, D.; Park, N.H.; Chia, D.; Wong, D.T. Salivary transcriptomic biomarkers for detection of resectable pancreatic cancer. Gastroenterology 2010, 138, 949–957.e7. [Google Scholar] [CrossRef] [PubMed]
- Gao, S.; Chen, L.-Y.; Wang, P.; Liu, L.-M.; Chen, Z. MicroRNA expression in salivary supernatant of patients with pancreatic cancer and its relationship with ZHENG. BioMed Res. Int. 2014, 2014, 756347. [Google Scholar] [CrossRef]
- Humeau, M.; Vignolle-Vidoni, A.; Sicard, F.; Martins, F.; Bournet, B.; Buscail, L.; Torrisani, J.; Cordelier, P. Salivary microRNA in pancreatic cancer patients. PLoS ONE 2015, 10, e0130996. [Google Scholar] [CrossRef]
- Lau, C.; Kim, Y.; Chia, D.; Spielmann, N.; Eibl, G.; Elashoff, D.; Wei, F.; Lin, Y.-L.; Moro, A.; Grogan, T. Role of pancreatic cancer-derived exosomes in salivary biomarker development. J. Biol. Chem. 2013, 288, 26888–26897. [Google Scholar] [CrossRef]
- Zhang, L.; Xiao, H.; Zhou, H.; Santiago, S.; Lee, J.M.; Garon, E.B.; Yang, J.; Brinkmann, O.; Yan, X.; Akin, D. Development of transcriptomic biomarker signature in human saliva to detect lung cancer. Cell. Mol. Life Sci. 2012, 69, 3341–3350. [Google Scholar] [CrossRef]
- Wu, Z.-Z.; Wang, J.-G.; Zhang, X.-L. Diagnostic model of saliva protein finger print analysis of patients with gastric cancer. World J. Gastroenterol. WJG 2009, 15, 865. [Google Scholar] [CrossRef] [PubMed]
- Wang, X.; Kaczor-Urbanowicz, K.E.; Wong, D.T. Salivary biomarkers in cancer detection. Med. Oncol. 2017, 34, 7. [Google Scholar] [CrossRef] [PubMed]
- Landgren, O.; Porwit MacDonald, A.; Tani, E.; Czader, M.; Grimfors, G.; Skoog, L.; Ost, A.; Wedelin, C.; Axdorph, U.; Svedmyr, E. A prospective comparison of fine-needle aspiration cytology and histopathology in the diagnosis and classification of lymphomas. Hematol. J. 2004, 5, 69–76. [Google Scholar] [CrossRef] [PubMed]
- Barker, A.; Kettle, J.G.; Nowak, T.; Pease, J.E. Expanding medicinal chemistry space. Drug Discov. Today 2013, 18, 298–304. [Google Scholar] [CrossRef] [PubMed]
- Blagg, J.; Workman, P. Chemical biology approaches to target validation in cancer. Curr. Opin. Pharmacol. 2014, 17, 87–100. [Google Scholar] [CrossRef] [PubMed]
- Atlas, A.B.-R. Breast Imaging Reporting and Data System; American College of Radiology: Reston, VA, USA, 2013. [Google Scholar]
- Edge, S.B.; Cancer, A.J.C.o. AJCC Cancer Staging Manual; Springer: Berlin/Heidelberg, Germany, 2010; Volume 7. [Google Scholar]
- Therasse, P.; Arbuck, S.G.; Eisenhauer, E.A.; Wanders, J.; Kaplan, R.S.; Rubinstein, L.; Verweij, J.; Van Glabbeke, M.; van Oosterom, A.T.; Christian, M.C. New guidelines to evaluate the response to treatment in solid tumors. J. Natl. Cancer Inst. 2000, 92, 205–216. [Google Scholar] [CrossRef] [PubMed]
- Eisenhauer, E.A.; Therasse, P.; Bogaerts, J.; Schwartz, L.H.; Sargent, D.; Ford, R.; Dancey, J.; Arbuck, S.; Gwyther, S.; Mooney, M. New response evaluation criteria in solid tumours: Revised RECIST guideline (version 1.1). Eur. J. Cancer 2009, 45, 228–247. [Google Scholar] [CrossRef] [PubMed]
- Reid, D.M.; Doughty, J.; Eastell, R.; Heys, S.D.; Howell, A.; McCloskey, E.V.; Powles, T.; Selby, P.; Coleman, R.E. Guidance for the management of breast cancer treatment-induced bone loss: A consensus position statement from a UK Expert Group. Cancer Treat. Rev. 2008, 34, S3–S18. [Google Scholar] [CrossRef]
- Plana, J.C.; Galderisi, M.; Barac, A.; Ewer, M.S.; Ky, B.; Scherrer-Crosbie, M.; Ganame, J.; Sebag, I.A.; Agler, D.A.; Badano, L.P. Expert consensus for multimodality imaging evaluation of adult patients during and after cancer therapy: A report from the American Society of Echocardiography and the European Association of Cardiovascular Imaging. Eur. Heart J.–Cardiovasc. Imaging 2014, 15, 1063–1093. [Google Scholar] [CrossRef]
- Tzogani, K.; Skibeli, V.; Westgaard, I.; Dalhus, M.; Thoresen, H.; Slot, K.B.; Damkier, P.; Hofland, K.; Borregaard, J.; Ersbøll, J. The European Medicines Agency approval of axitinib (Inlyta) for the treatment of advanced renal cell carcinoma after failure of prior treatment with sunitinib or a cytokine: Summary of the scientific assessment of the committee for medicinal products for human use. Oncologist 2015, 20, 196–201. [Google Scholar]
- U.S. Food & Drug Administration. Novel Drug Approvals for 2018. Available online: https://www.fda.gov/drugs/new-drugs-fda-cders-new-molecular-entities-and-new-therapeutic-biological-products/novel-drug-approvals-2018 (accessed on 18 December 2023).
- Bergström, M.; Hargreaves, R.J.; Burns, H.D.; Goldberg, M.R.; Sciberras, D.; Reines, S.A.; Petty, K.J.; Ögren, M.; Antoni, G.; Långström, B. Human positron emission tomography studies of brain neurokinin 1 receptor occupancy by aprepitant. Biol. Psychiatry 2004, 55, 1007–1012. [Google Scholar] [CrossRef] [PubMed]
- Willett, C.G.; Boucher, Y.; Di Tomaso, E.; Duda, D.G.; Munn, L.L.; Tong, R.T.; Chung, D.C.; Sahani, D.V.; Kalva, S.P.; Kozin, S.V. Erratum: Direct evidence that the VEGF-specific antibody bevacizumab has antivascular effects in human rectal cancer (Nature Medicine (2004) 10 (145-147)). Nat. Med. 2004, 10, 649. [Google Scholar] [CrossRef]
- Avril, N.; Propper, D. Functional PET imaging in cancer drug development. Future Med. 2007, 3, 215–228. [Google Scholar] [CrossRef] [PubMed]
- O’connor, J.P.; Jackson, A.; Parker, G.J.; Roberts, C.; Jayson, G.C. Dynamic contrast-enhanced MRI in clinical trials of antivascular therapies. Nat. Rev. Clin. Oncol. 2012, 9, 167–177. [Google Scholar] [CrossRef] [PubMed]
- Lassau, N.; Chapotot, L.; Benatsou, B.; Vilgrain, V.; Kind, M.; Lacroix, J.; Cuinet, M.; Taieb, S.; Aziza, R.; Sarran, A. Standardization of dynamic contrast-enhanced ultrasound for the evaluation of antiangiogenic therapies: The French multicenter Support for Innovative and Expensive Techniques Study. Investig. Radiol. 2012, 47, 711–716. [Google Scholar] [CrossRef]
- van Elmpt, W.; De Ruysscher, D.; van der Salm, A.; Lakeman, A.; van der Stoep, J.; Emans, D.; Damen, E.; Öllers, M.; Sonke, J.-J.; Belderbos, J. The PET-boost randomised phase II dose-escalation trial in non-small cell lung cancer. Radiother. Oncol. 2012, 104, 67–71. [Google Scholar] [CrossRef] [PubMed]
- O’connor, J.P.; Aboagye, E.O.; Adams, J.E.; Aerts, H.J.; Barrington, S.F.; Beer, A.J.; Boellaard, R.; Bohndiek, S.E.; Brady, M.; Brown, G. Imaging biomarker roadmap for cancer studies. Nat. Rev. Clin. Oncol. 2017, 14, 169–186. [Google Scholar] [CrossRef] [PubMed]
- Gupta, R.; Naran, S.; Lallu, S.; Fauck, R. The diagnostic value of fine needle aspiration cytology (FNAC) in the assessment of palpable supraclavicular lymph nodes: A study of 218 cases. Cytopathology 2003, 14, 201–207. [Google Scholar] [CrossRef]
- Ben-Yehuda, D.; Polliack, A.; Okon, E.; Sherman, Y.; Fields, S.; Lebenshart, P.; Lotan, H.; Libson, E. Image-guided core-needle biopsy in malignant lymphoma: Experience with 100 patients that suggests the technique is reliable. J. Clin. Oncol. 1996, 14, 2431–2434. [Google Scholar] [CrossRef]
- Pappa, V.; Hussain, H.; Reznek, R.; Whelan, J.; Norton, A.; Wilson, A.; Love, S.; Lister, T.; Rohatiner, A. Role of image-guided core-needle biopsy in the management of patients with lymphoma. J. Clin. Oncol. 1996, 14, 2427–2430. [Google Scholar] [CrossRef]
- Campo, E.; Swerdlow, S.H.; Harris, N.L.; Pileri, S.; Stein, H.; Jaffe, E.S. The 2008 WHO classification of lymphoid neoplasms and beyond: Evolving concepts and practical applications. Blood J. Am. Soc. Hematol. 2011, 117, 5019–5032. [Google Scholar] [CrossRef] [PubMed]
- Tatli, S.; Gerbaudo, V.H.; Mamede, M.; Tuncali, K.; Shyn, P.B.; Silverman, S.G. Abdominal masses sampled at PET/CT-guided percutaneous biopsy: Initial experience with registration of prior PET/CT images. Radiology 2010, 256, 305–311. [Google Scholar] [CrossRef] [PubMed]
- Lawson, M.H.; Rassl, D.M.; Cummings, N.M.; Russell, R.; Morjaria, J.B.; Brenton, J.D.; Murphy, G.; Rintoul, R.C. Tissue banking of diagnostic lung cancer biopsies for extraction of high quality RNA. J. Thorac. Oncol. 2010, 5, 956–963. [Google Scholar] [CrossRef] [PubMed]
- de Kerviler, E.; Guermazi, A.; Zagdanski, A.M.; Meignin, V.; Gossot, D.; Oksenhendler, E.; Mariette, X.; Brice, P.; Frija, J. Image-guided core-needle biopsy in patients with suspected or recurrent lymphomas. Cancer 2000, 89, 647–652. [Google Scholar] [CrossRef] [PubMed]
- Demharter, J.; Müller, P.; Wagner, T.; Schlimok, G.; Haude, K.; Bohndorf, K. Percutaneous core-needle biopsy of enlarged lymph nodes in the diagnosis and subclassification of malignant lymphomas. Eur. Radiol. 2001, 11, 276–283. [Google Scholar] [CrossRef] [PubMed]
- Loubeyre, P.; McKee, T.; Copercini, M.; Rosset, A.; Dietrich, P. Diagnostic precision of image-guided multisampling core needle biopsy of suspected lymphomas in a primary care hospital. Br. J. Cancer 2009, 100, 1771–1776. [Google Scholar] [CrossRef] [PubMed]
- Amador-Ortiz, C.; Chen, L.; Hassan, A.; Frater, J.L.; Burack, R.; Nguyen, T.T.; Kreisel, F. Combined core needle biopsy and fine-needle aspiration with ancillary studies correlate highly with traditional techniques in the diagnosis of nodal-based lymphoma. Am. J. Clin. Pathol. 2011, 135, 516–524. [Google Scholar] [CrossRef] [PubMed]
- Shaw, J.; Rumball, E. Complications and local recurrence following lymphadenectomy. Br. J. Surg. 1990, 77, 760–764. [Google Scholar] [CrossRef]
- de Kerviler, E.; de Bazelaire, C.; Mounier, N.; Mathieu, O.; Brethon, B.; Brière, J.; Marolleau, J.-P.; Brice, P.; Gisselbrecht, C.; Frija, J. Image-guided core-needle biopsy of peripheral lymph nodes allows the diagnosis of lymphomas. Eur. Radiol. 2007, 17, 843–849. [Google Scholar] [CrossRef]
- Sklair-Levy, M.; Amir, G.; Spectre, G.; Lebensart, P.; Applbaum, Y.; Agid, R.; Lieberman, S.; Ben-Yehuda, D.; Sherman, Y.; Libson, E. Image-guided cutting-edge-needle biopsy of peripheral lymph nodes and superficial masses for the diagnosis of lymphoma. J. Comput. Assist. Tomogr. 2005, 29, 369–372. [Google Scholar] [CrossRef]
- Gezimati, M.; Singh, G. Advances in terahertz technology for cancer detection applications. Opt. Quantum Electron. 2023, 55, 151. [Google Scholar] [CrossRef] [PubMed]
- Kang, Z.; Li, Y.; Liu, J.; Chen, C.; Wu, W.; Chen, C.; Lv, X.; Liang, F. H-CNN combined with tissue Raman spectroscopy for cervical cancer detection. Spectrochim. Acta Part A Mol. Biomol. Spectrosc. 2023, 291, 122339. [Google Scholar] [CrossRef] [PubMed]
- Tangella, L.P.; Clark, M.E.; Gray, E.S. Resistance mechanisms to targeted therapy in BRAF-mutant melanoma-A mini review. Biochim. Biophys. Acta (BBA)-Gen. Subj. 2021, 1865, 129736. [Google Scholar] [CrossRef] [PubMed]
- Passaro, A.; Mok, T.; Peters, S.; Popat, S.; Ahn, M.-J.; De Marinis, F. Recent advances on the role of EGFR tyrosine kinase inhibitors in the management of NSCLC with uncommon, non exon 20 insertions, EGFR mutations. J. Thorac. Oncol. 2021, 16, 764–773. [Google Scholar] [CrossRef]
- Zenonos, K.; Kyprianou, K. RAS signaling pathways, mutations and their role in colorectal cancer. World J. Gastrointest. Oncol. 2013, 5, 97. [Google Scholar] [CrossRef]
- Pujol, P.; Barberis, M.; Beer, P.; Friedman, E.; Piulats, J.M.; Capoluongo, E.D.; Foncillas, J.G.; Ray-Coquard, I.; Penault-Llorca, F.; Foulkes, W.D. Clinical practice guidelines for BRCA1 and BRCA2 genetic testing. Eur. J. Cancer 2021, 146, 30–47. [Google Scholar] [CrossRef]
- Amisha, F.; Malik, P.; Saluja, P.; Gautam, N.; Patel, T.H.; Roy, A.M.; Singh, S.R.; Malapati, S.J. A Comprehensive Review on the Role of Human Epidermal Growth Factor Receptor 2 (HER2) as a Biomarker in Extra-Mammary and Extra-Gastric Cancers. Onco 2023, 3, 96–124. [Google Scholar] [CrossRef]
- Ma, R.; de Pennington, N.; Hofer, M.; Blesing, C.; Stacey, R. Diagnostic and prognostic markers in gliomas—An update. Br. J. Neurosurg. 2013, 27, 311–315. [Google Scholar] [CrossRef]
- Bernhardt, S.M.; Dasari, P.; Wrin, J.; Raymond, W.; Edwards, S.; Walsh, D.; Townsend, A.R.; Price, T.J.; Ingman, W.V. Discordance in 21-gene recurrence scores between paired breast cancer samples is inversely associated with patient age. Breast Cancer Res. 2020, 22, 90. [Google Scholar] [CrossRef]
- Haan, J.C.; Bhaskaran, R.; Ellappalayam, A.; Bijl, Y.; Griffioen, C.J.; Lujinovic, E.; Audeh, W.M.; Penault-Llorca, F.; Mittempergher, L.; Glas, A.M. MammaPrint and BluePrint comprehensively capture the cancer hallmarks in early-stage breast cancer patients. Genes Chromosomes Cancer 2022, 61, 148–160. [Google Scholar] [CrossRef]
- Wallden, B.; Storhoff, J.; Nielsen, T.; Dowidar, N.; Schaper, C.; Ferree, S.; Liu, S.; Leung, S.; Geiss, G.; Snider, J. Development and verification of the PAM50-based Prosigna breast cancer gene signature assay. BMC Med. Genom. 2015, 8, 54. [Google Scholar] [CrossRef] [PubMed]
- Jairath, N.K.; Dal Pra, A.; Vince, R., Jr.; Dess, R.T.; Jackson, W.C.; Tosoian, J.J.; McBride, S.M.; Zhao, S.G.; Berlin, A.; Mahal, B.A. A systematic review of the evidence for the decipher genomic classifier in prostate cancer. Eur. Urol. 2021, 79, 374–383. [Google Scholar] [CrossRef] [PubMed]
- Koc, M.A.; Wiles, T.A.; Weinhold, D.C.; Rightmyer, S.; Roder, J.; Asmellash, S.; Roder, H.; Georgantas, R.W., III. Molecular & Translational Biology of the Blood-Based VeriStrat® Proteomic Test Used in Cancer Immunotherapy Treatment Guidance. J. Mass Spectrom. Adv. Clin. Lab 2023, 30, 51–60. [Google Scholar] [PubMed]
- Marisa, L.; de Reyniès, A.; Duval, A.; Selves, J.; Gaub, M.P.; Vescovo, L.; Etienne-Grimaldi, M.-C.; Schiappa, R.; Guenot, D.; Ayadi, M. Gene expression classification of colon cancer into molecular subtypes: Characterization, validation, and prognostic value. PLoS Med. 2013, 10, e1001453. [Google Scholar] [CrossRef]
- Verma, M.; Kumar, D. Application of mitochondrial genome information in cancer epidemiology. Clin. Chim. Acta 2007, 383, 41–50. [Google Scholar] [CrossRef]
- Sidransky, D. Emerging molecular markers of cancer. Nat. Rev. Cancer 2002, 2, 210–219. [Google Scholar] [CrossRef]
- Leon, S.; Shapiro, B.; Sklaroff, D.; Yaros, M. Free DNA in the serum of cancer patients and the effect of therapy. Cancer Res. 1977, 37, 646–650. [Google Scholar]
- Verma, M.; Srivastava, S. Epigenetics in cancer: Implications for early detection and prevention. Lancet Oncol. 2002, 3, 755–763. [Google Scholar] [CrossRef]
- Verma, M.; Kagan, J.; Sidransky, D.; Srivastava, S. Proteomic analysis of cancer-cell mitochondria. Nat. Rev. Cancer 2003, 3, 789–795. [Google Scholar] [CrossRef]
- Duffy, M.J.; McDermott, E.W.; Crown, J. Blood-based biomarkers in breast cancer: From proteins to circulating tumor cells to circulating tumor DNA. Tumor Biol. 2018, 40, 1010428318776169. [Google Scholar] [CrossRef]
- Siegel, R.; DeSantis, C.; Jemal, A. Colorectal cancer statistics, 2014. CA Cancer J. Clin. 2014, 64, 104–117. [Google Scholar] [CrossRef] [PubMed]
- Siravegna, G.; Bardelli, A. Blood circulating tumor DNA for non-invasive genotyping of colon cancer patients. Mol. Oncol. 2016, 10, 475–480. [Google Scholar] [CrossRef] [PubMed]
- Spindler, K.-L.G.; Pallisgaard, N.; Vogelius, I.; Jakobsen, A. Quantitative cell-free DNA, KRAS, and BRAF mutations in plasma from patients with metastatic colorectal cancer during treatment with cetuximab and irinotecan. Clin. Cancer Res. 2012, 18, 1177–1185. [Google Scholar] [CrossRef] [PubMed]
- Jin, H.; Ma, Y.; Shen, Q.; Wang, X. Circulating methylated DNA as biomarkers for cancer detection. In Methylation: From DNA, RNA and Histones to Diseases and Treatment; InTech: London, UK, 2012; p. 137. [Google Scholar]
- Velculescu, V.E.; Zhang, L.; Vogelstein, B.; Kinzler, K.W. Serial analysis of gene expression. Science 1995, 270, 484–487. [Google Scholar] [CrossRef] [PubMed]
- Bartels, C.L.; Tsongalis, G.J. MicroRNAs: Novel biomarkers for human cancer. Clin. Chem. 2009, 55, 623–631. [Google Scholar] [CrossRef] [PubMed]
- Calin, G.A.; Croce, C.M. MicroRNA signatures in human cancers. Nat. Rev. Cancer 2006, 6, 857–866. [Google Scholar] [CrossRef]
- Lu, J.; Getz, G.; Miska, E.A.; Alvarez-Saavedra, E.; Lamb, J.; Peck, D.; Sweet-Cordero, A.; Ebert, B.L.; Mak, R.H.; Ferrando, A.A. MicroRNA expression profiles classify human cancers. Nature 2005, 435, 834–838. [Google Scholar] [CrossRef]
- Kasinski, A.L.; Slack, F.J. MicroRNAs en route to the clinic: Progress in validating and targeting microRNAs for cancer therapy. Nat. Rev. Cancer 2011, 11, 849–864. [Google Scholar] [CrossRef]
- Stahlhut, C.; Slack, F.J. MicroRNAs and the cancer phenotype: Profiling, signatures and clinical implications. Genome Med. 2013, 5, 111. [Google Scholar] [CrossRef]
- Manterola, L.; Guruceaga, E.; Pérez-Larraya, J.G.; González-Huarriz, M.; Jauregui, P.; Tejada, S.; Diez-Valle, R.; Segura, V.; Samprón, N.; Barrena, C. A small noncoding RNA signature found in exosomes of GBM patient serum as a diagnostic tool. Neuro-Oncol. 2014, 16, 520–527. [Google Scholar] [CrossRef]
- Calin, G.A.; Dumitru, C.D.; Shimizu, M.; Bichi, R.; Zupo, S.; Noch, E.; Aldler, H.; Rattan, S.; Keating, M.; Rai, K. Frequent deletions and down-regulation of micro-RNA genes miR15 and miR16 at 13q14 in chronic lymphocytic leukemia. Proc. Natl. Acad. Sci. USA 2002, 99, 15524–15529. [Google Scholar] [CrossRef] [PubMed]
- Abue, M.; Yokoyama, M.; Shibuya, R.; Tamai, K.; Yamaguchi, K.; Sato, I.; Tanaka, N.; Hamada, S.; Shimosegawa, T.; Sugamura, K. Circulating miR-483-3p and miR-21 is highly expressed in plasma of pancreatic cancer. Int. J. Oncol. 2015, 46, 539–547. [Google Scholar] [CrossRef] [PubMed]
- Humphreys, K.J.; McKinnon, R.A.; Michael, M.Z. miR-18a inhibits CDC42 and plays a tumour suppressor role in colorectal cancer cells. PLoS ONE 2014, 9, e112288. [Google Scholar] [CrossRef] [PubMed]
- Gulei, D.; Magdo, L.; Jurj, A.; Raduly, L.; Cojocneanu-Petric, R.; Moldovan, A.; Moldovan, C.; Florea, A.; Pasca, S.; Pop, L.-A. The silent healer: miR-205-5p up-regulation inhibits epithelial to mesenchymal transition in colon cancer cells by indirectly up-regulating E-cadherin expression. Cell Death Dis. 2018, 9, 66. [Google Scholar] [CrossRef] [PubMed]
- Chen, S.; Wang, Y.; Su, Y.; Zhang, L.; Zhang, M.; Li, X.; Wang, J.; Zhang, X. miR-205-5p/PTK7 axis is involved in the proliferation, migration and invasion of colorectal cancer cells. Mol. Med. Rep. 2018, 17, 6253–6260. [Google Scholar] [CrossRef] [PubMed]
- Liu, J.; Chen, Z.; Xiang, J.; Gu, X. MicroRNA-155 acts as a tumor suppressor in colorectal cancer by targeting CTHRC1 in vitro. Oncol. Lett. 2018, 15, 5561–5568. [Google Scholar] [CrossRef] [PubMed]
- Liu, N.; Jiang, F.; Han, X.-Y.; Li, M.; Chen, W.-J.; Liu, Q.-C.; Liao, C.-X.; Lv, Y.-F. MiRNA-155 promotes the invasion of colorectal cancer SW-480 cells through regulating the Wnt/β-catenin. Eur. Rev. Med. Pharmacol. Sci. 2018, 22, 101–109. [Google Scholar] [PubMed]
- Zhang, Y.; Guo, L.; Li, Y.; Feng, G.-H.; Teng, F.; Li, W.; Zhou, Q. MicroRNA-494 promotes cancer progression and targets adenomatous polyposis coli in colorectal cancer. Mol. Cancer 2018, 17, 1. [Google Scholar] [CrossRef]
- Lu, D.; Tang, L.; Zhuang, Y.; Zhao, P. miR-17-3P regulates the proliferation and survival of colon cancer cells by targeting Par4. Mol. Med. Rep. 2018, 17, 618–623. [Google Scholar] [CrossRef]
- Li, K.P.; Fang, Y.P.; Liao, J.Q.; Duan, J.D.; Feng, L.G.; Luo, X.Z.; Liang, Z.J. Upregulation of miR-598 promotes cell proliferation and cell cycle progression in human colorectal carcinoma by suppressing INPP5E expression. Mol. Med. Rep. 2018, 17, 2991–2997. [Google Scholar] [CrossRef]
- Sanger, H.L.; Klotz, G.; Riesner, D.; Gross, H.J.; Kleinschmidt, A.K. Viroids are single-stranded covalently closed circular RNA molecules existing as highly base-paired rod-like structures. Proc. Natl. Acad. Sci. USA 1976, 73, 3852–3856. [Google Scholar] [CrossRef] [PubMed]
- Memczak, S.; Jens, M.; Elefsinioti, A.; Torti, F.; Krueger, J.; Rybak, A.; Maier, L.; Mackowiak, S.D.; Gregersen, L.H.; Munschauer, M. Circular RNAs are a large class of animal RNAs with regulatory potency. Nature 2013, 495, 333–338. [Google Scholar] [CrossRef] [PubMed]
- Kristensen, L.S.; Andersen, M.S.; Stagsted, L.V.; Ebbesen, K.K.; Hansen, T.B.; Kjems, J. The biogenesis, biology and characterization of circular RNAs. Nat. Rev. Genet. 2019, 20, 675–691. [Google Scholar] [CrossRef] [PubMed]
- Zhu, X.; Wang, X.; Wei, S.; Chen, Y.; Chen, Y.; Fan, X.; Han, S.; Wu, G. hsa_circ_0013958: A Circular RNA and Potential Novel Biomarker for Lung Adenocarcinoma; Wiley Online Library: Hoboken, NJ, USA, 2017; Volume 284, pp. 2170–2182. [Google Scholar]
- Song, T.; Xu, A.; Zhang, Z.; Gao, F.; Zhao, L.; Chen, X.; Gao, J.; Kong, X. CircRNA hsa_circRNA_101996 increases cervical cancer proliferation and invasion through activating TPX2 expression by restraining miR-8075. J. Cell. Physiol. 2019, 234, 14296–14305. [Google Scholar] [CrossRef] [PubMed]
- Lee, C.-H.; Im, E.-J.; Moon, P.-G.; Baek, M.-C. Discovery of a diagnostic biomarker for colon cancer through proteomic profiling of small extracellular vesicles. BMC Cancer 2018, 18, 1058. [Google Scholar] [CrossRef] [PubMed]
- Herman, J.G.; Baylin, S.B. Gene silencing in cancer in association with promoter hypermethylation. N. Engl. J. Med. 2003, 349, 2042–2054. [Google Scholar] [CrossRef] [PubMed]
- Egger, G.; Liang, G.; Aparicio, A.; Jones, P.A. Epigenetics in human disease and prospects for epigenetic therapy. Nature 2004, 429, 457–463. [Google Scholar] [CrossRef] [PubMed]
- Belinsky, S.A. Gene-promoter hypermethylation as a biomarker in lung cancer. Nat. Rev. Cancer 2004, 4, 707–717. [Google Scholar] [CrossRef]
- De Caceres, I.I.; Battagli, C.; Esteller, M.; Herman, J.G.; Dulaimi, E.; Edelson, M.I.; Bergman, C.; Ehya, H.; Eisenberg, B.L.; Cairns, P. Tumor cell-specific BRCA1 and RASSF1A hypermethylation in serum, plasma, and peritoneal fluid from ovarian cancer patients. Cancer Res. 2004, 64, 6476–6481. [Google Scholar] [CrossRef]
- Cang, S.; Feng, J.; Konno, S.; Han, L.; Liu, K.; Sharma, S.C.; Choudhury, M.; Chiao, J. Deficient histone acetylation and excessive deacetylase activity as epigenomic marks of prostate cancer cells. Int. J. Oncol. 2009, 35, 1417–1422. [Google Scholar]
- Ribas, A.; Flaherty, K.T. BRAF targeted therapy changes the treatment paradigm in melanoma. Nat. Rev. Clin. Oncol. 2011, 8, 426–433. [Google Scholar] [CrossRef] [PubMed]
- Hellyer, J.A.; White, M.N.; Gardner, R.M.; Cunanan, K.; Padda, S.K.; Das, M.; Ramchandran, K.; Neal, J.W.; Wakelee, H.A. Impact of tumor suppressor gene co-mutations on differential response to EGFR TKI therapy in EGFR L858R and Exon 19 deletion lung cancer. Clin. Lung Cancer 2022, 23, 264–272. [Google Scholar] [CrossRef]
- Lievre, A.; Bachet, J.-B.; Le Corre, D.; Boige, V.; Landi, B.; Emile, J.-F.; Côté, J.-F.; Tomasic, G.; Penna, C.; Ducreux, M. KRAS mutation status is predictive of response to cetuximab therapy in colorectal cancer. Cancer Res. 2006, 66, 3992–3995. [Google Scholar] [CrossRef] [PubMed]
- Mirchia, K.; Richardson, T.E. Beyond IDH-mutation: Emerging molecular diagnostic and prognostic features in adult diffuse gliomas. Cancers 2020, 12, 1817. [Google Scholar] [CrossRef] [PubMed]
- Huang, T.-T.; Pennarun, N.; Cheng, Y.-H.; Horng, C.-F.; Lei, J.; Cheng, S.H.-C. Gene expression profiling in prognosis of distant recurrence in HR-positive and HER2-negative breast cancer patients. Oncotarget 2018, 9, 23173. [Google Scholar] [CrossRef] [PubMed]
- Soliman, H.; Shah, V.; Srkalovic, G.; Mahtani, R.; Levine, E.; Mavromatis, B.; Srinivasiah, J.; Kassar, M.; Gabordi, R.; Qamar, R. MammaPrint guides treatment decisions in breast Cancer: Results of the IMPACt trial. BMC Cancer 2020, 20, 81. [Google Scholar] [CrossRef]
- Marrone, M.; Potosky, A.L.; Penson, D.; Freedman, A.N. A 22 gene-expression assay, Decipher® (GenomeDx Biosciences) to predict five-year risk of metastatic prostate cancer in men treated with radical prostatectomy. PLoS Curr. 2015, 7, ecurrents.eogt.761b81608129ed61b0b48d42c04f92a4. [Google Scholar] [CrossRef] [PubMed]
- Aleksakhina, S.N.; Imyanitov, E.N. Cancer therapy guided by mutation tests: Current status and perspectives. Int. J. Mol. Sci. 2021, 22, 10931. [Google Scholar] [CrossRef]
- Aarnio, M.; Sankila, R.; Pukkala, E.; Salovaara, R.; Aaltonen, L.A.; de la Chapelle, A.; Peltomäki, P.; Mecklin, J.P.; Järvinen, H.J. Cancer risk in mutation carriers of DNA-mismatch-repair genes. Int. J. Cancer 1999, 81, 214–218. [Google Scholar] [CrossRef]
- Haber, D.A.; Velculescu, V.E. Blood-based analyses of cancer: Circulating tumor cells and circulating tumor DNA. Cancer Discov. 2014, 4, 650–661. [Google Scholar] [CrossRef]
- Farazi, T.A.; Spitzer, J.I.; Morozov, P.; Tuschl, T. miRNAs in human cancer. J. Pathol. 2011, 223, 102–115. [Google Scholar] [CrossRef]
- Chen, Y.; Wei, S.; Wang, X.; Zhu, X.; Han, S. Progress in research on the role of circular RNAs in lung cancer. World J. Surg. Oncol. 2018, 16, 215. [Google Scholar] [CrossRef]
- Natesh, J.; Penta, D.; Meeran, S.M. Epigenetics in precision medicine of breast cancer. In Epigenetics in Precision Medicine; Elsevier: Amsterdam, The Netherlands, 2022; pp. 43–67. [Google Scholar]
- Turner, B.M. Histone acetylation and an epigenetic code. Bioessays 2000, 22, 836–845. [Google Scholar] [CrossRef]
- Anderson, N.L.; Anderson, N.G. The human plasma proteome: History, character, and diagnostic prospects. Mol. Cell. Proteom. 2002, 1, 845–867. [Google Scholar] [CrossRef]
- Colantonio, D.A.; Chan, D.W. The clinical application of proteomics. Clin. Chim. Acta 2005, 357, 151–158. [Google Scholar] [CrossRef]
- Jimenez-Luna, C.; Torres, C.; Ortiz, R.; Dieguez, C.; Martinez-Galan, J.; Melguizo, C.; Prados, J.C.; Caba, O. Proteomic biomarkers in body fluids associated with pancreatic cancer. Oncotarget 2018, 9, 16573. [Google Scholar] [CrossRef]
- Sandfeld-Paulsen, B.; Jakobsen, K.R.; Bæk, R.; Folkersen, B.H.; Rasmussen, T.R.; Meldgaard, P.; Varming, K.; Jørgensen, M.M.; Sorensen, B.S. Exosomal proteins as diagnostic biomarkers in lung cancer. J. Thorac. Oncol. 2016, 11, 1701–1710. [Google Scholar] [CrossRef]
- Nedjadi, T.; Benabdelkamal, H.; Albarakati, N.; Masood, A.; Al-Sayyad, A.; Alfadda, A.A.; Alanazi, I.O.; Al-Ammari, A.; Al-Maghrabi, J. Circulating proteomic signature for detection of biomarkers in bladder cancer patients. Sci. Rep. 2020, 10, 10999. [Google Scholar] [CrossRef]
- Zhang, J.; Chen, G.; Zhang, P.; Zhang, J.; Li, X.; Gan, D.n.; Cao, X.; Han, M.; Du, H.; Ye, Y.A. The threshold of alpha-fetoprotein (AFP) for the diagnosis of hepatocellular carcinoma: A systematic review and meta-analysis. PLoS ONE 2020, 15, e0228857. [Google Scholar] [CrossRef]
- Asad-Ur-Rahman, F.; Saif, M.W.; Rahman, A.U. Elevated level of serum carcinoembryonic antigen (CEA) and search for a malignancy: A case report. Cureus 2016, 8, e648. [Google Scholar] [CrossRef]
- Stephan, C.; Stroebel, G.; Heinau, M.; Lenz, A.; Roemer, A.; Lein, M.; Schnorr, D.; Loening, S.A.; Jung, K. The ratio of prostate-specific antigen (PSA) to prostate volume (PSA density) as a parameter to improve the detection of prostate carcinoma in PSA values in the range of <4 ng/mL. Cancer Interdiscip. Int. J. Am. Cancer Soc. 2005, 104, 993–1003. [Google Scholar]
- Halila, H.; Stenman, U.H.; Seppälä, M. Ovarian cancer antigen CA 125 levels in pelvic inflammatory disease and pregnancy. Cancer 1986, 57, 1327–1329. [Google Scholar] [CrossRef] [PubMed]
- Duffy, M. CA 19-9 as a marker for gastrointestinal cancers: A review. Ann. Clin. Biochem. 1998, 35, 364–370. [Google Scholar] [CrossRef] [PubMed]
- Duffy, M.; Shering, S.; Sherry, F.; McDermott, E.; O’higgins, N. CA 15–3: A prognostic marker in breast cancer. Int. J. Biol. Markers 2000, 15, 330–333. [Google Scholar] [CrossRef] [PubMed]
- Lin, D.C.; Genzen, J.R. Concordance analysis of paired cancer antigen (CA) 15-3 and 27.29 testing. Breast Cancer Res. Treat. 2018, 167, 269–276. [Google Scholar] [CrossRef] [PubMed]
- Englund, A.T.; Geffner, M.E.; Nagel, R.A.; Lippe, B.M.; Braunstein, G.D. Pediatric Germ Cell and Human Chorionic Gonadotropin—Producing Tumors: Clinical and Laboratory Features. Am. J. Dis. Child. 1991, 145, 1294–1297. [Google Scholar] [CrossRef] [PubMed]
- Lee, S.; de Boer, W.B.; Fermoyle, S.; Platten, M.; Kumarasinghe, M.P. Human epidermal growth factor receptor 2 testing in gastric carcinoma: Issues related to heterogeneity in biopsies and resections. Histopathology 2011, 59, 832–840. [Google Scholar] [CrossRef]
- Haikal, A.; Borba, E.; Khaja, T.; Doolittle, G.; Schmidt, P. Nivolumab-induced new-onset seronegative rheumatoid arthritis in a patient with advanced metastatic melanoma: A case report and literature review. Avicenna J. Med. 2018, 8, 34–36. [Google Scholar] [CrossRef]
- Robert, C.; Ribas, A.; Wolchok, J.D.; Hodi, F.S.; Hamid, O.; Kefford, R.; Weber, J.S.; Joshua, A.M.; Hwu, W.-J.; Gangadhar, T.C. Anti-programmed-death-receptor-1 treatment with pembrolizumab in ipilimumab-refractory advanced melanoma: A randomised dose-comparison cohort of a phase 1 trial. Lancet 2014, 384, 1109–1117. [Google Scholar] [CrossRef]
- Mansh, M. Ipilimumab and cancer immunotherapy: A new hope for advanced stage melanoma. Yale J. Biol. Med. 2011, 84, 381. [Google Scholar]
- Vaddepally, R.K.; Kharel, P.; Pandey, R.; Garje, R.; Chandra, A.B. Review of indications of FDA-approved immune checkpoint inhibitors per NCCN guidelines with the level of evidence. Cancers 2020, 12, 738. [Google Scholar] [CrossRef] [PubMed]
- Xia, L.; Liu, Y.; Wang, Y. PD-1/PD-L1 blockade therapy in advanced non-small-cell lung cancer: Current status and future directions. Oncologist 2019, 24, S31–S41. [Google Scholar] [CrossRef] [PubMed]
- Pei, R.; Shi, Y.; Lv, S.; Dai, T.; Zhang, F.; Liu, S.; Wu, B. Nivolumab vs pembrolizumab for treatment of US patients with platinum-refractory recurrent or metastatic head and neck squamous cell carcinoma: A network meta-analysis and cost-effectiveness analysis. JAMA Netw. Open 2021, 4, e218065. [Google Scholar] [CrossRef] [PubMed]
- Patel, R.; Bock, M.; Polotti, C.F.; Elsamra, S. Pharmacokinetic drug evaluation of atezolizumab for the treatment of locally advanced or metastatic urothelial carcinoma. Expert Opin. Drug Metab. Toxicol. 2017, 13, 225–232. [Google Scholar] [CrossRef] [PubMed]
- Chau, V.; Bilusic, M. Pembrolizumab in combination with axitinib as first-line treatment for patients with renal cell carcinoma (RCC): Evidence to date. Cancer Manag. Res. 2020, 12, 7321–7330. [Google Scholar] [CrossRef] [PubMed]
- Prasad, V.; Kaestner, V. Nivolumab and pembrolizumab: Monoclonal antibodies against programmed cell death-1 (PD-1) that are interchangeable. Semin. Oncol. 2017, 44, 132–135. [Google Scholar] [CrossRef] [PubMed]
- Casak, S.J.; Marcus, L.; Fashoyin-Aje, L.; Mushti, S.L.; Cheng, J.; Shen, Y.-L.; Pierce, W.F.; Her, L.; Goldberg, K.B.; Theoret, M.R. FDA approval summary: Pembrolizumab for the first-line treatment of patients with MSI-H/dMMR advanced unresectable or metastatic colorectal carcinoma. Clin. Cancer Res. 2021, 27, 4680–4684. [Google Scholar] [CrossRef] [PubMed]
- Pavlova, N.N.; Thompson, C.B. The emerging hallmarks of cancer metabolism. Cell Metab. 2016, 23, 27–47. [Google Scholar] [CrossRef]
- Nava, G.M.; Madrigal Perez, L.A. Metabolic profile of the Warburg effect as a tool for molecular prognosis and diagnosis of cancer. Expert Rev. Mol. Diagn. 2022, 22, 439–447. [Google Scholar] [CrossRef]
- Cardaci, S.; Ciriolo, M.R. TCA cycle defects and cancer: When metabolism tunes redox state. Int. J. Cell Biol. 2012, 2012, 161837. [Google Scholar] [CrossRef]
- Minton, D.R.; Fu, L.; Chen, Q.; Robinson, B.D.; Gross, S.S.; Nanus, D.M.; Gudas, L.J. Analyses of the transcriptome and metabolome demonstrate that HIF1α mediates altered tumor metabolism in clear cell renal cell carcinoma. PLoS ONE 2015, 10, e0120649. [Google Scholar] [CrossRef]
- Mori, N.; Wildes, F.; Takagi, T.; Glunde, K.; Bhujwalla, Z.M. The tumor microenvironment modulates choline and lipid metabolism. Front. Oncol. 2016, 6, 262. [Google Scholar] [CrossRef] [PubMed]
- Wu, X.; Qin, L.; Fako, V.; Zhang, J.-T. Molecular mechanisms of fatty acid synthase (FASN)-mediated resistance to anti-cancer treatments. Adv. Biol. Regul. 2014, 54, 214–221. [Google Scholar] [CrossRef] [PubMed]
- Lieu, E.L.; Nguyen, T.; Rhyne, S.; Kim, J. Amino acids in cancer. Exp. Mol. Med. 2020, 52, 15–30. [Google Scholar] [CrossRef] [PubMed]
- Aird, K.M.; Zhang, R. Nucleotide metabolism, oncogene-induced senescence and cancer. Cancer Lett. 2015, 356, 204–210. [Google Scholar] [CrossRef] [PubMed]
- Mankoff, D.A.; Eary, J.F.; Link, J.M.; Muzi, M.; Rajendran, J.G.; Spence, A.M.; Krohn, K.A. Tumor-specific positron emission tomography imaging in patients:[18F] fluorodeoxyglucose and beyond. Clin. Cancer Res. 2007, 13, 3460–3469. [Google Scholar] [CrossRef] [PubMed]
- Glunde, K.; Artemov, D.; Penet, M.-F.; Jacobs, M.A.; Bhujwalla, Z.M. Magnetic resonance spectroscopy in metabolic and molecular imaging and diagnosis of cancer. Chem. Rev. 2010, 110, 3043–3059. [Google Scholar] [CrossRef]
- Kurhanewicz, J.; Vigneron, D.B.; Ardenkjaer-Larsen, J.H.; Bankson, J.A.; Brindle, K.; Cunningham, C.H.; Gallagher, F.A.; Keshari, K.R.; Kjaer, A.; Laustsen, C. Hyperpolarized 13C MRI: Path to clinical translation in oncology. Neoplasia 2019, 21, 1–16. [Google Scholar] [CrossRef]
- Vallabhajosula, S.; Killeen, R.P.; Osborne, J.R. Altered biodistribution of radiopharmaceuticals: Role of radiochemical/pharmaceutical purity, physiological, and pharmacologic factors. Semin. Nucl. Med. 2010, 40, 220–241. [Google Scholar] [CrossRef]
- Barrett, T.; Brechbiel, M.; Bernardo, M.; Choyke, P.L. MRI of tumor angiogenesis. J. Magn. Reson. Imaging Off. J. Int. Soc. Magn. Reson. Med. 2007, 26, 235–249. [Google Scholar] [CrossRef]
- Koyama, Y.; Barrett, T.; Hama, Y.; Ravizzini, G.; Choyke, P.L.; Kobayashi, H. In vivo molecular imaging to diagnose and subtype tumors through receptor-targeted optically labeled monoclonal antibodies. Neoplasia 2007, 9, 1021–1029. [Google Scholar] [CrossRef] [PubMed]
- Xiao, Y.-D.; Paudel, R.; Liu, J.; Ma, C.; Zhang, Z.-S.; Zhou, S.-K. MRI contrast agents: Classification and application. Int. J. Mol. Med. 2016, 38, 1319–1326. [Google Scholar] [CrossRef] [PubMed]
- Barwick, T.; Bencherif, B.; Mountz, J.M.; Avril, N. Molecular PET and PET/CT imaging of tumour cell proliferation using F-18 fluoro-L-thymidine: A comprehensive evaluation. Nucl. Med. Commun. 2009, 30, 908–917. [Google Scholar] [CrossRef] [PubMed]
- Klibanov, A.L. Ligand-carrying gas-filled microbubbles: Ultrasound contrast agents for targeted molecular imaging. Bioconjugate Chem. 2005, 16, 9–17. [Google Scholar] [CrossRef] [PubMed]
- Bu, L.; Shen, B.; Cheng, Z. Fluorescent imaging of cancerous tissues for targeted surgery. Adv. Drug Deliv. Rev. 2014, 76, 21–38. [Google Scholar] [CrossRef] [PubMed]
- Ring, A.; Smith, I.E.; Dowsett, M. Circulating tumour cells in breast cancer. Lancet Oncol. 2004, 5, 79–88. [Google Scholar] [CrossRef]
- Cristofanilli, M.; Budd, G.; Ellis, M.; Stopeck, A.; Matera, J.; Miller, M.; Doyle, G.; Allard, W.; Terstappen, L.; Hayes, D. Presence of circulating tumor cells (CTC) in metastatic breast cancer (MBC) predicts rapid progression and poor prognosis. J. Clin. Oncol. 2005, 23, 524. [Google Scholar] [CrossRef]
- Schulze, K.; Gasch, C.; Staufer, K.; Nashan, B.; Lohse, A.W.; Pantel, K.; Riethdorf, S.; Wege, H. Presence of EpCAM-positive circulating tumor cells as biomarker for systemic disease strongly correlates to survival in patients with hepatocellular carcinoma. Int. J. Cancer 2013, 133, 2165–2171. [Google Scholar] [CrossRef]
- Lee, J.S.; Magbanua, M.J.M.; Park, J.W. Circulating tumor cells in breast cancer: Applications in personalized medicine. Breast Cancer Res. Treat. 2016, 160, 411–424. [Google Scholar] [CrossRef]
- Pak, S.; Suh, Y.S.; Lee, D.-E.; Kim, S.H.; Joung, J.Y.; Park, W.S.; Lee, S.-J.; Lee, K.H. Association between postoperative detection of circulating tumor cells and recurrence in patients with prostate cancer. J. Urol. 2020, 203, 1128–1134. [Google Scholar] [CrossRef]
- Ross, K.; Pailler, E.; Faugeroux, V.; Taylor, M.; Oulhen, M.; Auger, N.; Planchard, D.; Soria, J.-C.; Lindsay, C.R.; Besse, B. The potential diagnostic power of circulating tumor cell analysis for non-small-cell lung cancer. Expert Rev. Mol. Diagn. 2015, 15, 1605–1629. [Google Scholar] [CrossRef] [PubMed]
- Ortiz, V.; Yu, M. Analyzing circulating tumor cells one at a time. Trends Cell Biol. 2018, 28, 764–775. [Google Scholar] [CrossRef] [PubMed]
- Galon, J.; Costes, A.; Sanchez-Cabo, F.; Kirilovsky, A.; Mlecnik, B.; Lagorce-Pagès, C.; Tosolini, M.; Camus, M.; Berger, A.; Wind, P. Type, density, and location of immune cells within human colorectal tumors predict clinical outcome. Science 2006, 313, 1960–1964. [Google Scholar] [CrossRef] [PubMed]
- Halama, N.; Braun, M.; Kahlert, C.; Spille, A.; Quack, C.; Rahbari, N.; Koch, M.; Weitz, J.; Kloor, M.; Zoernig, I. Natural killer cells are scarce in colorectal carcinoma tissue despite high levels of chemokines and cytokines. Clin. Cancer Res. 2011, 17, 678–689. [Google Scholar] [CrossRef] [PubMed]
- Mlecnik, B.; Bindea, G.; Angell, H.K.; Maby, P.; Angelova, M.; Tougeron, D.; Church, S.E.; Lafontaine, L.; Fischer, M.; Fredriksen, T. Integrative analyses of colorectal cancer show immunoscore is a stronger predictor of patient survival than microsatellite instability. Immunity 2016, 44, 698–711. [Google Scholar] [CrossRef] [PubMed]
- Fridman, W.H.; Zitvogel, L.; Sautès–Fridman, C.; Kroemer, G. The immune contexture in cancer prognosis and treatment. Nat. Rev. Clin. Oncol. 2017, 14, 717–734. [Google Scholar] [CrossRef] [PubMed]
- Kather, J.N.; Poleszczuk, J.; Suarez-Carmona, M.; Krisam, J.; Charoentong, P.; Valous, N.A.; Weis, C.-A.; Tavernar, L.; Leiss, F.; Herpel, E. In silico modeling of immunotherapy and stroma-targeting therapies in human colorectal cancer. Cancer Res. 2017, 77, 6442–6452. [Google Scholar] [CrossRef] [PubMed]
- Fridman, W.H.; Pagès, F.; Sautès-Fridman, C.; Galon, J. The immune contexture in human tumours: Impact on clinical outcome. Nat. Rev. Cancer 2012, 12, 298–306. [Google Scholar] [CrossRef]
- Kather, J.N.; Suarez-Carmona, M.; Charoentong, P.; Weis, C.-A.; Hirsch, D.; Bankhead, P.; Horning, M.; Ferber, D.; Kel, I.; Herpel, E. Topography of cancer-associated immune cells in human solid tumors. Elife 2018, 7, e36967. [Google Scholar] [CrossRef]
- Galon, J.; Mlecnik, B.; Bindea, G.; Angell, H.K.; Berger, A.; Lagorce, C.; Lugli, A.; Zlobec, I.; Hartmann, A.; Bifulco, C. Towards the introduction of the ‘Immunoscore’in the classification of malignant tumours. J. Pathol. 2014, 232, 199–209. [Google Scholar] [CrossRef]
- Savas, P.; Salgado, R.; Denkert, C.; Sotiriou, C.; Darcy, P.K.; Smyth, M.J.; Loi, S. Clinical relevance of host immunity in breast cancer: From TILs to the clinic. Nat. Rev. Clin. Oncol. 2016, 13, 228–241. [Google Scholar] [CrossRef] [PubMed]
- Liyanage, U.K.; Moore, T.T.; Joo, H.-G.; Tanaka, Y.; Herrmann, V.; Doherty, G.; Drebin, J.A.; Strasberg, S.M.; Eberlein, T.J.; Goedegebuure, P.S. Prevalence of regulatory T cells is increased in peripheral blood and tumor microenvironment of patients with pancreas or breast adenocarcinoma. J. Immunol. 2002, 169, 2756–2761. [Google Scholar] [CrossRef] [PubMed]
- Siddiqui, S.A.; Frigola, X.; Bonne-Annee, S.; Mercader, M.; Kuntz, S.M.; Krambeck, A.E.; Sengupta, S.; Dong, H.; Cheville, J.C.; Lohse, C.M. Tumor-infiltrating Foxp3− CD4+ CD25+ T cells predict poor survival in renal cell carcinoma. Clin. Cancer Res. 2007, 13, 2075–2081. [Google Scholar] [CrossRef]
- Woo, E.Y.; Yeh, H.; Chu, C.S.; Schlienger, K.; Carroll, R.G.; Riley, J.L.; Kaiser, L.R.; June, C.H. Cutting edge: Regulatory T cells from lung cancer patients directly inhibit autologous T cell proliferation. J. Immunol. 2002, 168, 4272–4276. [Google Scholar] [CrossRef] [PubMed]
- Curiel, T.J.; Coukos, G.; Zou, L.; Alvarez, X.; Cheng, P.; Mottram, P.; Evdemon-Hogan, M.; Conejo-Garcia, J.R.; Zhang, L.; Burow, M. Specific recruitment of regulatory T cells in ovarian carcinoma fosters immune privilege and predicts reduced survival. Nat. Med. 2004, 10, 942–949. [Google Scholar] [CrossRef] [PubMed]
- Olkhanud, P.B.; Baatar, D.; Bodogai, M.; Hakim, F.; Gress, R.; Anderson, R.L.; Deng, J.; Xu, M.; Briest, S.; Biragyn, A. Breast cancer lung metastasis requires expression of chemokine receptor CCR4 and regulatory T cells. Cancer Res. 2009, 69, 5996–6004. [Google Scholar] [CrossRef] [PubMed]
- Xue, D.; Xia, T.; Wang, J.; Chong, M.; Wang, S.; Zhang, C. Role of regulatory T cells and CD8+ T lymphocytes in the dissemination of circulating tumor cells in primary invasive breast cancer. Oncol. Lett. 2018, 16, 3045–3053. [Google Scholar] [CrossRef]
- Clarke, M.F.; Dick, J.E.; Dirks, P.B.; Eaves, C.J.; Jamieson, C.H.; Jones, D.L.; Visvader, J.; Weissman, I.L.; Wahl, G.M. Cancer stem cells—Perspectives on current status and future directions: AACR Workshop on cancer stem cells. Cancer Res. 2006, 66, 9339–9344. [Google Scholar] [CrossRef]
- Clarke, M.F.; Fuller, M. Stem cells and cancer: Two faces of eve. Cell 2006, 124, 1111–1115. [Google Scholar] [CrossRef]
- Takaishi, S.; Okumura, T.; Wang, T.C. Gastric cancer stem cells. J. Clin. Oncol. Off. J. Am. Soc. Clin. Oncol. 2008, 26, 2876. [Google Scholar] [CrossRef]
- Xin, H.-W.; Hari, D.M.; Mullinax, J.E.; Ambe, C.M.; Koizumi, T.; Ray, S.; Anderson, A.J.; Wiegand, G.W.; Garfield, S.H.; Thorgeirsson, S.S. Tumor-initiating label-retaining cancer cells in human gastrointestinal cancers undergo asymmetric cell division. Stem Cells 2012, 30, 591–598. [Google Scholar] [CrossRef] [PubMed]
- Marquardt, J.U.; Thorgeirsson, S.S. Stem cells in hepatocarcinogenesis: Evidence from genomic data. Semin. Liver Dis. 2010, 30, 26–34. [Google Scholar] [CrossRef] [PubMed]
- Langan, R.C.; Mullinax, J.E.; Ray, S.; Raiji, M.T.; Schaub, N.; Xin, H.-W.; Koizumi, T.; Steinberg, S.M.; Anderson, A.; Wiegand, G. A pilot study assessing the potential role of non-CD133 colorectal cancer stem cells as biomarkers. J. Cancer 2012, 3, 231. [Google Scholar] [CrossRef] [PubMed]
- Papailiou, J.; Bramis, K.J.; Gazouli, M.; Theodoropoulos, G. Stem cells in colon cancer. A new era in cancer theory begins. Int. J. Color. Dis. 2011, 26, 1–11. [Google Scholar] [CrossRef] [PubMed]
- Lim, S.-C.; Oh, S.-H. The role of CD24 in various human epithelial neoplasias. Pathol.-Res. Pract. 2005, 201, 479–486. [Google Scholar] [CrossRef] [PubMed]
- Weichert, W.; Denkert, C.; Burkhardt, M.; Gansukh, T.; Bellach, J.; Altevogt, P.; Dietel, M.; Kristiansen, G. Cytoplasmic CD24 expression in colorectal cancer independently correlates with shortened patient survival. Clin. Cancer Res. 2005, 11, 6574–6581. [Google Scholar] [CrossRef] [PubMed]
- Akamine, T.; Tagawa, T.; Ijichi, K.; Toyokawa, G.; Takamori, S.; Hirai, F.; Okamoto, T.; Oda, Y.; Maehara, Y. The significance of CD44 variant 9 in resected lung adenocarcinoma: Correlation with pathological early-stage and EGFR mutation. Ann. Surg. Oncol. 2019, 26, 1544–1551. [Google Scholar] [CrossRef]
- Lau, W.M.; Teng, E.; Chong, H.S.; Lopez, K.A.P.; Tay, A.Y.L.; Salto-Tellez, M.; Shabbir, A.; So, J.B.Y.; Chan, S.L. CD44v8-10 is a cancer-specific marker for gastric cancer stem cells. Cancer Res. 2014, 74, 2630–2641. [Google Scholar] [CrossRef]
- Li, L.; Du, Y.; Kong, X.; Li, Z.; Jia, Z.; Cui, J.; Gao, J.; Wang, G.; Xie, K. Lamin B1 is a novel therapeutic target of betulinic acid in pancreatic cancer. Clin. Cancer Res. 2013, 19, 4651–4661. [Google Scholar] [CrossRef]
- Machiels, B.M.; Ramaekers, F.C.; Kuijpers, H.J.; Groenewoud, J.S.; Oosterhuis, J.W.; Looijenga, L.H. Nuclear lamin expression in normal testis and testicular germ cell tumours of adolescents and adults. J. Pathol. J. Pathol. Soc. Great Br. Irel. 1997, 182, 197–204. [Google Scholar] [CrossRef]
- Gatti, G.; Vilardo, L.; Musa, C.; Di Pietro, C.; Bonaventura, F.; Scavizzi, F.; Torcinaro, A.; Bucci, B.; Saporito, R.; Arisi, I. Role of Lamin A/C as Candidate Biomarker of Aggressiveness and Tumorigenicity in Glioblastoma Multiforme. Biomedicines 2021, 9, 1343. [Google Scholar] [CrossRef] [PubMed]
- Shimi, T.; Pfleghaar, K.; Kojima, S.-i.; Pack, C.-G.; Solovei, I.; Goldman, A.E.; Adam, S.A.; Shumaker, D.K.; Kinjo, M.; Cremer, T. The A-and B-type nuclear lamin networks: Microdomains involved in chromatin organization and transcription. Genes Dev. 2008, 22, 3409–3421. [Google Scholar] [CrossRef] [PubMed]
- Burke, B.; Stewart, C.L. The nuclear lamins: Flexibility in function. Nat. Rev. Mol. Cell Biol. 2013, 14, 13–24. [Google Scholar] [CrossRef] [PubMed]
- Meng, E.; Mitra, A.; Tripathi, K.; Finan, M.A.; Scalici, J.; McClellan, S.; da Silva, L.M.; Reed, E.; Shevde, L.A.; Palle, K. ALDH1A1 maintains ovarian cancer stem cell-like properties by altered regulation of cell cycle checkpoint and DNA repair network signaling. PLoS ONE 2014, 9, e107142. [Google Scholar] [CrossRef] [PubMed]
- Tripathi, K.; Mani, C.; Barnett, R.; Nalluri, S.; Bachaboina, L.; Rocconi, R.P.; Athar, M.; Owen, L.B.; Palle, K. Gli1 protein regulates the S-phase checkpoint in tumor cells via Bid protein, and its inhibition sensitizes to DNA topoisomerase 1 inhibitors. J. Biol. Chem. 2014, 289, 31513–31525. [Google Scholar] [CrossRef]
- Willis, N.D.; Cox, T.R.; Rahman-Casans, S.F.; Smits, K.; Przyborski, S.A.; van den Brandt, P.; van Engeland, M.; Weijenberg, M.; Wilson, R.G.; de Bruïne, A. Lamin A/C is a risk biomarker in colorectal cancer. PLoS ONE 2008, 3, e2988. [Google Scholar] [CrossRef]
- Wazir, U.; Ahmed, M.H.; Bridger, J.M.; Harvey, A.; Jiang, W.G.; Sharma, A.K.; Mokbel, K. The clinicopathological significance of lamin A/C, lamin B1 and lamin B receptor mRNA expression in human breast cancer. Cell. Mol. Biol. Lett. 2013, 18, 595–611. [Google Scholar] [CrossRef]
- Capo-chichi, C.D.; Cai, K.Q.; Smedberg, J.; Ganjei-Azar, P.; Godwin, A.K.; Xu, X.-X. Loss of A-type lamin expression compromises nuclear envelope integrity in breast cancer. Chin. J. Cancer 2011, 30, 415. [Google Scholar] [CrossRef]
- Brodeur, G.M. Neuroblastoma: Biological insights into a clinical enigma. Nat. Rev. Cancer 2003, 3, 203–216. [Google Scholar] [CrossRef]
- Maresca, G.; Natoli, M.; Nardella, M.; Arisi, I.; Trisciuoglio, D.; Desideri, M.; Brandi, R.; D’Aguanno, S.; Nicotra, M.R.; D’Onofrio, M. LMNA knock-down affects differentiation and progression of human neuroblastoma cells. PLoS ONE 2012, 7, e45513. [Google Scholar] [CrossRef]
- Moss, S.; Krivosheyev, V.; De Souza, A.; Chin, K.; Gaetz, H.; Chaudhary, N.; Worman, H.; Holt, P. Decreased and aberrant nuclear lamin expression in gastrointestinal tract neoplasms. Gut 1999, 45, 723–729. [Google Scholar] [CrossRef] [PubMed]
- Barboro, P.; Repaci, E.; D’Arrigo, C.; Balbi, C. The role of nuclear matrix proteins binding to matrix attachment regions (Mars) in prostate cancer cell differentiation. PLoS ONE 2012, 7, e40617. [Google Scholar] [CrossRef] [PubMed]
- Wong, K.-F.; Luk, J.M. Discovery of lamin B1 and vimentin as circulating biomarkers for early hepatocellular carcinoma. In Liver Proteomics: Methods and Protocols; Springer: Berlin/Heidelberg, Germany, 2012; pp. 295–310. [Google Scholar]
- Lu, Q.Y.; Yang, Y.; Jin, Y.S.; Zhang, Z.F.; Heber, D.; Li, F.P.; Dubinett, S.M.; Sondej, M.A.; Loo, J.A.; Rao, J.Y. Effects of green tea extract on lung cancer A549 cells: Proteomic identification of proteins associated with cell migration. Proteomics 2009, 9, 757–767. [Google Scholar] [CrossRef] [PubMed]
- Tilli, C.; Ramaekers, F.; Broers, J.; Hutchison, C.; Neumann, H. Lamin expression in normal human skin, actinic keratosis, squamous cell carcinoma and basal cell carcinoma. Br. J. Dermatol. 2003, 148, 102–109. [Google Scholar] [CrossRef] [PubMed]
- Dings, R.P.; Miller, M.C.; Griffin, R.J.; Mayo, K.H. Galectins as molecular targets for therapeutic intervention. Int. J. Mol. Sci. 2018, 19, 905. [Google Scholar] [CrossRef] [PubMed]
- Zhang, H.; Liang, X.; Duan, C.; Liu, C.; Zhao, Z. Galectin-3 as a marker and potential therapeutic target in breast cancer. PLoS ONE 2014, 9, e103482. [Google Scholar] [CrossRef]
- Koo, J.S.; Jung, W. Clinicopathlogic and immunohistochemical characteristics of triple negative invasive lobular carcinoma. Yonsei Med. J. 2011, 52, 89–97. [Google Scholar] [CrossRef] [PubMed]
- Balan, V.; Wang, Y.; Nangia-Makker, P.; Kho, D.; Bajaj, M.; Smith, D.; Heilbrun, L.; Raz, A.; Heath, E. Galectin-3: A possible complementary marker to the PSA blood test. Oncotarget 2013, 4, 542. [Google Scholar] [CrossRef]
- Zhao, W.; Ajani, J.A.; Sushovan, G.; Ochi, N.; Hwang, R.; Hafley, M.; Johnson, R.L.; Bresalier, R.S.; Logsdon, C.D.; Zhang, Z. Galectin-3 mediates tumor cell–stroma interactions by activating pancreatic stellate cells to produce cytokines via integrin signaling. Gastroenterology 2018, 154, 1524–1537.e6. [Google Scholar] [CrossRef]
- Song, S.; Ji, B.; Ramachandran, V.; Wang, H.; Hafley, M.; Logsdon, C.; Bresalier, R.S. Overexpressed galectin-3 in pancreatic cancer induces cell proliferation and invasion by binding Ras and activating Ras signaling. PLoS ONE 2012, 7, e42699. [Google Scholar] [CrossRef]
- Cindolo, L.; Benvenuto, G.; Salvatore, P.; Pero, R.; Salvatore, G.; Mirone, V.; Prezioso, D.; Altieri, V.; Bruni, C.B.; Chiariotti, L. Galectin-1 and galectin-3 expression in human bladder transitional-cell carcinomas. Int. J. Cancer 1999, 84, 39–43. [Google Scholar] [CrossRef]
- Gillenwater, A.; Xu, X.C.; El-Naggar, A.K.; Clayman, G.L.; Lotan, R. Expression of galectins in head and neck squamous cell carcinoma. Head Neck J. Sci. Spec. Head Neck 1996, 18, 422–432. [Google Scholar] [CrossRef]
- Kuo, P.-L.; Hung, J.-Y.; Huang, S.-K.; Chou, S.-H.; Cheng, D.-E.; Jong, Y.-J.; Hung, C.-H.; Yang, C.-J.; Tsai, Y.-M.; Hsu, Y.-L. Lung cancer-derived galectin-1 mediates dendritic cell anergy through inhibitor of DNA binding 3/IL-10 signaling pathway. J. Immunol. 2011, 186, 1521–1530. [Google Scholar] [CrossRef] [PubMed]
- Langbein, S.; Brade, J.; Badawi, J.K.; Hatzinger, M.; Kaltner, H.; Lensch, M.; Specht, K.; André, S.; Brinck, U.; Alken, P. Gene-expression signature of adhesion/growth-regulatory tissue lectins (galectins) in transitional cell cancer and its prognostic relevance. Histopathology 2007, 51, 681–690. [Google Scholar] [CrossRef] [PubMed]
- Szöke, T.; Kayser, K.; Baumhäkel, J.-D.; Trojan, I.; Furak, J.; Tiszlavicz, L.; Horvath, A.; Szluha, K.; Gabius, H.-J.; Andre, S. Prognostic significance of endogenous adhesion/growth-regulatory lectins in lung cancer. Oncology 2005, 69, 167–174. [Google Scholar] [CrossRef] [PubMed]
- Tang, C.-E.; Tan, T.; Li, C.; Chen, Z.-C.; Ruan, L.; Wang, H.-H.; Su, T.; Zhang, P.-F.; Xiao, Z.-Q. Identification of Galectin-1 as a novel biomarker in nasopharyngeal carcinoma by proteomic analysis. Oncol. Rep. 2010, 24, 495–500. [Google Scholar] [PubMed]
- von Klot, C.-A.; Kramer, M.W.; Peters, I.; Hennenlotter, J.; Abbas, M.; Scherer, R.; Herrmann, T.R.; Stenzl, A.; Kuczyk, M.A.; Serth, J. Galectin-1 and Galectin-3 mRNA expression in renal cell carcinoma. BMC Clin. Pathol. 2014, 14, 15. [Google Scholar] [CrossRef] [PubMed]
- Chiariotti, L.; Berlingieri, M.T.; Battaglia, C.; Benvenuto, G.; Martelli, M.L.; Salvatore, P.; Chiappettaxy, G.; Bruni, C.B.; Fusco, A. Expression of galectin-1 in normal human thyroid gland and in differentiated and poorly differentiated thyroid tumors. Int. J. Cancer 1995, 64, 171–175. [Google Scholar] [CrossRef]
- Torres-Cabala, C.; Bibbo, M.; Panizo-Santos, A.; Barazi, H.; Krutzsch, H.; Roberts, D.D.; Merino, M.J. Proteomic identification of new biomarkers and application in thyroid cytology. Acta Cytol. 2006, 50, 518–528. [Google Scholar] [CrossRef]
- Xu, X.-C.; El-Naggar, A.K.; Lotan, R. Differential expression of galectin-1 and galectin-3 in thyroid tumors. Potential diagnostic implications. Am. J. Pathol. 1995, 147, 815. [Google Scholar]
- Čada, Z.; Smetana Jr, K.; Lacina, L.; Plzáková, Z.; Štork, J.; Kaltner, H.; Russwurm, R.; Lensch, M.; André, S.; Gabius, H. Immunohistochemical Fingerprinting of the Network of Seven Adhe sion/Growth-Regulatory Lectins in Human Skin and De-tection of Distinct Tumour-Associated Alterations. Folia Biol. 2009, 55, 145–152. [Google Scholar]
- Mathieu, V.; De Lassalle, E.M.; Toelen, J.; Mohr, T.; Bellahcene, A.; Van Goietsenoven, G.; Verschuere, T.; Bouzin, C.; Debyser, Z.; De Vleeschouwer, S. Galectin-1 in melanoma biology and related neo-angiogenesis processes. J. Investig. Dermatol. 2012, 132, 2245–2254. [Google Scholar] [CrossRef] [PubMed]
- Choufani, G.; Nagy, N.; Saussez, S.; Marchant, H.; Bisschop, P.; Burchert, M.; Danguy, A.; Louryan, S.; Salmon, I.; Gabius, H.J. The levels of expression of galectin-1, galectin-3, and the Thomsen–Friedenreich antigen and their binding sites decrease as clinical aggressiveness increases in head and neck cancers. Cancer Interdiscip. Int. J. Am. Cancer Soc. 1999, 86, 2353–2363. [Google Scholar] [CrossRef]
- Makino, K.; Kawamura, K.; Sato, W.; Kawamura, N.; Fujimoto, T.; Terada, Y. Inhibition of uterine sarcoma cell growth through suppression of endogenous tyrosine kinase B signaling. PLoS ONE 2012, 7, e41049. [Google Scholar] [CrossRef] [PubMed]
- Chung, H.; Kim, B.; Jung, S.-H.; Won, K.-J.; Jiang, X.; Lee, C.-K.; Lim, S.D.; Yang, S.-K.; Song, K.H.; Kim, H.S. Does phosphorylation of cofilin affect the progression of human bladder cancer? BMC Cancer 2013, 13, 45. [Google Scholar] [CrossRef] [PubMed]
- Kim, S.-J.; Hwang, J.-A.; Ro, J.Y.; Lee, Y.-S.; Chun, K.-H. Galectin-7 is epigenetically-regulated tumor suppressor in gastric cancer. Oncotarget 2013, 4, 1461. [Google Scholar] [CrossRef] [PubMed]
- Zhu, X.; Ding, M.; Yu, M.-L.; Feng, M.-X.; Tan, L.-J.; Zhao, F.-K. Identification of galectin-7 as a potential biomarker for esophageal squamous cell carcinoma by proteomic analysis. BMC Cancer 2010, 10, 290. [Google Scholar] [CrossRef] [PubMed]
- Demers, M.; Rose, A.A.; Grosset, A.-A.; Biron-Pain, K.; Gaboury, L.; Siegel, P.M.; St-Pierre, Y. Overexpression of galectin-7, a myoepithelial cell marker, enhances spontaneous metastasis of breast cancer cells. Am. J. Pathol. 2010, 176, 3023–3031. [Google Scholar] [CrossRef]
- Rorive, S.; Eddafali, B.; Fernandez, S.; Decaestecker, C.; André, S.; Kaltner, H.; Kuwabara, I.; Liu, F.-T.; Gabius, H.-J.; Kiss, R. Changes in galectin-7 and cytokeratin-19 expression during the progression of malignancy in thyroid tumors: Diagnostic and biological implications. Mod. Pathol. 2002, 15, 1294–1301. [Google Scholar] [CrossRef]
- Cada, Z.; Chovanec, M.; Smetana Jr, K.; Betka, J.; Lacina, L.; Plzák, J.; Kodet, R.; Stork, J.; Lensch, M.; Kaltner, H. Galectin-7, will the lectinrsquos activity establish clinical correlations in head and neck squamous cell and basal cell carcinomas? Histol. Histopathol. 2009, 24, 41–48. [Google Scholar]
- Sakaki, M.; Oka, N.; Nakanishi, R.; Yamaguchi, K.; Fukumori, T.; Kanayama, H.-o. Serum level of galectin-3 in human bladder cancer. J. Med. Investig. 2008, 55, 127–132. [Google Scholar] [CrossRef] [PubMed]
- Barrow, H.; Guo, X.; Wandall, H.H.; Pedersen, J.W.; Fu, B.; Zhao, Q.; Chen, C.; Rhodes, J.M.; Yu, L.-G. Serum galectin-2,-4, and-8 are greatly increased in colon and breast cancer patients and promote cancer cell adhesion to blood vascular endothelium. Clin. Cancer Res. 2011, 17, 7035–7046. [Google Scholar] [CrossRef] [PubMed]
- Chen, C.; Duckworth, C.A.; Zhao, Q.; Pritchard, D.M.; Rhodes, J.M.; Yu, L.-G. Increased circulation of galectin-3 in cancer induces secretion of metastasis-promoting cytokines from blood vascular endothelium. Clin. Cancer Res. 2013, 19, 1693–1704. [Google Scholar] [CrossRef] [PubMed]
- Iacovazzi, P.A.; Notarnicola, M.; Caruso, M.G.; Guerra, V.; Frisullo, S.; Altomare, D.F.; Correale, M. Serum levels of galectin-3 and its ligand 90k/mac-2bp in colorectal cancer patients. Immunopharmacol. Immunotoxicol. 2010, 32, 160–164. [Google Scholar] [CrossRef]
- Watanabe, M.; Takemasa, I.; Kaneko, N.; Yokoyama, Y.; Matsuo, E.-I.; Iwasa, S.; Mori, M.; Matsuura, N.; Monden, M.; Nishimura, O. Clinical significance of circulating galectins as colorectal cancer markers. Oncol. Rep. 2011, 25, 1217–1226. [Google Scholar] [PubMed]
- Vereecken, P.; Awada, A.; Suciu, S.; Castro, G.; Morandini, R.; Litynska, A.; Lienard, D.; Ezzedine, K.; Ghanem, G.; Heenen, M. Evaluation of the prognostic significance of serum galectin-3 in American Joint Committee on Cancer stage III and stage IV melanoma patients. Melanoma Res. 2009, 19, 316–320. [Google Scholar] [CrossRef]
- Ouyang, J.; Plütschow, A.; Von Strandmann, E.P.; Reiners, K.S.; Ponader, S.; Rabinovich, G.A.; Neuberg, D.; Engert, A.; Shipp, M.A. Galectin-1 serum levels reflect tumor burden and adverse clinical features in classical Hodgkin lymphoma. Blood J. Am. Soc. Hematol. 2013, 121, 3431–3433. [Google Scholar] [CrossRef]
- Thijssen, V.L.; Heusschen, R.; Caers, J.; Griffioen, A.W. Galectin expression in cancer diagnosis and prognosis: A systematic review. Biochim. Biophys. Acta (BBA)-Rev. Cancer 2015, 1855, 235–247. [Google Scholar] [CrossRef]
- Koopmann, J.; Thuluvath, P.J.; Zahurak, M.L.; Kristiansen, T.Z.; Pandey, A.; Schulick, R.; Argani, P.; Hidalgo, M.; Iacobelli, S.; Goggins, M. Mac-2-binding protein is a diagnostic marker for biliary tract carcinoma. Cancer 2004, 101, 1609–1615. [Google Scholar] [CrossRef]
- Hittelet, A.; Legendre, H.; Nagy, N.; Bronckart, Y.; Pector, J.C.; Salmon, I.; Yeaton, P.; Gabius, H.J.; Kiss, R.; Camby, I. Upregulation of galectins-1 and-3 in human colon cancer and their role in regulating cell migration. Int. J. Cancer 2003, 103, 370–379. [Google Scholar] [CrossRef]
- Saal, I.; Nagy, N.; Lensch, M.; Lohr, M.; Manning, J.; Decaestecker, C.; André, S.; Kiss, R.; Salmon, I.; Gabius, H.-J. Human galectin-2: Expression profiling by RT-PCR/immunohistochemistry and its introduction as a histochemical tool for ligand localization. Histol. Histopathol. 2005, 20, 1191–1208. [Google Scholar] [PubMed]
- Kim, S.W.; Park, K.C.; Jeon, S.M.; Ohn, T.B.; Kim, T.I.; Kim, W.H.; Cheon, J.H. Abrogation of galectin-4 expression promotes tumorigenesis in colorectal cancer. Cell. Oncol. 2013, 36, 169–178. [Google Scholar] [CrossRef] [PubMed]
- Rechreche, H.; Mallo, G.V.; Montalto, G.; Dagorn, J.C.; Iovanna, J.L. Cloning and expression of the mRNA of human galectin-4, an S-type lectin down-regulated in colorectal cancer. Eur. J. Biochem. 1997, 248, 225–230. [Google Scholar] [CrossRef] [PubMed]
- Satelli, A.; Rao, P.S.; Thirumala, S.; Rao, U.S. Galectin-4 functions as a tumor suppressor of human colorectal cancer. Int. J. Cancer 2011, 129, 799–809. [Google Scholar] [CrossRef] [PubMed]
- Kiss, R.; Danguy, A.; Rorive, S.; Decaestecker, C.; Bronckart, Y.; Kaltner, H.; Hadari, Y.; Goren, R.; Zich, Y.; Petein, M. Immunohistochemical profile of galectin-8 expression in benign and malignant tumors of epithelial, mesenchymatous and adipous origins, and of the nervous system. Histol. Histopathol. 2001, 16, 861–868. [Google Scholar]
- Yang, L.-P.; Jiang, S.; Liu, J.-Q.; Miao, X.-Y.; Yang, Z.-L. Up-regulation of galectin-3 and Sambucus nigra agglutinin binding site is associated with invasion, metastasis and poor-progression of the gallbladder adenocarcinoma. Hepato-Gastroenterol. 2012, 59, 2089–2094. [Google Scholar]
- Baldus, S.; Zirbes, T.; Weingarten, M.; Fromm, S.; Glossmann, J.; Hanisch, F.-G.; Mönig, S.; Schröder, W.; Flucke, U.; Thiele, J. Increased galectin-3 expression in gastric cancer: Correlations with histopathological subtypes, galactosylated antigens and tumor cell proliferation. Tumor Biol. 2000, 21, 258–266. [Google Scholar] [CrossRef] [PubMed]
- Yang, J.; Zhu, L.; Cai, Y.; Suo, J.; Jin, J. Role of downregulation of galectin-9 in the tumorigenesis of gastric cancer. Int. J. Oncol. 2014, 45, 1313–1320. [Google Scholar] [CrossRef]
- Kondoh, N.; Hada, A.; Ryo, A.; Shuda, M.; Arai, M.; Matsubara, O.; Kimura, F.; Wakatsuki, T.; Yamamoto, M. Activation of Galectin-1 gene in human hepatocellular carcinoma involves methylation-sensitive complex formations at the transcriptional upstream and downstream elements. Int. J. Oncol. 2003, 23, 1575–1583. [Google Scholar] [CrossRef]
- Shimonishi, T.; Miyazaki, K.; Kono, N.; Sabit, H.; Tuneyama, K.; Harada, K.; Hirabayashi, J.; Kasai, K.; Nakanuma, Y. Expression of endogenous galectin-1 and galectin-3 in intrahepatic cholangiocarcinoma. Hum. Pathol. 2001, 32, 302–310. [Google Scholar] [CrossRef]
- Hsu, D.K.; Dowling, C.A.; Jeng, K.C.G.; Chen, J.T.; Yang, R.Y.; Liu, F.T. Galectin-3 expression is induced in cirrhotic liver and hepatocellular carcinoma. Int. J. Cancer 1999, 81, 519–526. [Google Scholar] [CrossRef]
- Kondoh, N.; Wakatsuki, T.; Ryo, A.; Hada, A.; Aihara, T.; Horiuchi, S.; Goseki, N.; Matsubara, O.; Takenaka, K.; Shichita, M. Identification and characterization of genes associated with human hepatocellular carcinogenesis. Cancer Res. 1999, 59, 4990–4996. [Google Scholar] [PubMed]
- Zhang, Z.-Y.; Dong, J.-H.; Chen, Y.-W.; Wang, X.-Q.; Li, C.-H.; Wang, J.; Wang, G.-Q.; Li, H.-L.; Wang, X.-D. Galectin-9 acts as a prognostic factor with antimetastatic potential in hepatocellular carcinoma. Asian Pac. J. Cancer Prev. 2012, 13, 2503–2509. [Google Scholar] [CrossRef] [PubMed]
- Chung, J.C.; Oh, M.J.; Choi, S.H.; Bae, C.D. Proteomic analysis to identify biomarker proteins in pancreatic ductal adenocarcinoma. ANZ J. Surg. 2008, 78, 245–251. [Google Scholar] [CrossRef] [PubMed]
- Xie, L.; Ni, W.-K.; Chen, X.-D.; Xiao, M.-B.; Chen, B.-Y.; He, S.; Lu, C.-H.; Li, X.-Y.; Jiang, F.; Ni, R.-Z. The expressions and clinical significances of tissue and serum galectin-3 in pancreatic carcinoma. J. Cancer Res. Clin. Oncol. 2012, 138, 1035–1043. [Google Scholar] [CrossRef] [PubMed]
- Bauer, A.; Kleeff, J.; Bier, M.; Wirtz, M.; Kayed, H.; Esposito, I.; Korc, M.; Hafner, M.; Hoheisel, J.D.; Friess, H. Identification of malignancy factors by analyzing cystic tumors of the pancreas. Pancreatology 2009, 9, 34–44. [Google Scholar] [CrossRef]
- Terris, B.; Blaveri, E.; Crnogorac-Jurcevic, T.; Jones, M.; Missiaglia, E.; Ruszniewski, P.; Sauvanet, A.; Lemoine, N.R. Characterization of gene expression profiles in intraductal papillary-mucinous tumors of the pancreas. Am. J. Pathol. 2002, 160, 1745–1754. [Google Scholar] [CrossRef]
- Asgarian-Omran, H.; Forghani, P.; Hojjat-Farsangi, M.; Roohi, A.; Sharifian, R.A.; Razavi, S.M.; Jeddi-Tehrani, M.; Rabbani, H.; Shokri, F. Expression profile of galectin-1 and galectin-3 molecules in different subtypes of chronic lymphocytic leukemia. Cancer Investig. 2010, 28, 717–725. [Google Scholar] [CrossRef]
- D’Haene, N.; Maris, C.; Sandras, F.; Dehou, M.-F.; Remmelink, M.; Decaestecker, C.; Salmon, I. The differential expression of Galectin-1 and Galectin-3 in normal lymphoid tissue and non-Hodgkin’s and Hodgkin’s lymphomas. Int. J. Immunopathol. Pharmacol. 2005, 18, 431–443. [Google Scholar] [CrossRef]
- Wollina, U.; Graefe, T.; Feldrappe, S.; Andre, S.; Wasano, K.; Kaltner, H.; Zick, Y.; Gabius, H.-J. Galectin fingerprinting by immuno-and lectin histochemistry in cutaneous lymphoma. J. Cancer Res. Clin. Oncol. 2002, 128, 103–110. [Google Scholar]
- Türeci, Ö.; Schmitt, H.; Fadle, N.; Pfreundschuh, M.; Sahin, U. Molecular definition of a novel human galectin which is immunogenic in patients with Hodgkin’s disease. J. Biol. Chem. 1997, 272, 6416–6422. [Google Scholar] [CrossRef] [PubMed]
- Kim, S.J.; Lee, S.J.; Sung, H.J.; Choi, I.K.; Choi, C.W.; Kim, B.S.; Kim, J.S.; Yu, W.; Hwang, H.S.; Kim, I.S. Increased serum 90K and Galectin-3 expression are associated with advanced stage and a worse prognosis in diffuse large B-cell lymphomas. Acta Haematol. 2009, 120, 211–216. [Google Scholar] [CrossRef]
- Koopmans, S.M.; Bot, F.J.; Schouten, H.C.; Janssen, J.; van Marion, A.M. The involvement of Galectins in the modulation of the JAK/STAT pathway in myeloproliferative neoplasia. Am. J. Blood Res. 2012, 2, 119. [Google Scholar] [PubMed]
- Neder, L.; Marie, S.K.N.; Carlotti Jr, C.G.; Gabbai, A.A.; Rosemberg, S.; Malheiros, S.M.; Siqueira, R.P.; Oba-Shinjo, S.M.; Uno, M.; Aguiar, P.H. Galectin-3 as an immunohistochemical tool to distinguish pilocytic astrocytomas from diffuse astrocytomas, and glioblastomas from anaplastic oligodendrogliomas. Brain Pathol. 2004, 14, 399–405. [Google Scholar] [CrossRef] [PubMed]
- Park, S.H.; Min, H.S.; Kim, B.; Myung, J.; Paek, S.H. Galectin-3: A useful biomarker for differential diagnosis of brain tumors. Neuropathology 2008, 28, 497–506. [Google Scholar] [CrossRef] [PubMed]
- Verschuere, T.; Van Woensel, M.; Fieuws, S.; Lefranc, F.; Mathieu, V.; Kiss, R.; Van Gool, S.W.; De Vleeschouwer, S. Altered galectin-1 serum levels in patients diagnosed with high-grade glioma. J. Neuro-Oncol. 2013, 115, 9–17. [Google Scholar] [CrossRef] [PubMed]
- Riss, D.; Jin, L.; Qian, X.; Bayliss, J.; Scheithauer, B.W.; Young, W.F., Jr.; Vidal, S.; Kovacs, K.; Raz, A.; Lloyd, R.V. Differential expression of galectin-3 in pituitary tumors. Cancer Res. 2003, 63, 2251–2255. [Google Scholar]
- Fernandez-Aguilar, S.; Noël, J.C. Expression of cathepsin D and galectin 3 in tubular carcinomas of the breast. Apmis 2008, 116, 33–40. [Google Scholar] [CrossRef]
- Kohrenhagen, N.; Volker, H.; Kapp, M.; Dietl, J.; Kammerer, U. Increased expression of galectin-1 during the progression of cervical neoplasia. Int. J. Gynecol. Cancer 2006, 16, 2018–2022. [Google Scholar] [CrossRef]
- Lee, J.-W.; Song, S.Y.; Choi, J.-J.; Choi, C.H.; Kim, T.-J.; Kim, J.; Lee, J.-H.; Kim, B.-G.; Bae, D.-S. Decreased galectin-3 expression during the progression of cervical neoplasia. J. Cancer Res. Clin. Oncol. 2006, 132, 241–247. [Google Scholar] [CrossRef]
- Liang, M.; Ueno, M.; Oomizu, S.; Arikawa, T.; Shinonaga, R.; Zhang, S.; Yamauchi, A.; Hirashima, M. Galectin-9 expression links to malignant potential of cervical squamous cell carcinoma. J. Cancer Res. Clin. Oncol. 2008, 134, 899–907. [Google Scholar] [CrossRef] [PubMed]
- Zhu, H.; Wu, T.C.; Chen, W.Q.; Zhou, L.J.; Wu, Y.; Zeng, L.; Pei, H.P. Roles of galectin-7 and S100A9 in cervical squamous carcinoma: Clinicopathological and in vitro evidence. Int. J. Cancer 2013, 132, 1051–1059. [Google Scholar] [CrossRef] [PubMed]
- Kim, H.-J.; Jeon, H.-K.; Cho, Y.J.; Park, Y.A.; Choi, J.-J.; Do, I.-G.; Song, S.Y.; Lee, Y.-Y.; Choi, C.H.; Kim, T.-J. High galectin-1 expression correlates with poor prognosis and is involved in epithelial ovarian cancer proliferation and invasion. Eur. J. Cancer 2012, 48, 1914–1921. [Google Scholar] [CrossRef] [PubMed]
- Van den Brule, F.; Berchuck, A.; Bast, R.; Liu, F.-T.; Gillet, C.; Sobel, M.; Castronovo, V. Differential expression of the 67-kD laminin receptor and 31-kD human laminin-binding protein in human ovarian carcinomas. Eur. J. Cancer 1994, 30, 1096–1099. [Google Scholar] [CrossRef] [PubMed]
- Heinzelmann-Schwarz, V.; Gardiner-Garden, M.; Henshall, S.; Scurry, J.; Scolyer, R.; Smith, A.; Bali, A.; Bergh, P.V.; Baron-Hay, S.; Scott, C. A distinct molecular profile associated with mucinous epithelial ovarian cancer. Br. J. Cancer 2006, 94, 904–913. [Google Scholar] [CrossRef] [PubMed]
- Ellerhorst, J.; Troncoso, P.; Xu, X.-C.; Lee, J.; Lotan, R. Galectin-1 and galectin-3 expression in human prostate tissue and prostate cancer. Urol. Res. 1999, 27, 362–367. [Google Scholar] [CrossRef] [PubMed]
- van den Brûle, F.A.; Waltregny, D.; Liu, F.T.; Castronovo, V. Alteration of the cytoplasmic/nuclear expression pattern of galectin-3 correlates with prostate carcinoma progression. Int. J. Cancer 2000, 89, 361–367. [Google Scholar] [CrossRef]
- Su, Z.-Z.; Lin, J.; Shen, R.; Fisher, P.E.; Goldstein, N.I.; Fisher, P.B. Surface-epitope masking and expression cloning identifies the human prostate carcinoma tumor antigen gene PCTA-1 a member of the galectin gene family. Proc. Natl. Acad. Sci. USA 1996, 93, 7252–7257. [Google Scholar] [CrossRef]
- Laderach, D.J.; Gentilini, L.D.; Giribaldi, L.; Delgado, V.C.; Nugnes, L.; Croci, D.O.; Al Nakouzi, N.; Sacca, P.; Casas, G.; Mazza, O. A unique galectin signature in human prostate cancer progression suggests galectin-1 as a key target for treatment of advanced disease. Cancer Res. 2013, 73, 86–96. [Google Scholar] [CrossRef]
- Weissenbacher, T.; Kuhn, C.; Mayr, D.; Pavlik, R.; Friese, K.; Scholz, C.; Jeschke, U.; Ditsch, N.; Dian, D. Expression of mucin-1, galectin-1 and galectin-3 in human leiomyosarcoma in comparison to leiomyoma and myometrium. Anticancer Res. 2011, 31, 451–457. [Google Scholar]
- Bassen, R.; Brichory, F.; Caulet-Maugendre, S.; Bidon, N.; Delaval, P.; Desrues, B.; Dazord, L. Expression of Po66-CBP, a type-8 galectin, in different healthy, tumoral and peritumoral tissues. Anticancer Res. 1999, 19, 5429–5433. [Google Scholar] [PubMed]
- Teymoortash, A.; Pientka, A.; Schrader, C.; Tiemann, M.; Werner, J.A. Expression of galectin-3 in adenoid cystic carcinoma of the head and neck and its relationship with distant metastasis. J. Cancer Res. Clin. Oncol. 2006, 132, 51–56. [Google Scholar] [CrossRef] [PubMed]
- Cludts, S.; Decaestecker, C.; Mahillon, V.; Chevalier, D.; Kaltner, H.; André, S.; Remmelink, M.; Leroy, X.; Gabius, H.-J.; Saussez, S. Galectin-8 up-regulation during hypopharyngeal and laryngeal tumor progression and comparison with galectin-1,-3 and-7. Anticancer Res. 2009, 29, 4933–4940. [Google Scholar] [PubMed]
- Merseburger, A.S.; Kramer, M.W.; Hennenlotter, J.; Serth, J.; Kruck, S.; Gracia, A.; Stenzl, A.; Kuczyk, M.A. Loss of galectin-3 expression correlates with clear cell renal carcinoma progression and reduced survival. World J. Urol. 2008, 26, 637–642. [Google Scholar] [CrossRef] [PubMed]
- Vereecken, P.; Zouaoui Boudjeltia, K.; Debray, C.; Awada, A.; Legssyer, I.; Sales, F.; Petein, M.; Vanhaeverbeek, M.; Ghanem, G.; Heenen, M. High serum galectin-3 in advanced melanoma: Preliminary results. Clin. Exp. Dermatol. 2006, 31, 105–109. [Google Scholar] [CrossRef] [PubMed]
- Köbel, M.; Kalloger, S.E.; Boyd, N.; McKinney, S.; Mehl, E.; Palmer, C.; Leung, S.; Bowen, N.J.; Ionescu, D.N.; Rajput, A. Ovarian carcinoma subtypes are different diseases: Implications for biomarker studies. PLoS Med. 2008, 5, e232. [Google Scholar] [CrossRef] [PubMed]
- Alagoz, T.; Buller, R.E.; Berman, M.; Anderson, B.; Manetta, A.; DiSaia, P. What is a normal CA125 level? Gynecol. Oncol. 1994, 53, 93–97. [Google Scholar] [CrossRef] [PubMed]
- Ross, J.S.; Linette, G.P.; Stec, J.; Clark, E.; Ayers, M.; Leschly, N.; Symmans, W.F.; Hortobagyi, G.N.; Pusztai, L. Breast cancer biomarkers and molecular medicine. Expert Rev. Mol. Diagn. 2003, 3, 573–585. [Google Scholar] [CrossRef]
- Lamberti, I.; Scarano, S.; Esposito, C.L.; Antoccia, A.; Antonini, G.; Tanzarella, C.; De Franciscis, V.; Minunni, M. In vitro selection of RNA aptamers against CA125 tumor marker in ovarian cancer and its study by optical biosensing. Methods 2016, 97, 58–68. [Google Scholar] [CrossRef]
- Dolscheid-Pommerich, R.C.; Manekeller, S.; Walgenbach-Bruenagel, G.; Kalff, J.C.; Hartmann, G.; Wagner, B.S.; Holdenrieder, S. Clinical performance of CEA, CA19-9, CA15-3, CA125 and AFP in gastrointestinal cancer using LOCI™-based assays. Anticancer Res. 2017, 37, 353–359. [Google Scholar] [CrossRef]
- Chen, C.J.; Wang, L.Y.; Yu, M.W. Epidemiology of hepatitis B virus infection in the Asia–Pacific region. J. Gastroenterol. Hepatol. 2000, 15, E3–E6. [Google Scholar] [CrossRef] [PubMed]
- Kirk, G.D.; Bah, E.; Montesano, R. Molecular epidemiology of human liver cancer: Insights into etiology, pathogenesis and prevention from The Gambia, West Africa. Carcinogenesis 2006, 27, 2070–2082. [Google Scholar] [CrossRef] [PubMed]
- Shukla, S.; Bharti, A.C.; Mahata, S.; Hussain, S.; Kumar, R.; Hedau, S.; Das, B.C. Infection of human papillomaviruses in cancers of different human organ sites. Indian J. Med. Res. 2009, 130, 222–233. [Google Scholar] [PubMed]
- Kreimer, A.R.; Clifford, G.M.; Snijders, P.J.; Castellsagué, X.; Meijer, C.J.; Pawlita, M.; Viscidi, R.; Herrero, R.; Franceschi, S. HPV16 semiquantitative viral load and serologic biomarkers in oral and oropharyngeal squamous cell carcinomas. Int. J. Cancer 2005, 115, 329–332. [Google Scholar] [CrossRef] [PubMed]
- Hanna, G.J.; Sridharan, V.; Margalit, D.N.; La Follette, S.K.; Chau, N.G.; Rabinowits, G.; Lorch, J.H.; Haddad, R.I.; Tishler, R.B.; Anderson, K.S. Salivary and serum HPV antibody levels before and after definitive treatment in patients with oropharyngeal squamous cell carcinoma. Cancer Biomark. 2017, 19, 129–136. [Google Scholar] [CrossRef] [PubMed]
- Thompson, M.P.; Kurzrock, R. Epstein-Barr virus and cancer. Clin. Cancer Res. 2004, 10, 803–821. [Google Scholar] [CrossRef] [PubMed]
- Lin, J.-C.; Wang, W.-Y.; Chen, K.Y.; Wei, Y.-H.; Liang, W.-M.; Jan, J.-S.; Jiang, R.-S. Quantification of plasma Epstein–Barr virus DNA in patients with advanced nasopharyngeal carcinoma. N. Engl. J. Med. 2004, 350, 2461–2470. [Google Scholar] [CrossRef]
- Gandhi, M.K.; Lambley, E.; Burrows, J.; Dua, U.; Elliott, S.; Shaw, P.J.; Prince, H.M.; Wolf, M.; Clarke, K.; Underhill, C. Plasma Epstein-Barr virus (EBV) DNA is a biomarker for EBV-positive Hodgkin’s lymphoma. Clin. Cancer Res. 2006, 12, 460–464. [Google Scholar] [CrossRef]
- Boxus, M.; Willems, L. Mechanisms of HTLV-1 persistence and transformation. Br. J. Cancer 2009, 101, 1497–1501. [Google Scholar] [CrossRef]
- Farooqi, A.A.; Desai, N.N.; Qureshi, M.Z.; Librelotto, D.R.N.; Gasparri, M.L.; Bishayee, A.; Nabavi, S.M.; Curti, V.; Daglia, M. Exosome biogenesis, bioactivities and functions as new delivery systems of natural compounds. Biotechnol. Adv. 2018, 36, 328–334. [Google Scholar] [CrossRef]
- Kowal, J.; Tkach, M.; Théry, C. Biogenesis and secretion of exosomes. Curr. Opin. Cell Biol. 2014, 29, 116–125. [Google Scholar] [CrossRef] [PubMed]
- Raposo, G.; Stoorvogel, W. Extracellular vesicles: Exosomes, microvesicles, and friends. J. Cell Biol. 2013, 200, 373–383. [Google Scholar] [CrossRef] [PubMed]
- Ha, D.; Yang, N.; Nadithe, V. Exosomes as therapeutic drug carriers and delivery vehicles across biological membranes: Current perspectives and future challenges. Acta Pharm. Sin. B 2016, 6, 287–296. [Google Scholar] [CrossRef] [PubMed]
- Masaoutis, C.; Mihailidou, C.; Tsourouflis, G.; Theocharis, S. Exosomes in lung cancer diagnosis and treatment. From the translating research into future clinical practice. Biochimie 2018, 151, 27–36. [Google Scholar] [CrossRef] [PubMed]
- Whiteside, T.L. Tumor-derived exosomes and their role in cancer progression. Adv. Clin. Chem. 2016, 74, 103–141. [Google Scholar] [PubMed]
- Suchorska, W.M.; Lach, M.S. The role of exosomes in tumor progression and metastasis. Oncol. Rep. 2016, 35, 1237–1244. [Google Scholar] [CrossRef] [PubMed]
- Kimura, H.; Yamamoto, H.; Harada, T.; Fumoto, K.; Osugi, Y.; Sada, R.; Maehara, N.; Hikita, H.; Mori, S.; Eguchi, H. CKAP4, a DKK1 receptor, is a biomarker in exosomes derived from pancreatic cancer and a molecular target for therapy. Clin. Cancer Res. 2019, 25, 1936–1947. [Google Scholar] [CrossRef] [PubMed]
- Schwarzenbach, H.; Gahan, P.B. Predictive value of exosomes and their cargo in drug response/resistance of breast cancer patients. Cancer Drug Resist. 2020, 3, 63. [Google Scholar] [CrossRef]
- Sohn, W.; Kim, J.; Kang, S.H.; Yang, S.R.; Cho, J.-Y.; Cho, H.C.; Shim, S.G.; Paik, Y.-H. Serum exosomal microRNAs as novel biomarkers for hepatocellular carcinoma. Exp. Mol. Med. 2015, 47, e184. [Google Scholar] [CrossRef]
- Huang, X.; Yuan, T.; Liang, M.; Du, M.; Xia, S.; Dittmar, R.; Wang, D.; See, W.; Costello, B.A.; Quevedo, F. Exosomal miR-1290 and miR-375 as prognostic markers in castration-resistant prostate cancer. Eur. Urol. 2015, 67, 33–41. [Google Scholar] [CrossRef]
- Piao, H.-y.; Guo, S.; Wang, Y.; Zhang, J. Exosomal long non-coding RNA CEBPA-AS1 inhibits tumor apoptosis and functions as a non-invasive biomarker for diagnosis of gastric cancer. OncoTargets Ther. 2020, 13, 1365–1374. [Google Scholar] [CrossRef] [PubMed]
- Hood, J.L. Melanoma exosome induction of endothelial cell GM-CSF in pre-metastatic lymph nodes may result in different M1 and M2 macrophage mediated angiogenic processes. Med. Hypotheses 2016, 94, 118–122. [Google Scholar] [CrossRef] [PubMed]
- Aga, M.; Bentz, G.L.; Raffa, S.; Torrisi, M.R.; Kondo, S.; Wakisaka, N.; Yoshizaki, T.; Pagano, J.S.; Shackelford, J. Exosomal HIF1α supports invasive potential of nasopharyngeal carcinoma-associated LMP1-positive exosomes. Oncogene 2014, 33, 4613–4622. [Google Scholar] [CrossRef] [PubMed]
- Shi, S.; Zhang, Q.; Xia, Y.; You, B.; Shan, Y.; Bao, L.; Li, L.; You, Y.; Gu, Z. Mesenchymal stem cell-derived exosomes facilitate nasopharyngeal carcinoma progression. Am. J. Cancer Res. 2016, 6, 459. [Google Scholar] [PubMed]
- Cao, M.; Seike, M.; Soeno, C.; Mizutani, H.; Kitamura, K.; Minegishi, Y.; Noro, R.; Yoshimura, A.; Cai, L.; Gemma, A. MiR-23a regulates TGF-β-induced epithelial-mesenchymal transition by targeting E-cadherin in lung cancer cells. Int. J. Oncol. 2012, 41, 869–875. [Google Scholar] [CrossRef] [PubMed]
- Kim, J.; Kim, T.Y.; Lee, M.S.; Mun, J.Y.; Ihm, C.; Kim, S.A. Exosome cargo reflects TGF-β1-mediated epithelial-to-mesenchymal transition (EMT) status in A549 human lung adenocarcinoma cells. Biochem. Biophys. Res. Commun. 2016, 478, 643–648. [Google Scholar] [CrossRef]
- Zhou, W.; Fong, M.Y.; Min, Y.; Somlo, G.; Liu, L.; Palomares, M.R.; Yu, Y.; Chow, A.; O’Connor, S.T.F.; Chin, A.R. Cancer-secreted miR-105 destroys vascular endothelial barriers to promote metastasis. Cancer Cell 2014, 25, 501–515. [Google Scholar] [CrossRef]
- Zhang, L.; Zhang, S.; Yao, J.; Lowery, F.J.; Zhang, Q.; Huang, W.-C.; Li, P.; Li, M.; Wang, X.; Zhang, C. Microenvironment-induced PTEN loss by exosomal microRNA primes brain metastasis outgrowth. Nature 2015, 527, 100–104. [Google Scholar] [CrossRef]
- Liao, J.; Liu, R.; Shi, Y.-J.; Yin, L.-H.; Pu, Y.-P. Exosome-shuttling microRNA-21 promotes cell migration and invasion-targeting PDCD4 in esophageal cancer. Int. J. Oncol. 2016, 48, 2567–2579. [Google Scholar] [CrossRef]
- Pfeffer, S.R.; Grossmann, K.F.; Cassidy, P.B.; Yang, C.H.; Fan, M.; Kopelovich, L.; Leachman, S.A.; Pfeffer, L.M. Detection of exosomal miRNAs in the plasma of melanoma patients. J. Clin. Med. 2015, 4, 2012–2027. [Google Scholar] [CrossRef]
- Li, L.; Li, C.; Wang, S.; Wang, Z.; Jiang, J.; Wang, W.; Li, X.; Chen, J.; Liu, K.; Li, C. Exosomes derived from hypoxic oral squamous cell carcinoma cells deliver miR-21 to normoxic cells to elicit a prometastatic phenotype. Cancer Res. 2016, 76, 1770–1780. [Google Scholar] [CrossRef] [PubMed]
- Webber, J.; Steadman, R.; Mason, M.D.; Tabi, Z.; Clayton, A. Cancer exosomes trigger fibroblast to myofibroblast differentiation. Cancer Res. 2010, 70, 9621–9630. [Google Scholar] [CrossRef] [PubMed]
- Webber, J.P.; Spary, L.K.; Sanders, A.J.; Chowdhury, R.; Jiang, W.G.; Steadman, R.; Wymant, J.; Jones, A.T.; Kynaston, H.; Mason, M.D. Differentiation of tumour-promoting stromal myofibroblasts by cancer exosomes. Oncogene 2015, 34, 290–302. [Google Scholar] [CrossRef] [PubMed]
- Luga, V.; Wrana, J.L. Tumor–stroma interaction: Revealing fibroblast-secreted exosomes as potent regulators of Wnt-planar cell polarity signaling in cancer metastasis. Cancer Res. 2013, 73, 6843–6847. [Google Scholar] [CrossRef] [PubMed]
- Liberti, M.V.; Locasale, J.W. The Warburg effect: How does it benefit cancer cells? Trends Biochem. Sci. 2016, 41, 211–218. [Google Scholar] [CrossRef] [PubMed]
- Warburg, O.; Wind, F.; Negelein, E. The metabolism of tumors in the body. J. Gen. Physiol. 1927, 8, 519. [Google Scholar] [CrossRef] [PubMed]
- Paradies, G.; Paradies, V.; De Benedictis, V.; Ruggiero, F.M.; Petrosillo, G. Functional role of cardiolipin in mitochondrial bioenergetics. Biochim. Biophys. Acta (BBA)-Bioenerg. 2014, 1837, 408–417. [Google Scholar] [CrossRef]
- Mejia, E.M.; Hatch, G.M. Mitochondrial phospholipids: Role in mitochondrial function. J. Bioenerg. Biomembr. 2016, 48, 99–112. [Google Scholar] [CrossRef]
- Yu, Z.; Chen, H.; Ai, J.; Zhu, Y.; Li, Y.; Borgia, J.A.; Yang, J.-S.; Zhang, J.; Jiang, B.; Gu, W. Global lipidomics identified plasma lipids as novel biomarkers for early detection of lung cancer. Oncotarget 2017, 8, 107899. [Google Scholar] [CrossRef]
- Li, G.; Li, L.; Joo, E.J.; Son, J.W.; Kim, Y.J.; Kang, J.K.; Lee, K.B.; Zhang, F.; Linhardt, R.J. Glycosaminoglycans and glycolipids as potential biomarkers in lung cancer. Glycoconj. J. 2017, 34, 661–669. [Google Scholar] [CrossRef]
- Wolrab, D.; Jirásko, R.; Cífková, E.; Höring, M.; Mei, D.; Chocholoušková, M.; Peterka, O.; Idkowiak, J.; Hrnčiarová, T.; Kuchař, L. Lipidomic profiling of human serum enables detection of pancreatic cancer. Nat. Commun. 2022, 13, 124. [Google Scholar] [CrossRef] [PubMed]
- Escribá, P.V.; González-Ros, J.M.; Goñi, F.M.; Kinnunen, P.K.; Vigh, L.; Sánchez-Magraner, L.; Fernández, A.M.; Busquets, X.; Horváth, I.; Barceló-Coblijn, G. Membranes: A meeting point for lipids, proteins and therapies. J. Cell. Mol. Med. 2008, 12, 829–875. [Google Scholar] [CrossRef] [PubMed]
- Prentki, M.; Madiraju, S.M. Glycerolipid metabolism and signaling in health and disease. Endocr. Rev. 2008, 29, 647–676. [Google Scholar] [CrossRef] [PubMed]
- Yuan, T.; Cantley, L. PI3K pathway alterations in cancer: Variations on a theme. Oncogene 2008, 27, 5497–5510. [Google Scholar] [CrossRef]
- Buckler, J.L.; Liu, X.; Turka, L.A. Regulation of T-cell responses by PTEN. Immunol. Rev. 2008, 224, 239–248. [Google Scholar] [CrossRef]
- Carpinteiro, A.; Dumitru, C.; Schenck, M.; Gulbins, E. Ceramide-induced cell death in malignant cells. Cancer Lett. 2008, 264, 1–10. [Google Scholar] [CrossRef]
- Hannun, Y.A.; Obeid, L.M. Principles of bioactive lipid signalling: Lessons from sphingolipids. Nat. Rev. Mol. Cell Biol. 2008, 9, 139–150. [Google Scholar] [CrossRef]
- Ledeen, R.W.; Wu, G. Thematic review series: Sphingolipids. Nuclear sphingolipids: Metabolism and signaling. J. Lipid Res. 2008, 49, 1176–1186. [Google Scholar] [CrossRef]
- Li, J.; Yen, C.; Liaw, D.; Podsypanina, K.; Bose, S.; Wang, S.I.; Puc, J.; Miliaresis, C.; Rodgers, L.; McCombie, R. PTEN, a putative protein tyrosine phosphatase gene mutated in human brain, breast, and prostate cancer. Science 1997, 275, 1943–1947. [Google Scholar] [CrossRef]
- Maxwell, G.L.; Risinger, J.I.; Gumbs, C.; Shaw, H.; Bentley, R.C.; Barrett, J.C.; Berchuck, A.; Futreal, P.A. Mutation of the PTEN tumor suppressor gene in endometrial hyperplasias. Cancer Res. 1998, 58, 2500–2503. [Google Scholar]
- Koul, D. PTEN signaling pathways in glioblastoma. Cancer Biol. Ther. 2008, 7, 1321–1325. [Google Scholar] [CrossRef] [PubMed]
- Chen, W.-C.; Lin, M.-S.; Zhang, B.-F.; Fang, J.; Zhou, Q.; Hu, Y.; Gao, H.-J. Survey of molecular profiling during human colon cancer development and progression by immunohistochemical staining on tissue microarray. World J. Gastroenterol. WJG 2007, 13, 699. [Google Scholar] [CrossRef] [PubMed]
- Fan, H.-Y.; Liu, Z.; Cahill, N.; Richards, J.S. Targeted disruption of Pten in ovarian granulosa cells enhances ovulation and extends the life span of luteal cells. Mol. Endocrinol. 2008, 22, 2128–2140. [Google Scholar] [CrossRef] [PubMed]
- Schmitz, M.; Grignard, G.; Margue, C.; Dippel, W.; Capesius, C.; Mossong, J.; Nathan, M.; Giacchi, S.; Scheiden, R.; Kieffer, N. Complete loss of PTEN expression as a possible early prognostic marker for prostate cancer metastasis. Int. J. Cancer 2007, 120, 1284–1292. [Google Scholar] [CrossRef] [PubMed]
- Yan, W.; Fu, Y.; Tian, D.; Liao, J.; Liu, M.; Wang, B.; Xia, L.; Zhu, Q.; Luo, M. PI3 kinase/Akt signaling mediates epithelial–mesenchymal transition in hypoxic hepatocellular carcinoma cells. Biochem. Biophys. Res. Commun. 2009, 382, 631–636. [Google Scholar] [CrossRef] [PubMed]
- Altomare, D.A.; Wang, H.Q.; Skele, K.L.; Rienzo, A.D.; Klein-Szanto, A.J.; Godwin, A.K.; Testa, J.R. AKT and mTOR phosphorylation is frequently detected in ovarian cancer and can be targeted to disrupt ovarian tumor cell growth. Oncogene 2004, 23, 5853–5857. [Google Scholar] [CrossRef]
- Ringel, M.D.; Hayre, N.; Saito, J.; Saunier, B.; Schuppert, F.; Burch, H.; Bernet, V.; Burman, K.D.; Kohn, L.D.; Saji, M. Overexpression and overactivation of Akt in thyroid carcinoma. Cancer Res. 2001, 61, 6105–6111. [Google Scholar] [PubMed]
- Liao, Y.; Grobholz, R.; Abel, U.; Trojan, L.; Michel, M.S.; Angel, P.; Mayer, D. Increase of AKT/PKB expression correlates with gleason pattern in human prostate cancer. Int. J. Cancer 2003, 107, 676–680. [Google Scholar] [CrossRef]
- Wang, S.E.; Shin, I.; Wu, F.Y.; Friedman, D.B.; Arteaga, C.L. HER2/Neu (ErbB2) signaling to Rac1-Pak1 is temporally and spatially modulated by transforming growth factor β. Cancer Res. 2006, 66, 9591–9600. [Google Scholar] [CrossRef]
- Saddoughi, S.A.; Song, P.; Ogretmen, B. Roles of bioactive sphingolipids in cancer biology and therapeutics. In Lipids in Health and Disease; Springer: Berlin/Heidelberg, Germany, 2008; pp. 413–440. [Google Scholar]
- Wang, M.-T.; Honn, K.V.; Nie, D. Cyclooxygenases, prostanoids, and tumor progression. Cancer Metastasis Rev. 2007, 26, 525–534. [Google Scholar] [CrossRef]
- Sutphen, R.; Xu, Y.; Wilbanks, G.D.; Fiorica, J.; Grendys Jr, E.C.; LaPolla, J.P.; Arango, H.; Hoffman, M.S.; Martino, M.; Wakeley, K. Lysophospholipids are potential biomarkers of ovarian cancer. Cancer Epidemiol. Biomark. Prev. 2004, 13, 1185–1191. [Google Scholar] [CrossRef]
- Xu, Y.; Shen, Z.; Wiper, D.W.; Wu, M.; Morton, R.E.; Elson, P.; Kennedy, A.W.; Belinson, J.; Markman, M.; Casey, G. Lysophosphatidic acid as a potential biomarker for ovarian and other gynecologic cancers. JAMA 1998, 280, 719–723. [Google Scholar] [CrossRef] [PubMed]
- Meleh, M.; Požlep, B.; Mlakar, A.; Meden-Vrtovec, H.; Zupančič-Kralj, L. Determination of serum lysophosphatidic acid as a potential biomarker for ovarian cancer. J. Chromatogr. B 2007, 858, 287–291. [Google Scholar] [CrossRef] [PubMed]
- Nava, V.E.; Hobson, J.P.; Murthy, S.; Milstien, S.; Spiegel, S. Sphingosine kinase type 1 promotes estrogen-dependent tumorigenesis of breast cancer MCF-7 cells. Exp. Cell Res. 2002, 281, 115–127. [Google Scholar] [CrossRef] [PubMed]
- Sarkar, S.; Maceyka, M.; Hait, N.C.; Paugh, S.W.; Sankala, H.; Milstien, S.; Spiegel, S. Sphingosine kinase 1 is required for migration, proliferation and survival of MCF-7 human breast cancer cells. FEBS Lett. 2005, 579, 5313–5317. [Google Scholar] [CrossRef]
- Van Brocklyn, J.R.; Letterle, C.A.; Snyder, P.J.; Prior, T.W. Sphingosine-1-phosphate stimulates human glioma cell proliferation through Gi-coupled receptors: Role of ERK MAP kinase and phosphatidylinositol 3-kinase β. Cancer Lett. 2002, 181, 195–204. [Google Scholar] [CrossRef] [PubMed]
- Tilly, J.L.; Kolesnick, R.N. Sphingolipids, apoptosis, cancer treatments and the ovary: Investigating a crime against female fertility. Biochim. Biophys. Acta (BBA)-Mol. Cell Biol. Lipids 2002, 1585, 135–138. [Google Scholar] [CrossRef]
- Ilic, D.; Djulbegovic, M.; Jung, J.H.; Hwang, E.C.; Zhou, Q.; Cleves, A.; Agoritsas, T.; Dahm, P. Prostate cancer screening with prostate-specific antigen (PSA) test: A systematic review and meta-analysis. BMJ 2018, 362, k3519. [Google Scholar] [CrossRef]
- Hewitson, P.; Glasziou, P.; Watson, E.; Towler, B.; Irwig, L. Cochrane systematic review of colorectal cancer screening using the fecal occult blood test (hemoccult): An update. Off. J. Am. Coll. Gastroenterol.|ACG 2008, 103, 1541–1549. [Google Scholar] [CrossRef]
- Hao, C.; Zhang, G.; Zhang, L. Serum CEA levels in 49 different types of cancer and noncancer diseases. Prog. Mol. Biol. Transl. Sci. 2019, 162, 213–227. [Google Scholar]
- Nossov, V.; Amneus, M.; Su, F.; Lang, J.; Janco, J.M.T.; Reddy, S.T.; Farias-Eisner, R. The early detection of ovarian cancer: From traditional methods to proteomics. Can we really do better than serum CA-125? Am. J. Obstet. Gynecol. 2008, 199, 215–223. [Google Scholar] [CrossRef] [PubMed]
- Kaufman, H.W.; Alagia, D.P.; Chen, Z.; Onisko, A.; Austin, R.M. Contributions of liquid-based (Papanicolaou) cytology and human papillomavirus testing in cotesting for detection of cervical cancer and precancer in the United States. Am. J. Clin. Pathol. 2020, 154, 510–516. [Google Scholar] [CrossRef]
- Tang, J.; Rangayyan, R.M.; Xu, J.; El Naqa, I.; Yang, Y. Computer-aided detection and diagnosis of breast cancer with mammography: Recent advances. IEEE Trans. Inf. Technol. Biomed. 2009, 13, 236–251. [Google Scholar] [CrossRef] [PubMed]
- Bhushan, A.; Gonsalves, A.; Menon, J.U. Current state of breast cancer diagnosis, treatment, and theranostics. Pharmaceutics 2021, 13, 723. [Google Scholar] [CrossRef] [PubMed]
- Monaco, S.E.; Wu, Y.; Teot, L.A.; Cai, G. Assessment of estrogen receptor (ER), progesterone receptor (PR), and human epidermal growth factor receptor 2 (HER2) status in the fine needle aspirates of metastatic breast carcinomas. Diagn. Cytopathol. 2013, 41, 308–315. [Google Scholar] [CrossRef] [PubMed]
- Cidado, J.; Wong, H.Y.; Rosen, D.M.; Cimino-Mathews, A.; Garay, J.P.; Fessler, A.G.; Rasheed, Z.A.; Hicks, J.; Cochran, R.L.; Croessmann, S. Ki-67 is required for maintenance of cancer stem cells but not cell proliferation. Oncotarget 2016, 7, 6281. [Google Scholar] [CrossRef]
- Ishibe, N.; Schully, S.; Freedman, A.; Ramsey, S.D. Use of Oncotype DX in women with node-positive breast cancer. PLoS Curr. 2011, 3, RRN1249. [Google Scholar] [CrossRef] [PubMed]
- Sahin, I.H.; Akce, M.; Alese, O.; Shaib, W.; Lesinski, G.B.; El-Rayes, B.; Wu, C. Immune checkpoint inhibitors for the treatment of MSI-H/MMR-D colorectal cancer and a perspective on resistance mechanisms. Br. J. Cancer 2019, 121, 809–818. [Google Scholar] [CrossRef]
- Hall, C.; Clarke, L.; Pal, A.; Buchwald, P.; Eglinton, T.; Wakeman, C.; Frizelle, F. A review of the role of carcinoembryonic antigen in clinical practice. Ann. Coloproctol. 2019, 35, 294. [Google Scholar] [CrossRef]
- Morris, V.; Overman, M.J.; Jiang, Z.-Q.; Garrett, C.; Agarwal, S.; Eng, C.; Kee, B.; Fogelman, D.; Dasari, A.; Wolff, R. Progression-free survival remains poor over sequential lines of systemic therapy in patients with BRAF-mutated colorectal cancer. Clin. Color. Cancer 2014, 13, 164–171. [Google Scholar] [CrossRef]
- Lin, A.; Wei, T.; Meng, H.; Luo, P.; Zhang, J. Role of the dynamic tumor microenvironment in controversies regarding immune checkpoint inhibitors for the treatment of non-small cell lung cancer (NSCLC) with EGFR mutations. Mol. Cancer 2019, 18, 139. [Google Scholar] [CrossRef] [PubMed]
- Awad, M.M.; Shaw, A.T. ALK inhibitors in non–small cell lung cancer: Crizotinib and beyond. Clin. Adv. Hematol. Oncol. HO 2014, 12, 429. [Google Scholar]
- Uruga, H.; Mino-Kenudson, M. Predictive biomarkers for response to immune checkpoint inhibitors in lung cancer: PD-L1 and beyond. Virchows Arch. 2021, 478, 31–44. [Google Scholar] [CrossRef] [PubMed]
- Tikkinen, K.A.; Dahm, P.; Lytvyn, L.; Heen, A.F.; Vernooij, R.W.; Siemieniuk, R.A.; Wheeler, R.; Vaughan, B.; Fobuzi, A.C.; Blanker, M.H. Prostate cancer screening with prostate-specific antigen (PSA) test: A clinical practice guideline. BMJ 2018, 362, k3581. [Google Scholar] [CrossRef] [PubMed]
- Wulczyn, E.; Nagpal, K.; Symonds, M.; Moran, M.; Plass, M.; Reihs, R.; Nader, F.; Tan, F.; Cai, Y.; Brown, T. Predicting prostate cancer specific-mortality with artificial intelligence-based Gleason grading. Commun. Med. 2021, 1, 10. [Google Scholar] [CrossRef] [PubMed]
- De Laere, B.; van Dam, P.-J.; Whitington, T.; Mayrhofer, M.; Diaz, E.H.; Van den Eynden, G.; Vandebroek, J.; Del-Favero, J.; Van Laere, S.; Dirix, L. Comprehensive profiling of the androgen receptor in liquid biopsies from castration-resistant prostate cancer reveals novel intra-AR structural variation and splice variant expression patterns. Eur. Urol. 2017, 72, 192–200. [Google Scholar] [CrossRef] [PubMed]
- Dauphine, C.; Moazzez, A.; Neal, J.C.; Chlebowski, R.T.; Ozao-Choy, J. Single hormone receptor-positive breast cancers have distinct characteristics and survival. Ann. Surg. Oncol. 2020, 27, 4687–4694. [Google Scholar] [CrossRef] [PubMed]
- Elshazly, A.M.; Gewirtz, D.A. An overview of resistance to Human epidermal growth factor receptor 2 (Her2) targeted therapies in breast cancer. Cancer Drug Resist. 2022, 5, 472. [Google Scholar] [CrossRef]
- Humphrey, P.A. Gleason grading and prognostic factors in carcinoma of the prostate. Mod. Pathol. 2004, 17, 292–306. [Google Scholar] [CrossRef]
- Vickers, A.J.; Savage, C.; O’Brien, M.F.; Lilja, H. Systematic review of pretreatment prostate-specific antigen velocity and doubling time as predictors for prostate cancer. J. Clin. Oncol. 2009, 27, 398. [Google Scholar] [CrossRef]
- Jamaspishvili, T.; Berman, D.M.; Ross, A.E.; Scher, H.I.; De Marzo, A.M.; Squire, J.A.; Lotan, T.L. Clinical implications of PTEN loss in prostate cancer. Nat. Rev. Urol. 2018, 15, 222–234. [Google Scholar] [CrossRef]
- Arrington, A.K.; Heinrich, E.L.; Lee, W.; Duldulao, M.; Patel, S.; Sanchez, J.; Garcia-Aguilar, J.; Kim, J. Prognostic and predictive roles of KRAS mutation in colorectal cancer. Int. J. Mol. Sci. 2012, 13, 12153–12168. [Google Scholar] [CrossRef]
- Gajria, D.; Chandarlapaty, S. HER2-amplified breast cancer: Mechanisms of trastuzumab resistance and novel targeted therapies. Expert Rev. Anticancer Ther. 2011, 11, 263–275. [Google Scholar] [CrossRef]
- Harrison, P.T.; Vyse, S.; Huang, P.H. Rare epidermal growth factor receptor (EGFR) mutations in non-small cell lung cancer. Semin. Cancer Biol. 2020, 61, 167–179. [Google Scholar] [CrossRef]
- Camidge, D.R.; Kim, H.R.; Ahn, M.-J.; Yang, J.C.; Han, J.-Y.; Hochmair, M.J.; Lee, K.H.; Delmonte, A.; Campelo, M.R.G.; Kim, D.-W. Brigatinib versus crizotinib in ALK inhibitor–naive advanced ALK-positive NSCLC: Final results of phase 3 ALTA-1L trial. J. Thorac. Oncol. 2021, 16, 2091–2108. [Google Scholar] [CrossRef]
- André, T.; Cohen, R.; Salem, M.E. Immune checkpoint blockade therapy in patients with colorectal cancer harboring microsatellite instability/mismatch repair deficiency in 2022. Am. Soc. Clin. Oncol. Educ. Book 2022, 42, 233–241. [Google Scholar] [CrossRef]
- Grothey, A. Pembrolizumab in MSI-H-dMMR advanced colorectal cancer—A new standard of care. N. Engl. J. Med. 2020, 383, 2283–2285. [Google Scholar] [CrossRef]
- Cheng, L.; Lopez-Beltran, A.; Massari, F.; MacLennan, G.T.; Montironi, R. Molecular testing for BRAF mutations to inform melanoma treatment decisions: A move toward precision medicine. Mod. Pathol. 2018, 31, 24–38. [Google Scholar] [CrossRef]
- Roth, J.A.; Carlson, J.J. Prognostic Role of ERCC1 in Advanced Non–Small-Cell Lung Cancer: A Systematic Review and Meta-Analysis. Clin. Lung Cancer 2011, 12, 393–401. [Google Scholar] [CrossRef]
- Edge, S.B.; Compton, C.C. The American Joint Committee on Cancer: The 7th edition of the AJCC cancer staging manual and the future of TNM. Ann. Surg. Oncol. 2010, 17, 1471–1474. [Google Scholar] [CrossRef]
- Sabbatini, P.; Larson, S.; Kremer, A.; Zhang, Z.-F.; Sun, M.; Yeung, H.; Imbriaco, M.; Horak, I.; Conolly, M.; Ding, C. Prognostic significance of extent of disease in bone in patients with androgen-independent prostate cancer. J. Clin. Oncol. 1999, 17, 948. [Google Scholar] [CrossRef] [PubMed]
- National Collaborating Centre for Cancer. Familial Breast Cancer: Classification and Care of People at Risk of Familial Breast Cancer and Management of Breast Cancer and Related Risks in People with a Family History of Breast Cancer; National Collaborating Centre for Cancer: Cardiff, UK, 2013. [Google Scholar]
- Na, F.; Wang, J.; Li, C.; Deng, L.; Xue, J.; Lu, Y. Primary tumor standardized uptake value measured on F18-Fluorodeoxyglucose positron emission tomography is of prediction value for survival and local control in non–small-cell lung cancer receiving radiotherapy: Meta-analysis. J. Thorac. Oncol. 2014, 9, 834–842. [Google Scholar] [CrossRef]
- Pessoa, L.S.; Heringer, M.; Ferrer, V.P. ctDNA as a cancer biomarker: A broad overview. Crit. Rev. Oncol./Hematol. 2020, 155, 103109. [Google Scholar] [CrossRef]


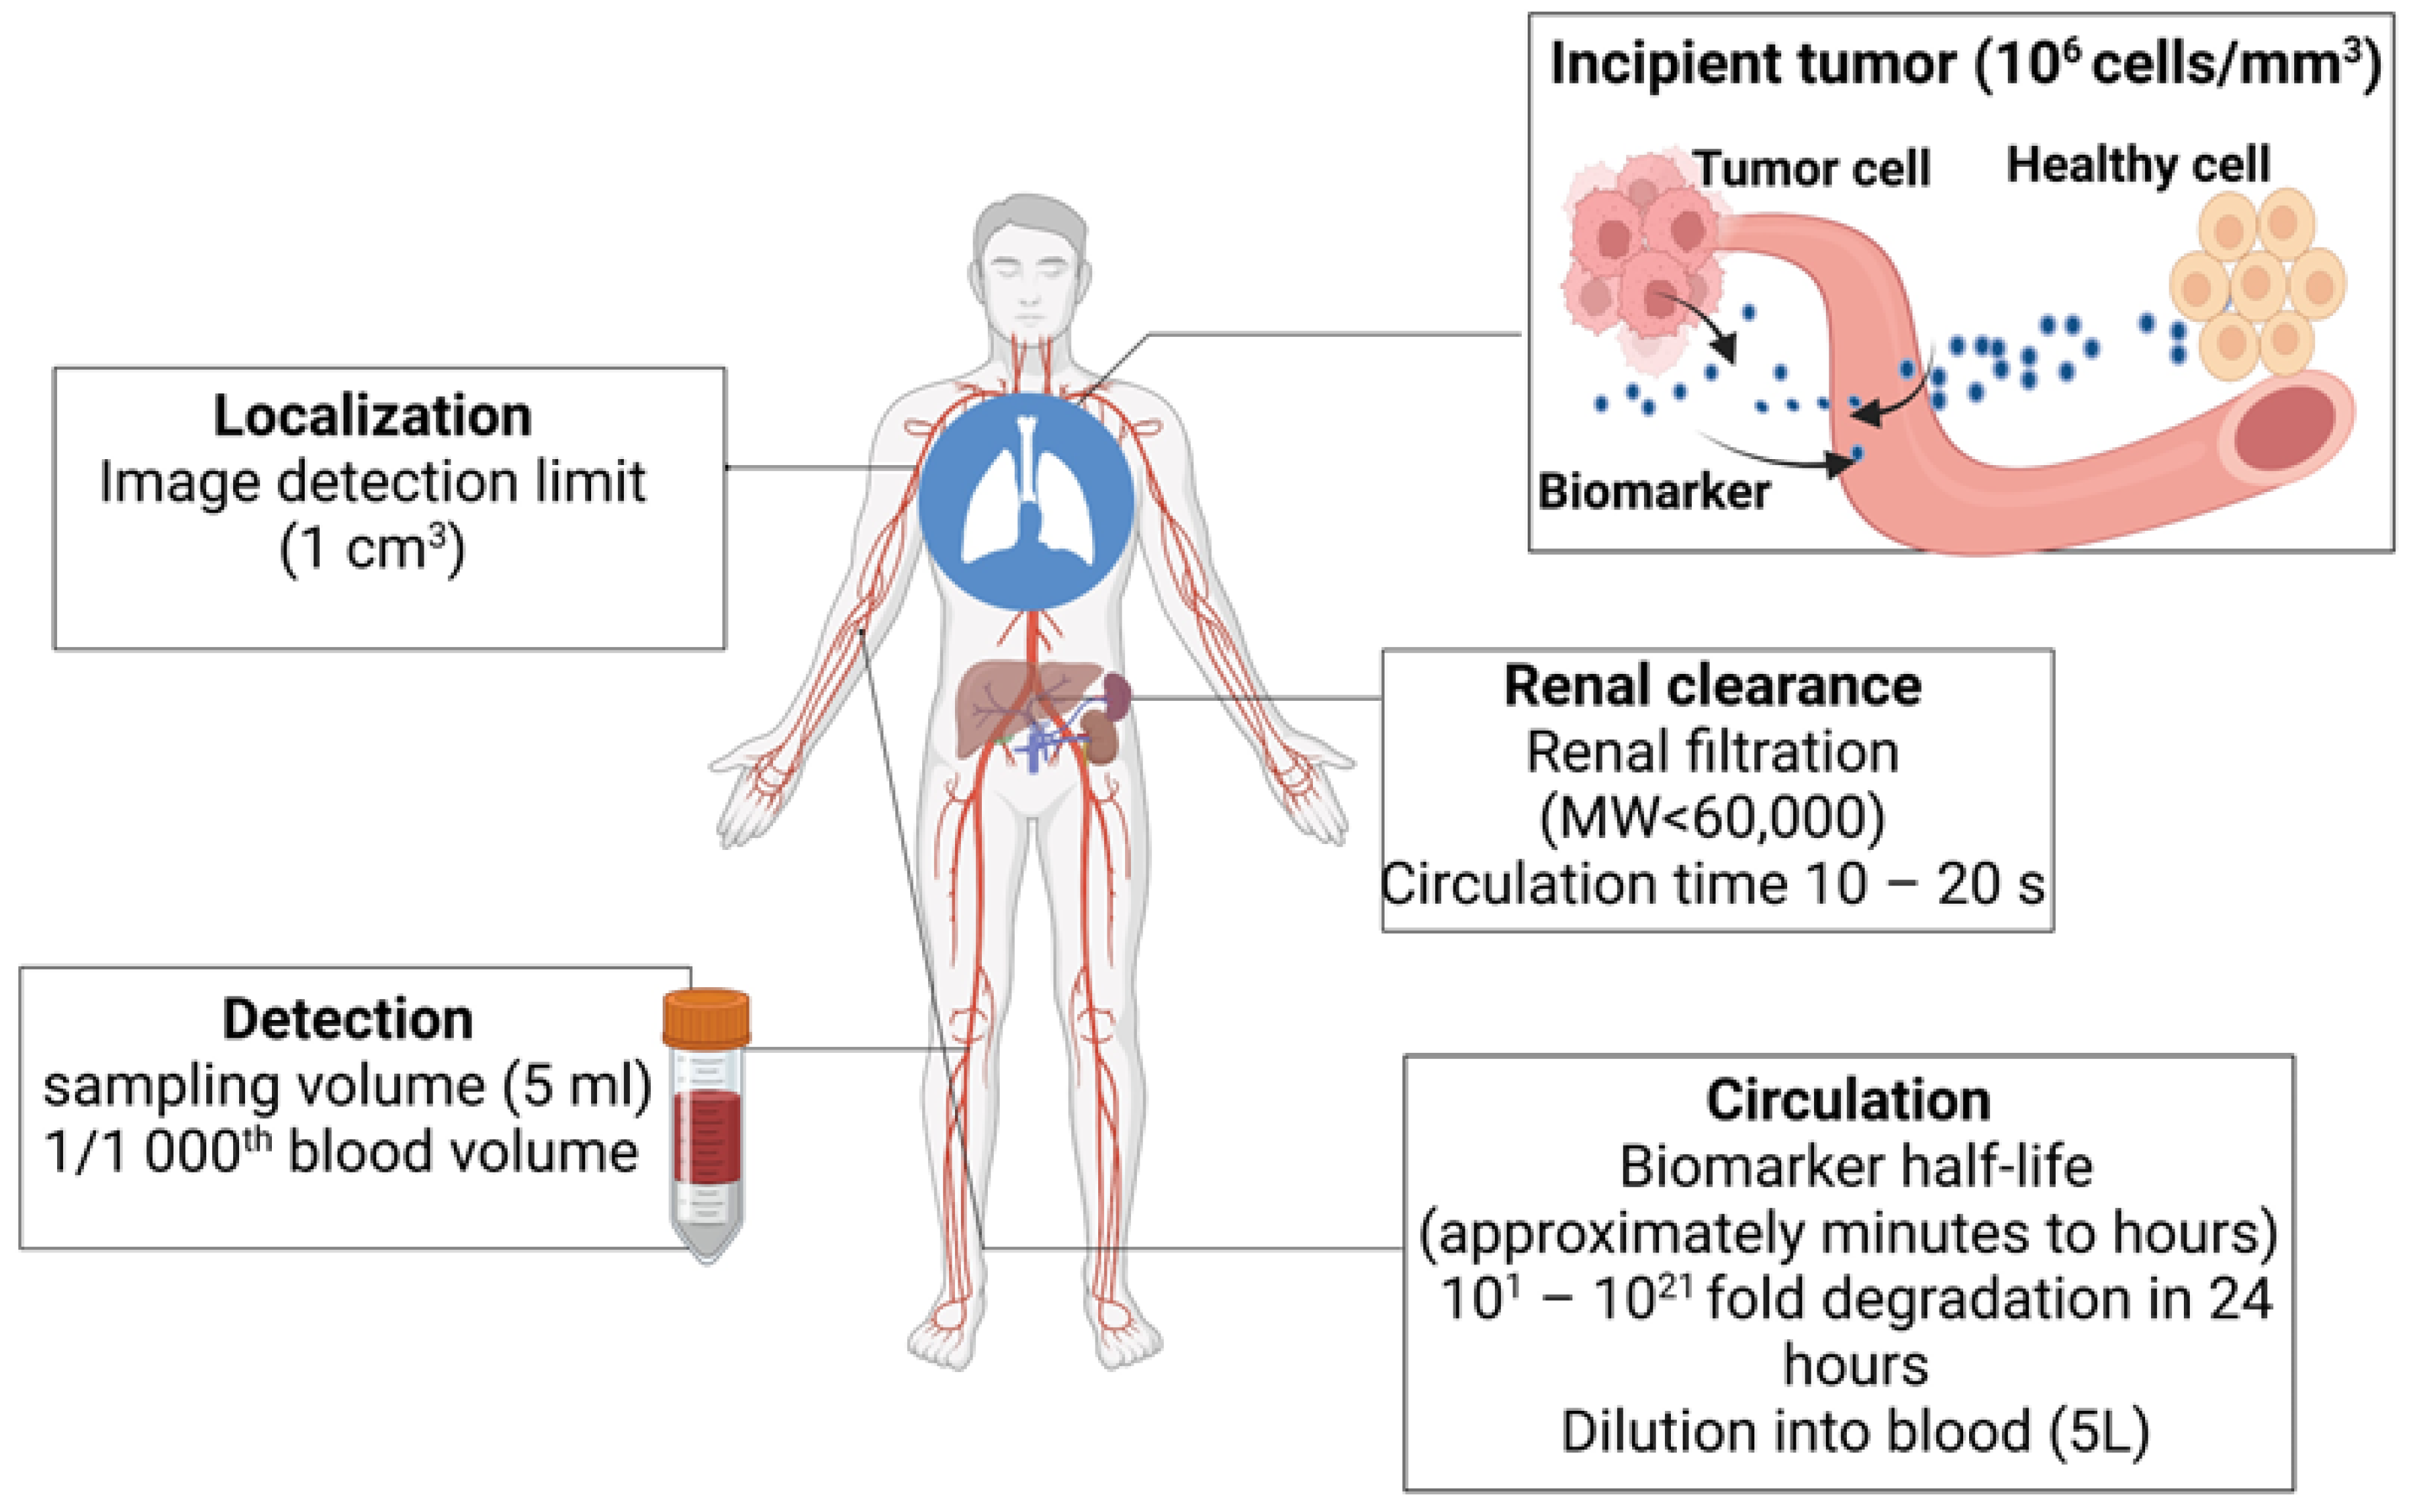
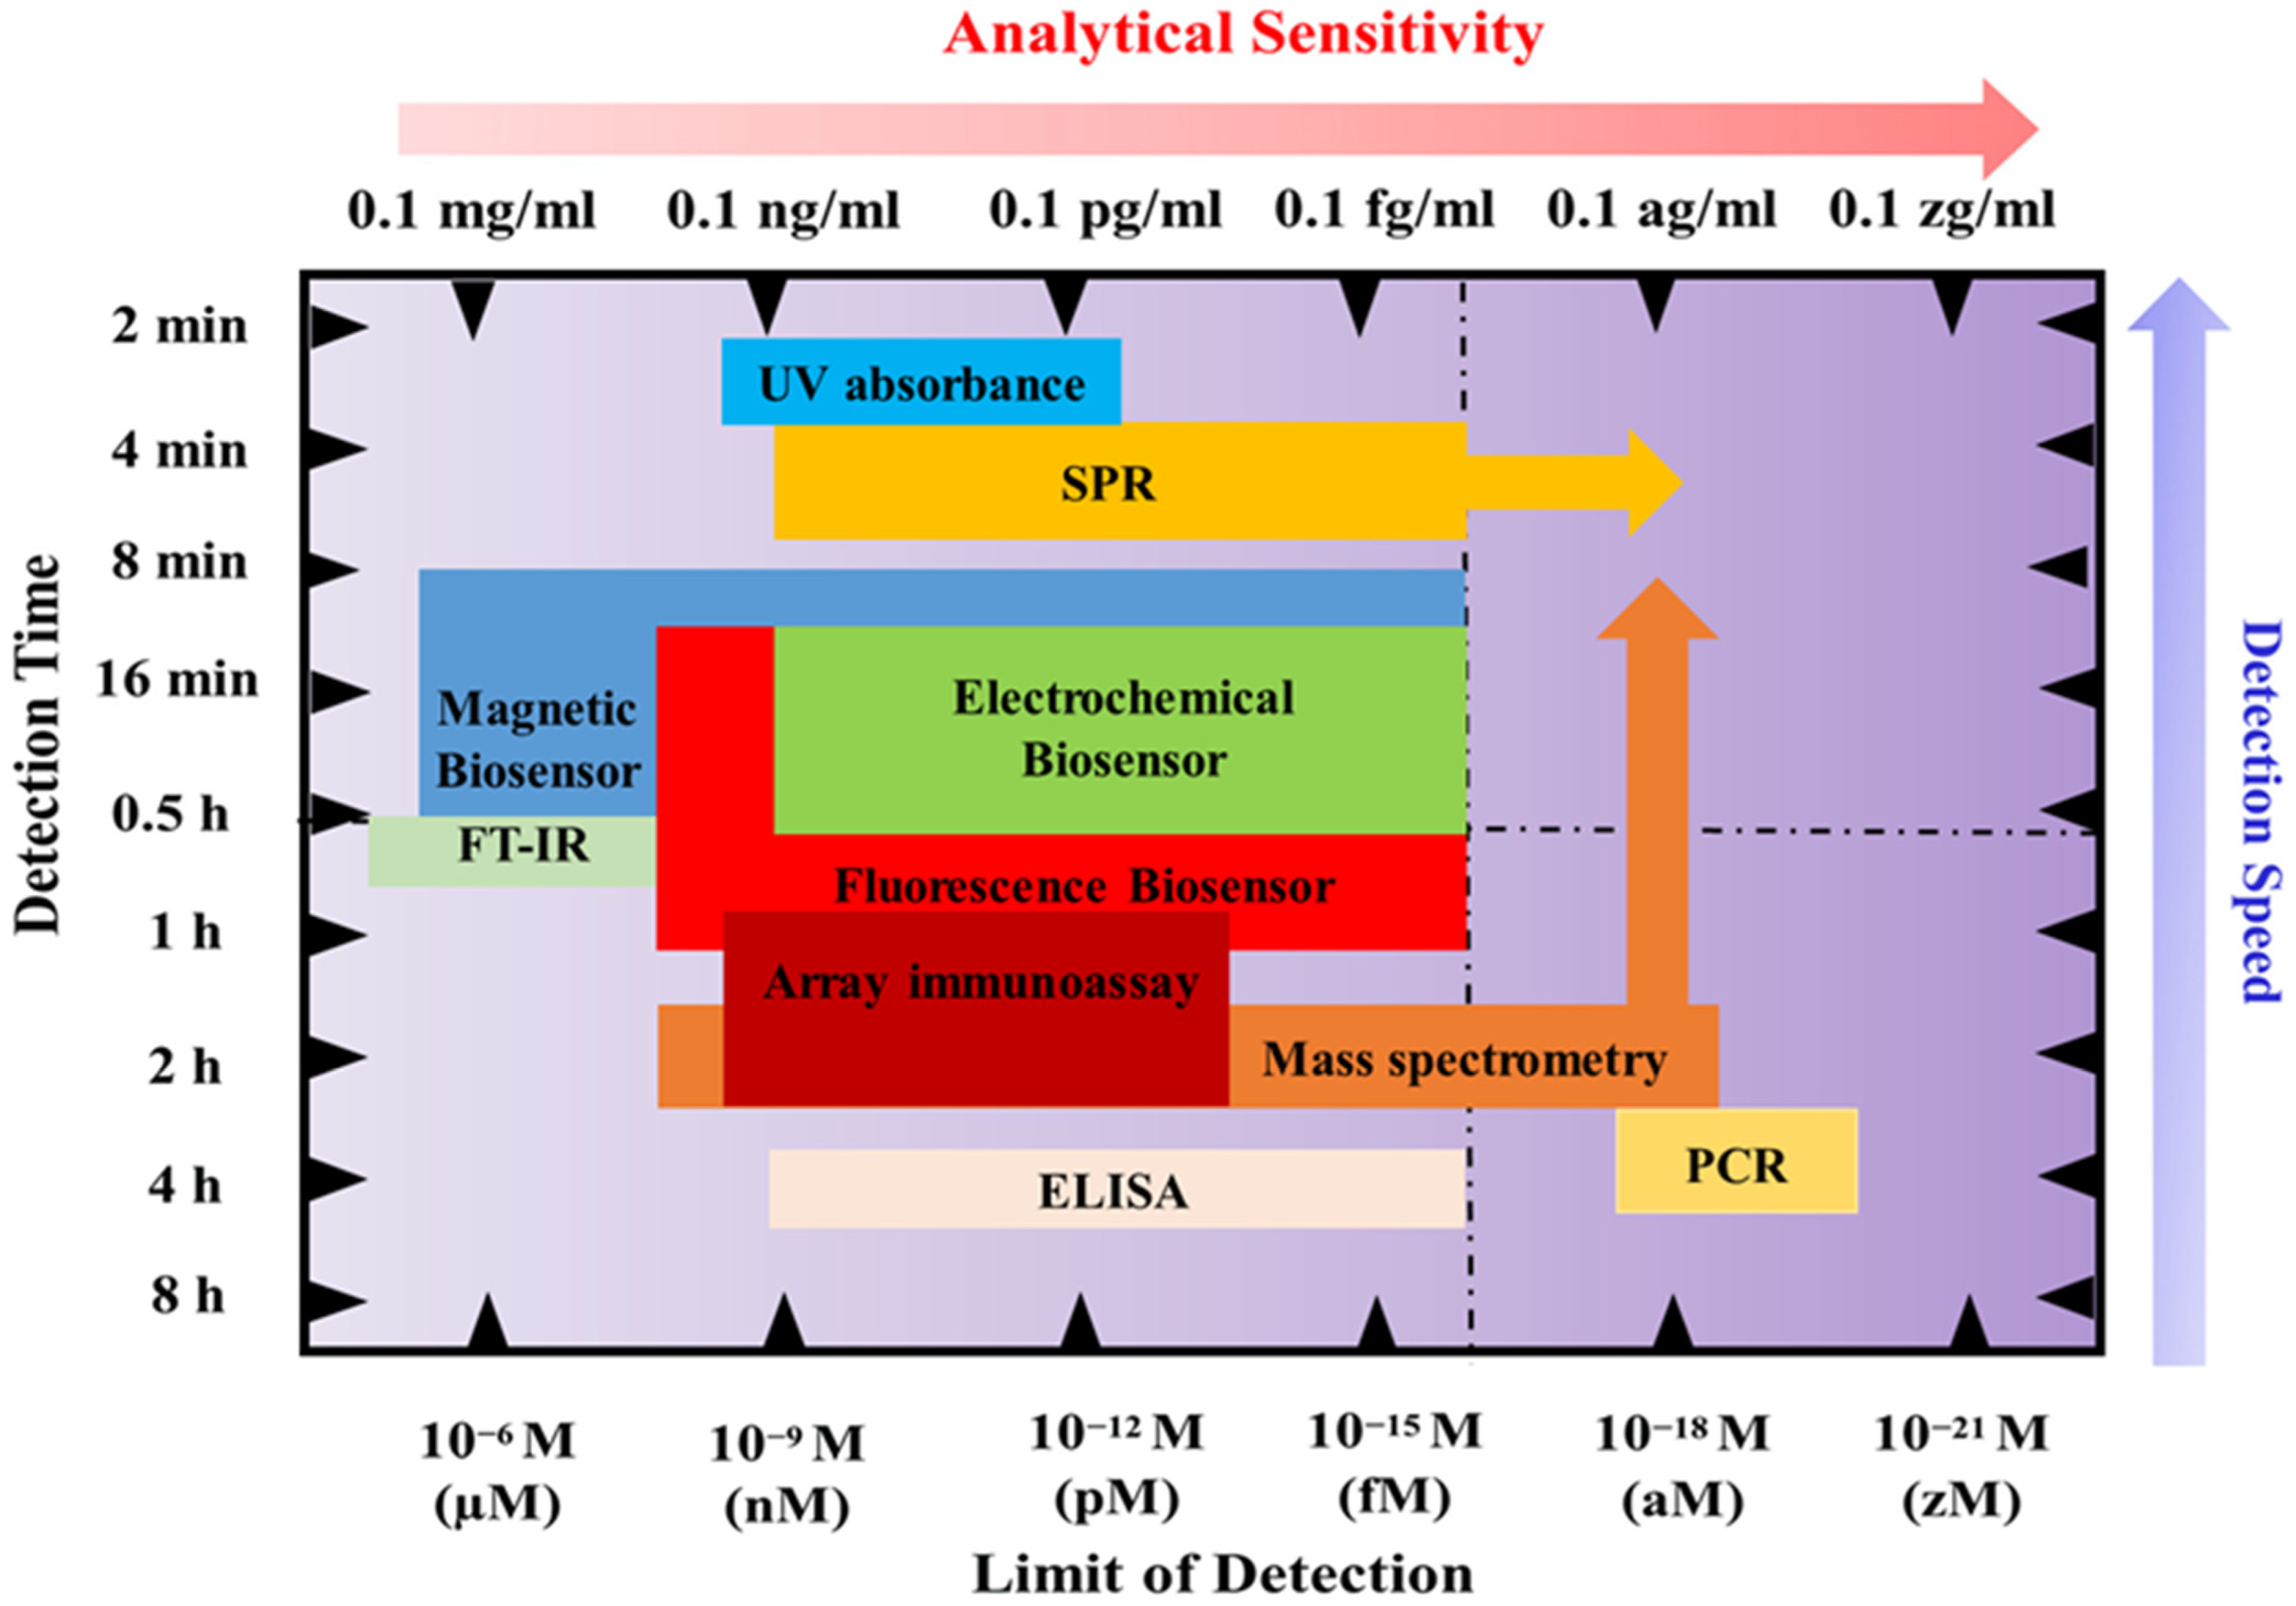
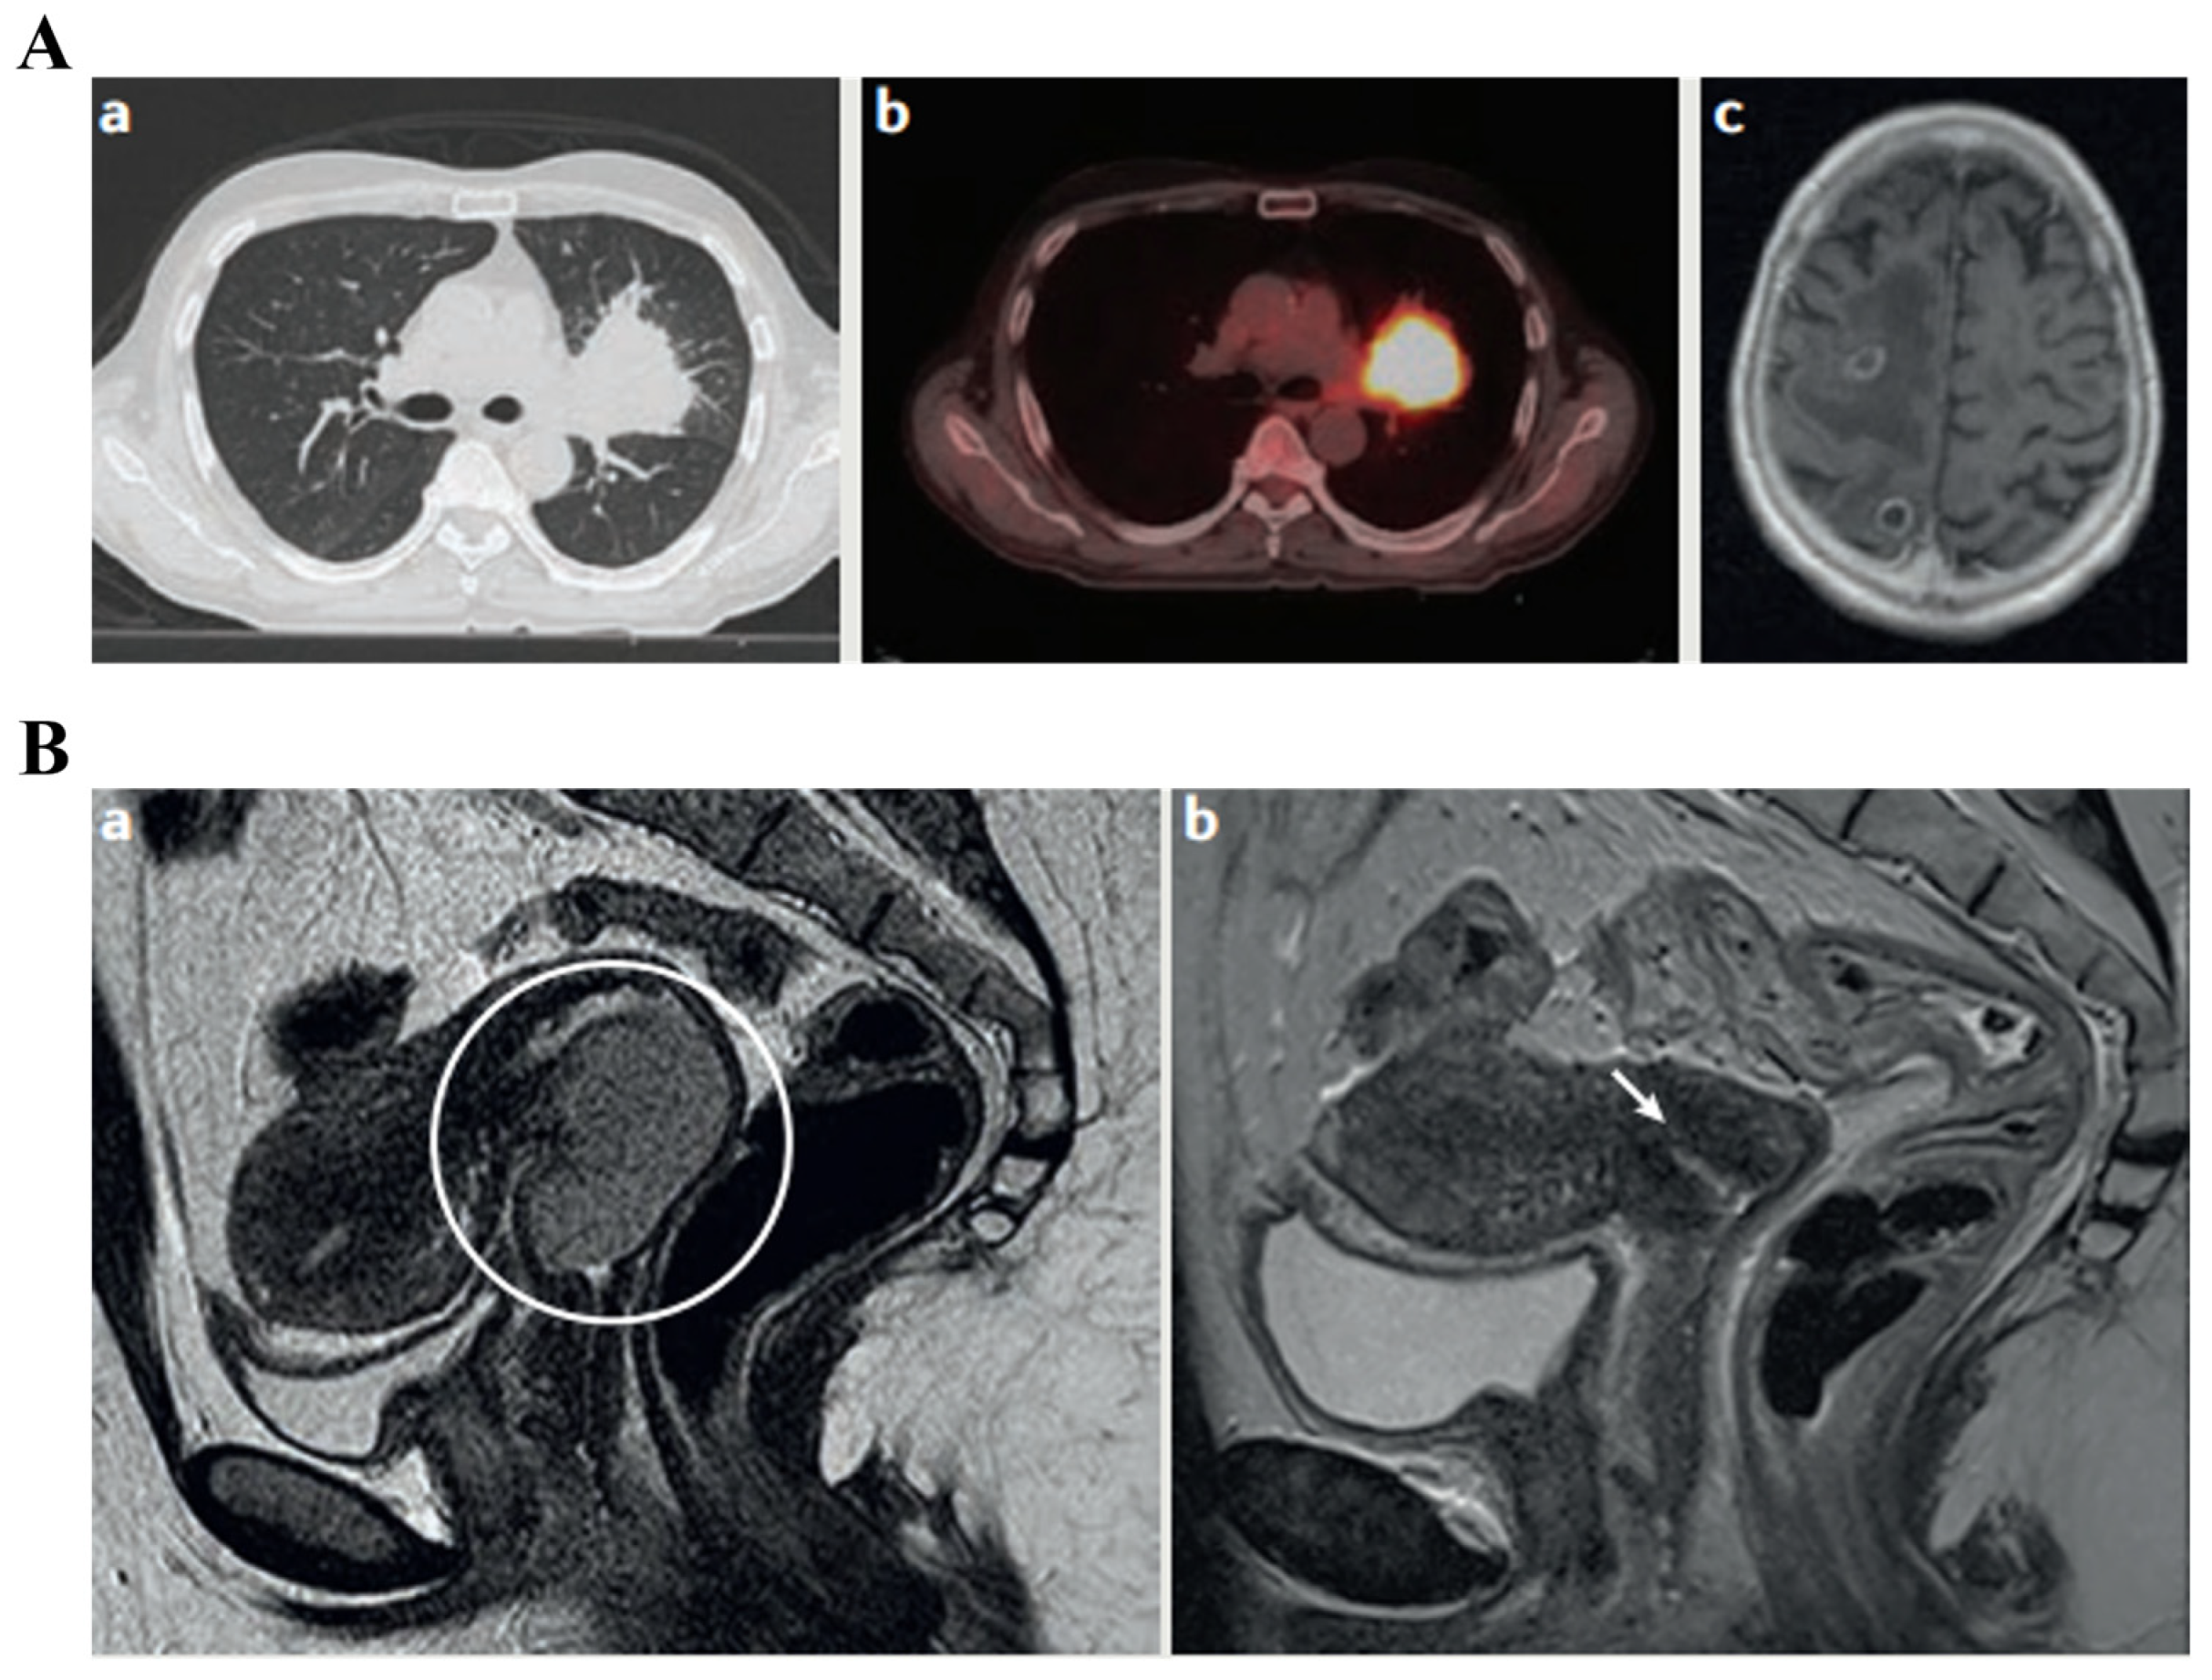
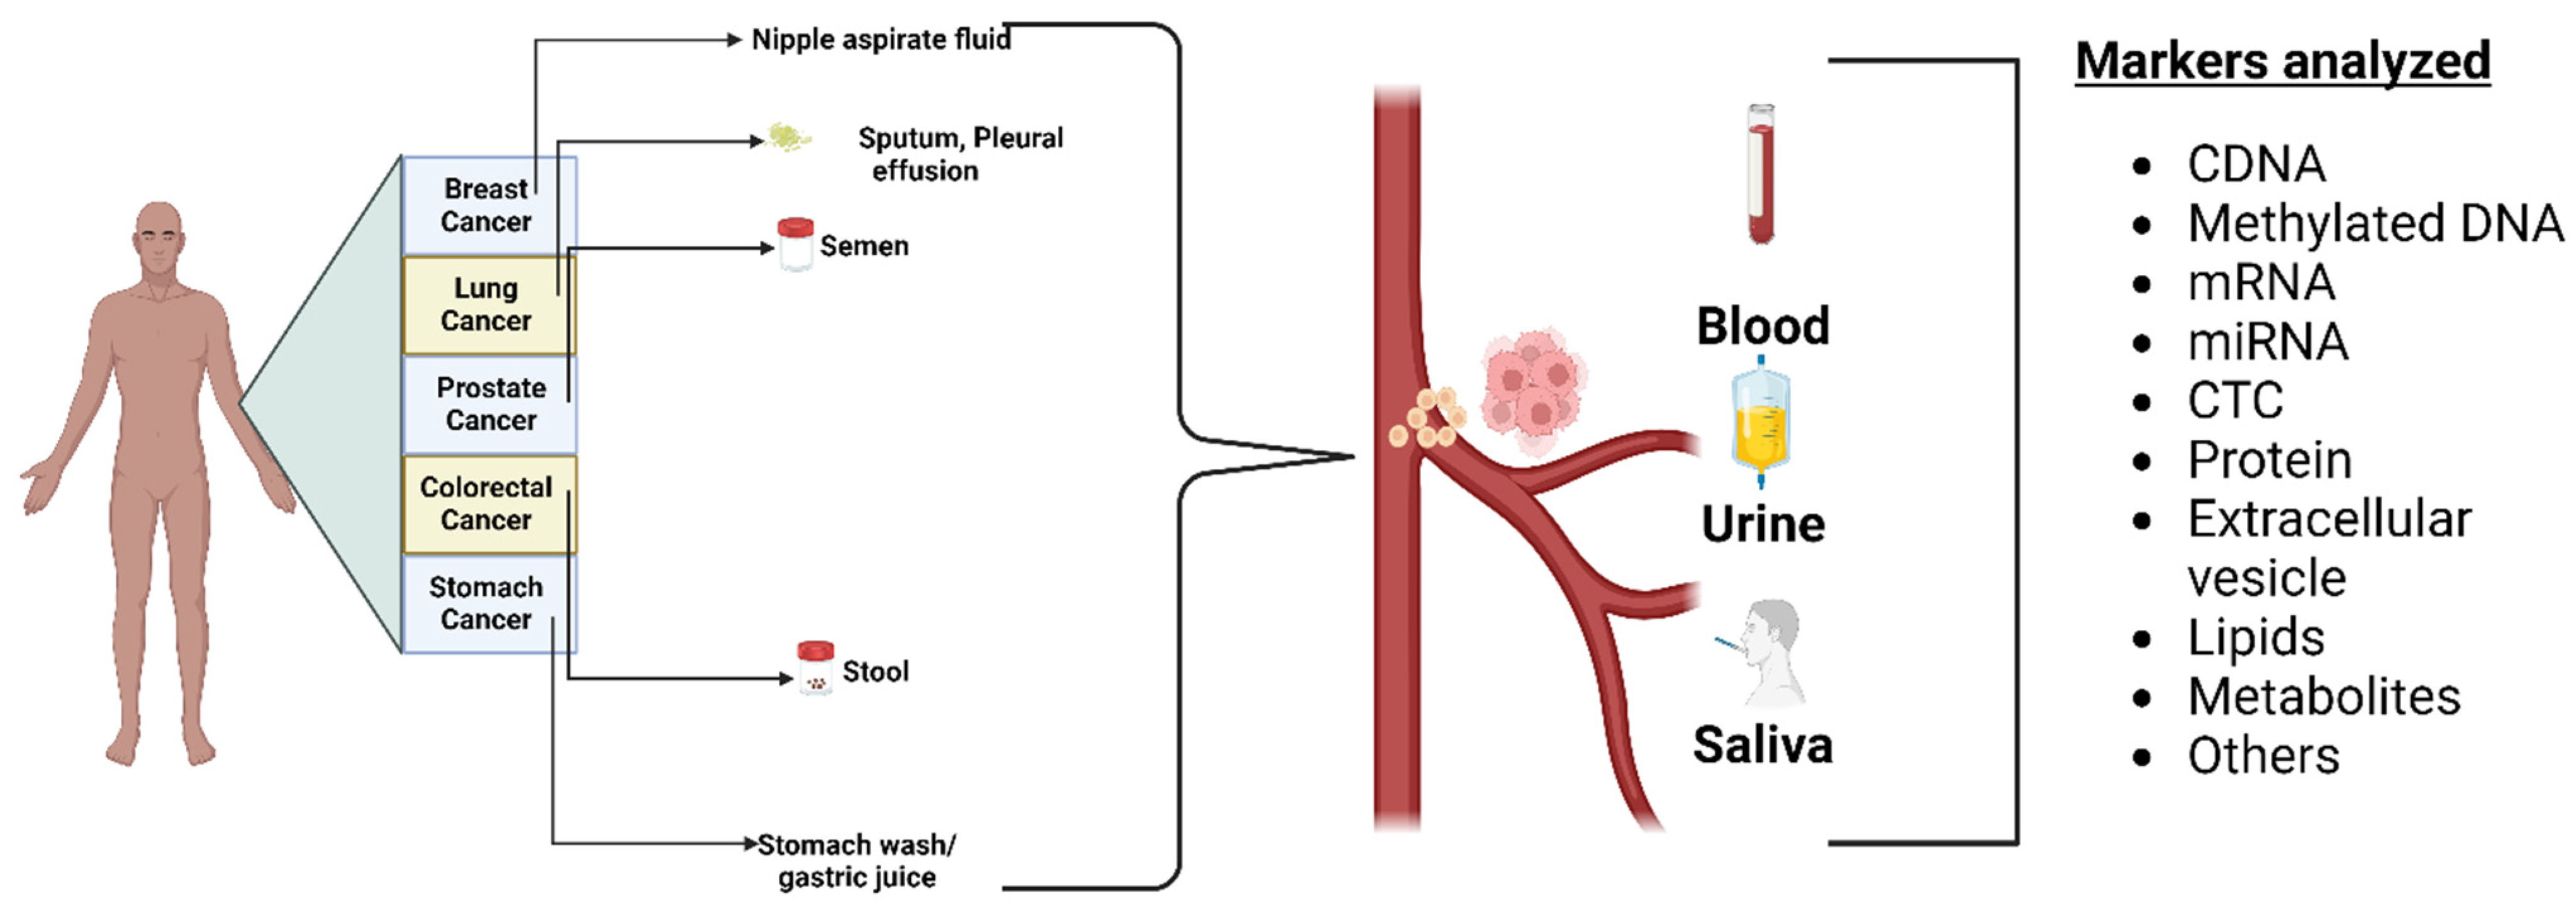
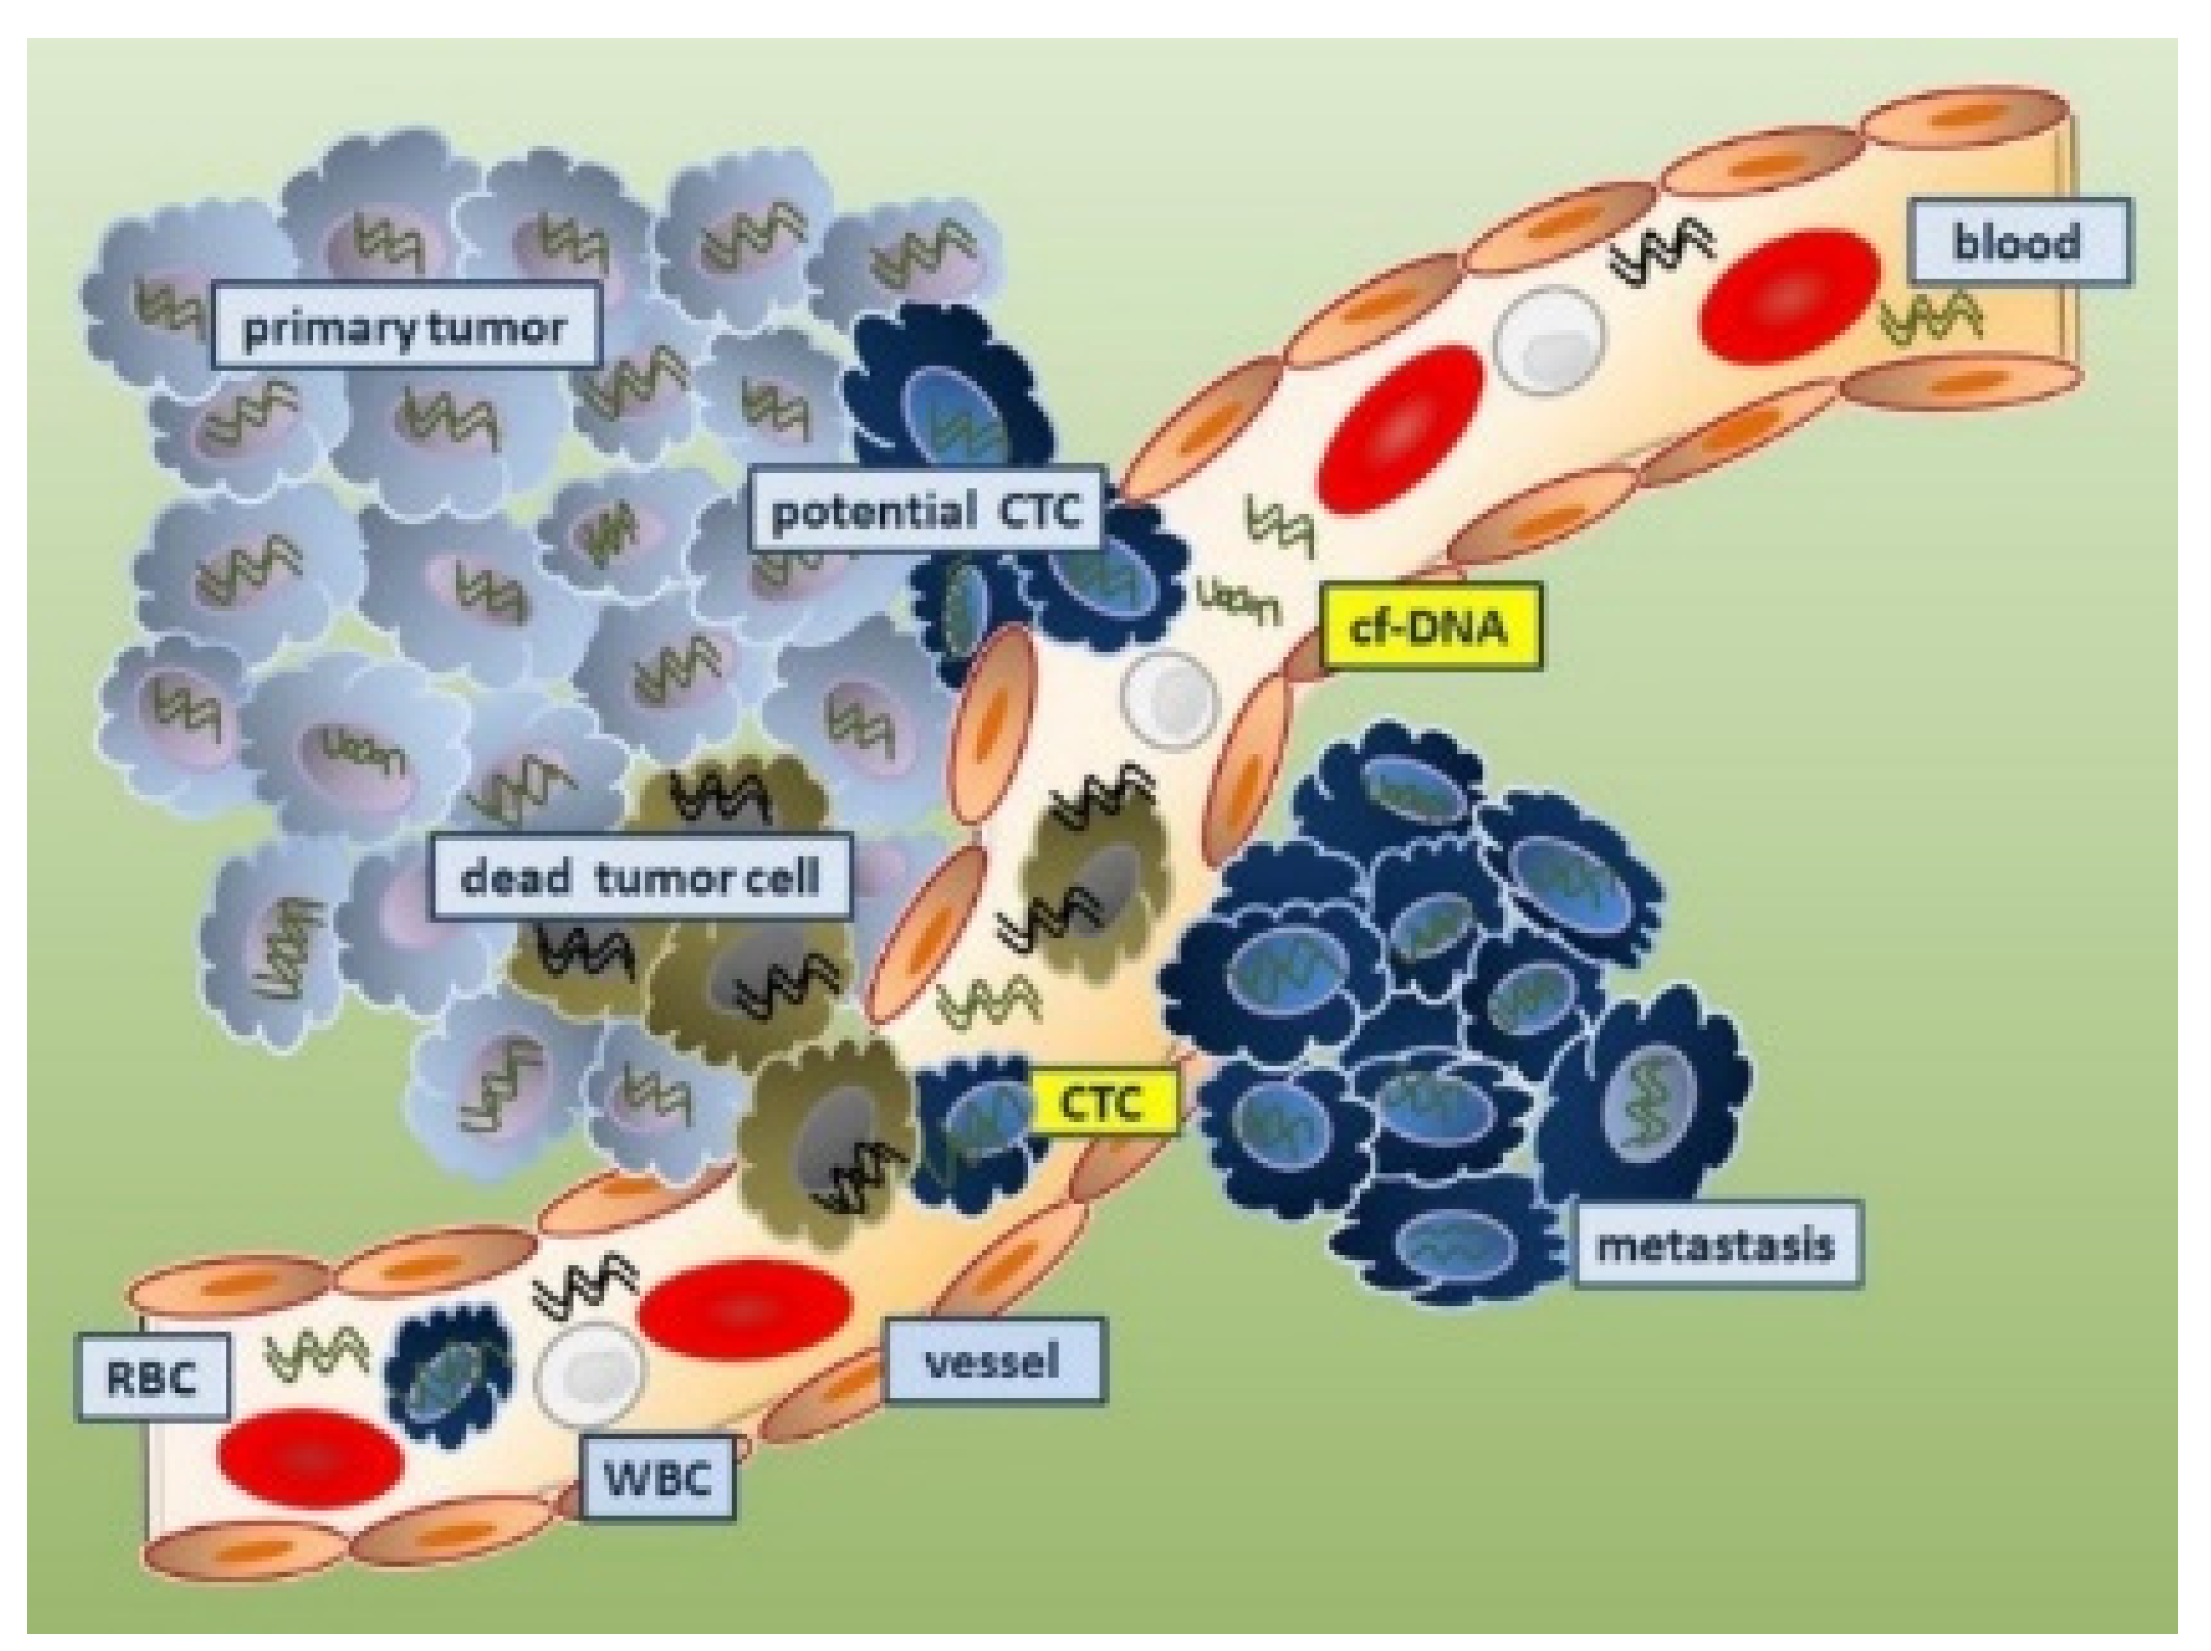
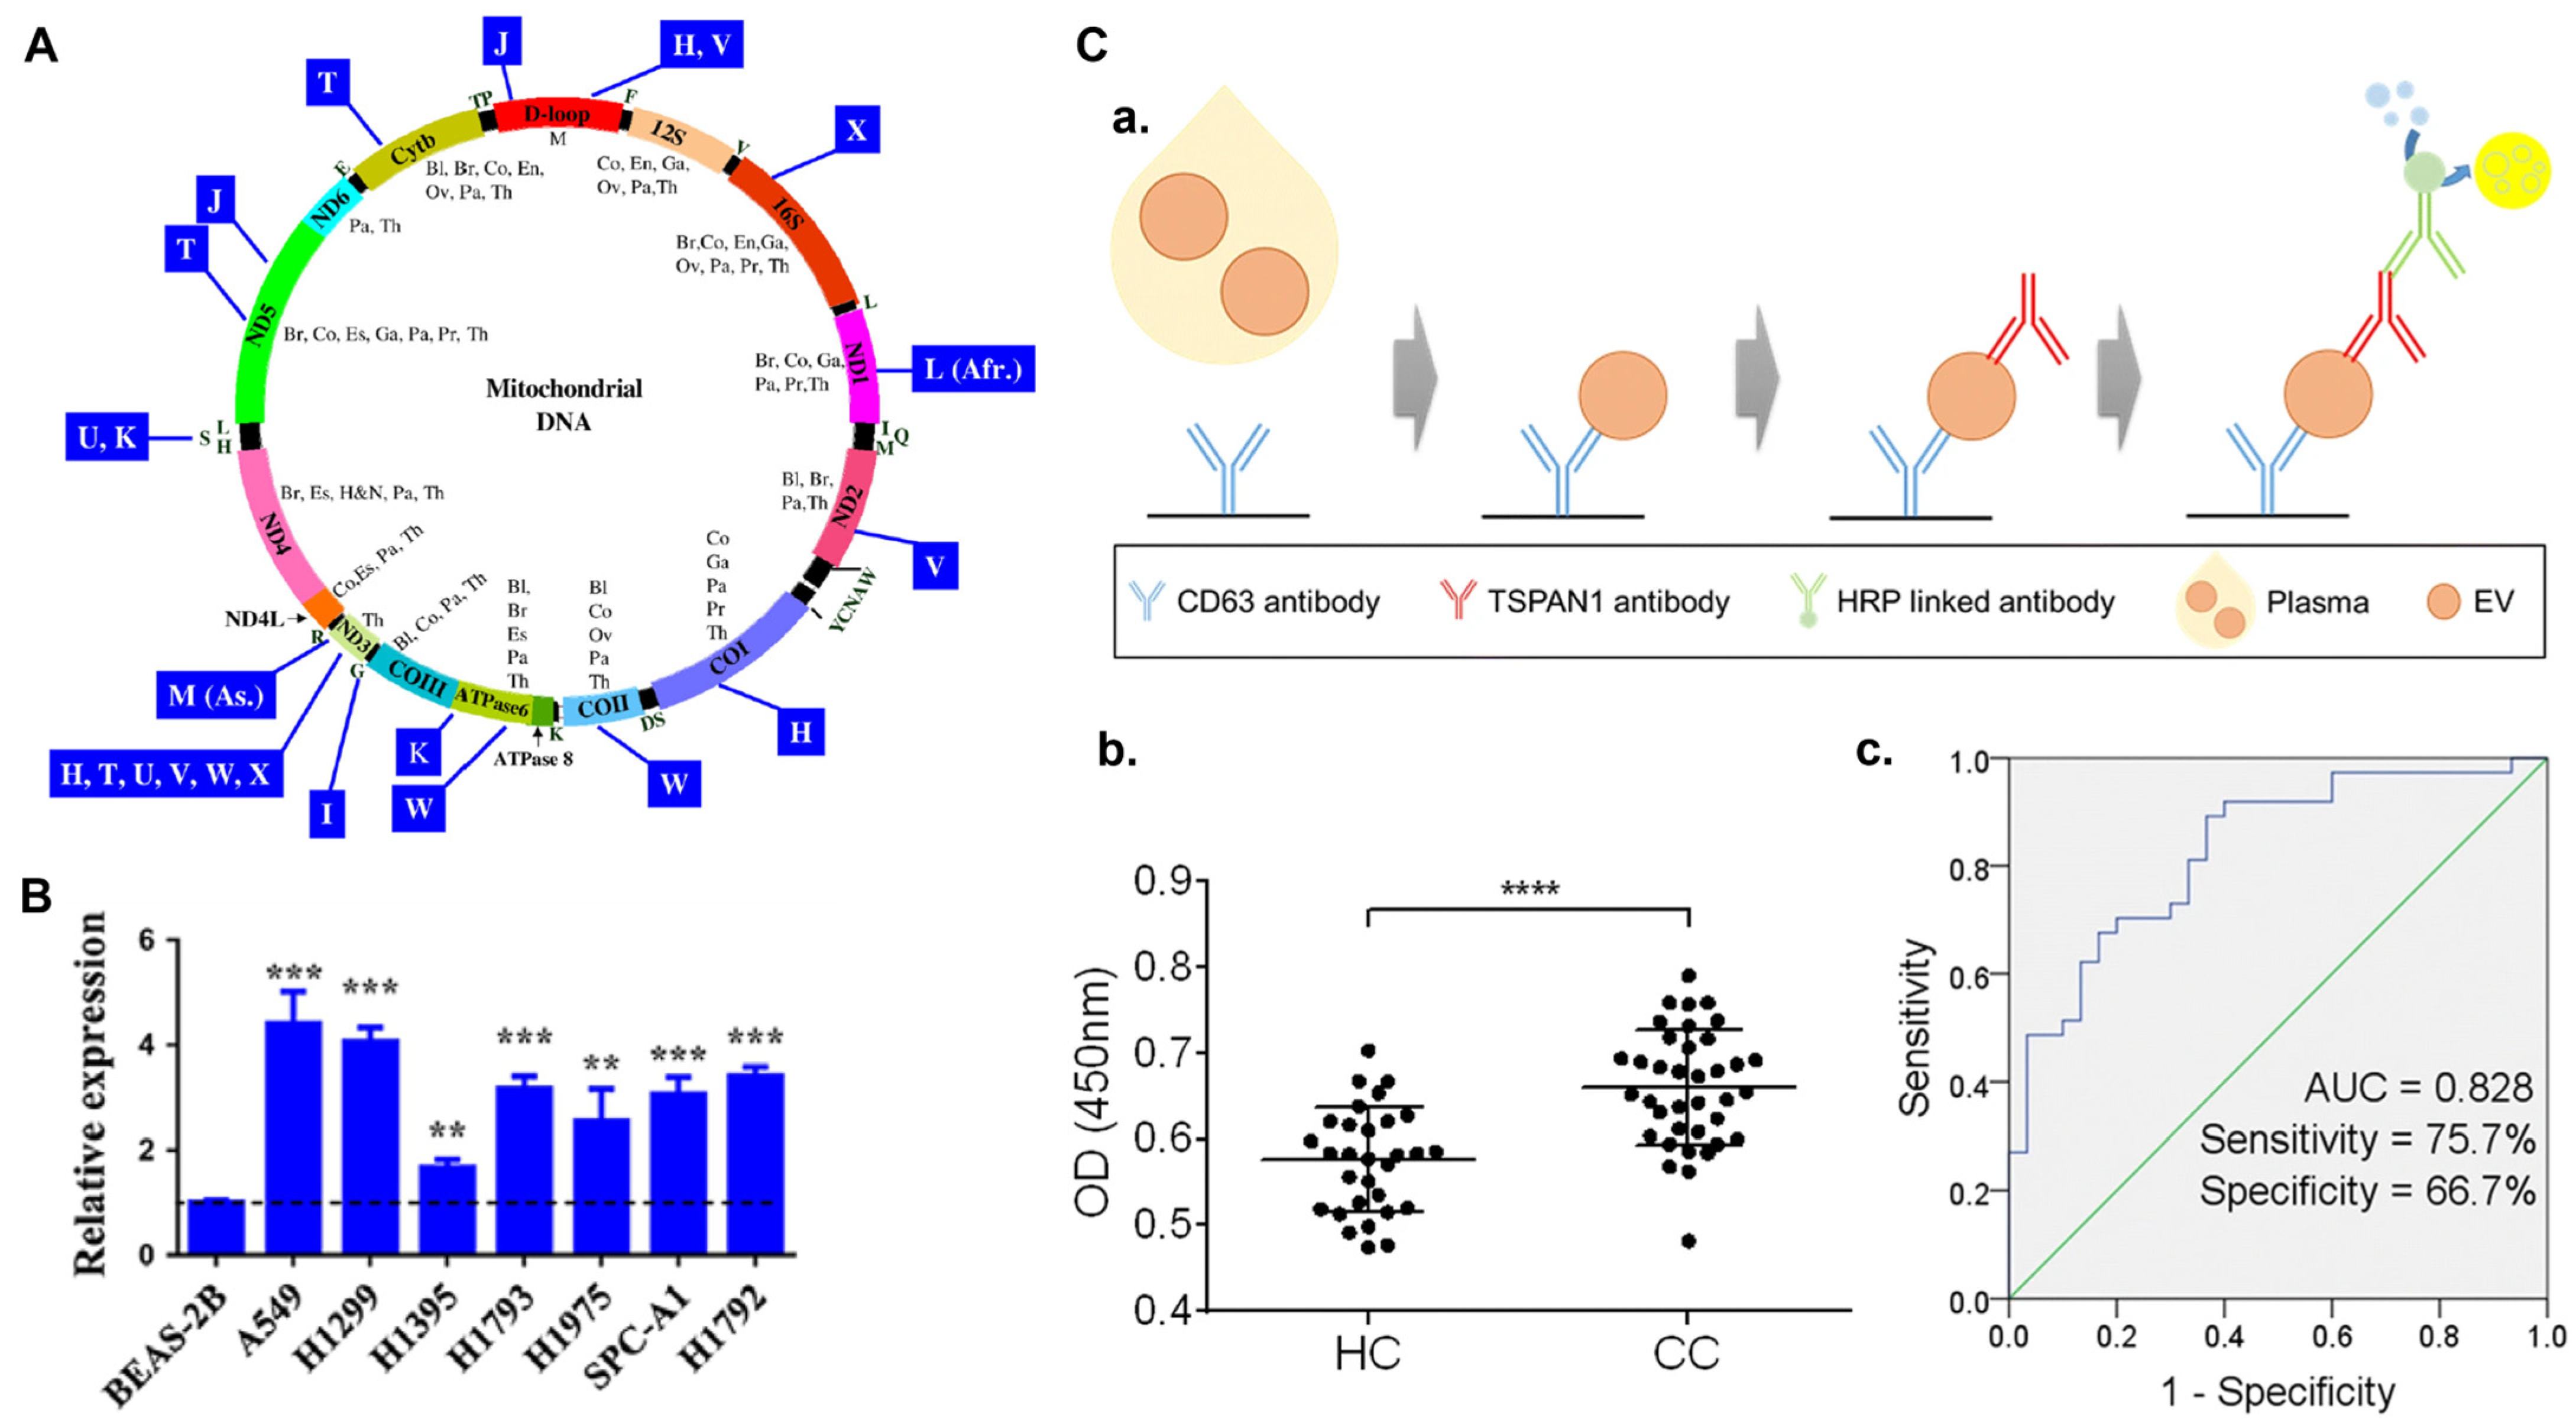
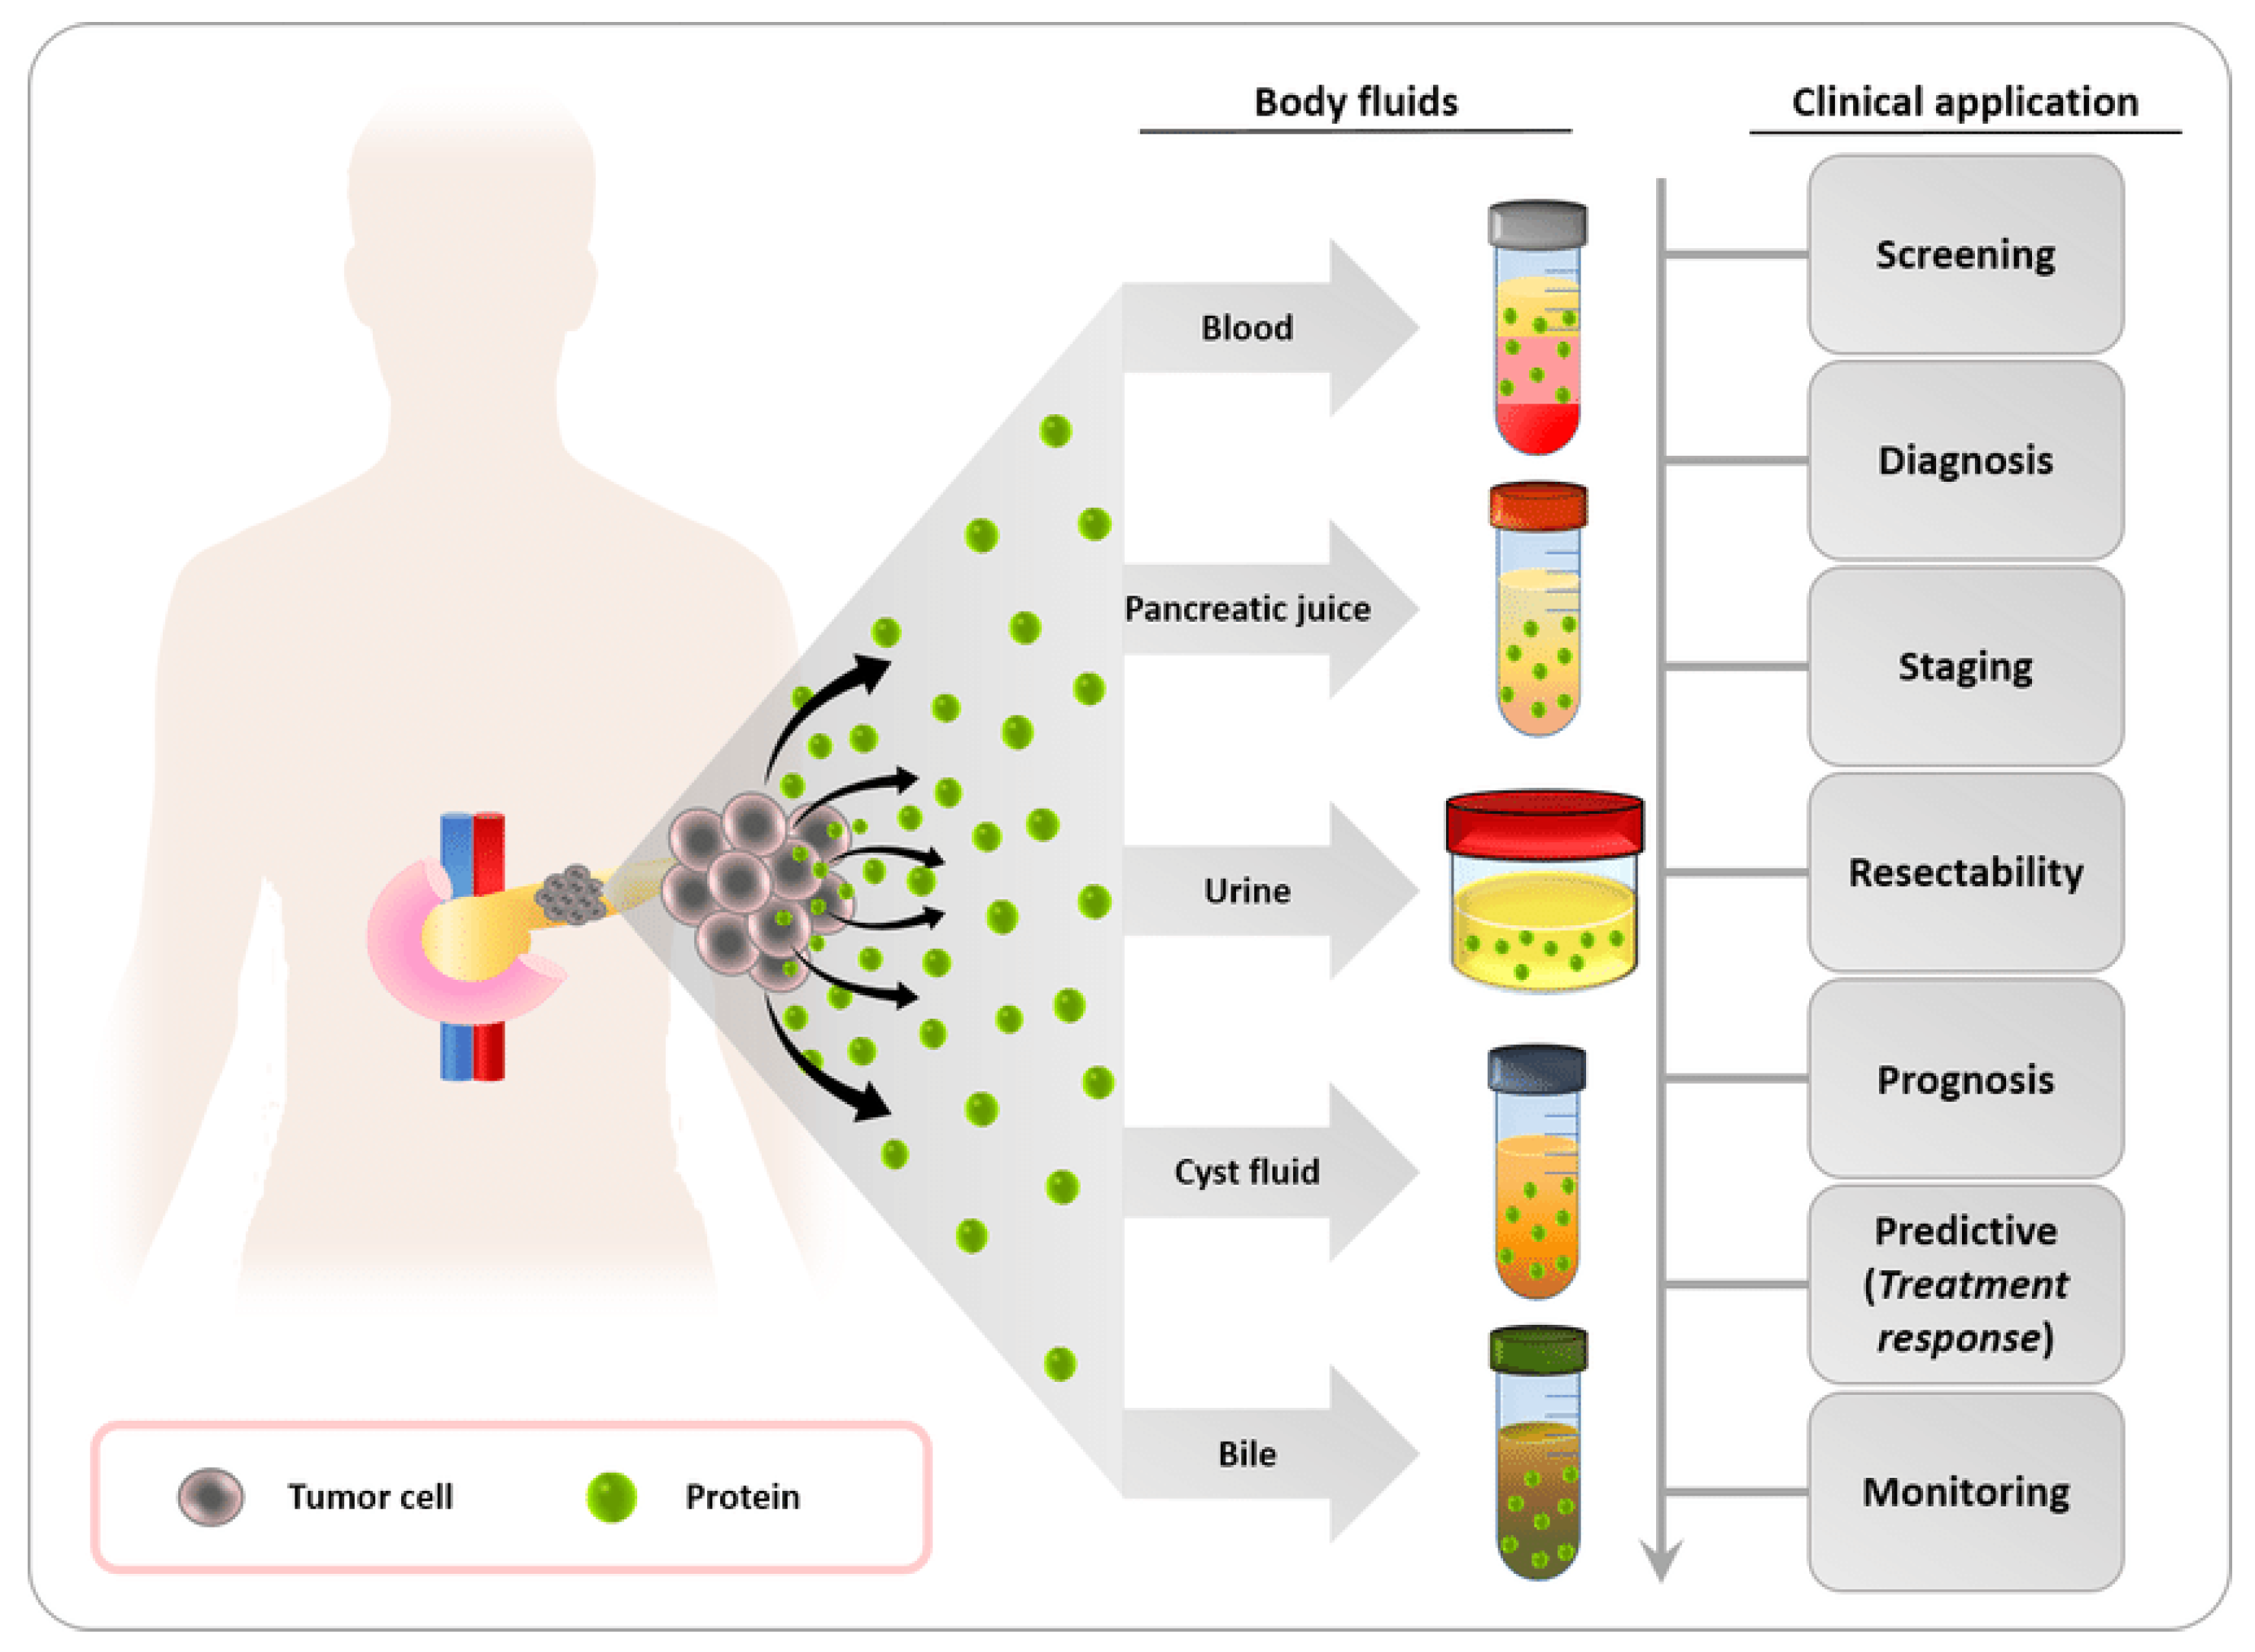
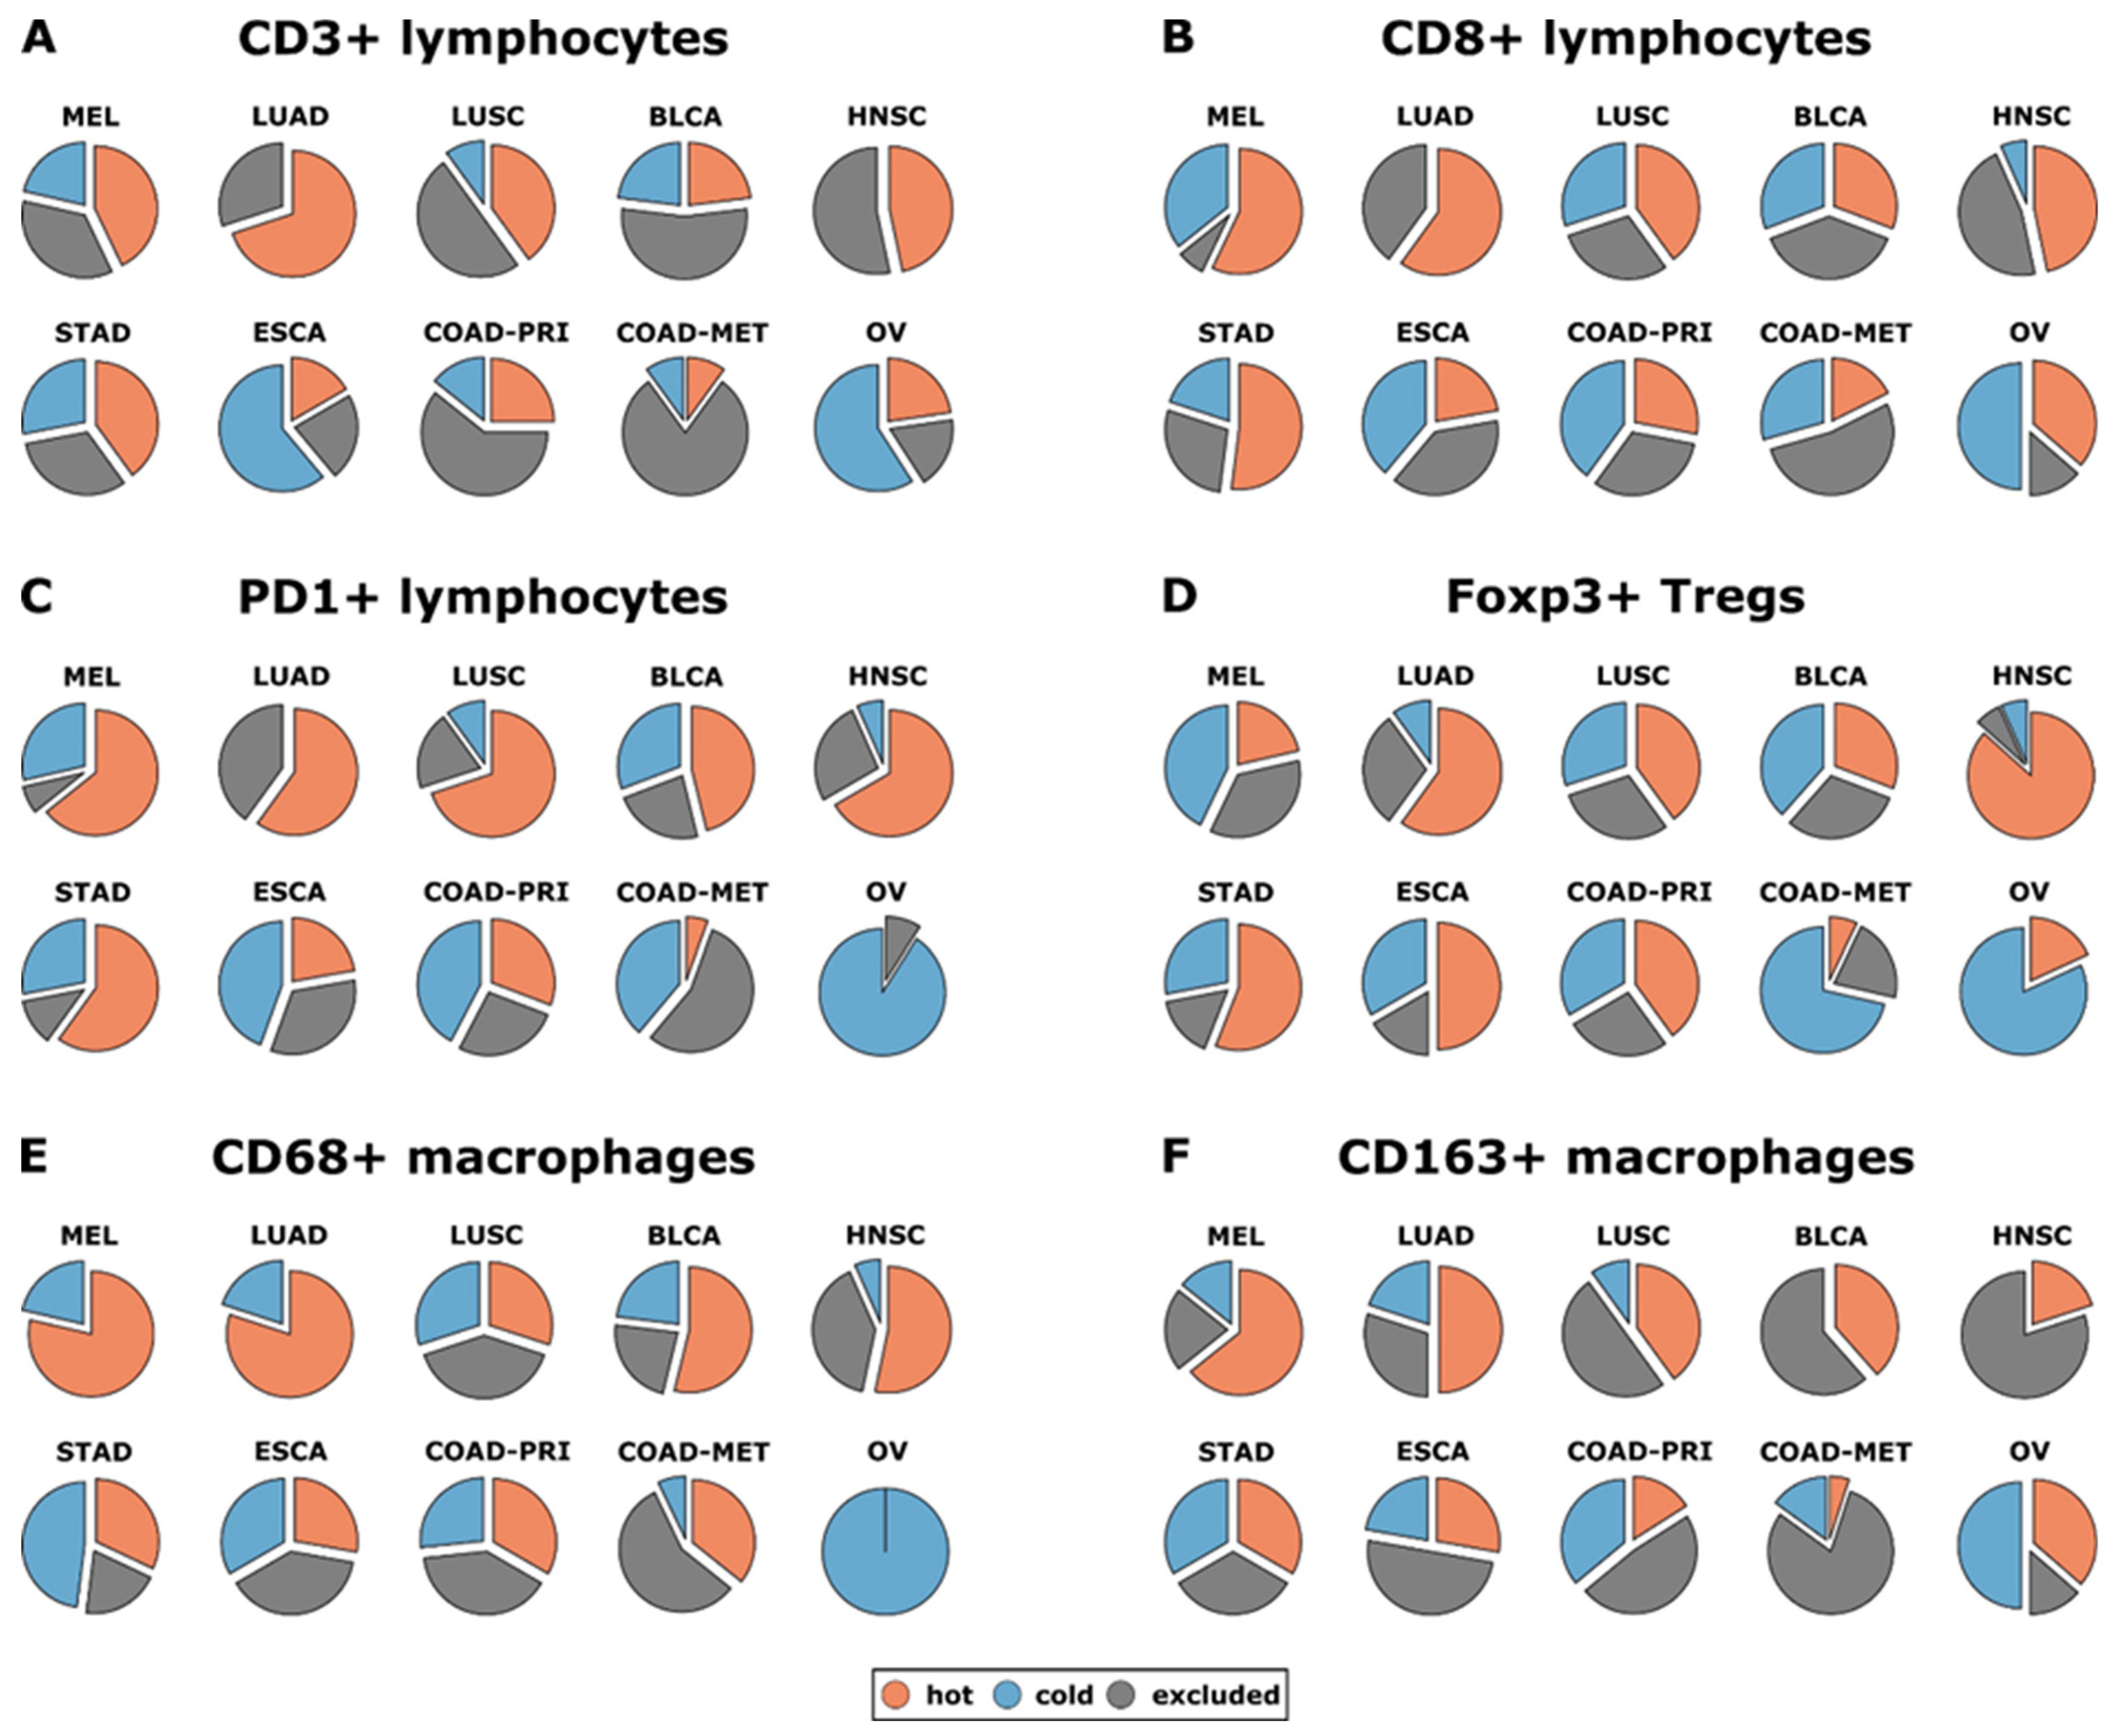
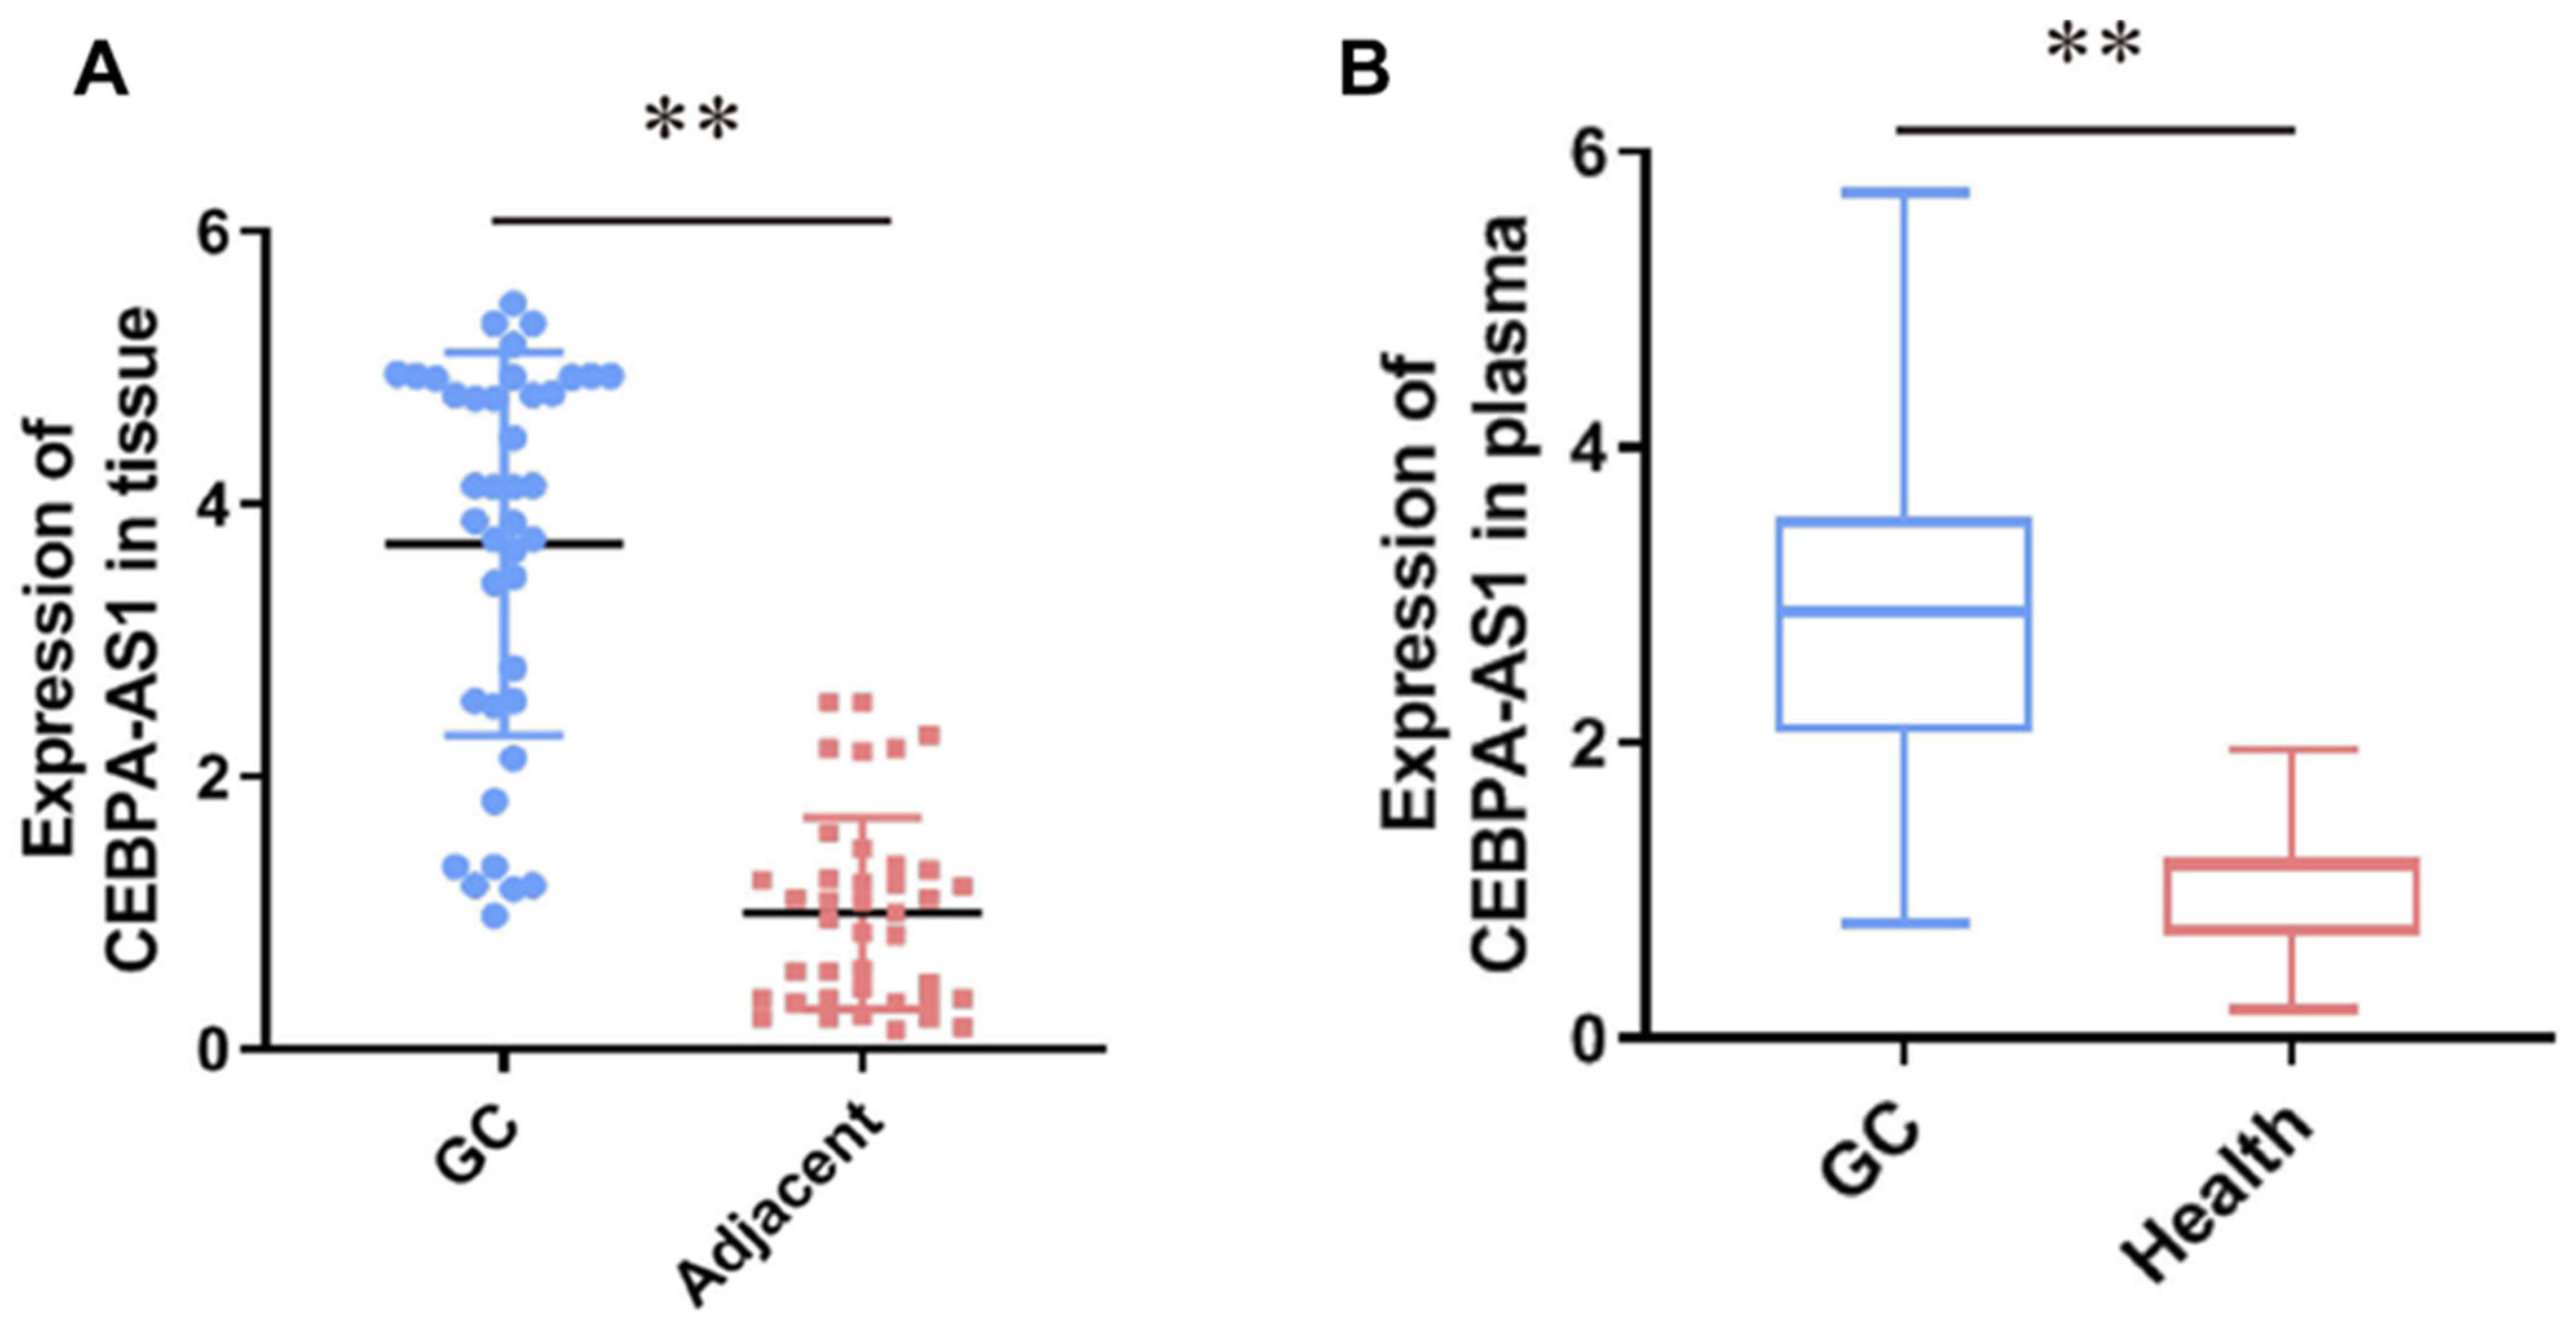
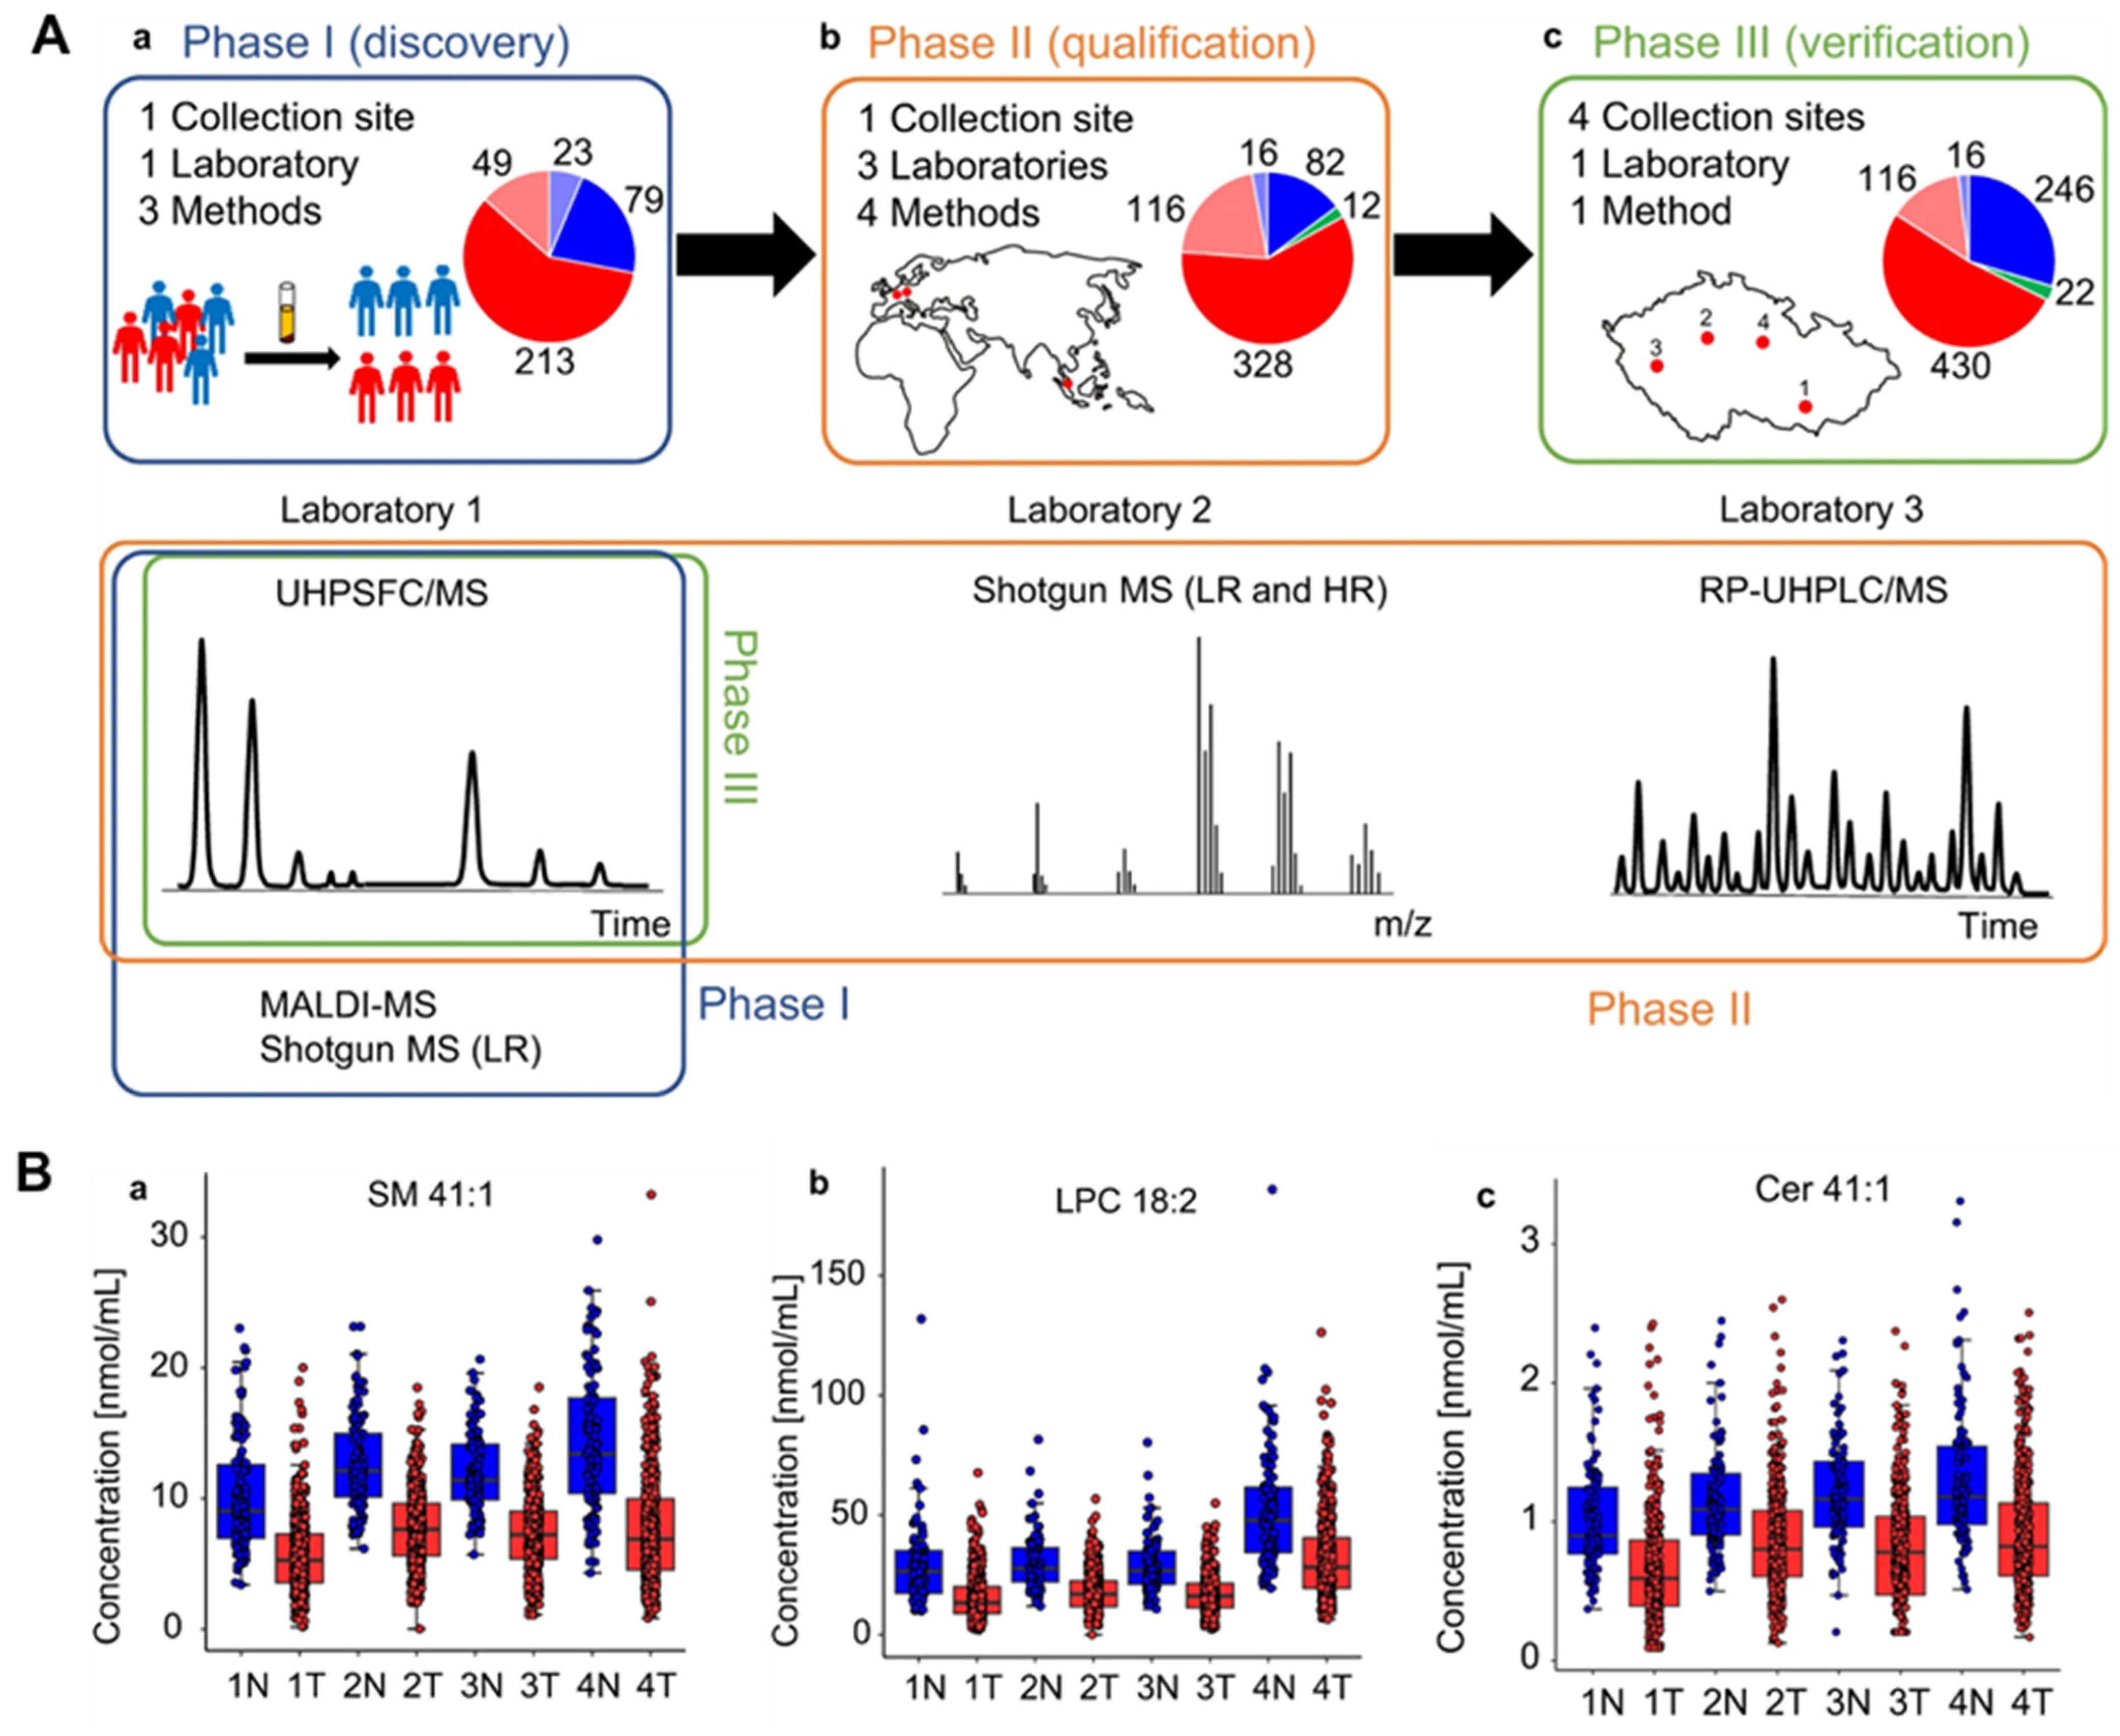
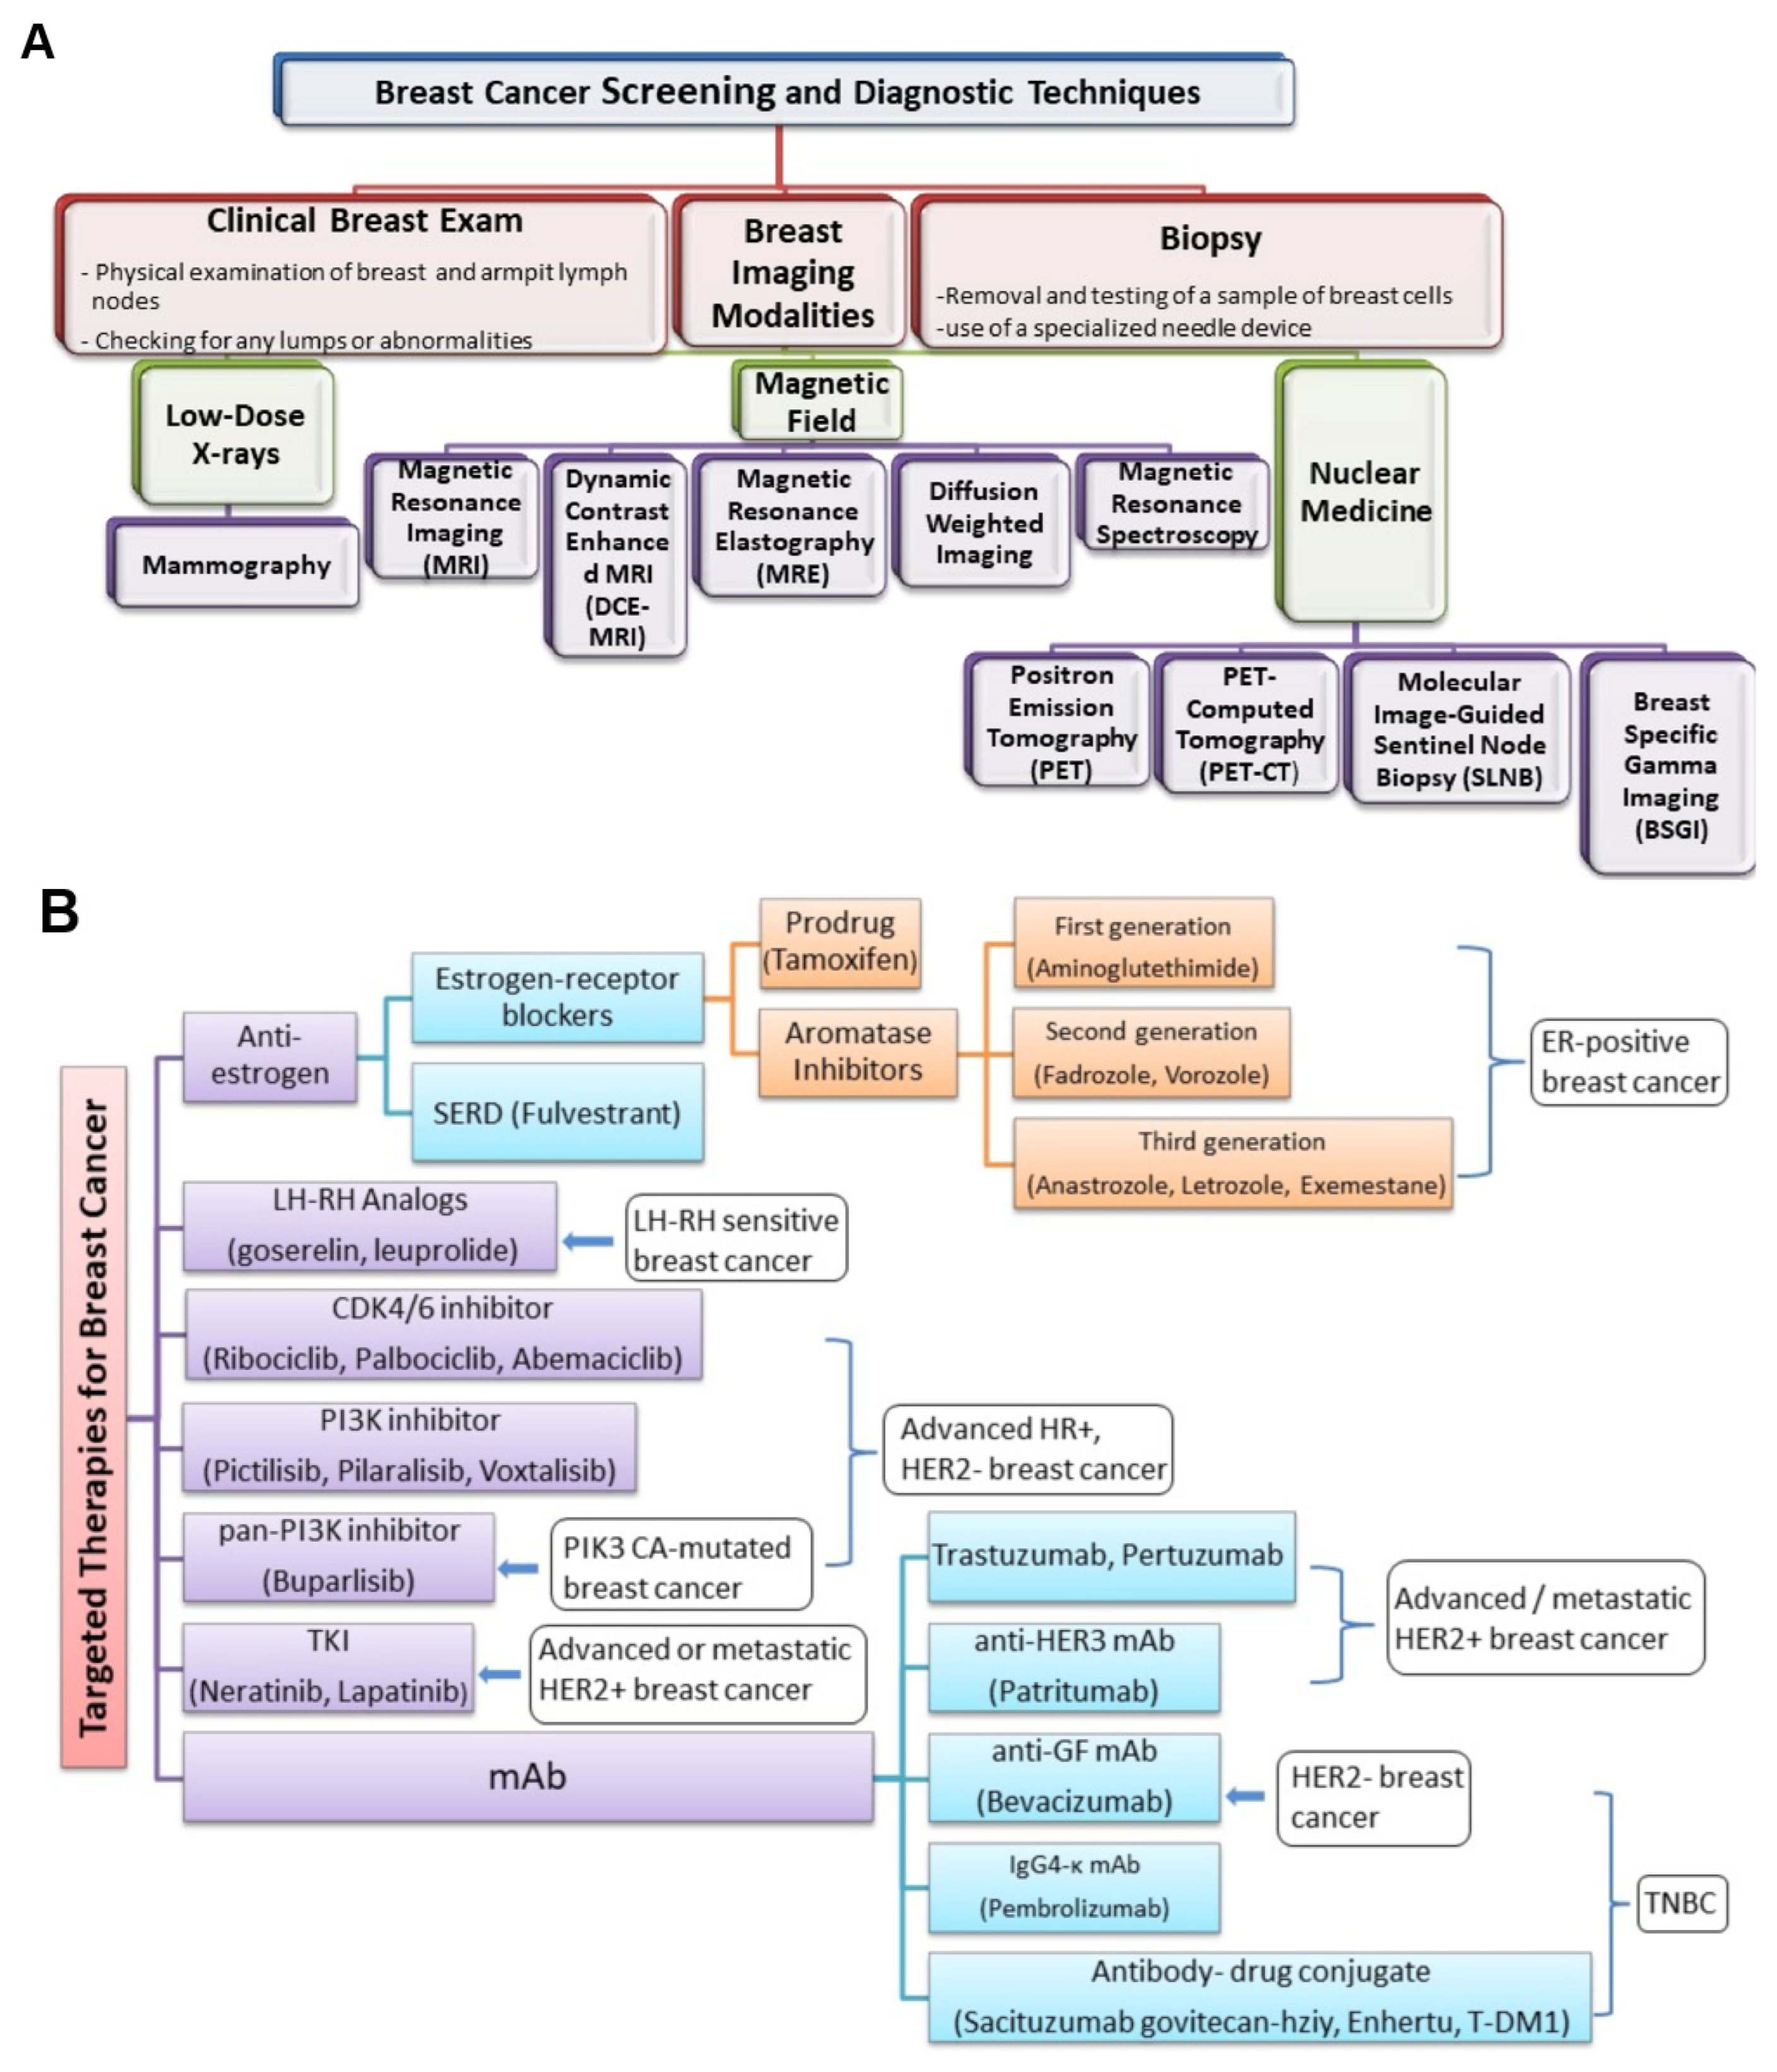
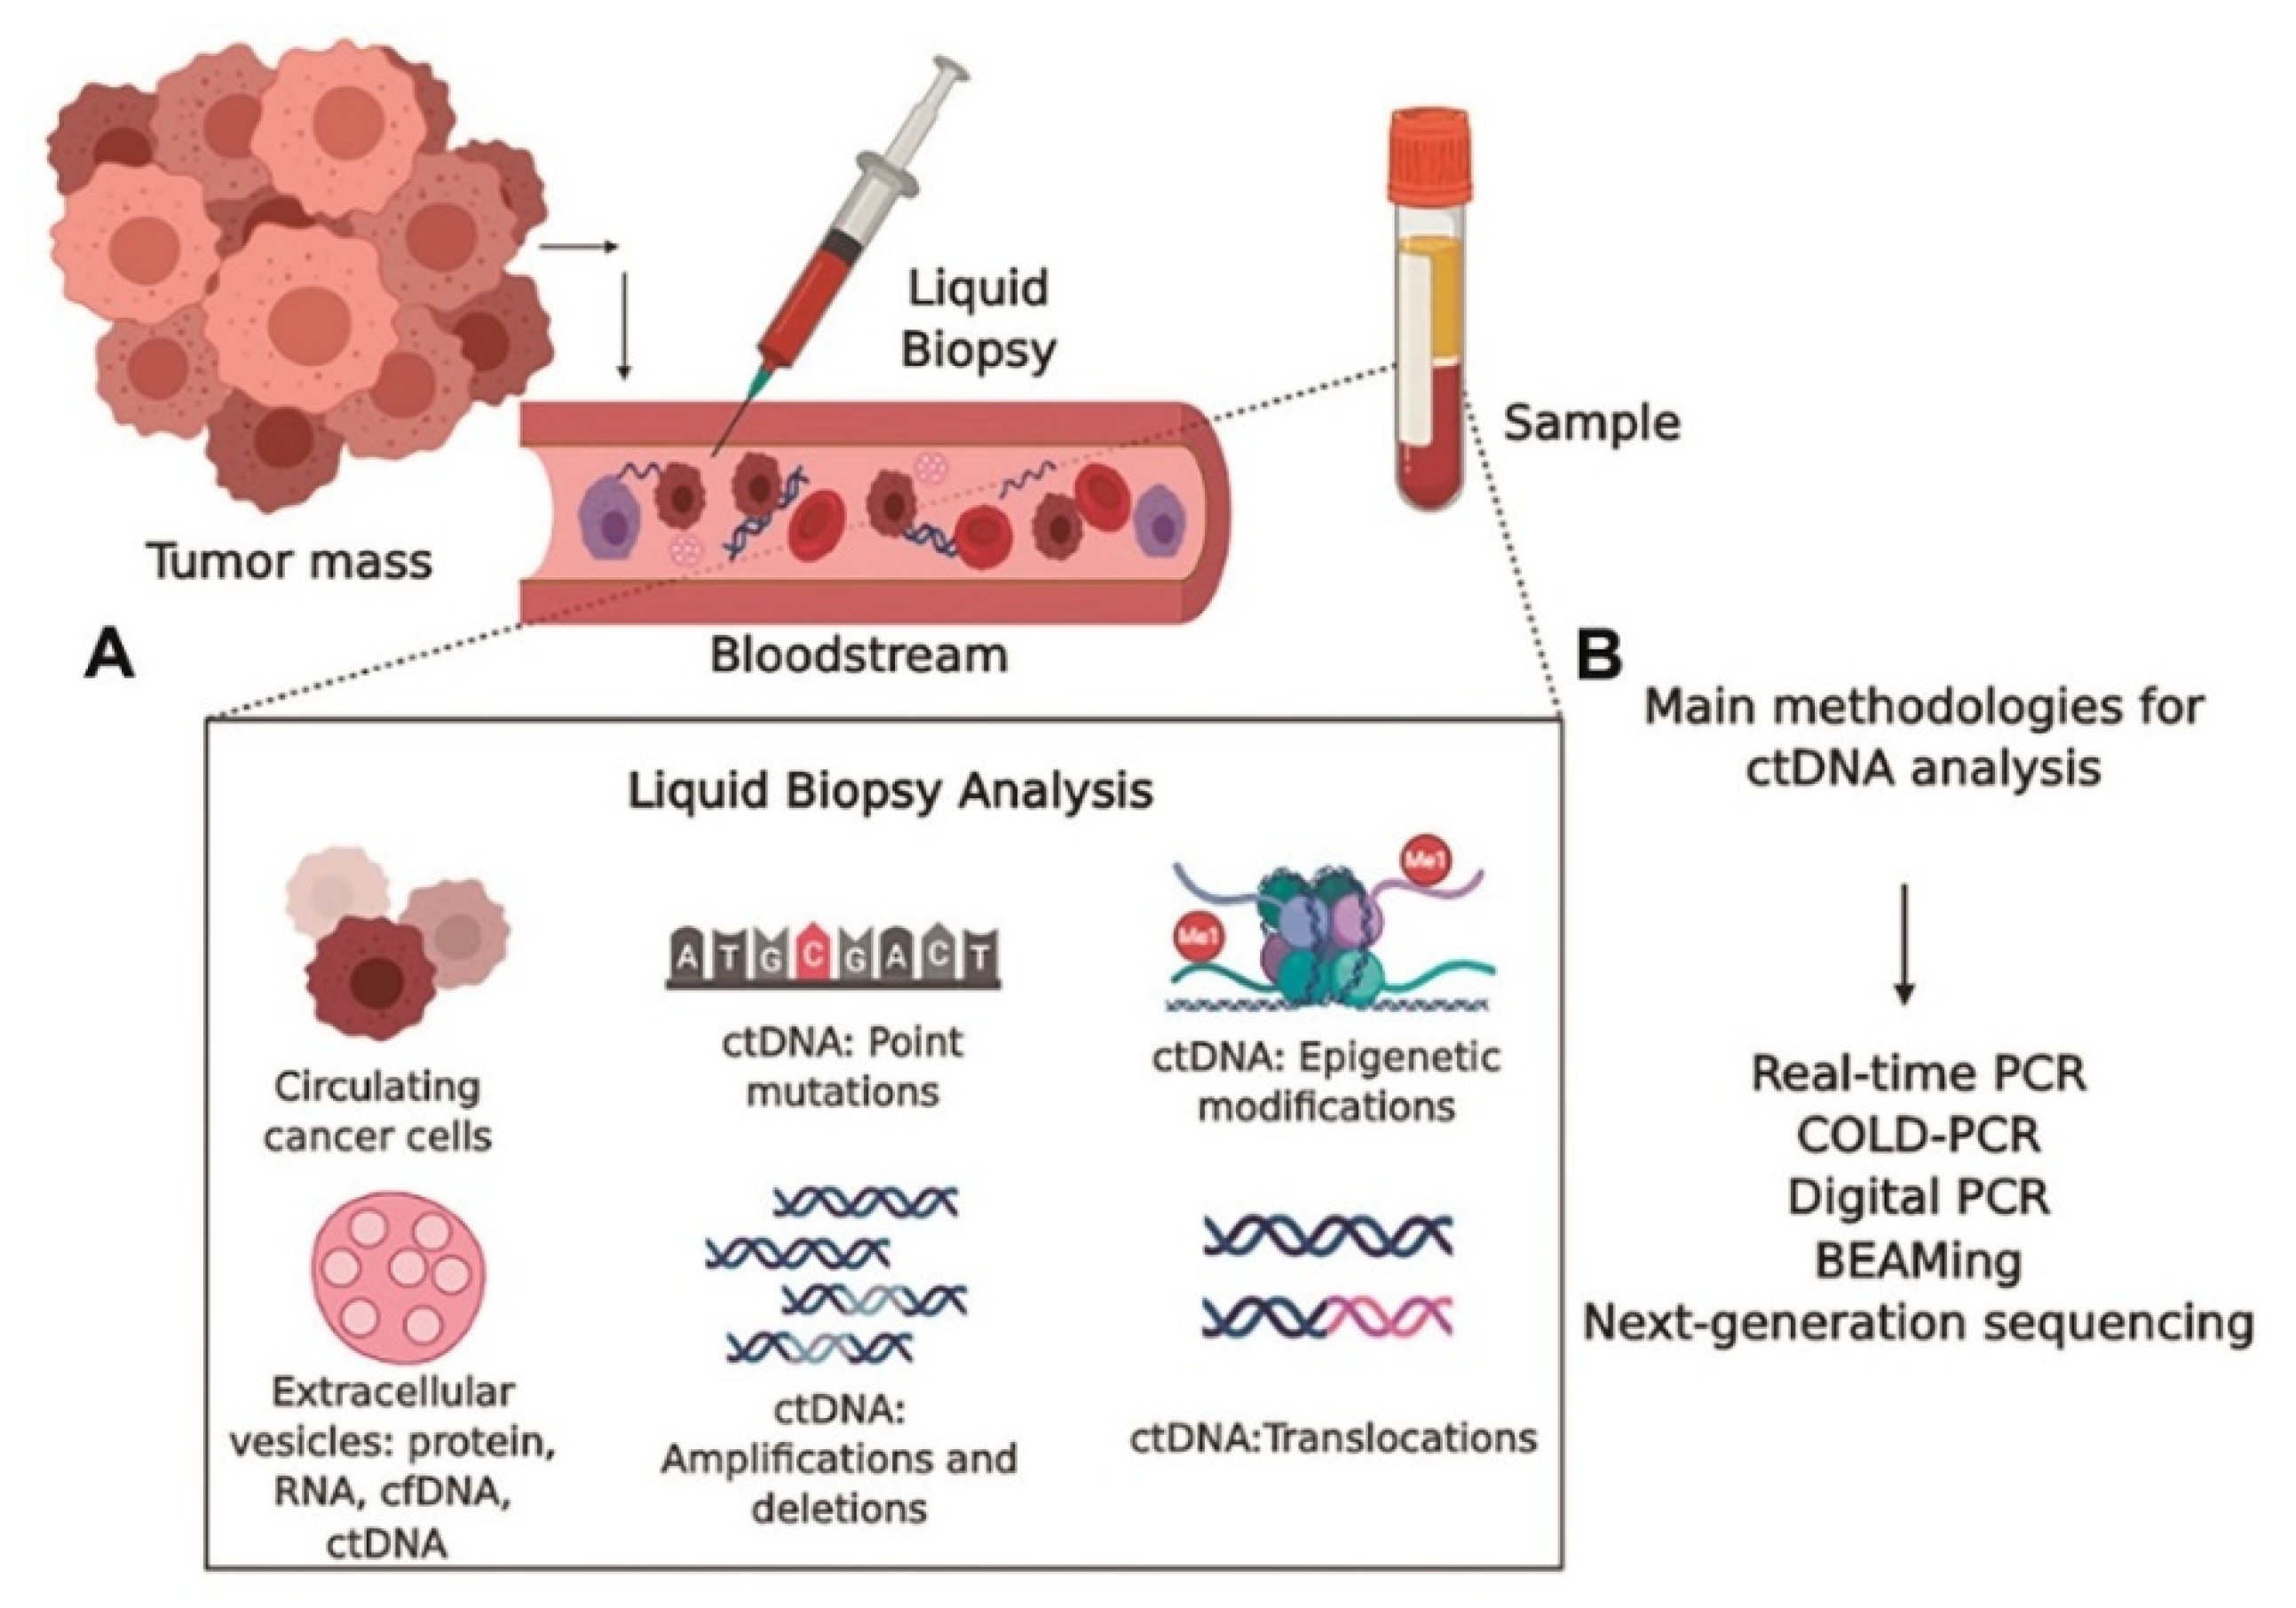
| Genetic Biomarker | Cancer Type | Function/Use | Key Genes/Elements | Ref. |
|---|---|---|---|---|
| Mutations and Gene Alterations | Melanoma | Targeted therapy selection | BRAF V600E mutation | [117] |
| NSCLC (Lung) | Sensitivity to EGFR inhibitors | EGFR mutations (e.g., exon 19 deletions, L858R) | [118] | |
| Colorectal | Affecting treatment response | KRAS mutations (30–40% cases) | [119] | |
| Breast/Ovarian | Guiding therapy selection | BRCA1/BRCA2 mutations | [70] | |
| Breast/Gastric | Indicating aggressive behavior | HER2 amplification/overexpression | [71] | |
| Gliomas | Diagnostic and prognostic markers | IDH mutations | [120] | |
| Gene Expression Profiles | Breast | Recurrence prediction and treatment guidance | Oncotype DX (16 genes) | [121] |
| Breast | Distant metastasis risk and treatment guidance | MammaPrint (18 genes) | [122] | |
| Breast | Subtype classification and hormone therapy | Prosigna (PAM50—50 genes) | [75] | |
| Prostate | Recurrence prediction after surgery | Decipher (Genomic Risk Score) | [123] | |
| DNA | Various | Identification of oncogene alterations | p53, KRAS, APC, RAS, BRCA1/2, etc. | [124] |
| Various | Detection of mismatch-repair gene mutations | Mismatch-repair gene mutations | [125] | |
| Various | Monitoring of circulating DNA | Tumor DNA in circulation | [126] | |
| RNA | Various | Identification of miRNA markers | Various microRNAs in different cancers | [127] |
| Lung | Detection of circular RNA (circRNA) markers | Hsa circ 0013958 in lung adenocarcinoma | [128] | |
| Epigenetics | Various | Detection of DNA methylation in promoter regions | RASSF1A, p16, BRCA1, NKX2-6, SPAG6, PER1, ITIH5, etc. | [129] |
| Various | Role of histone acetylation | Histone acetylation levels | [130] |
| Protein Tumor Marker | Typical Concentration in Healthy Populations | Typical Concentration in Cancer Patients | Reference |
|---|---|---|---|
| Alpha-Fetoprotein (AFP) | <10 ng/mL | Elevated levels (>200–400 ng/mL) in hepatocellular carcinoma (HCC) and other cancers | [136] |
| Carcinoembryonic Antigen (CEA) | <3 ng/mL | Elevated levels in various cancers, including colorectal, lung, and pancreatic cancer | [137] |
| Prostate-Specific Antigen (PSA) | <4 ng/mL | Elevated levels in prostate cancer | [138] |
| CA-125 | <35 U/mL | Elevated levels in ovarian and other gynecological cancers | [139] |
| CA 19-9 | <37 U/mL | Elevated levels in pancreatic and other gastrointestinal cancers | [140] |
| CA 15-3 | <30 U/mL | Elevated levels in breast cancer | [141] |
| CA 27.29 | <40 U/mL | Elevated levels in breast cancer | [142] |
| Human Chorionic Gonadotropin (hCG) | <5 IU/L | Elevated levels in germ cell tumors, including testicular and ovarian cancer | [143] |
| Human Epidermal Growth Factor Receptor 2 (HER2) | Negative (score 0 or 1+ by immunohistochemistry) | Overexpression or amplification in HER2-positive breast and gastric cancer | [144] |
| Cancer Type | Group of Patients Who May Benefit | FDA-Approved Immunotherapies | Reference |
|---|---|---|---|
| Melanoma | Advanced/metastatic melanoma | Pembrolizumab (Keytruda), Nivolumab (Opdivo), Ipilimumab (Yervoy) | [145,146,147,148] |
| Lung Cancer | Non-small-cell lung cancer (NSCLC) | Pembrolizumab, Nivolumab, Atezolizumab (Tecentriq), Durvalumab (Imfinzi), Combination therapies: Pembrolizumab + Chemotherapy | [149] |
| Head and Neck Cancer | Recurrent or metastatic squamous cell carcinoma | Pembrolizumab, Nivolumab | [150] |
| Bladder Cancer | Locally advanced or metastatic urothelial carcinoma | Atezolizumab, Pembrolizumab, Nivolumab | [151] |
| Kidney Cancer | Advanced or metastatic renal cell carcinoma | Nivolumab, Pembrolizumab, Axitinib + Pembrolizumab, Combination therapies: Avelumab + Axitinib | [152] |
| Hodgkin Lymphoma | Classical Hodgkin lymphoma | Pembrolizumab, Nivolumab | [153] |
| Colorectal Cancer | Microsatellite instability-high (MSI-H)/dMMR | Pembrolizumab, Combination therapy: Nivolumab + Ipilimumab | [154] |
| Type of Cancer | Type of Lamin Involved | Gene Name | Phenotype of Lamin | Phenotype of Cancer | Ref. |
|---|---|---|---|---|---|
| Colorectal | Lamin A/C | LMNA/LMNC | Decreased expression of lamin A/C | High motility and recurrence | [213] |
| Pancreatic Cancer | Lamin B1 | LMNB1 | Overexpression of lamin B1 | Invasiveness and poor prognosis | [206] |
| Gastrointestinal | Lamin A/C | LMNA/LMNC | Decreased lamin A/C expression | Invasiveness | [218] |
| Neuroblastoma | Lamin A/C | LMNA/LMNC | Decreased lamin A/C expression | Cell motility and invasiveness | [216] |
| Prostate | Lamin B | LMNB1 | Increased expression of lamin B | Augmented aggressiveness and motility | [219] |
| Germ cell | Lamin C | LMNC | Increased expression of lamin C | Cell motility and invasiveness | [207] |
| Liver | Lamin B1 | LMNB1 | Increased expression of LMNB1 | Cell motility and invasiveness | [220] |
| Lung | Lamin A/C | LMNA/LMNC | Increased lamin A/C expression | Increased migratory property | [221] |
| Breast | Lamin A/C | LMNA/LMNC | Decreased lamin A/C expression | Altered morphology and aneuploidy | [214,215] |
| Skin | Lamin A | LMNA | Increased lamin A expression | Increased migratory property | [222] |
| Type of Organ Systems | Distribution of Patient Studies on Galectins on Different Organ Systems | Types of Cancers | Subtypes | Galectin 1 | Galectin 2 | Galectin 3 | Galectin 4 | Galectin 7 | Galectin 8 | Galectin 9 | Galectin 12 | Ref. |
|---|---|---|---|---|---|---|---|---|---|---|---|---|
| Digestive | 28.75% | Bile duct | - | - | Similar | - | - | - | - | [256,257] | ||
| Colon | Increased | Similar | Increased | Decrease | Increased | Decreased | [256,258,259,260,261,262,263] | |||||
| Esophagus | - | - | - | - | Increased | - | - | - | [245,256] | |||
| Gall bladder | - | - | Increased | - | - | - | - | - | [256,264] | |||
| Gastric | - | Similar | Similar | - | Decreased | Similar | Decreased | [244,256,259,263,265,266] | ||||
| Liver | Increased | Decreased | Increased | Increased | Decreased | Decreased | [256,259,263,267,268,269,270,271] | |||||
| Pancreas | Increase | Similar | Increased | Increased | - | Decreased | Decreased | [256,259,263,272,273,274,275] | ||||
| Oral | Decreased | - | Decreased | - | - | - | - | - | [241,256] | |||
| Tongue | Decreased | Decreased | [241,256] | |||||||||
| Hematologic | 13.1% | Lymphoid | Lymphoma | Increased | - | Increased | - | - | Increased | Increased | [256,276,277,278,279] | |
| B-cell lymphoma | - | - | Decreased | [256,280] | ||||||||
| Non-Hodgkin’s lymphoma | - | - | Similar | - | - | - | - | [229,256] | ||||
| Myeloid | Increased | Increased | [256,281] | |||||||||
| Neural | 6.3% | Brain | Increased | [256,282,283] | ||||||||
| Glioma | Increased | - | - | - | - | - | - | [256,284] | ||||
| Pituitary gland | Increased | [256,285] | ||||||||||
| Reproductive | 22.4% | Breast | Increased | Decreased | Decreased | Increased | Increased | [246,256,259,263,286] | ||||
| Cervix | Increased | Decreased | Decreased | Decreased | [256,287,288,289,290] | |||||||
| Ovarian | Increased | Increased | Decreased | Increased | - | - | - | [256,259,291,292,293] | ||||
| Prostate | Similar | - | Decreased | Decreased | Increased | Decreased | Decreased | [256,294,295,296,297] | ||||
| Uterus | Similar | Similar | [256,298] | |||||||||
| Respiratory | 13.9% | Larynx | Decreased | Decreased | Increased | Decreased | [241,248,256,263] | |||||
| Lungs | Increased | Similar | Increased | - | Similar | Increased | - | - | [231,233,256,259,299] | |||
| Nasal cavity | Decreased | - | - | - | - | - | [256,300] | |||||
| Pharynx | Decreased | - | Decreased | - | - | Increased | Increased | [241,248,256,301] | ||||
| Urinary | 7.2% | Bladder | Increased | Similar | Increased | Increased | Similar | Similar | - | [229,232,256,259,263] | ||
| Kidney | Increased | Similar | Decreased | Increased | Similar | [235,256,259,263,302] | ||||||
| Miscellaneous | 8.4% | Skin | Basal cell carcinoma | Increased | Decreased | Increased | Decreased | Decreased | Decreased | Decreased | [239,256] | |
| Melanoma | - | - | Increased | - | - | - | - | [256,303] | ||||
| Squamous cell carcinoma | Decreased | Decreased | [239,241,256] | |||||||||
| Thyroid | Increased | Increased | Increased | - | Increased | - | - | [238,256,259] |
| Lipids | Composition | Presence of the Side of Membrane | Cancer Types | Levels | Functions | Ref. |
|---|---|---|---|---|---|---|
| Phosphoinositide | Phosphate group, two fatty acid chain and inositol molecule | Primarily located inner leaflet | Breast, Prostate, Ovarian, Lung, and Gastric | Increased | Signaling for cell proliferation and motility | [363,364,365,366] |
| Cholesterol | Sterol composed of four hydrocarbon rings, and a hydroxyl group | Primarily located outer leaflet | Most types | Alteration | Controlling membrane structure | [368] |
| Prostaglandin | Five member ring with fatty acid, arachidonic acid | Primarily located inner leaflet | Most types | Secreted by cancer cells | Angiogenesis, anti-apoptosis, invasion | [369] |
| lysophosphatidic acid | Contains a glycerol backbone with a phosphoryl group | Primarily located outer leaflet | Ovarian | Increased | Enhanced metastasis | [370,371,372] |
| sphingosine 1 phosphate | Amphipatic lysophospholipid composed of a sphingoid extended chain and a phosphate molecule. | Primarily located outer leaflet | Most types | Secreted by cancer cells | Angiogenesis | [373,374,375,376] |
| Ceramides | Contains sphingosine and a fatty acid | Both leaflets | Breast, Prostate, and Ovarian | Decreased level | Cell cycle arrest and apoptosis | [368] |
| Biomarker | Approach | Clinical Role | Clinical Phase | Reference |
|---|---|---|---|---|
| Breast morphology | Mammography | Breast cancer diagnosis | Translational gap 2 | [37] |
| Clinical Tumor, Node, Metastasis (TNM) staging | MRI, CT, PET | Prognosis for all cancers | Translational gap 2 | [409] |
| T-score (BMD − Reference BMD)/SD BMD = Bone mineral density SD = standard deviation | Dual-energy X-ray absorptiometry (DXA) | Safety marker; recommending bisphosphonates to individuals with breast cancer who are experiencing bone loss as a consequence of their treatment | Translational gap 2 | [41] |
| Bone scan index (M/R) × C M = area of the metastasis R = area of the anatomical region where the metastasis is located C = coefficient reflecting the regional proportion of skeletal mass | Single-photon emission computed tomography (SPECT) | Prognosis for prostate cancer | Translational gap 2 | [410] |
| Magnetic resonance imaging in breast screening (MARIBS) category | MRI | Determining the probability of breast cancer in individuals with genetic predisposition, including mutations in BRCA1 or BRCA2 | Translational gap 2 | [411] |
| 99mTc-etarfolatide FR+ FR+ = folate receptor-positive | SPECT | Diagnosis for platinum-resistant ovarian cancer | Companion diagnostics evaluated by European Medicines Agency (EMA) | [43] |
| Mucosal abnormalities | White-light imaging | Diagnosis in melanoma | - | [412] |
| Liquid Biopsy Technology | Advantages | Limitations | Company Offering |
|---|---|---|---|
| Circulating Tumor DNA (ctDNA) Analysis |
|
|
|
| Circulating Tumor Cells (CTCs) Analysis |
|
|
|
| Extracellular Vesicle (EV) Analysis |
|
|
|
| Cell-Free DNA (cfDNA) Analysis |
|
|
|
Disclaimer/Publisher’s Note: The statements, opinions and data contained in all publications are solely those of the individual author(s) and contributor(s) and not of MDPI and/or the editor(s). MDPI and/or the editor(s) disclaim responsibility for any injury to people or property resulting from any ideas, methods, instructions or products referred to in the content. |
© 2023 by the authors. Licensee MDPI, Basel, Switzerland. This article is an open access article distributed under the terms and conditions of the Creative Commons Attribution (CC BY) license (https://creativecommons.org/licenses/by/4.0/).
Share and Cite
Das, S.; Dey, M.K.; Devireddy, R.; Gartia, M.R. Biomarkers in Cancer Detection, Diagnosis, and Prognosis. Sensors 2024, 24, 37. https://doi.org/10.3390/s24010037
Das S, Dey MK, Devireddy R, Gartia MR. Biomarkers in Cancer Detection, Diagnosis, and Prognosis. Sensors. 2024; 24(1):37. https://doi.org/10.3390/s24010037
Chicago/Turabian StyleDas, Sreyashi, Mohan Kumar Dey, Ram Devireddy, and Manas Ranjan Gartia. 2024. "Biomarkers in Cancer Detection, Diagnosis, and Prognosis" Sensors 24, no. 1: 37. https://doi.org/10.3390/s24010037
APA StyleDas, S., Dey, M. K., Devireddy, R., & Gartia, M. R. (2024). Biomarkers in Cancer Detection, Diagnosis, and Prognosis. Sensors, 24(1), 37. https://doi.org/10.3390/s24010037