
A Real Time Method for Distinguishing COVID-19 Utilizing 2D-CNN and Transfer Learning
 ,
,  , , ,
, , ,  and
and 
Abstract
1. Introduction
- (1)
- A larger dataset of CXR images with seven classes (COVID-19, Normal, Viral Pneumonia, Bacterial Pneumonia, Fibrosis, Lung Opacity, and Tuberculosis) is developed by combining several small datasets to create a real life multiclass problem.
- (2)
- The imbalanced dataset is transformed into a balanced dataset for training by applying augmentation to improve the model’s performance.
- (3)
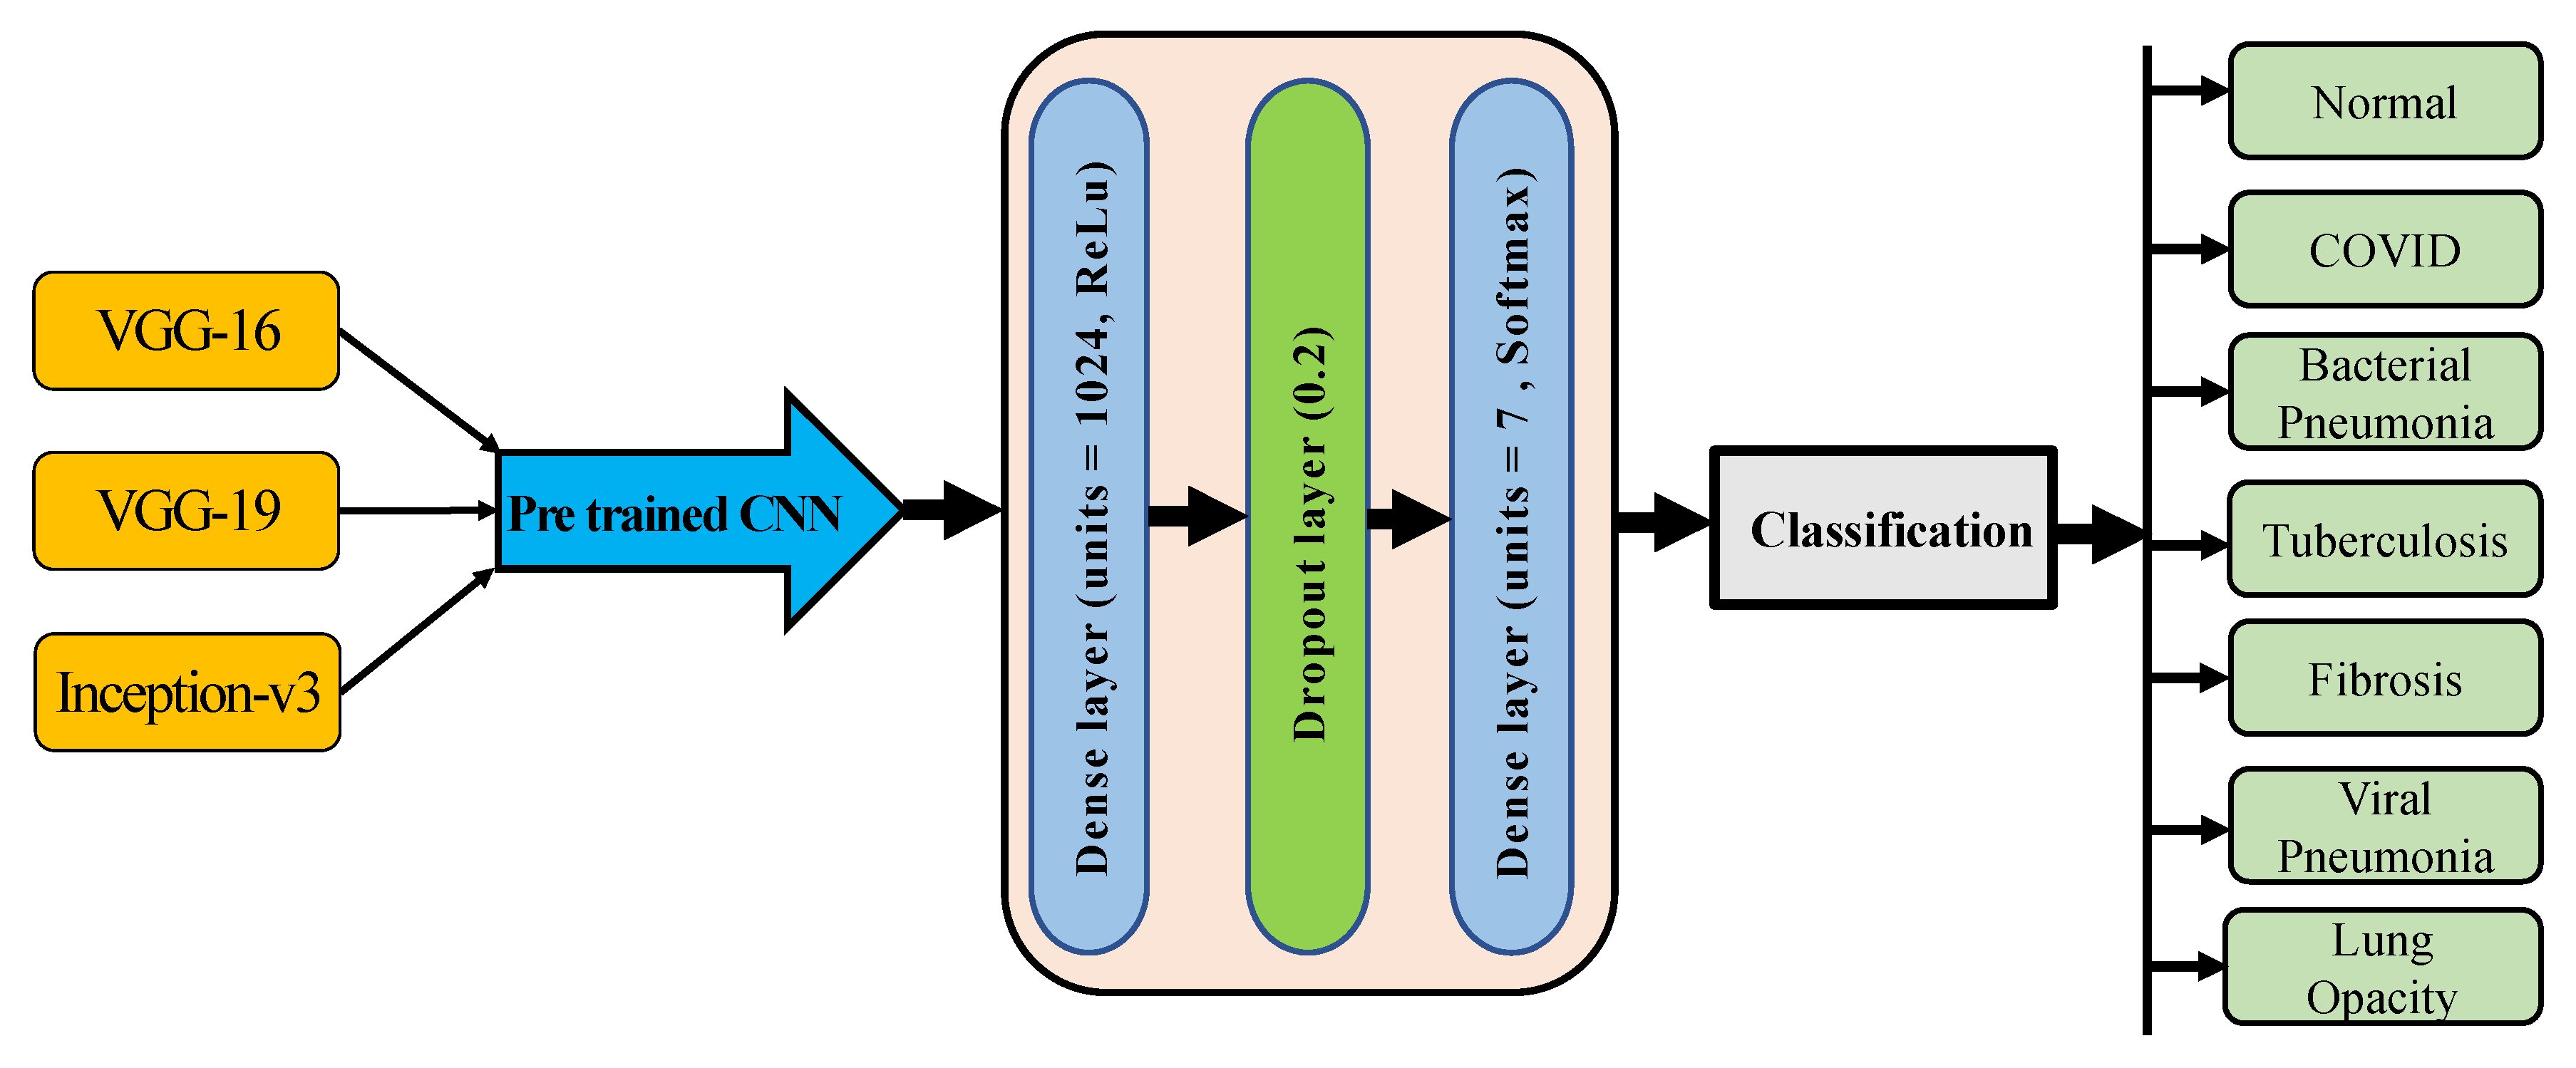
- The proposed CNN and three pre-trained CNN models (VGG-16, VGG-19, and Inception-v3 model) have been developed to detect COVID-19 and other lung disorders from the CXR images for various classification tasks.
- (4)
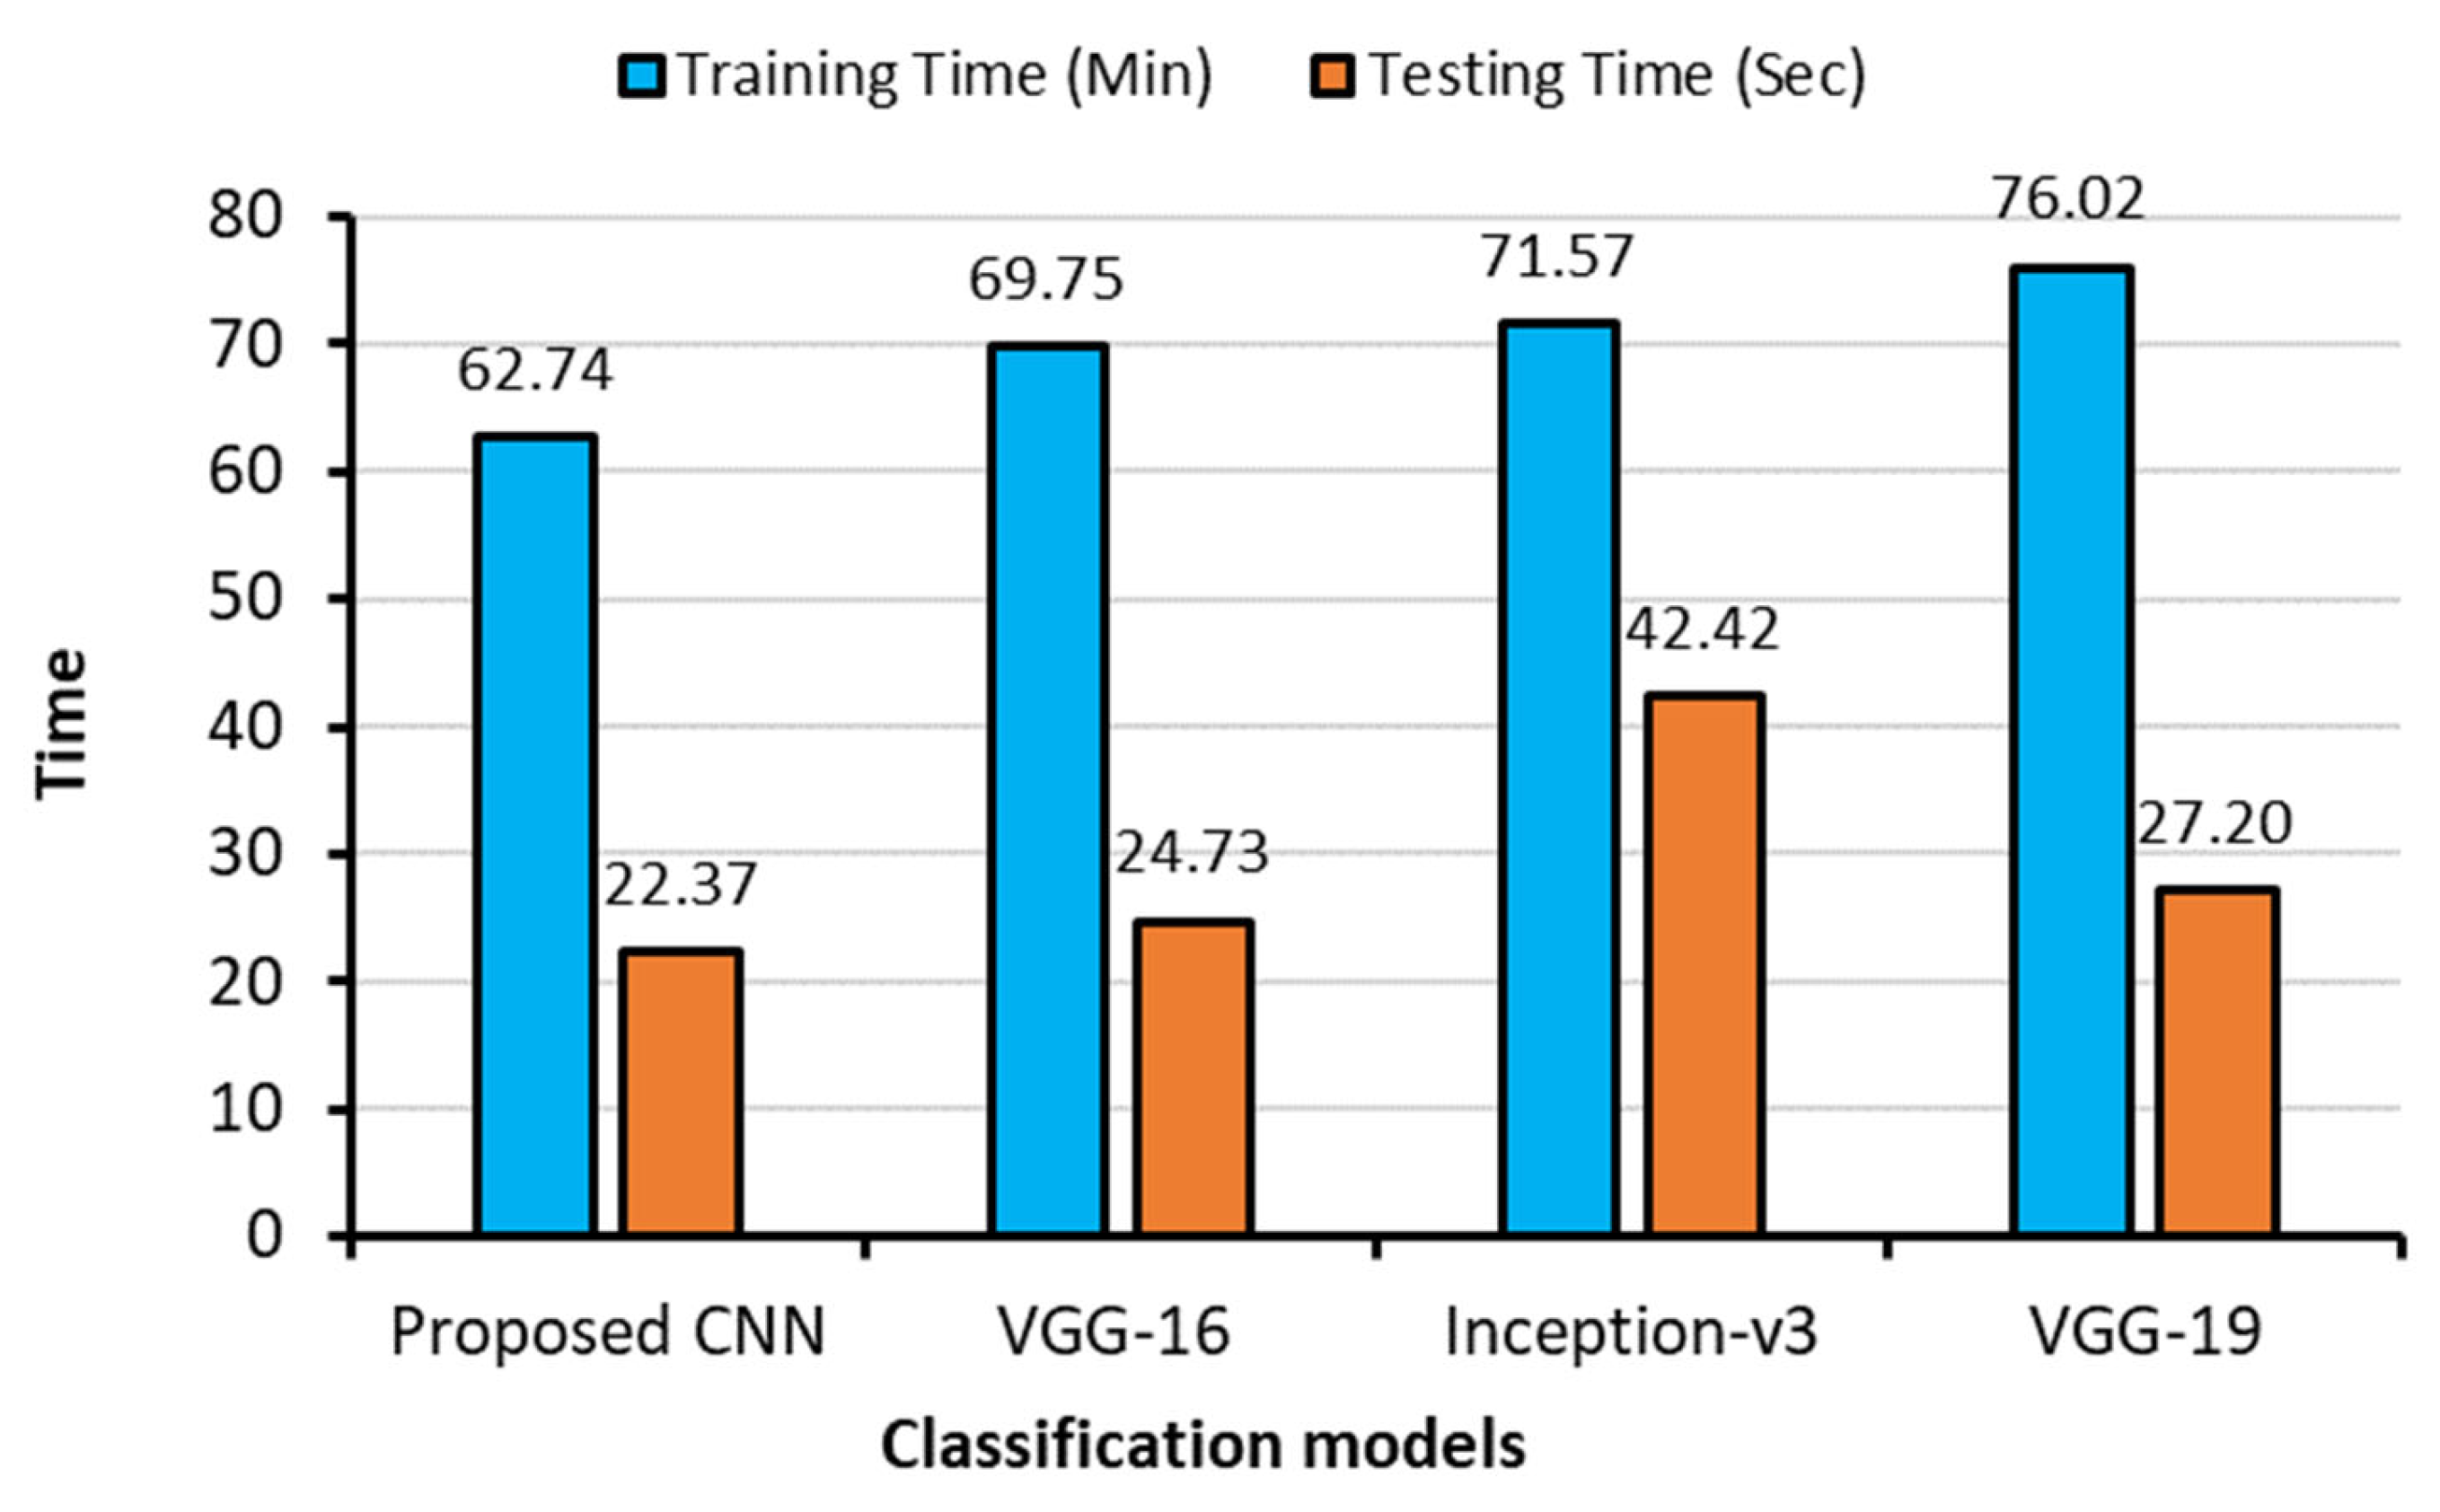
- The proposed CNN model is compared with the pretrained models on classification performance and processing speed.
2. Related Works
3. Methodologies
3.1. Data Collection
3.1.1. COVID-19 Radiography Database
3.1.2. Viral Pneumonia vs. Bacterial Pneumonia Database
3.1.3. CXR Database for Tuberculosis (TB) and Fibrosis
3.1.4. New Dataset Creation
3.2. Dataset Splitting
3.3. Training Data Balancing
3.4. Data Pre-Processing
3.5. Deep learning Architectures
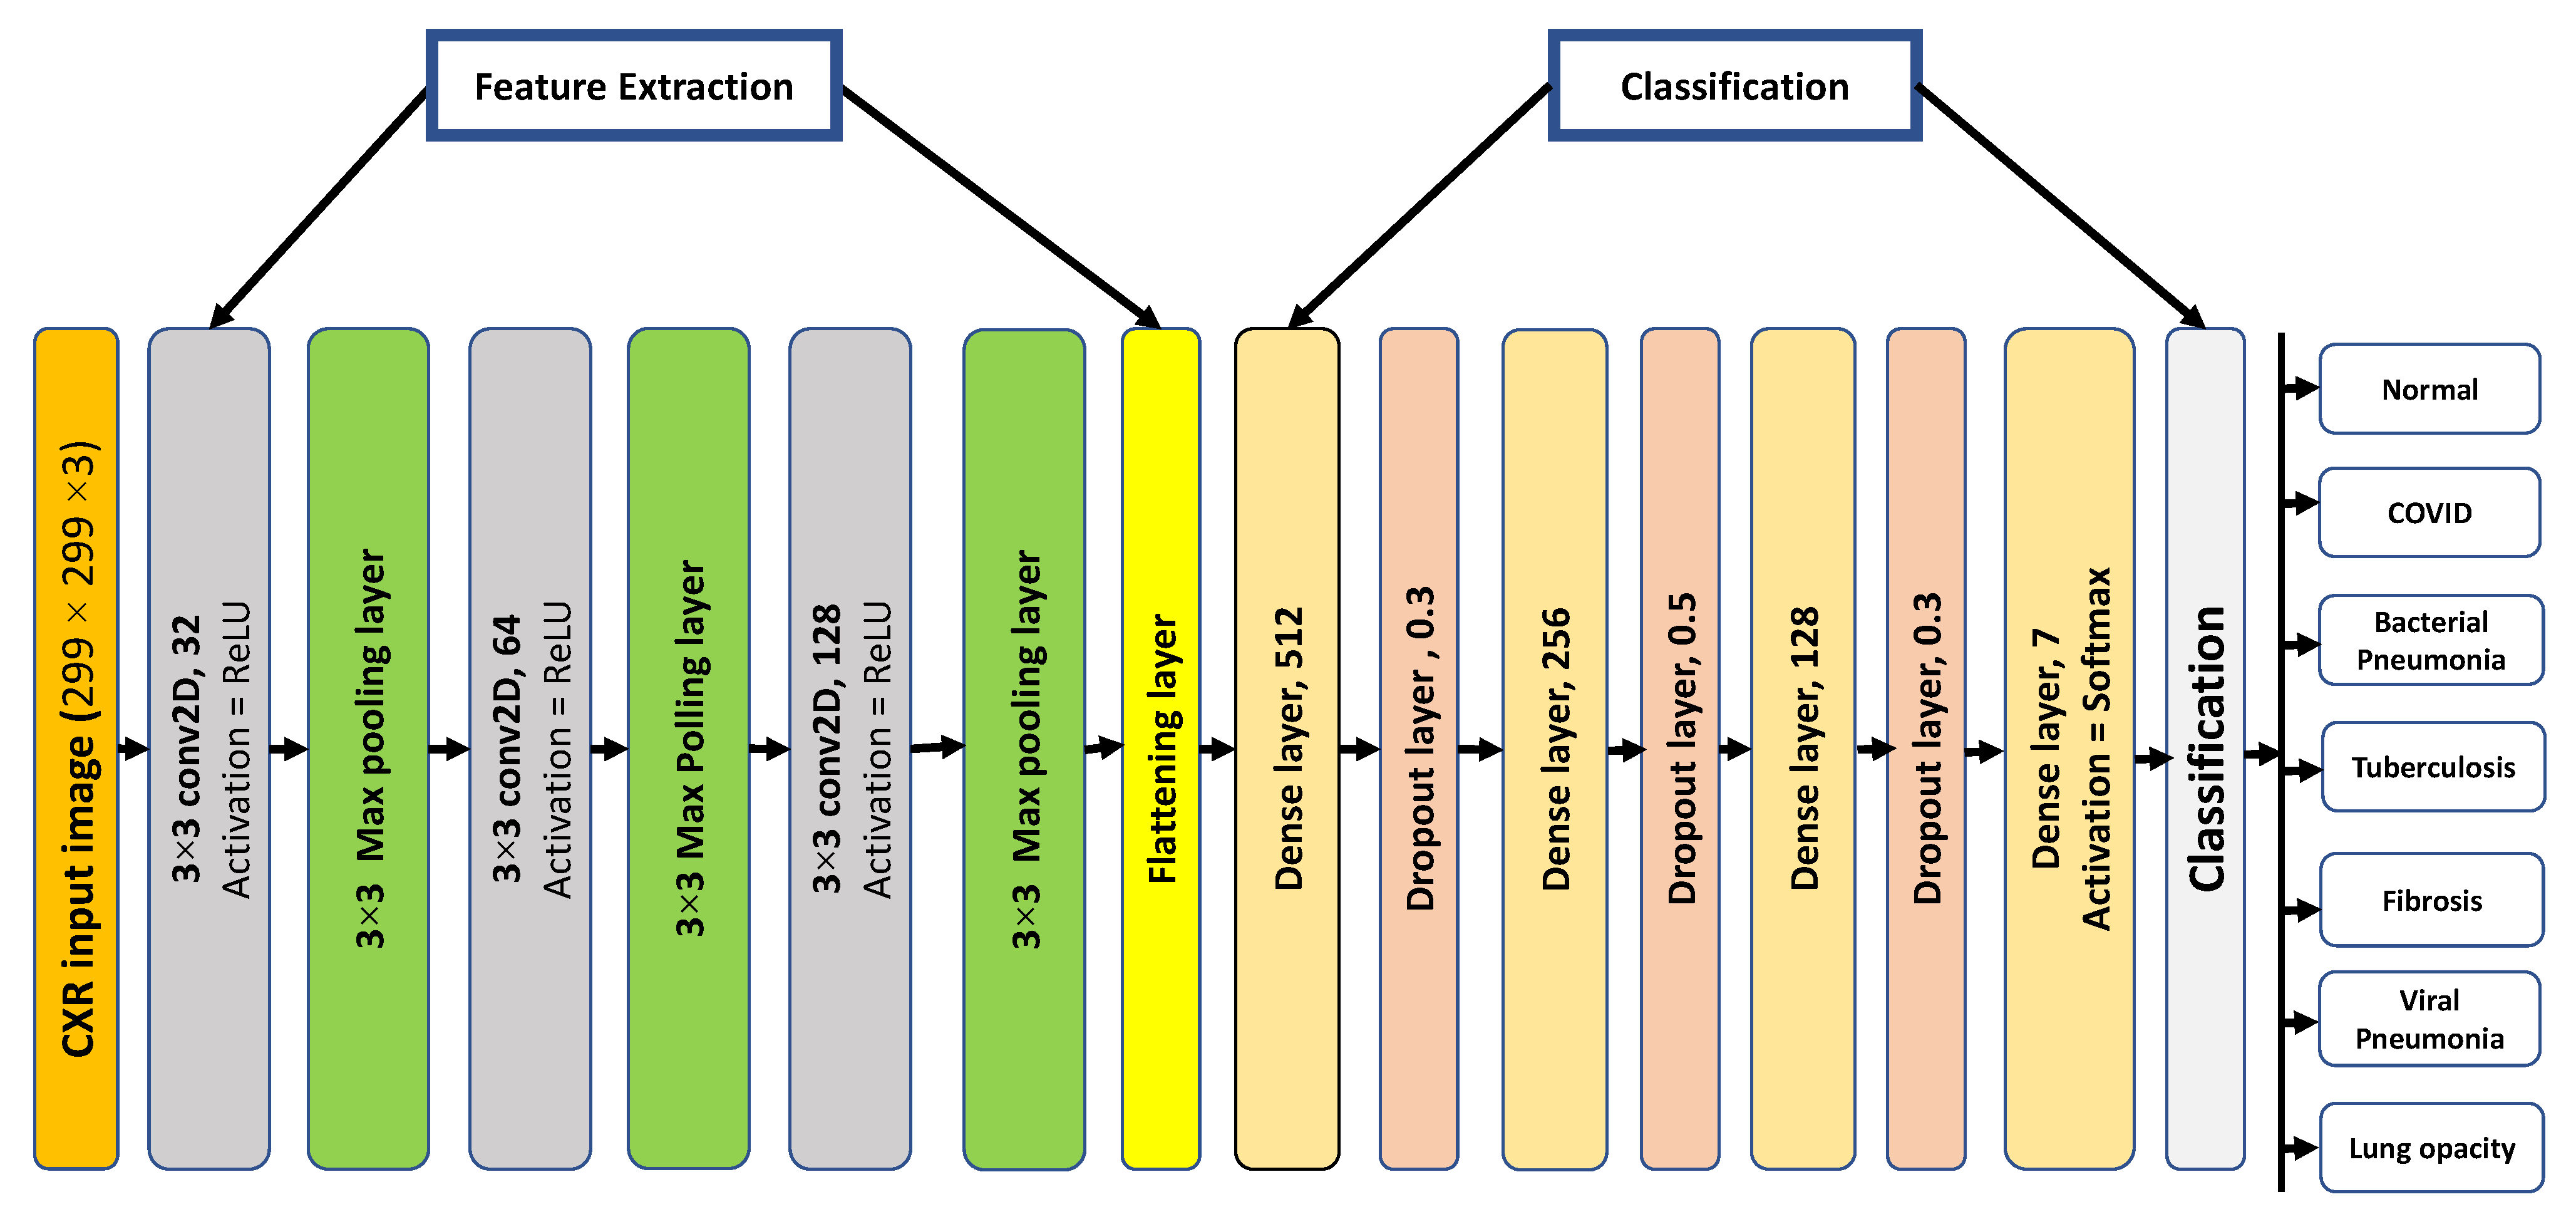
3.5.1. Proposed 2D-CNN Architecture
3.5.2. Pre-Trained Models Architecture
3.6. Experiment Setup
3.7. Evaluation Criteria
4. Experimental Results
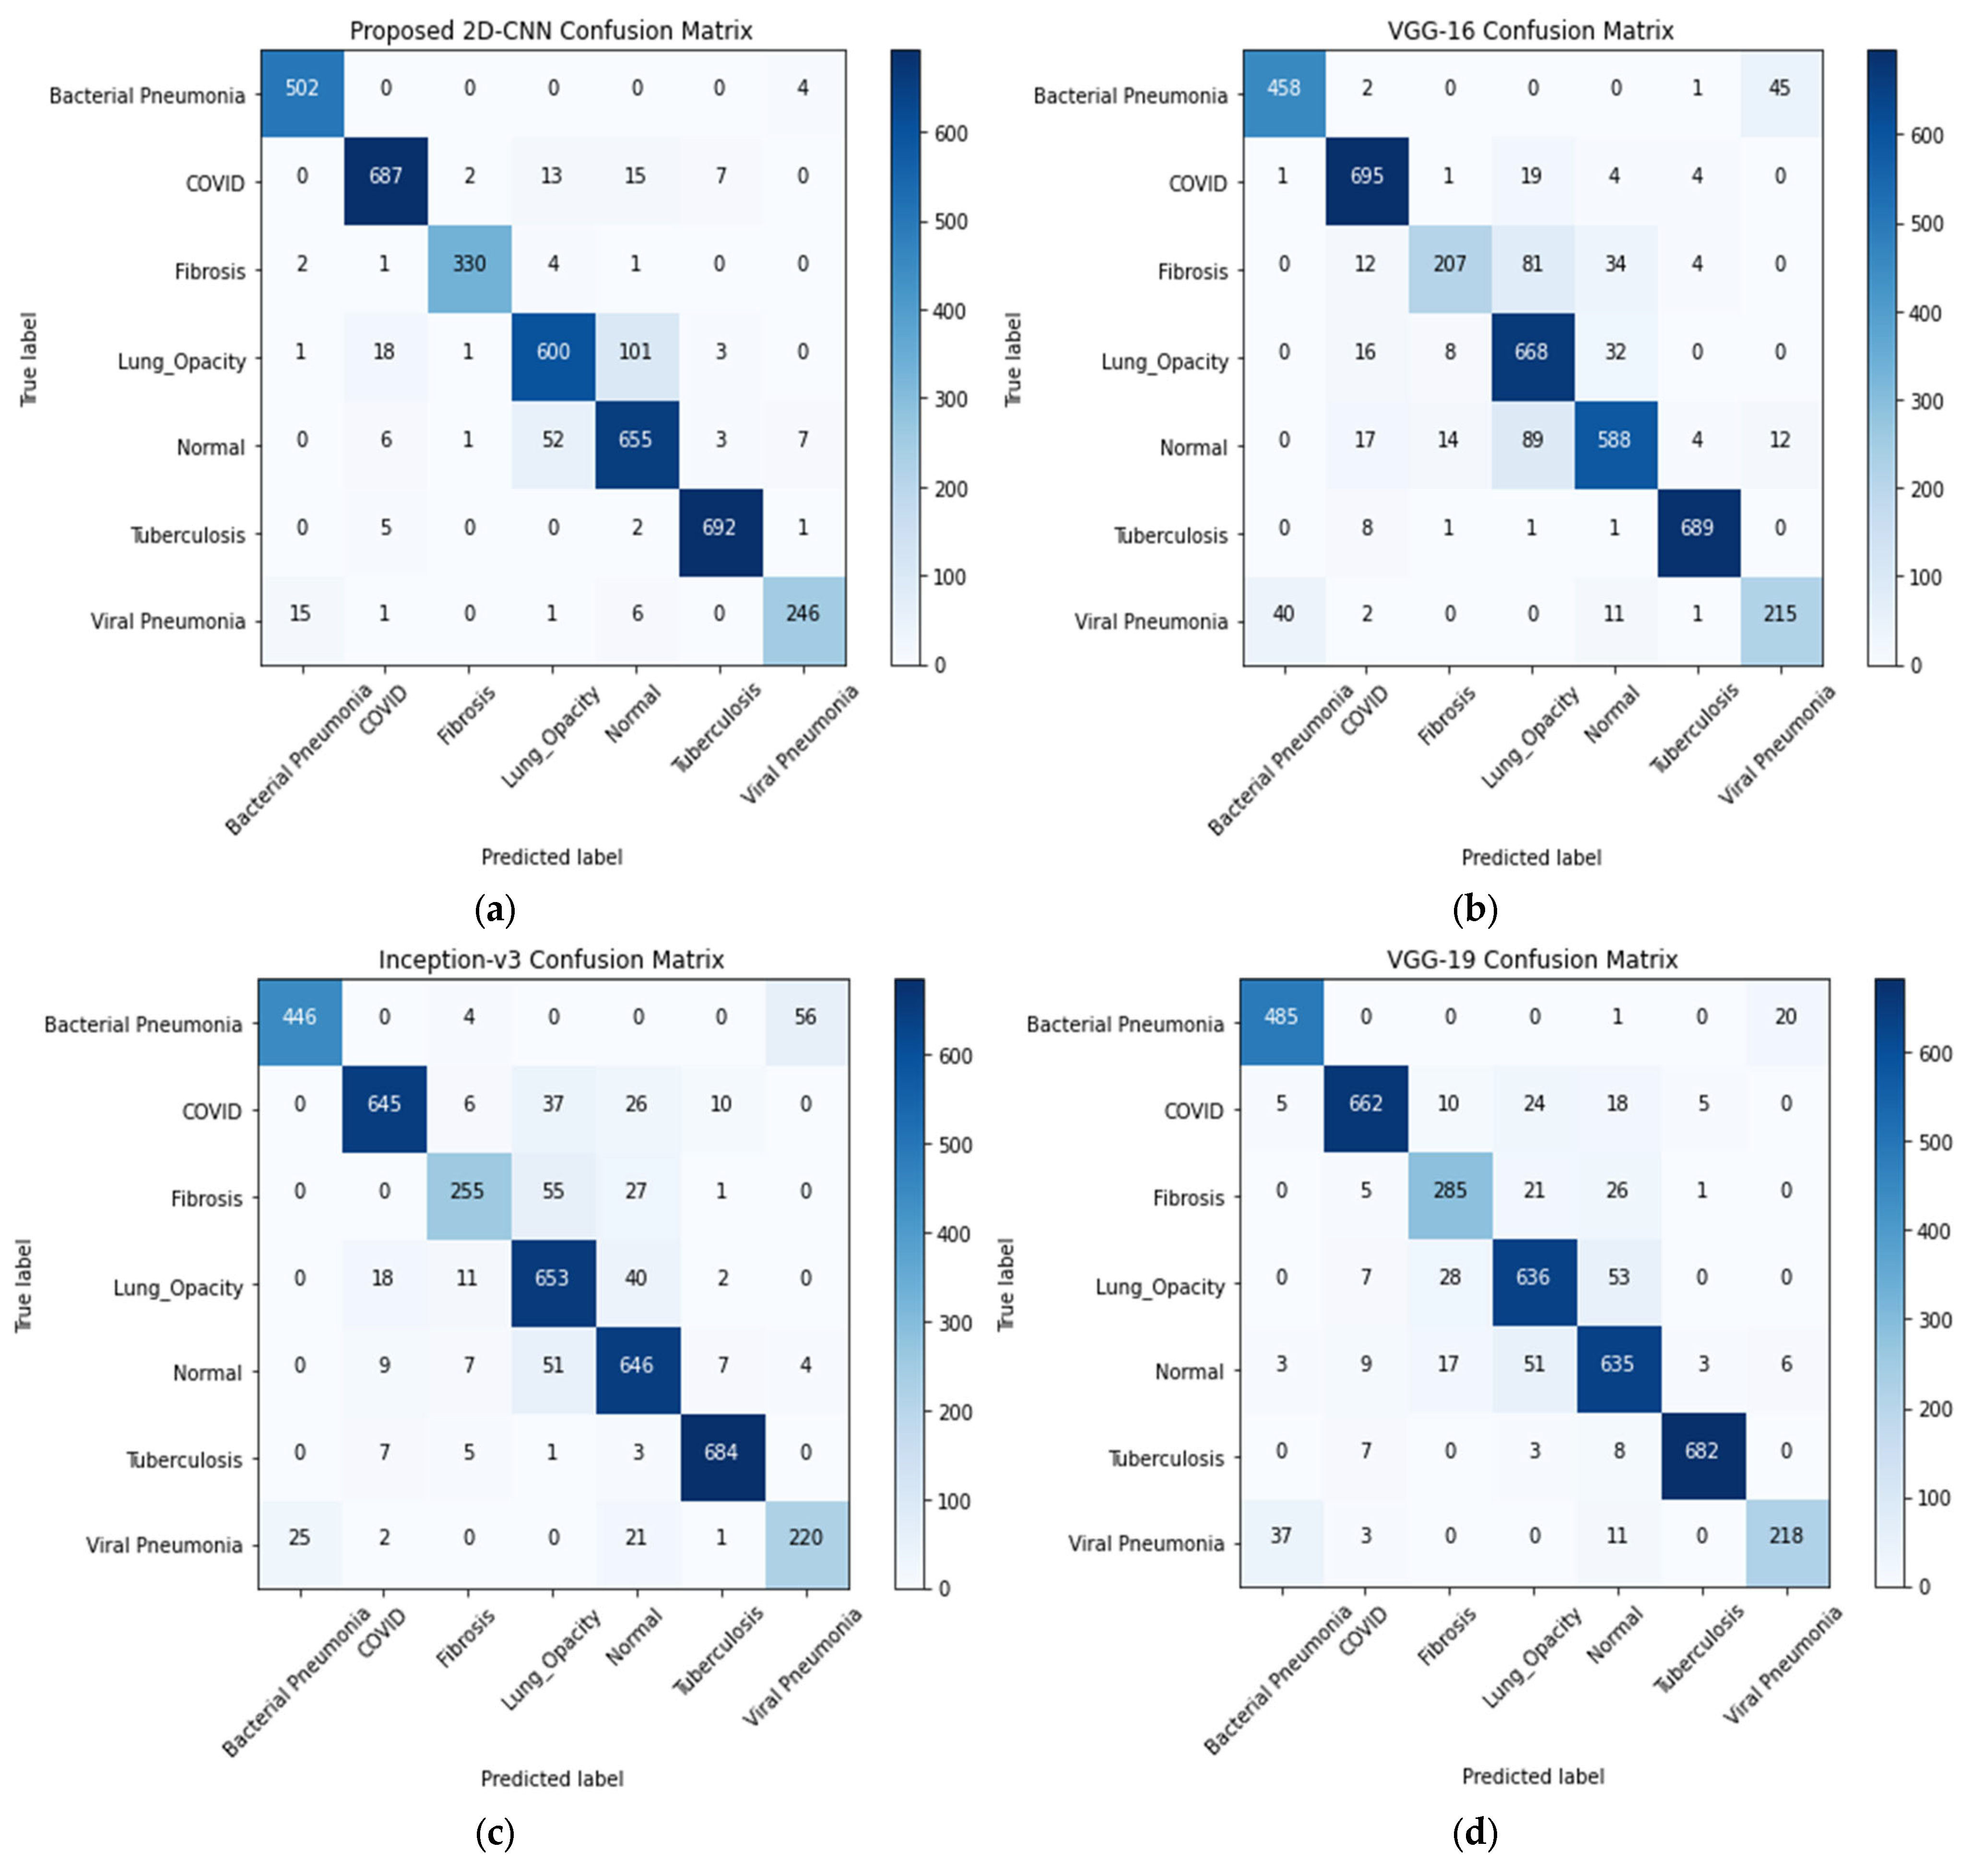
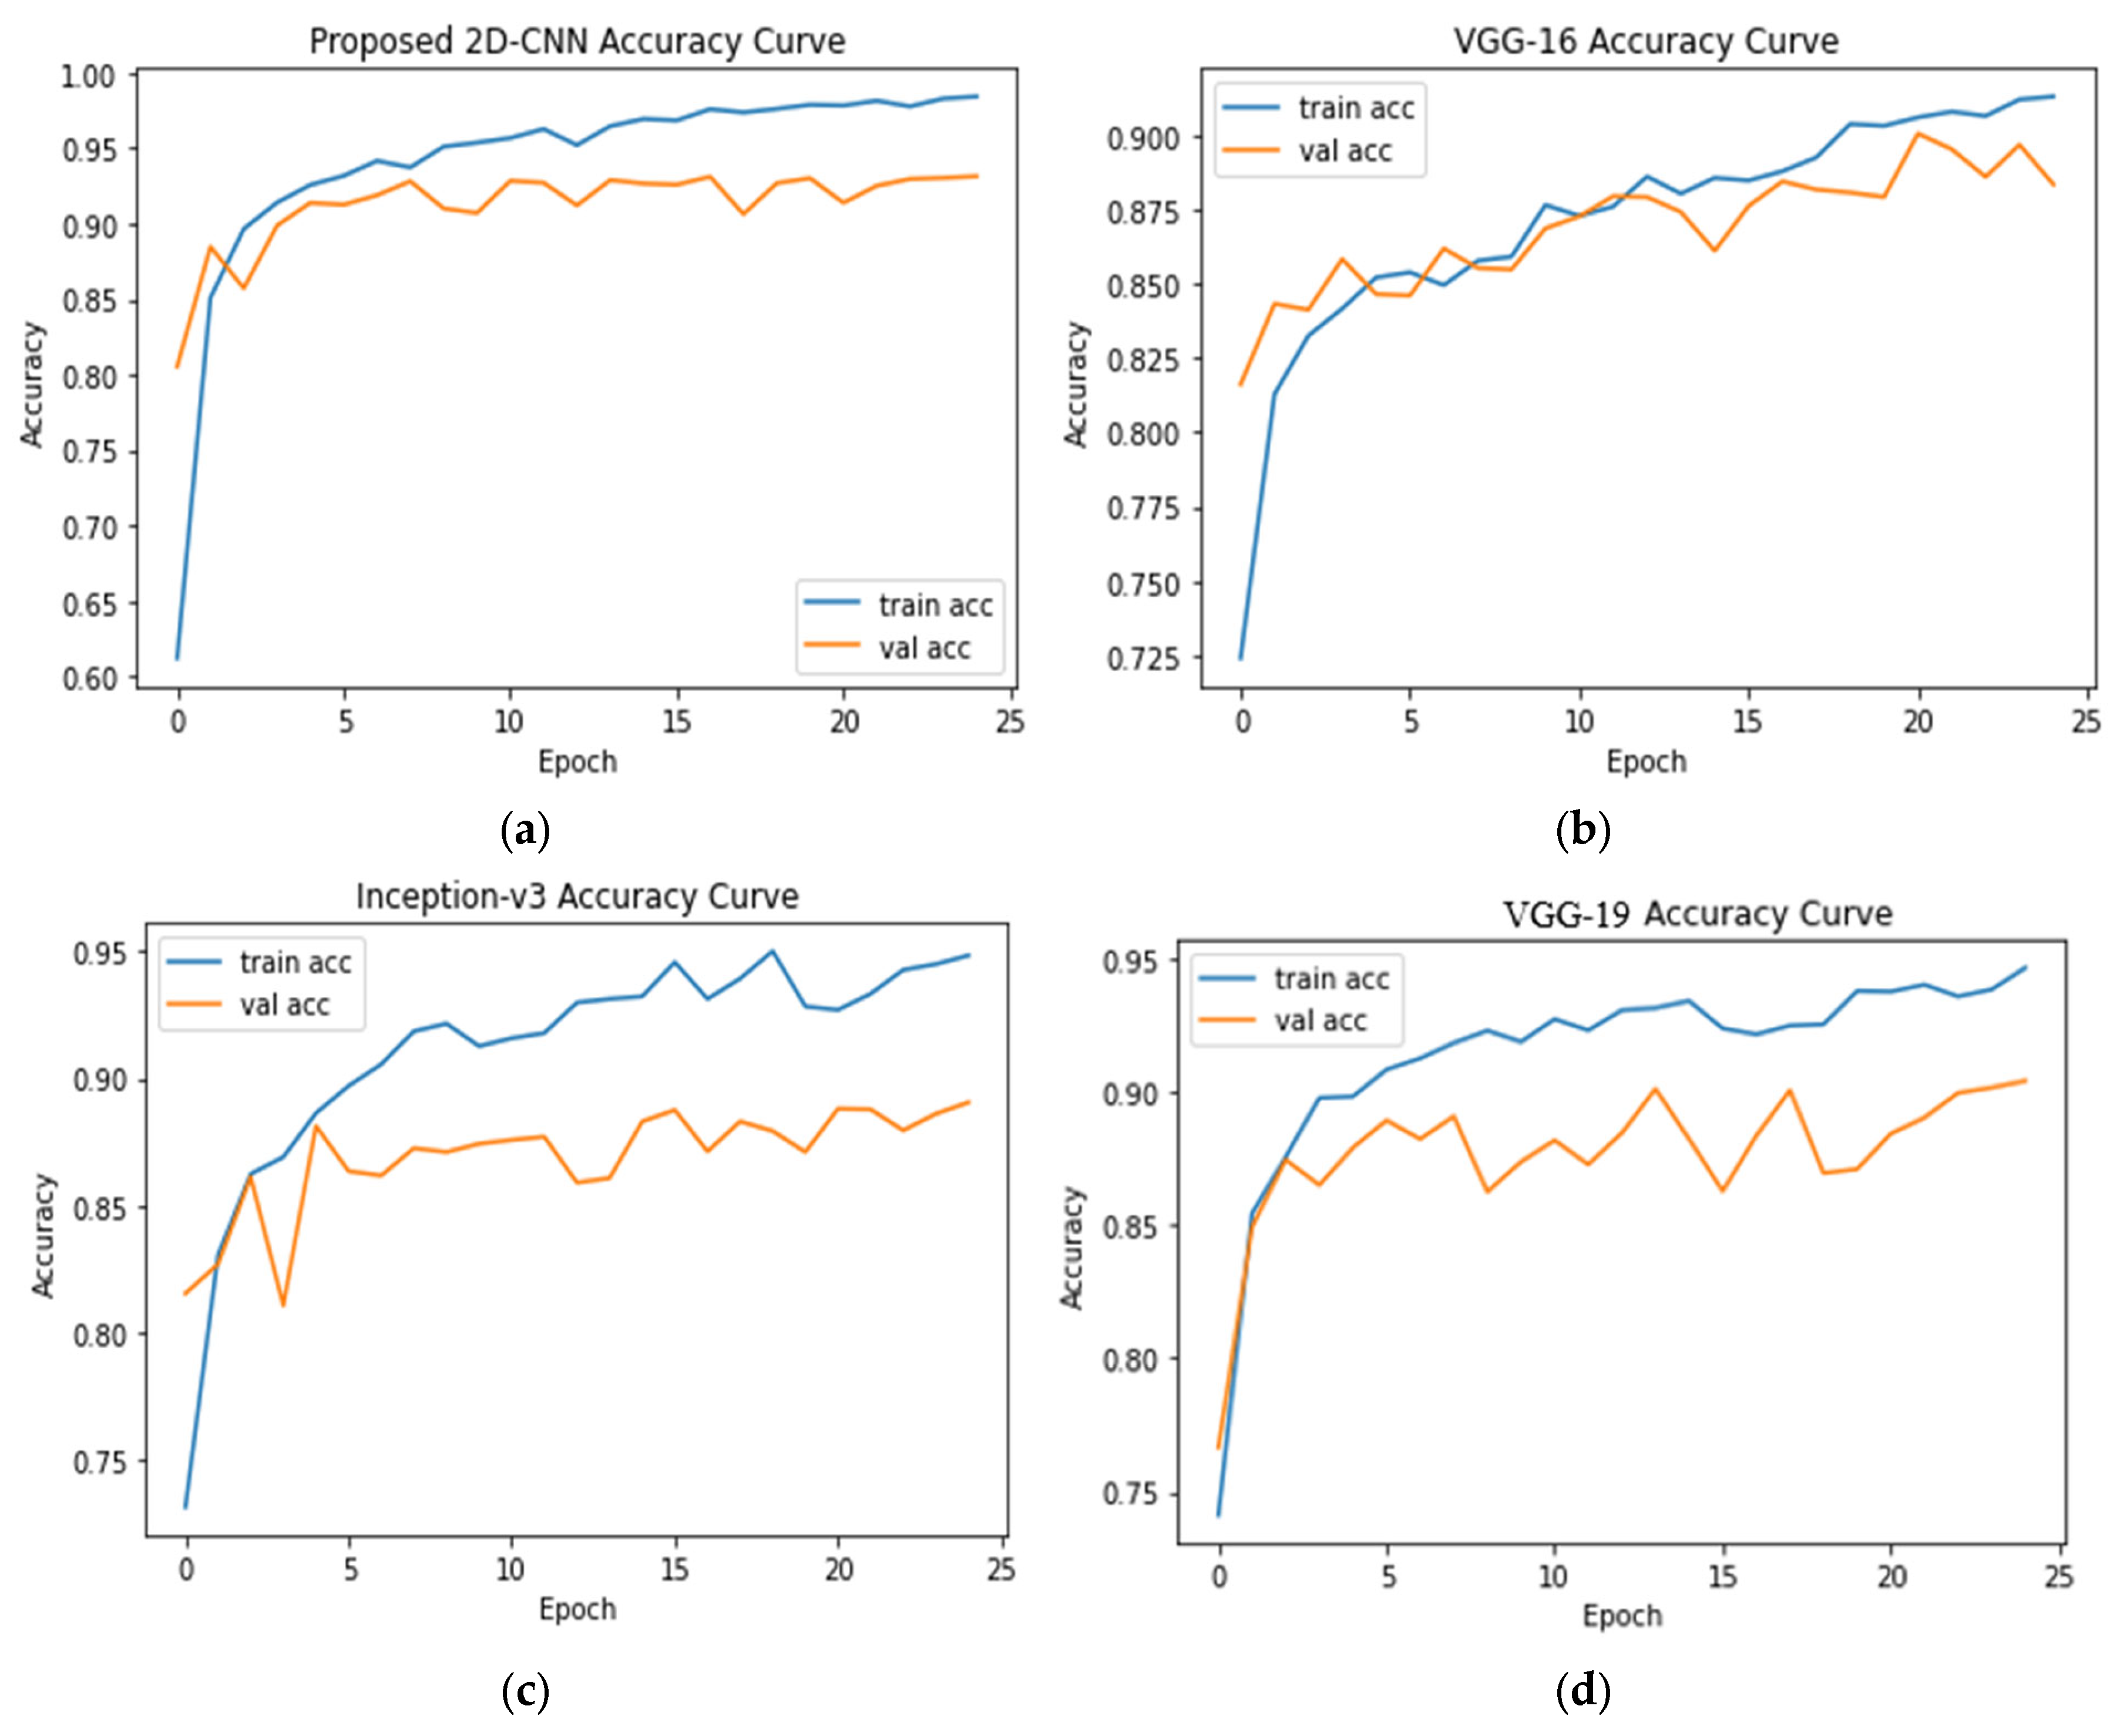
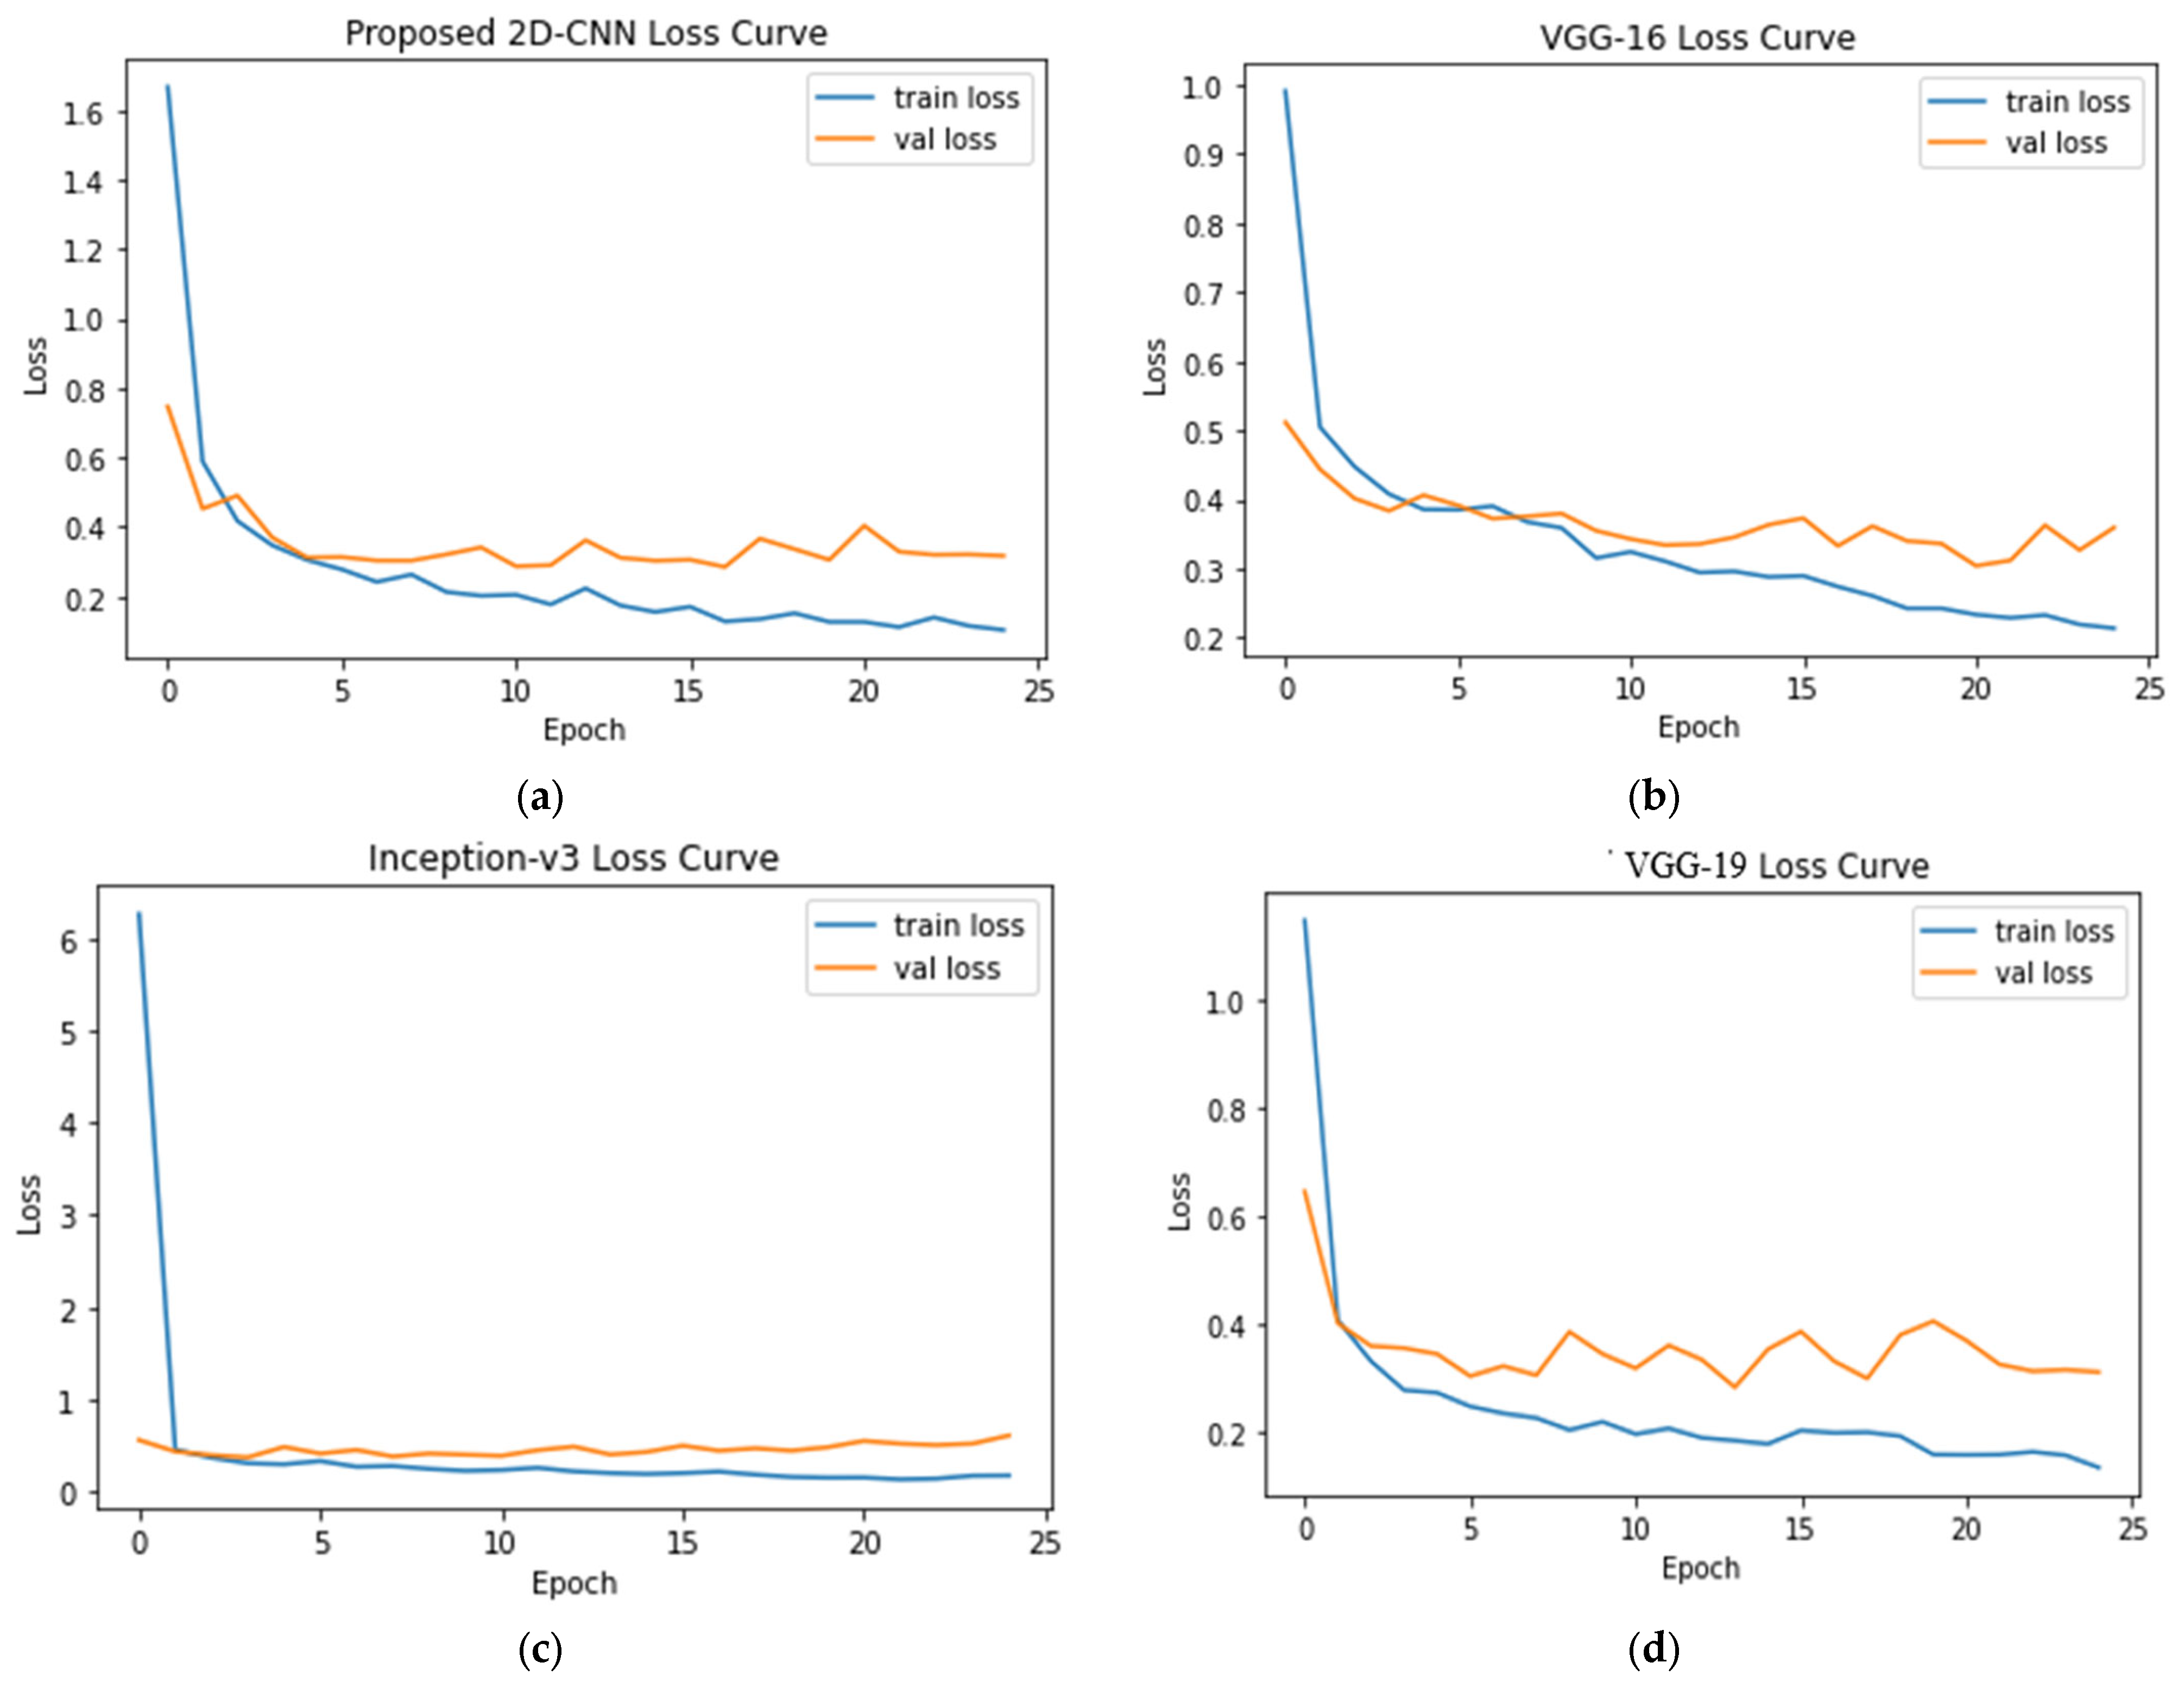
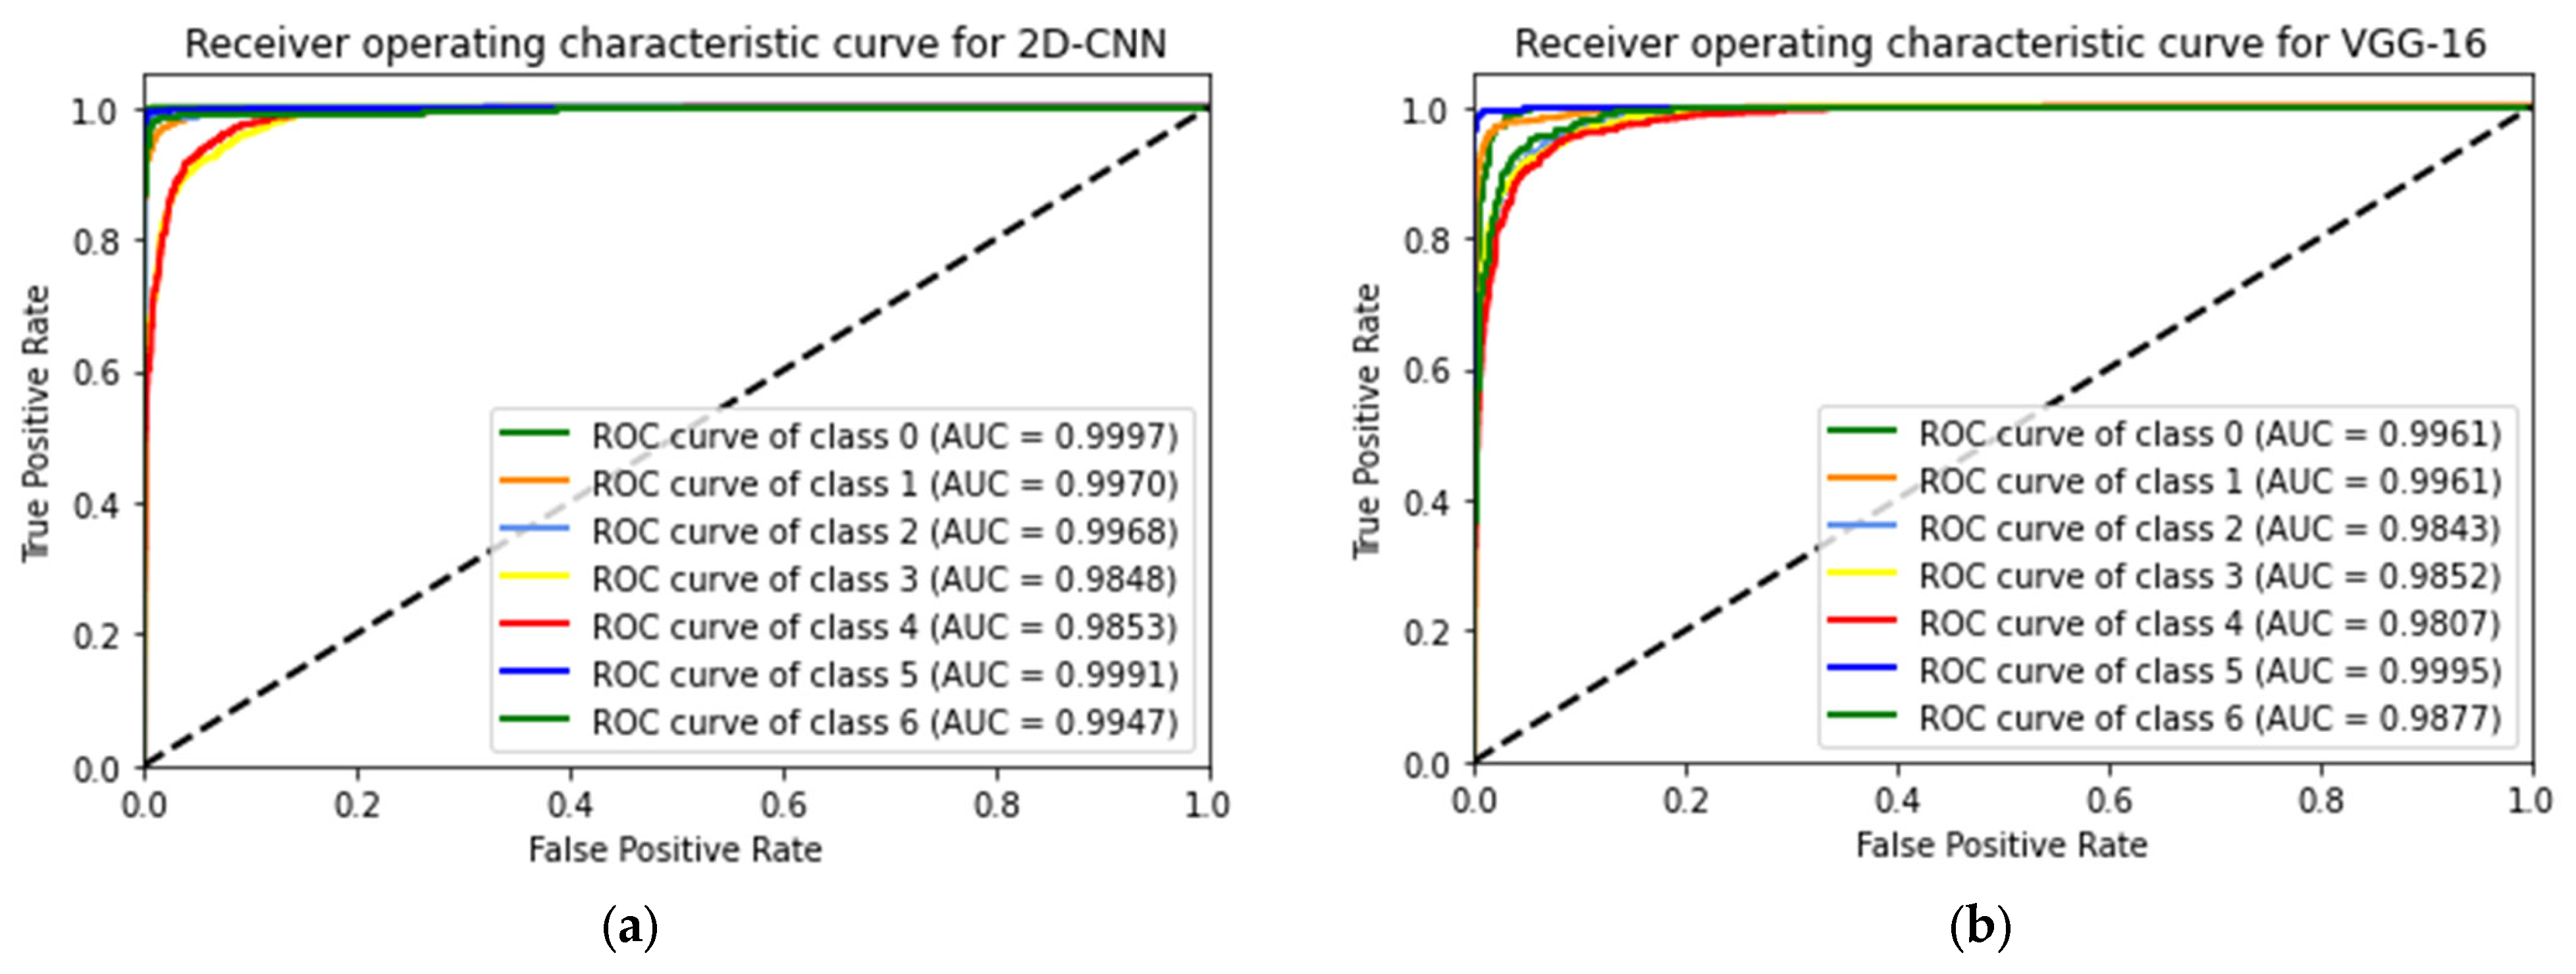
4.1. Seven-Class Classification System
4.2. Six-Class Classification System
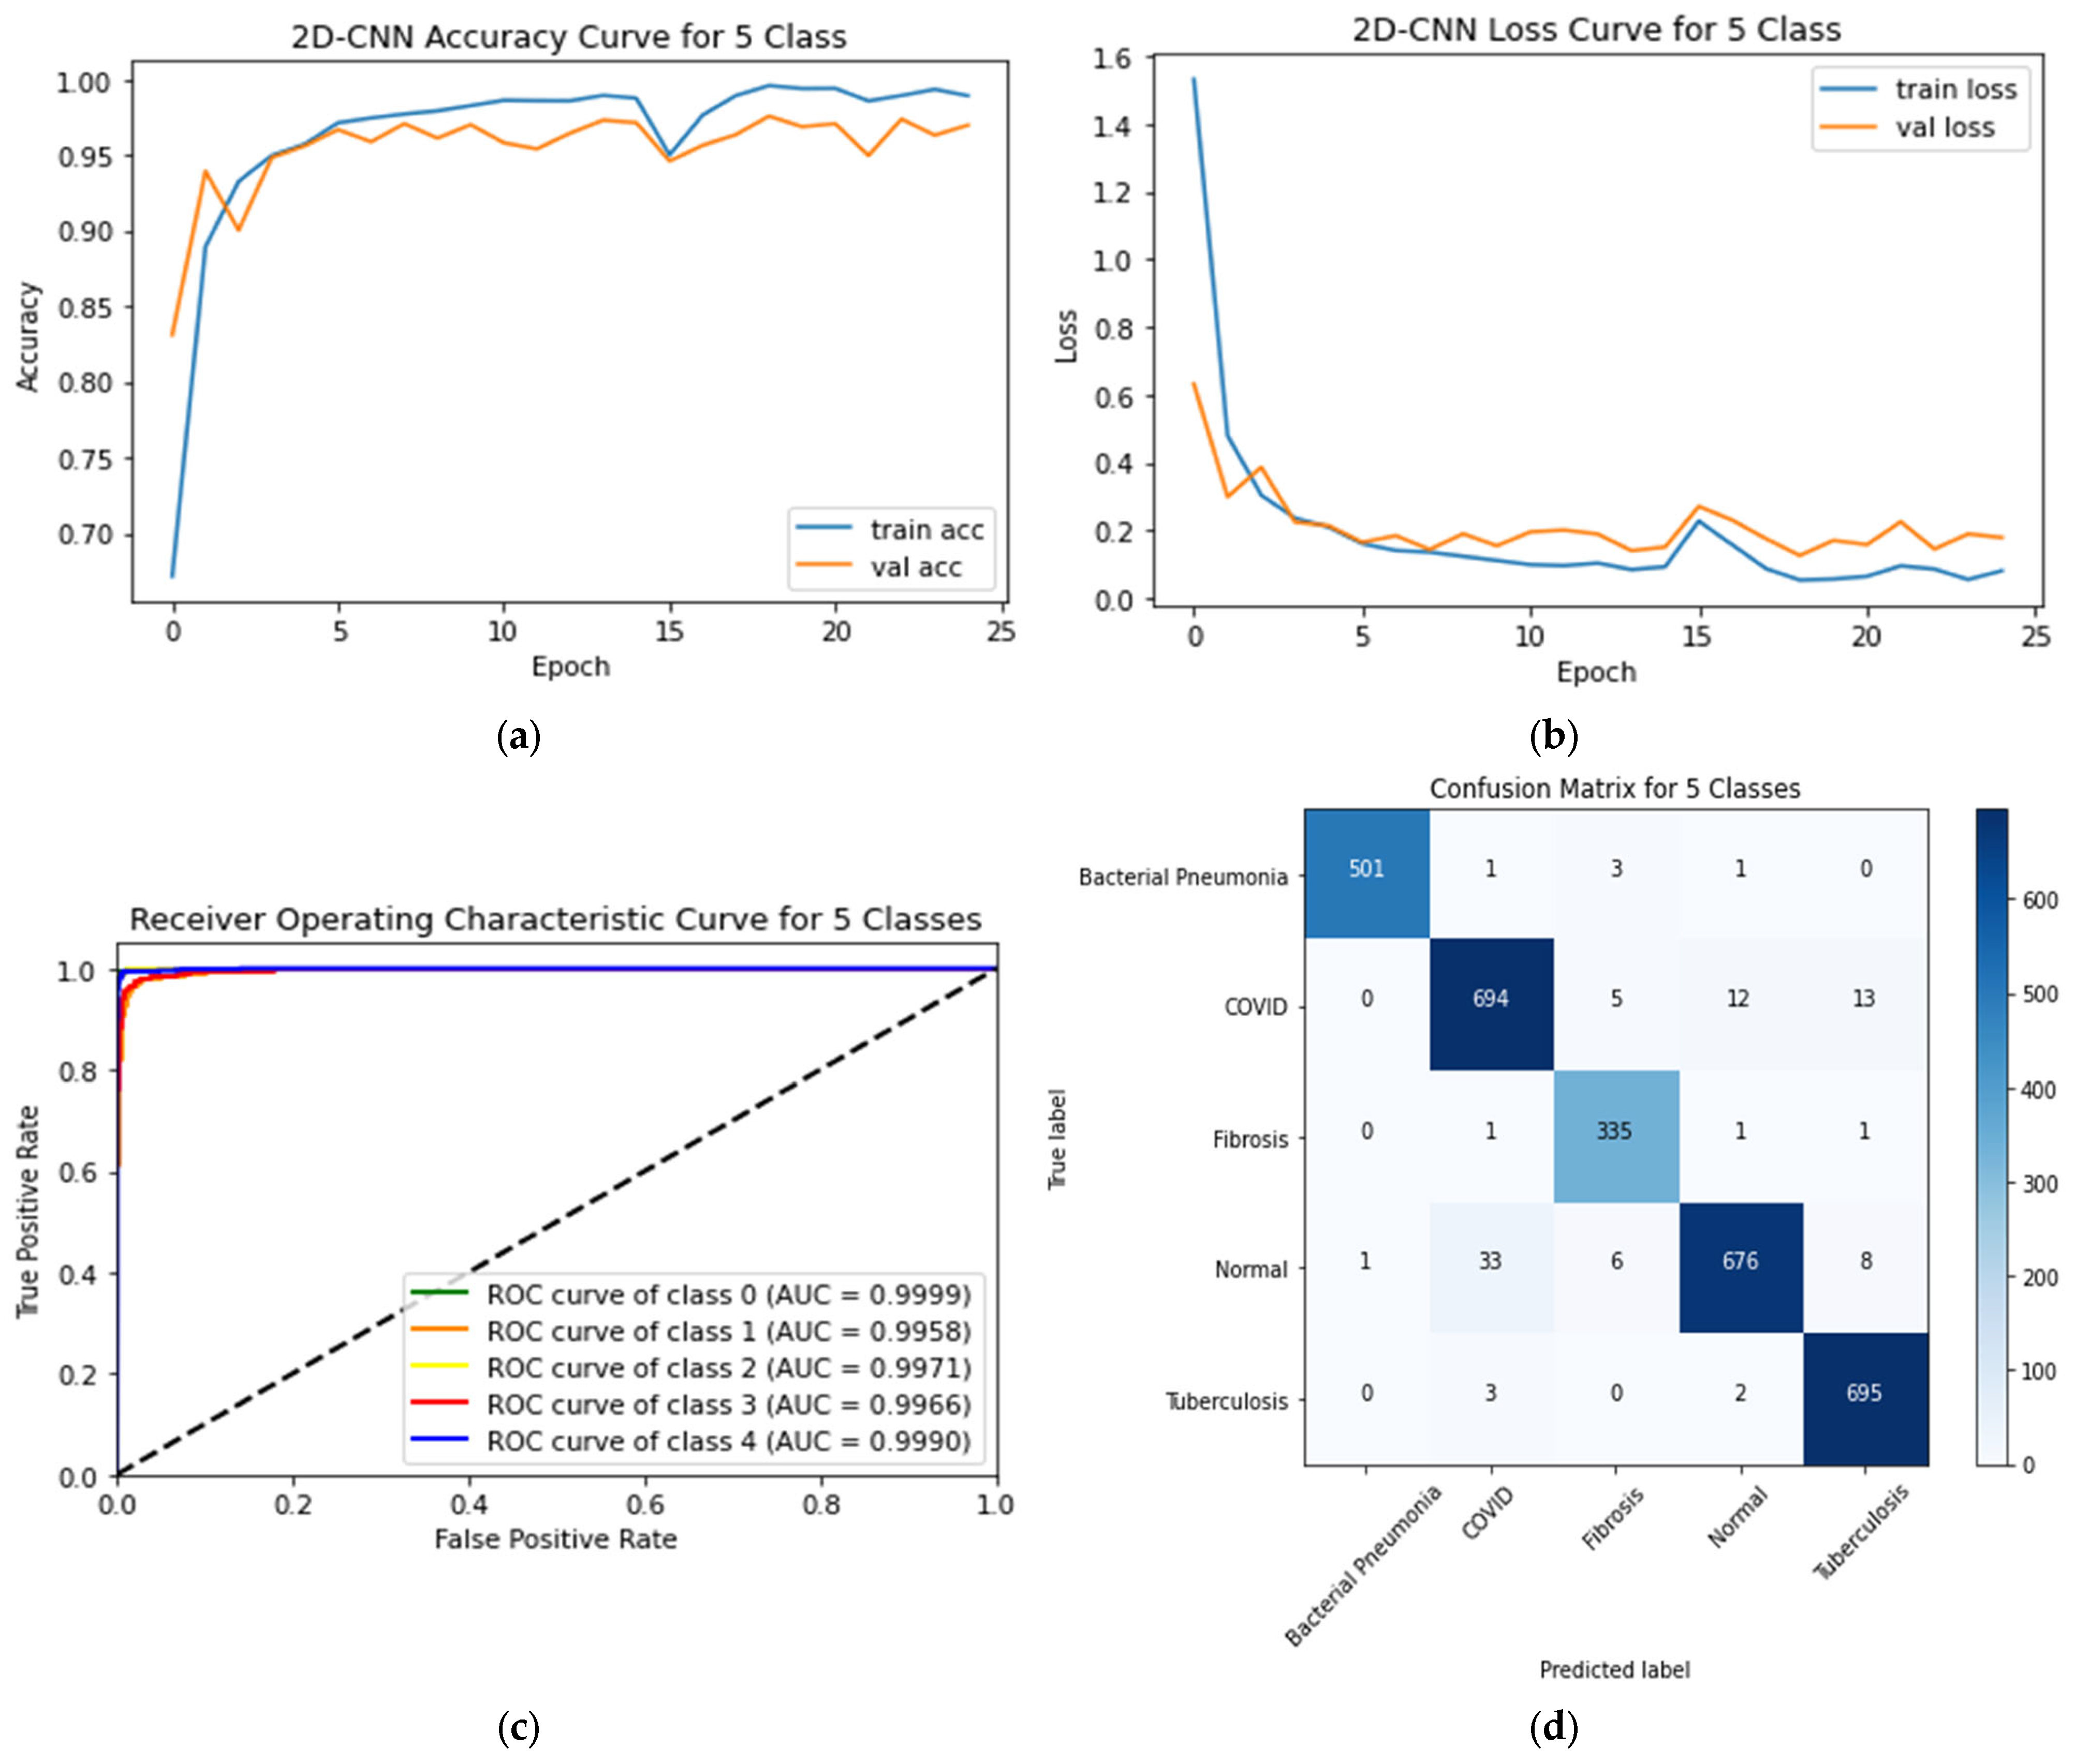
4.3. Five-Class Classification System
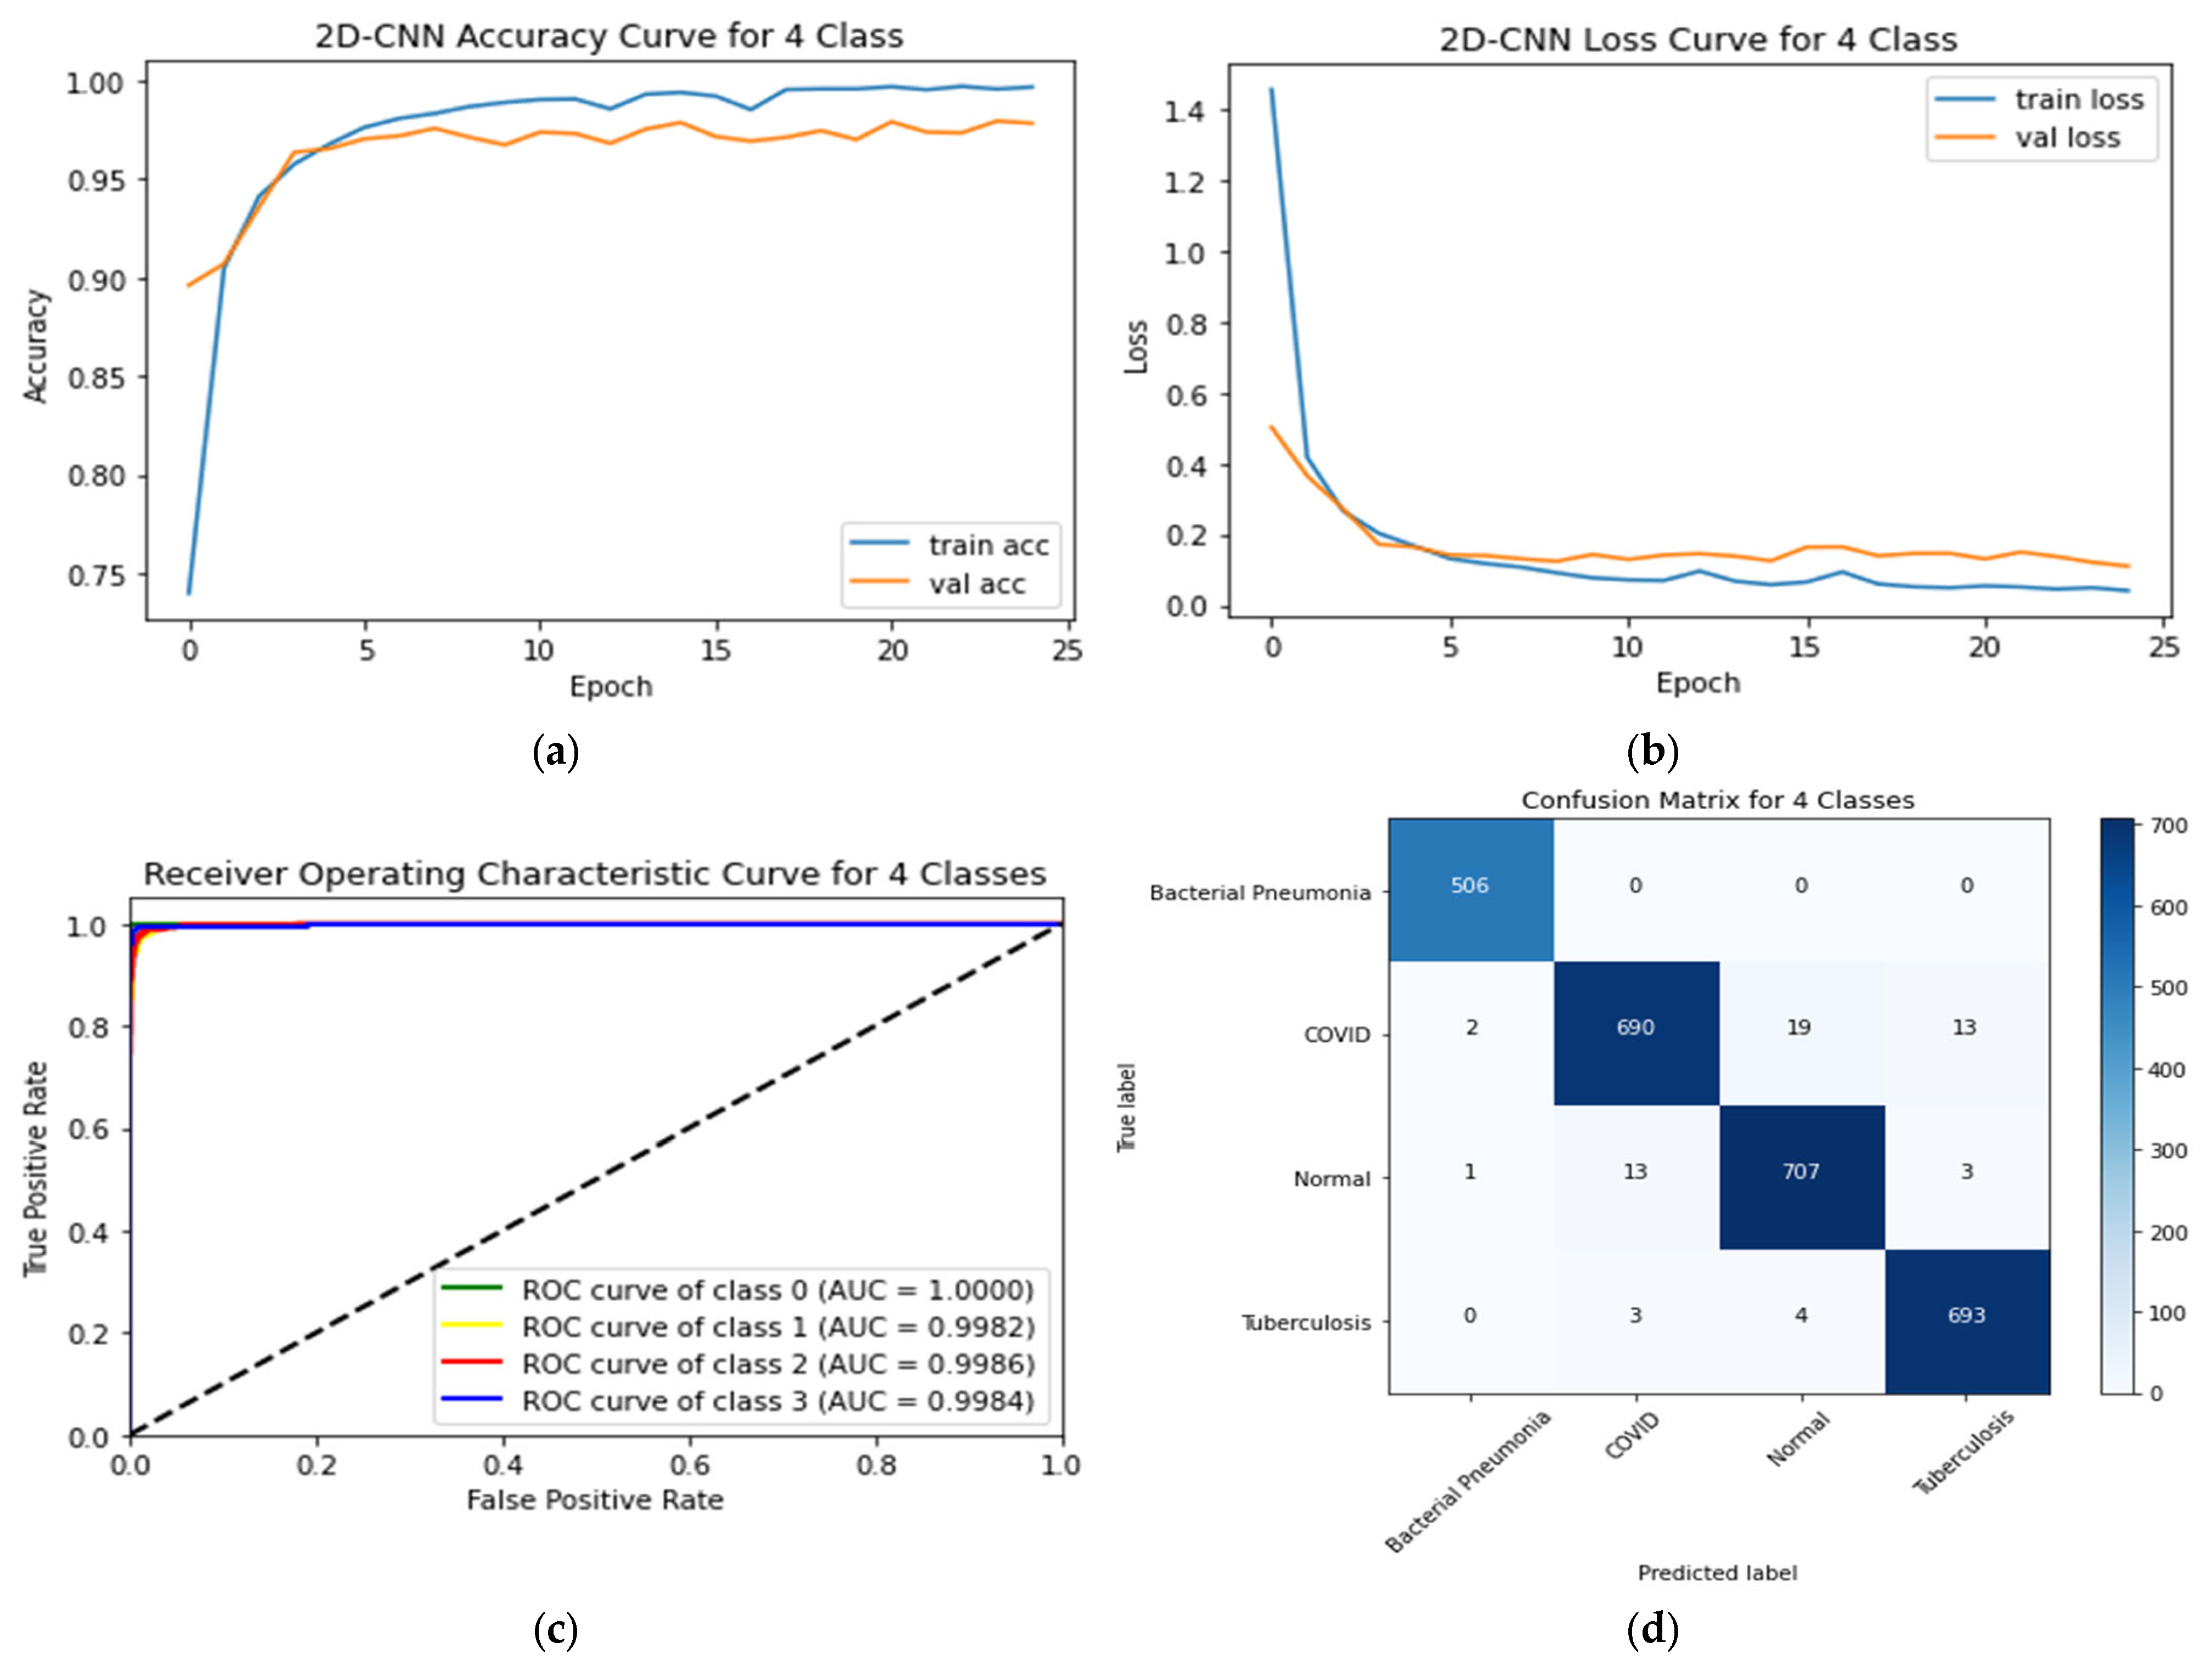
4.4. Four-Class Classification System
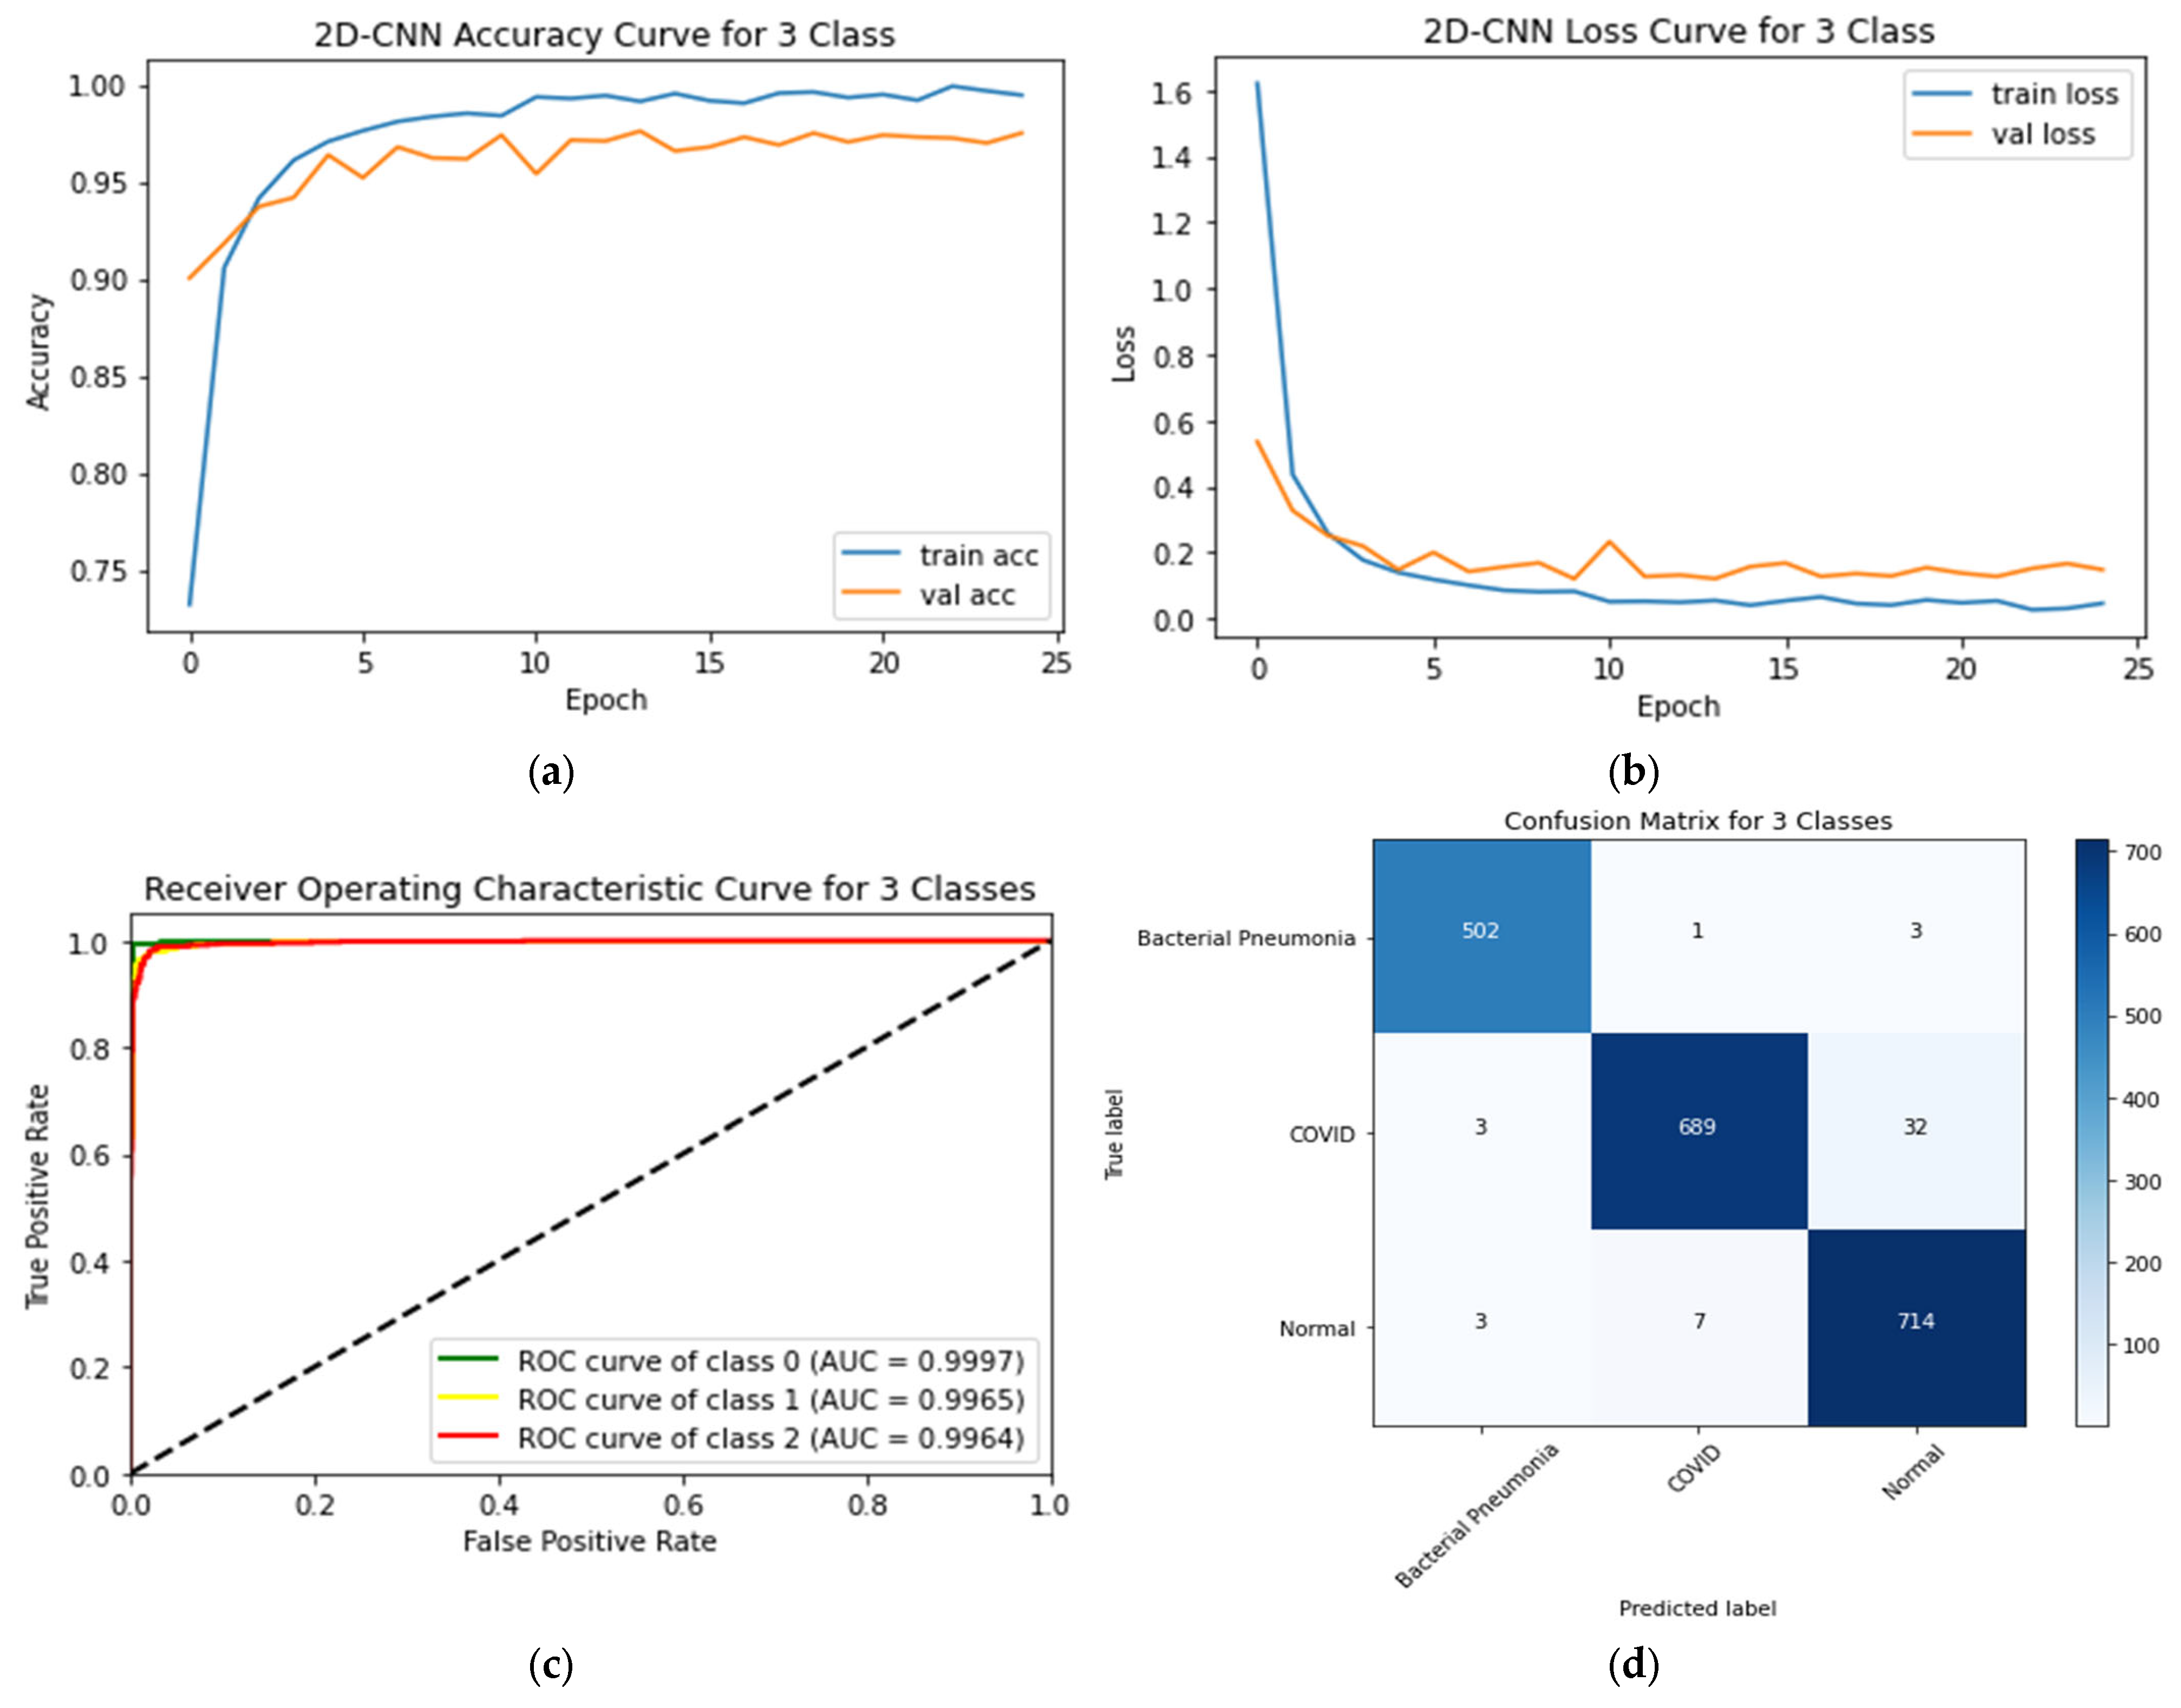
4.5. Three-Class Classification System
4.6. Binary-Class Classification System
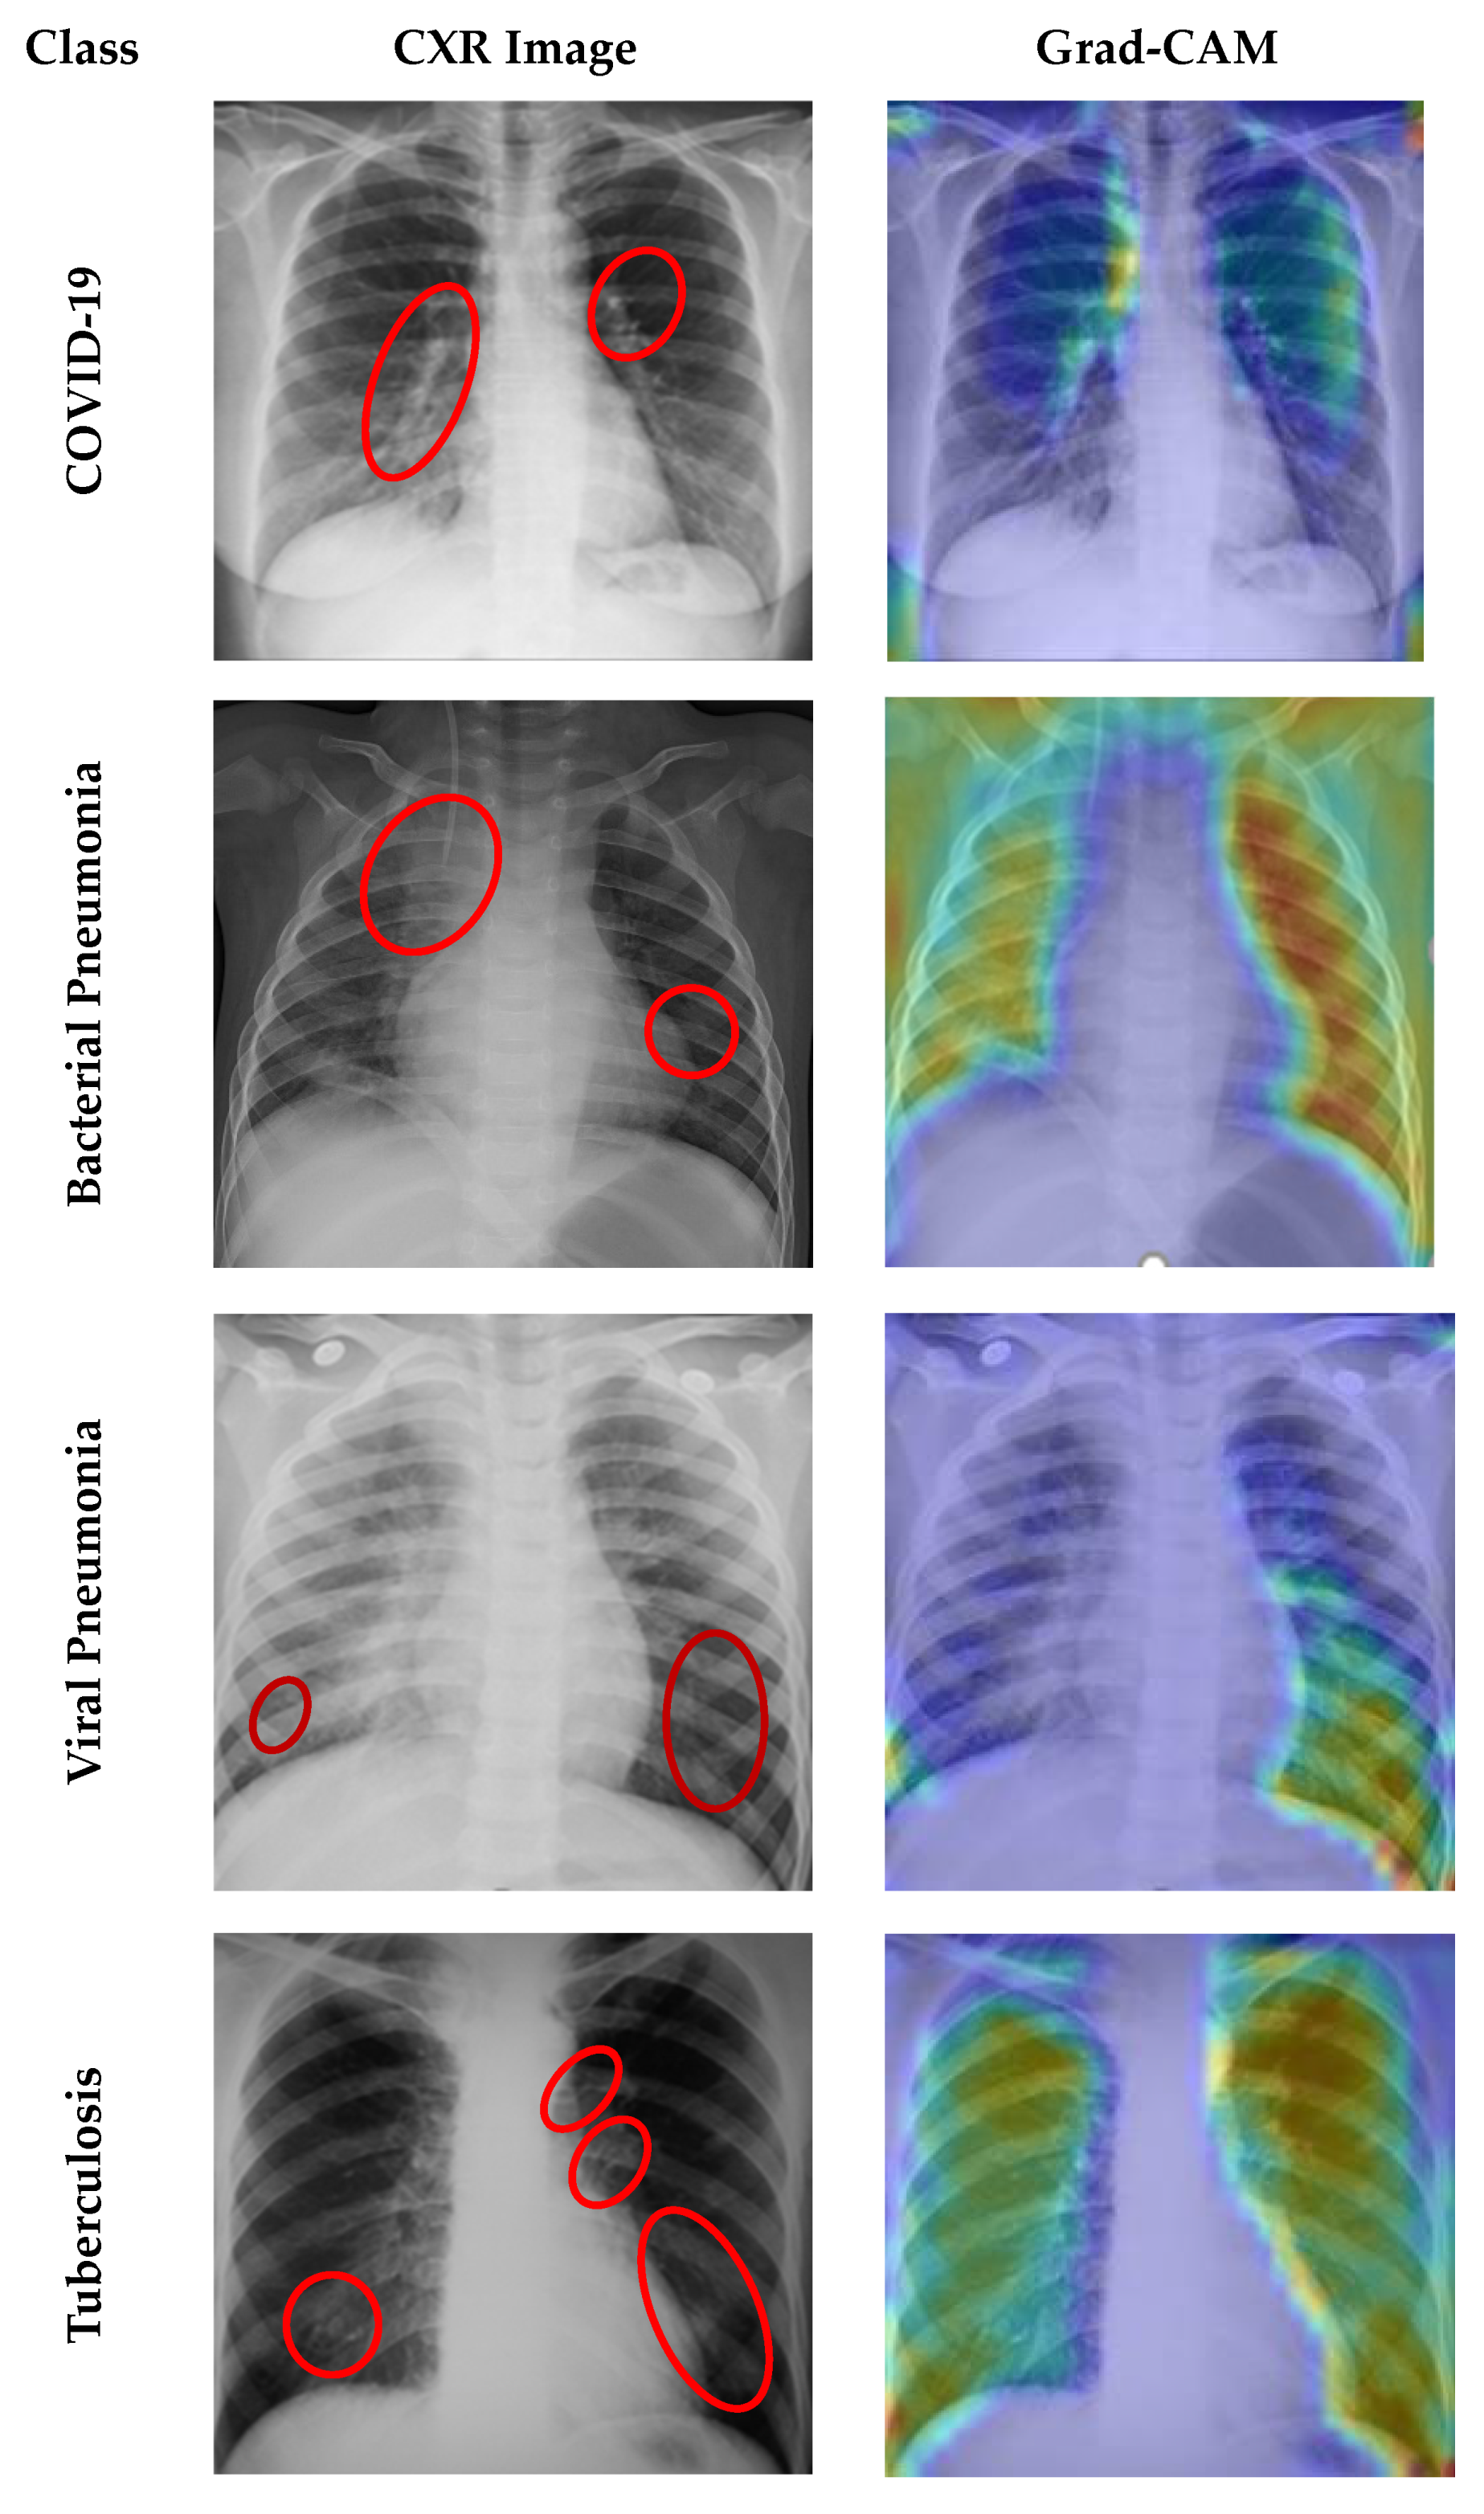
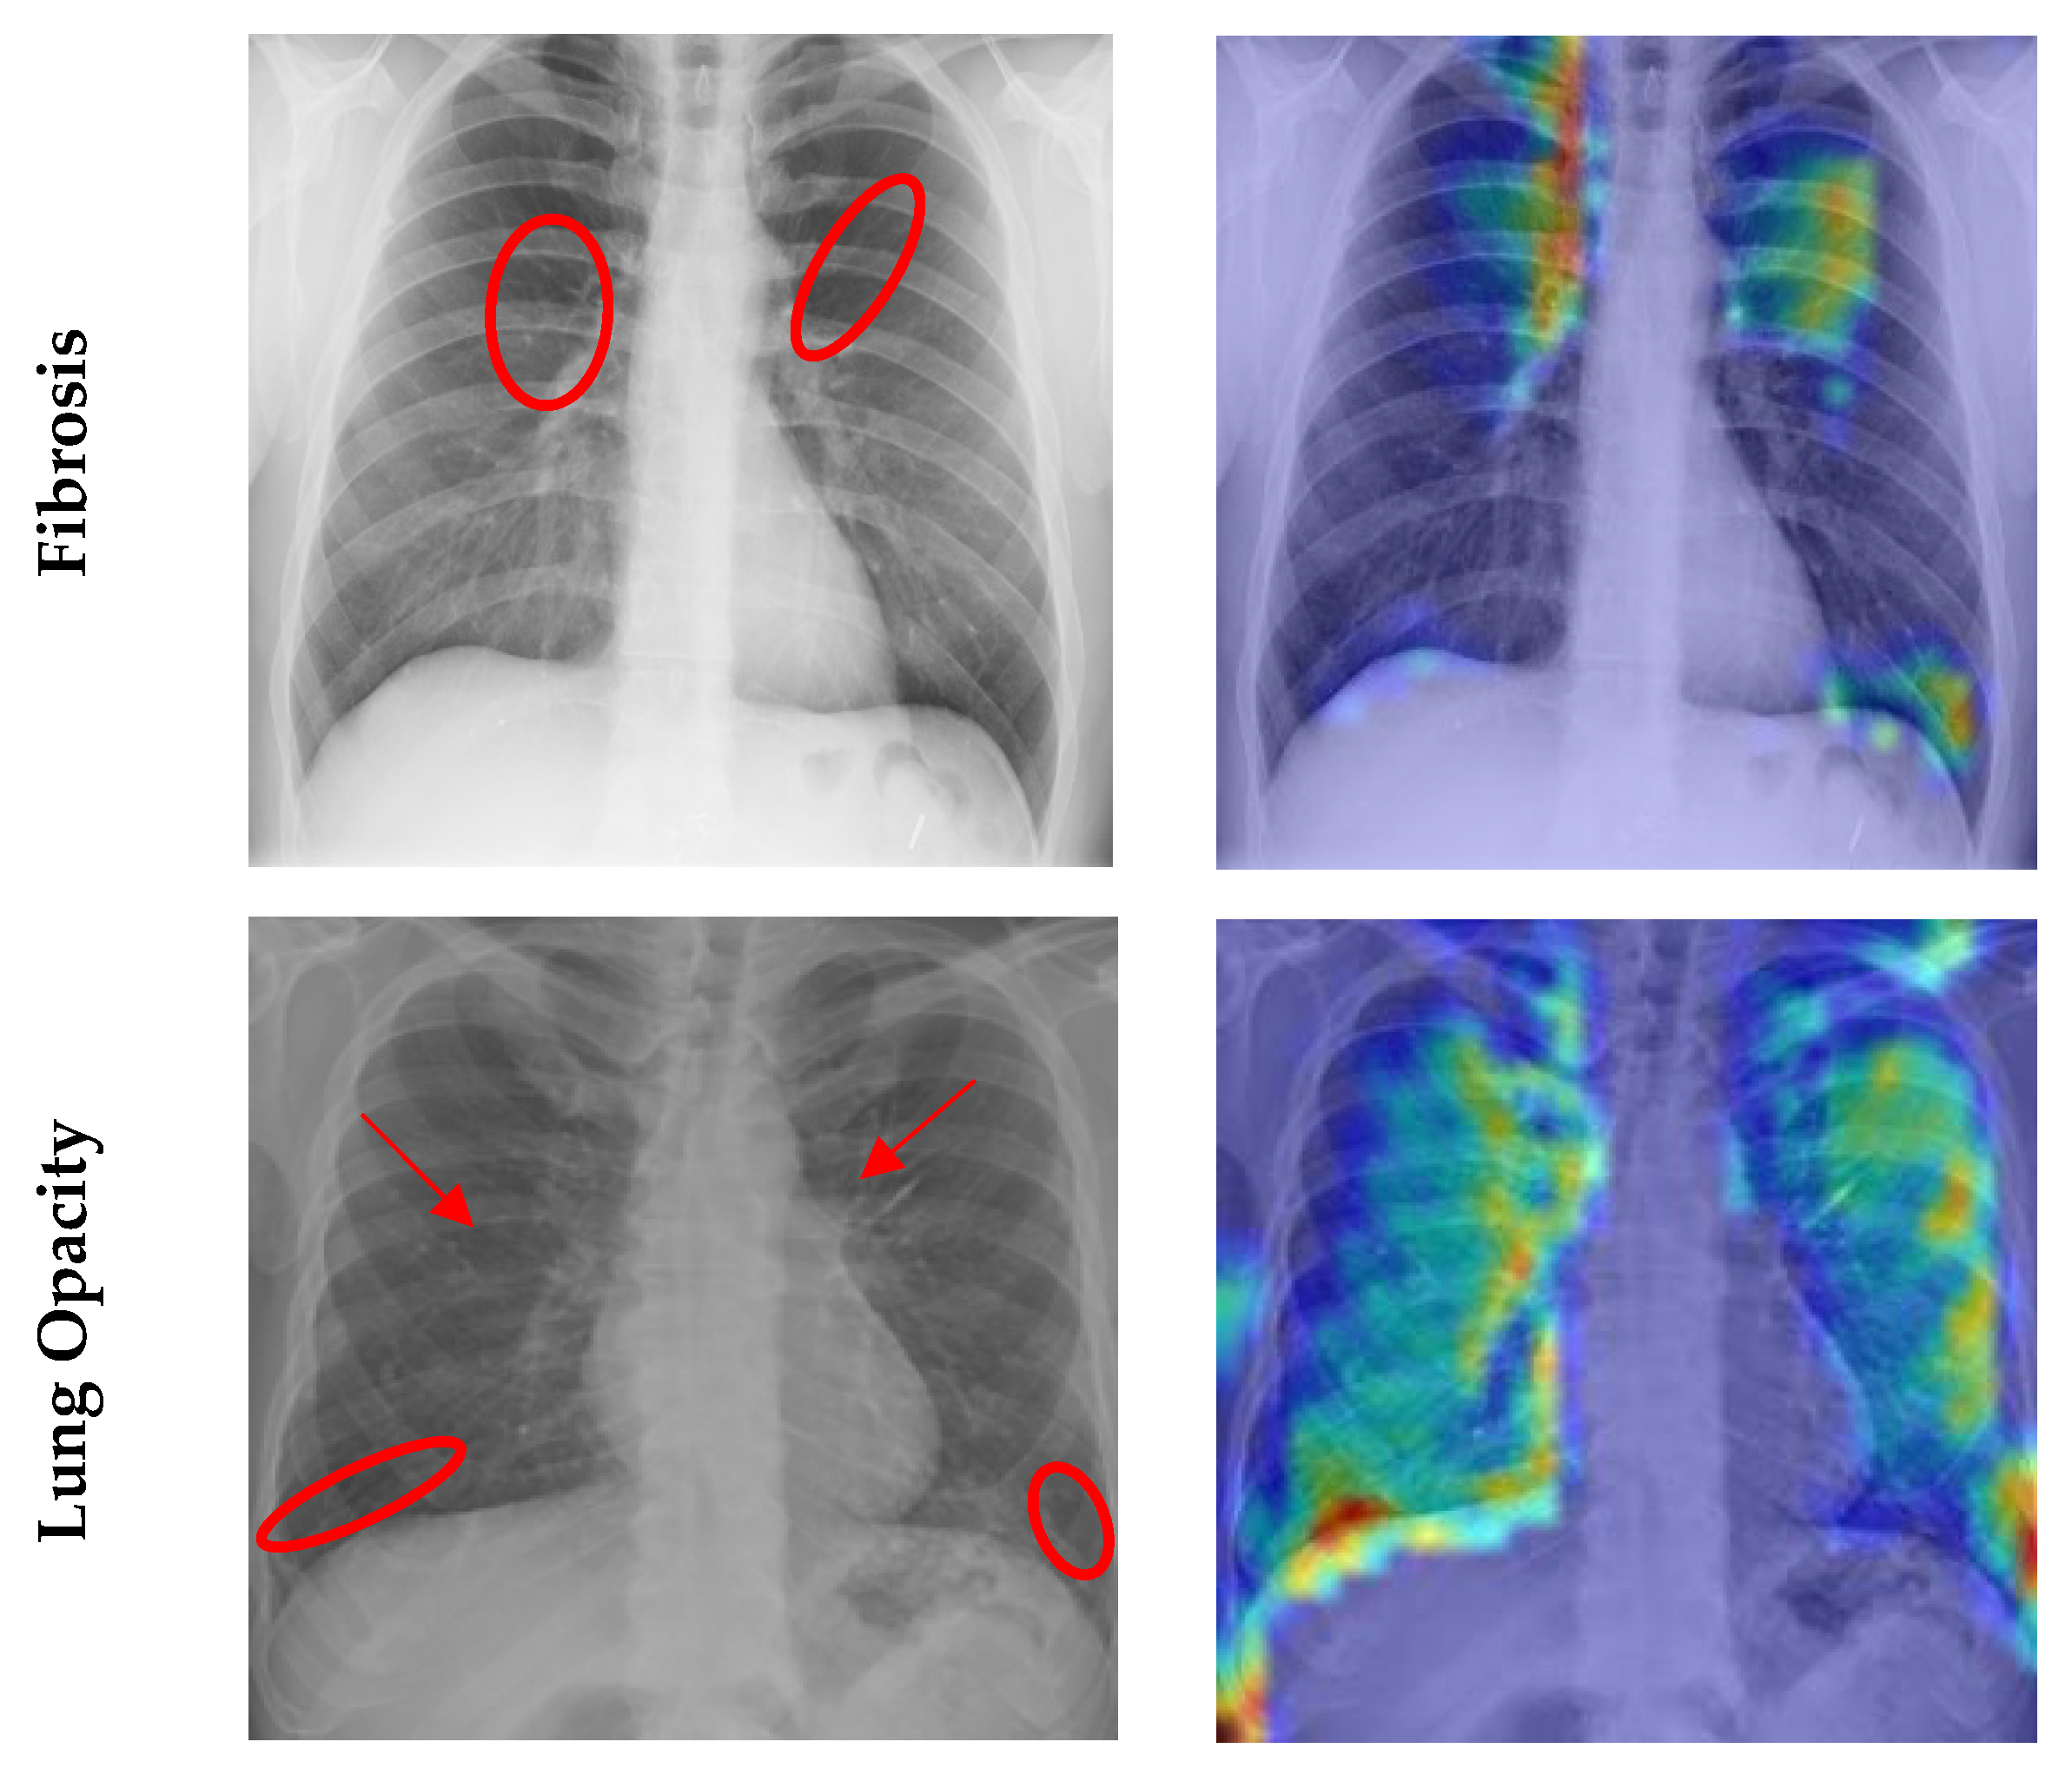
4.7. Grad CAM Visualisation
5. Discussion
5.1. Comparative Analysis of Different Classes
5.2. Comparison to Related Works in the Literature
5.3. Strength and Limitation
6. Conclusions
Author Contributions
Funding
Institutional Review Board Statement
Informed Consent Statement
Data Availability Statement
Conflicts of Interest
References
- Wu, F.; Zhao, S.; Yu, B.; Chen, Y.-M.; Wang, W.; Song, Z.-G.; Hu, Y.; Tao, Z.-W.; Tian, J.-H.; Pei, Y.-Y.; et al. A new coronavirus associated with human respiratory disease in china. Nature 2020, 579, 265–269. [Google Scholar] [CrossRef]
- WHO. COVID-19 Situation Reports. 2023. Available online: https://www.who.int/emergencies/diseases/novel-coronavirus-2019/situation-reports (accessed on 18 April 2023).
- Rothan, H.A.; Byrareddy, S.N. The epidemiology and pathogenesis of coronavirus disease (COVID-19) outbreak. J. Autoimmun. 2020, 109, 102433. [Google Scholar] [CrossRef] [PubMed]
- Wang, W.; Xu, Y.; Gao, R.; Lu, R.; Han, K.; Wu, G.; Tan, W. Detection of SARS-CoV-2 in different types of clinical specimens. JAMA 2020, 323, 1843–1844. [Google Scholar] [CrossRef] [PubMed]
- Zhang, N.; Wang, L.; Deng, X.; Liang, R.; Su, M.; He, C.; Hu, L.; Su, Y.; Ren, J.; Yu, F.; et al. Recent advances in the detection of respiratory virus infection in humans. J. Med. Virol. 2020, 92, 408–417. [Google Scholar] [CrossRef] [PubMed]
- Kroft, L.J.; van der Velden, L.; Giron, I.H.; Roelofs, J.J.; de Roos, A.; Geleijns, J. Added value of ultra–´ low-dose computed tomography, dose equivalent to chest X-ray radiography, for diagnosing chest pathology. J. Thorac. Imaging 2019, 34, 179. [Google Scholar] [CrossRef] [PubMed]
- Chen, N.; Zhou, M.; Dong, X.; Qu, J.; Gong, F.; Han, Y.; Qiu, Y.; Wang, J.; Liu, Y.; Wei, Y.; et al. Epidemiological and clinical characteristics of 99 cases of 2019 novel coronavirus pneumonia in wuhan, china: A descriptive study. Lancet 2020, 395, 507–513. [Google Scholar] [CrossRef]
- Zhou, D.-X. Theory of deep convolutional neural networks: Downsampling. Neural Netw. 2020, 124, 319–327. [Google Scholar] [CrossRef] [PubMed]
- Ahsan, M.M.; Ahad, M.T.; Soma, F.A.; Paul, S.; Chowdhury, A.; Luna, S.A.; Yazdan, M.M.S.; Rahman, A.; Siddique, Z.; Huebner, P. Detecting SARS-CoV-2 from chest X-ray using artificial intelligence. IEEE Access 2021, 9, 35501–35513. [Google Scholar] [CrossRef]
- Yaseliani, M.; Hamadani, A.Z.; Maghsoodi, A.I.; Mosavi, A. Pneumonia Detection Proposing a Hybrid Deep Convolutional Neural Network Based on Two Parallel Visual Geometry Group Architectures and Machine Learning Classifiers. IEEE Access 2022, 10, 62110–62128. [Google Scholar] [CrossRef]
- Li, Q.; Feng, B.; Xie, L.; Liang, P.; Zhang, H.; Wang, T. A cross-modality learning approach for vessel segmentation in retinal images. IEEE Trans. Med. Imaging 2015, 35, 109–118. [Google Scholar] [CrossRef]
- Sultana, A.; Khan, T.T.; Hossain, T. Comparison of four transfer learning and hybrid cnn models on three types of lung cancer. In Proceedings of the 2021 5th International Conference on Electrical Information and Communication Technology (EICT), IEEE, Khulna, Bangladesh, 17–19 December 2021; pp. 1–6. [Google Scholar]
- Esteva, A.; Kuprel, B.; Novoa, R.A.; Ko, J.; Swetter, S.M.; Blau, H.M.; Thrun, S. Dermatologist-level classification of skin cancer with deep neural networks. Nature 2017, 542, 115–118. [Google Scholar] [CrossRef] [PubMed]
- Rahman, T.; Khandakar, A.; Kadir, M.A.; Islam, K.R.; Islam, K.F.; Mazhar, R.; Hamid, T.; Islam, M.T.; Kashem, S.; Mahbub, Z.B.; et al. Reliable tuberculosis detection using chest X-ray with deep learning, segmentation and visualization. IEEE Access 2020, 8, 191586–191601. [Google Scholar] [CrossRef]
- Panwar, H.; Gupta, P.; Siddiqui, M.K.; Morales-Menendez, R.; Singh, V. Application of deep learning for fast detection of COVID-19 in X-rays using ncovnet. Chaos Solitons Fractals 2020, 138, 109944. [Google Scholar] [CrossRef]
- Khan, E.; Rehman, M.Z.U.; Ahmed, F.; Alfouzan, F.A.; Alzahrani, N.M.; Ahmad, J. Chest X-ray classification for the detection of COVID-19 using deep learning techniques. Sensors 2022, 22, 1211. [Google Scholar] [CrossRef]
- Nayak, S.R.; Nayak, D.R.; Sinha, U.; Arora, V.; Pachori, R.B. An efficient deep learning method for detection of COVID-19 infection using chest X-ray images. Diagnostics 2023, 13, 131. [Google Scholar] [CrossRef]
- Hemdan, E.E.-D.; Shouman, M.A.; Karar, M.E. Covidx-net: A framework of deep learning classifiers to diagnose COVID-19 in X-ray images. arXiv 2020, arXiv:2003.11055. [Google Scholar]
- Ismael, A.M.; Şengür, A. Deep learning approaches for COVID-19 detection based on chest X-ray images. Expert Syst. Appl. 2021, 164, 114054. [Google Scholar] [CrossRef]
- Ohata, E.F.; Bezerra, G.M.; Chagas, J.V.S.; Neto, A.V.L.; Albuquerque, A.B.; de Albuquerque, V.H.C.; Filho, P.P.R. Automatic detection of COVID-19 infection using chest X-ray images through transfer learning. IEEE/CAA J. Autom. Sin. 2020, 8, 239–248. [Google Scholar] [CrossRef]
- Rajpurkar, P.; Irvin, J.; Zhu, K.; Yang, B.; Mehta, H.; Duan, T.; Ding, D.; Bagul, A.; Langlotz, C.; Shpanskaya, K.; et al. Chexnet: Radiologist-level pneumonia detection on chest X-rays with deep learning. arXiv 2017, arXiv:1711.05225. [Google Scholar]
- Chowdhury, M.E.; Rahman, T.; Khandakar, A.; Mazhar, R.; Kadir, M.A.; Mahbub, Z.B.; Islam, K.R.; Khan, M.S.; Iqbal, A.; Al Emadi, N.; et al. Can ai help in screening viral and COVID-19 pneumonia? IEEE Access 2020, 8, 132665–132676. [Google Scholar] [CrossRef]
- Cannata, S.; Paviglianiti, A.; Pasero, E.; Cirrincione, G.; Cirrincione, M. Deep Learning Algorithms for Automatic COVID-19 Detection on Chest X-Ray Images. IEEE Access 2022, 10, 119905–119913. [Google Scholar] [CrossRef]
- Brunese, L.; Mercaldo, F.; Reginelli, A.; Santone, A. Explainable deep learning for pulmonary disease and coronavirus COVID-19 detection from X-rays. Comput. Methods Programs Biomed. 2020, 196, 105608. [Google Scholar] [CrossRef] [PubMed]
- Ozturk, T.; Talo, M.; Yildirim, E.A.; Baloglu, U.B.; Yildirim, O.; Acharya, U.R. Automated detection of COVID-19 cases using deep neural networks with X-ray images. Comput. Biol. Med. 2020, 121, 103792. [Google Scholar] [CrossRef] [PubMed]
- Chandra, T.B.; Verma, K.; Singh, B.K.; Jain, D.; Netam, S.S. Coronavirus disease (COVID-19) detection in chest X-ray images using majority voting based classifier ensemble. Expert Syst. Appl. 2021, 165, 113909. [Google Scholar] [CrossRef]
- Vantaggiato, E.; Paladini, E.; Bougourzi, F.; Distante, C.; Hadid, A.; Taleb-Ahmed, A. COVID-19 recognition using ensemble-cnns in two new chest X-ray databases. Sensors 2021, 21, 1742. [Google Scholar] [CrossRef] [PubMed]
- Nahiduzzaman, M.; Islam, M.R.; Hassan, R. Chestx-ray6: Prediction of multiple diseases including COVID-19 from chest X-ray images using convolutional neural network. Expert Syst. Appl. 2023, 211, 118576. [Google Scholar] [CrossRef] [PubMed]
- Khan, I.U.; Aslam, N.; Anwar, T.; Alsaif, H.S.; Chrouf, S.M.B.; Alzahrani, N.A.; Alamoudi, F.A.; Kamaleldin, M.M.A.; Awary, K.B. Using a deep learning model to explore the impact of clinical data on COVID-19 diagnosis using chest X-ray. Sensors 2022, 22, 669. [Google Scholar] [CrossRef]
- Umair, M.; Khan, M.S.; Ahmed, F.; Baothman, F.; Alqahtani, F.; Alian, M.; Ahmad, J. Detection of COVID-19 using transfer learning and grad-cam visualization on indigenously collected X-ray dataset. Sensors 2021, 21, 5813. [Google Scholar] [CrossRef]
- Alam, N.A.; Ahsan, M.; Based, M.A.; Haider, J.; Kowalski, M. COVID-19 Detection from Chest X-ray Images Using Feature Fusion and Deep Learning. Sensors 2021, 21, 1480. [Google Scholar] [CrossRef]
- Li, H.; Zeng, N.; Wu, P.; Clawson, K. Cov-net: A computer-aided diagnosis method for recognizing COVID-19 from chest X-ray images via machine vision. Expert Syst. Appl. 2022, 207, 118029. [Google Scholar] [CrossRef] [PubMed]
- Babukarthik, R.; Chandramohan, D.; Tripathi, D.; Kumar, M.; Sambasivam, G. COVID-19 identification in chest X-ray images using intelligent multi-level classification scenario. Comput. Electr. Eng. 2022, 104, 108405. [Google Scholar] [CrossRef] [PubMed]
- Shorten, C.; Khoshgoftaar, T.M.; Furht, B. Deep learning applications for COVID-19. J. Big Data 2021, 8, 1–54. [Google Scholar] [CrossRef]
- COVID-19. Radiography Database. 2021. Available online: https://www.kaggle.com/datasets/tawsifurrahman/covid19-radiography-database (accessed on 15 February 2021).
- Pneumonia Virus vs Pneumonia Bacteria. 2020. Available online: https://www.kaggle.com/datasets/muhammadmasdar/pneumonia-virus-vs-pneumonia-bacteria (accessed on 20 February 2021).
- Kermany, D.; Zhang, K.; Goldbaum, M. Labeled optical coherence tomography (oct) and chest X-ray images for classification. Mendeley Data 2018, 2, 651. [Google Scholar]
- Wang, X.; Peng, Y.; Lu, L.; Lu, Z.; Bagheri, M.; Summers, R. ChestX-ray8: Hospital-scale Chest X-ray Database and Benchmarks on Weakly-Supervised Classification and Localization of Common Thorax Diseases. In Proceedings of the IEEE Conference on Computer Vision and Pattern Recognition, IEEE CVPR, Honolulu, HI, USA, 21–26 July 2017; pp. 3462–3471. [Google Scholar]
- Johnson, J.M.; Khoshgoftaar, T.M. Survey on deep learning with class imbalance. J. Big Data 2019, 6, 1–54. [Google Scholar] [CrossRef]
- Hashemi, M. Enlarging smaller images before inputting into convolutional neural network: Zero-padding vs. interpolation. J. Big Data 2019, 6, 1–13. [Google Scholar] [CrossRef]
- Peyal, H.I.; Shahriar, S.M.; Sultana, A.; Jahan, I.; Mondol, M.H. Detection of tomato leaf diseases using transfer learning architectures: A comparative analysis. In Proceedings of the 2021 International Conference on Automation, Control and Mechatronics for Industry 4.0 (ACMI), IEEE, Rajshahi, Bangladesh, 8–9 July 2021; pp. 1–6. [Google Scholar]
- Selvaraju, R.R.; Cogswell, M.; Das, A.; Vedantam, R.; Parikh, D.; Batra, D. Grad-cam: Visual explanations from deep networks via gradient-based localization. In Proceedings of the IEEE International Conference on Computer Vision, Venice, Italy, 22–29 October 2017; pp. 618–626. [Google Scholar]
- Al-Waisy, A.S.; Al-Fahdawi, S.; Mohammed, M.A.; Abdulkareem, K.H.; Mostafa, S.A.; Maashi, M.S.; Arif, M.; Garcia-Zapirain, B. COVID-chexnet: Hybrid deep learning framework for identifying COVID-19 virus in chest X-rays images. Soft Comput. 2023, 27, 2657–2672. [Google Scholar] [PubMed]
- Al-Shourbaji, I.; Kachare, P.H.; Abualigah, L.; Abdelhag, M.E.; Elnaim, B.; Anter, A.M.; Gandomi, A.H. A deep batch normalized convolution approach for improving COVID-19 detection from chest X-ray images. Pathogens 2023, 12, 17. [Google Scholar] [CrossRef] [PubMed]
- Xu, X.; Jiang, X.; Ma, C.; Du, P.; Li, X.; Lv, S.; Yu, L.; Ni, Q.; Chen, Y.; Su, J.; et al. A deep learning system to screen novel coronavirus disease 2019 pneumonia. Engineering 2020, 6, 1122–1129. [Google Scholar] [CrossRef]
- Srivastava, G.; Chauhan, A.; Jangid, M.; Chaurasia, S. Covixnet: A novel and efficient deep learning model for detection of COVID-19 using chest X-ray images. Biomed. Signal Process. Control 2022, 78, 103848. [Google Scholar] [CrossRef] [PubMed]
- Apostolopoulos, I.D.; Mpesiana, T.A. COVID-19: Automatic detection from X-ray images utilizing transfer learning with convolutional neural networks. Phys. Eng. Sci. Med. 2020, 43, 635–640. [Google Scholar] [CrossRef]
- Yoo, S.H.; Geng, H.; Chiu, T.L.; Yu, S.K.; Cho, D.C.; Heo, J.; Choi, M.S.; Choi, I.H.; Van, C.C.; Nhung, N.V.; et al. Deep learning-based decision-tree classifier for COVID-19 diagnosis from chest X-ray imaging. Front. Med. 2020, 7, 427. [Google Scholar] [CrossRef] [PubMed]
- Hussain; Hasan, M.; Rahman, M.A.; Lee, I.; Tamanna, T.; Parvez, M.Z. Corodet: A deep learning based classification for COVID-19 detection using chest X-ray images. Chaos Solitons Fractals 2021, 142, 110495. [Google Scholar] [CrossRef] [PubMed]
- Khan, A.I.; Shah, J.L.; Bhat, M.M. Coronet: A deep neural network for detection and diagnosis of COVID-19 from chest X-ray images. Comput. Methods Programs Biomed. 2020, 196, 105581. [Google Scholar] [CrossRef] [PubMed]
- Al-Timemy, H.; Khushaba, R.N.; Mosa, Z.M.; Escudero, J. An efficient mixture of deep and machine learning models for COVID-19 and tuberculosis detection using X-ray images in resource limited settings. In Artificial Intelligence for COVID-19; Springer: Cham, Switzerland, 2021; pp. 77–100. [Google Scholar]


| Dataset | Image Count | Characteristics | New Dataset Inclusion Criteria |
|---|---|---|---|
| COVID-19 Radiography Database [29] | Normal: 3616 Lung Opacity: 3616 COVID-19: 3616 Viral Pneumonia: 1345 | The size of each image is 299 × 299 pixels and PNG format | Each of the four class images is employed in this study. |
| Pneumonia Virus vs. Pneumonia Bacteria Database [30,31] | Bacterial Pneumonia: 2530 Viral Pneumonia: 1345 | Images are in variable size (Max: 2008 × 2096 pixels and Min: 888 × 454 pixels) and JPEG format. | Only bacterial pneumonia images are used in this study |
| Chest X-Ray (CXR) images of COVID-19, Tuberculosis, Pneumonia, and Fibrosis [32,33] | COVID-19: 3616 Fibrosis: 1686 Tuberculosis: 3500 Pneumonia: 4265 | Images of TB are 518 × 518 pixels in size, whereas those of fibrosis images are 1024 × 1024 pixels and both in PNG format. | Only tuberculosis and fibrosis images are utilized in this work |
| Classes | Number of Images | Training Set | Testing Set |
|---|---|---|---|
| Normal | 3616 | 2892 | 724 |
| COVID-19 | 3616 | 2892 | 724 |
| Lung Opacity | 3616 | 2892 | 724 |
| Viral Pneumonia | 1345 | 1076 | 269 |
| Bacterial Pneumonia | 2530 | 2024 | 506 |
| Tuberculosis | 3500 | 2800 | 700 |
| Fibrosis | 1686 | 1348 | 338 |
| Total | 18,564 | 15,924 | 2640 |
| Layer (Type) | Output Shape | Parameter |
|---|---|---|
| conv2d_1 (Conv2D) | (None, 299, 299, 32) | 896 |
| max_pooling2d_1 (MaxPooling2D) | (None, 100, 100, 32) | 0 |
| conv2d_2 (Conv2D) | (None, 100, 100, 64) | 18,496 |
| max_pooling2d_2 (MaxPooling2D) | (None, 34, 34, 64) | 0 |
| conv2d_3 (Conv2D) | (None, 34, 34, 128) | 738,560 |
| max_pooling2d_3 (MaxPooling2D) | (None, 12, 12, 128) | 0 |
| flatten_1 (Flatten) | (None, 18,432) | 0 |
| dense_1 (Dense) | (None, 512) | 9,437,696 |
| dropout_1 (Dropout) | (None, 512) | 0 |
| dense_2 (Dense) | (None, 256) | 131,328 |
| dropout_2 (Dropout) | (None, 256) | 0 |
| dense_3 (Dense) | (None, 128) | 32,896 |
| dropout_3 (Dropout) | (None, 128) | 0 |
| dense_4 (Dense) | (None, 7) | 903 |
| Model | Total Parameters | Trainable Parameters | Non-Trainable Parameters |
|---|---|---|---|
| Proposed CNN | 9,696,071 | 9,696,071 | 0 |
| VGG-16 | 40,412,999 | 25,698,311 | 14,714,688 |
| VGG-19 | 45,722,695 | 25,698,311 | 20,024,384 |
| Inception-v3 | 156,028,711 | 134,225,927 | 21,802,784 |
| Classification Models | Images Classes | Precision | Recall | F1-Score | AUC | Testing Accuracy (%) | Average Precision | Average Recall | Average F1-Score | Average AUC | Training Time (min) | Testing Time (s) |
|---|---|---|---|---|---|---|---|---|---|---|---|---|
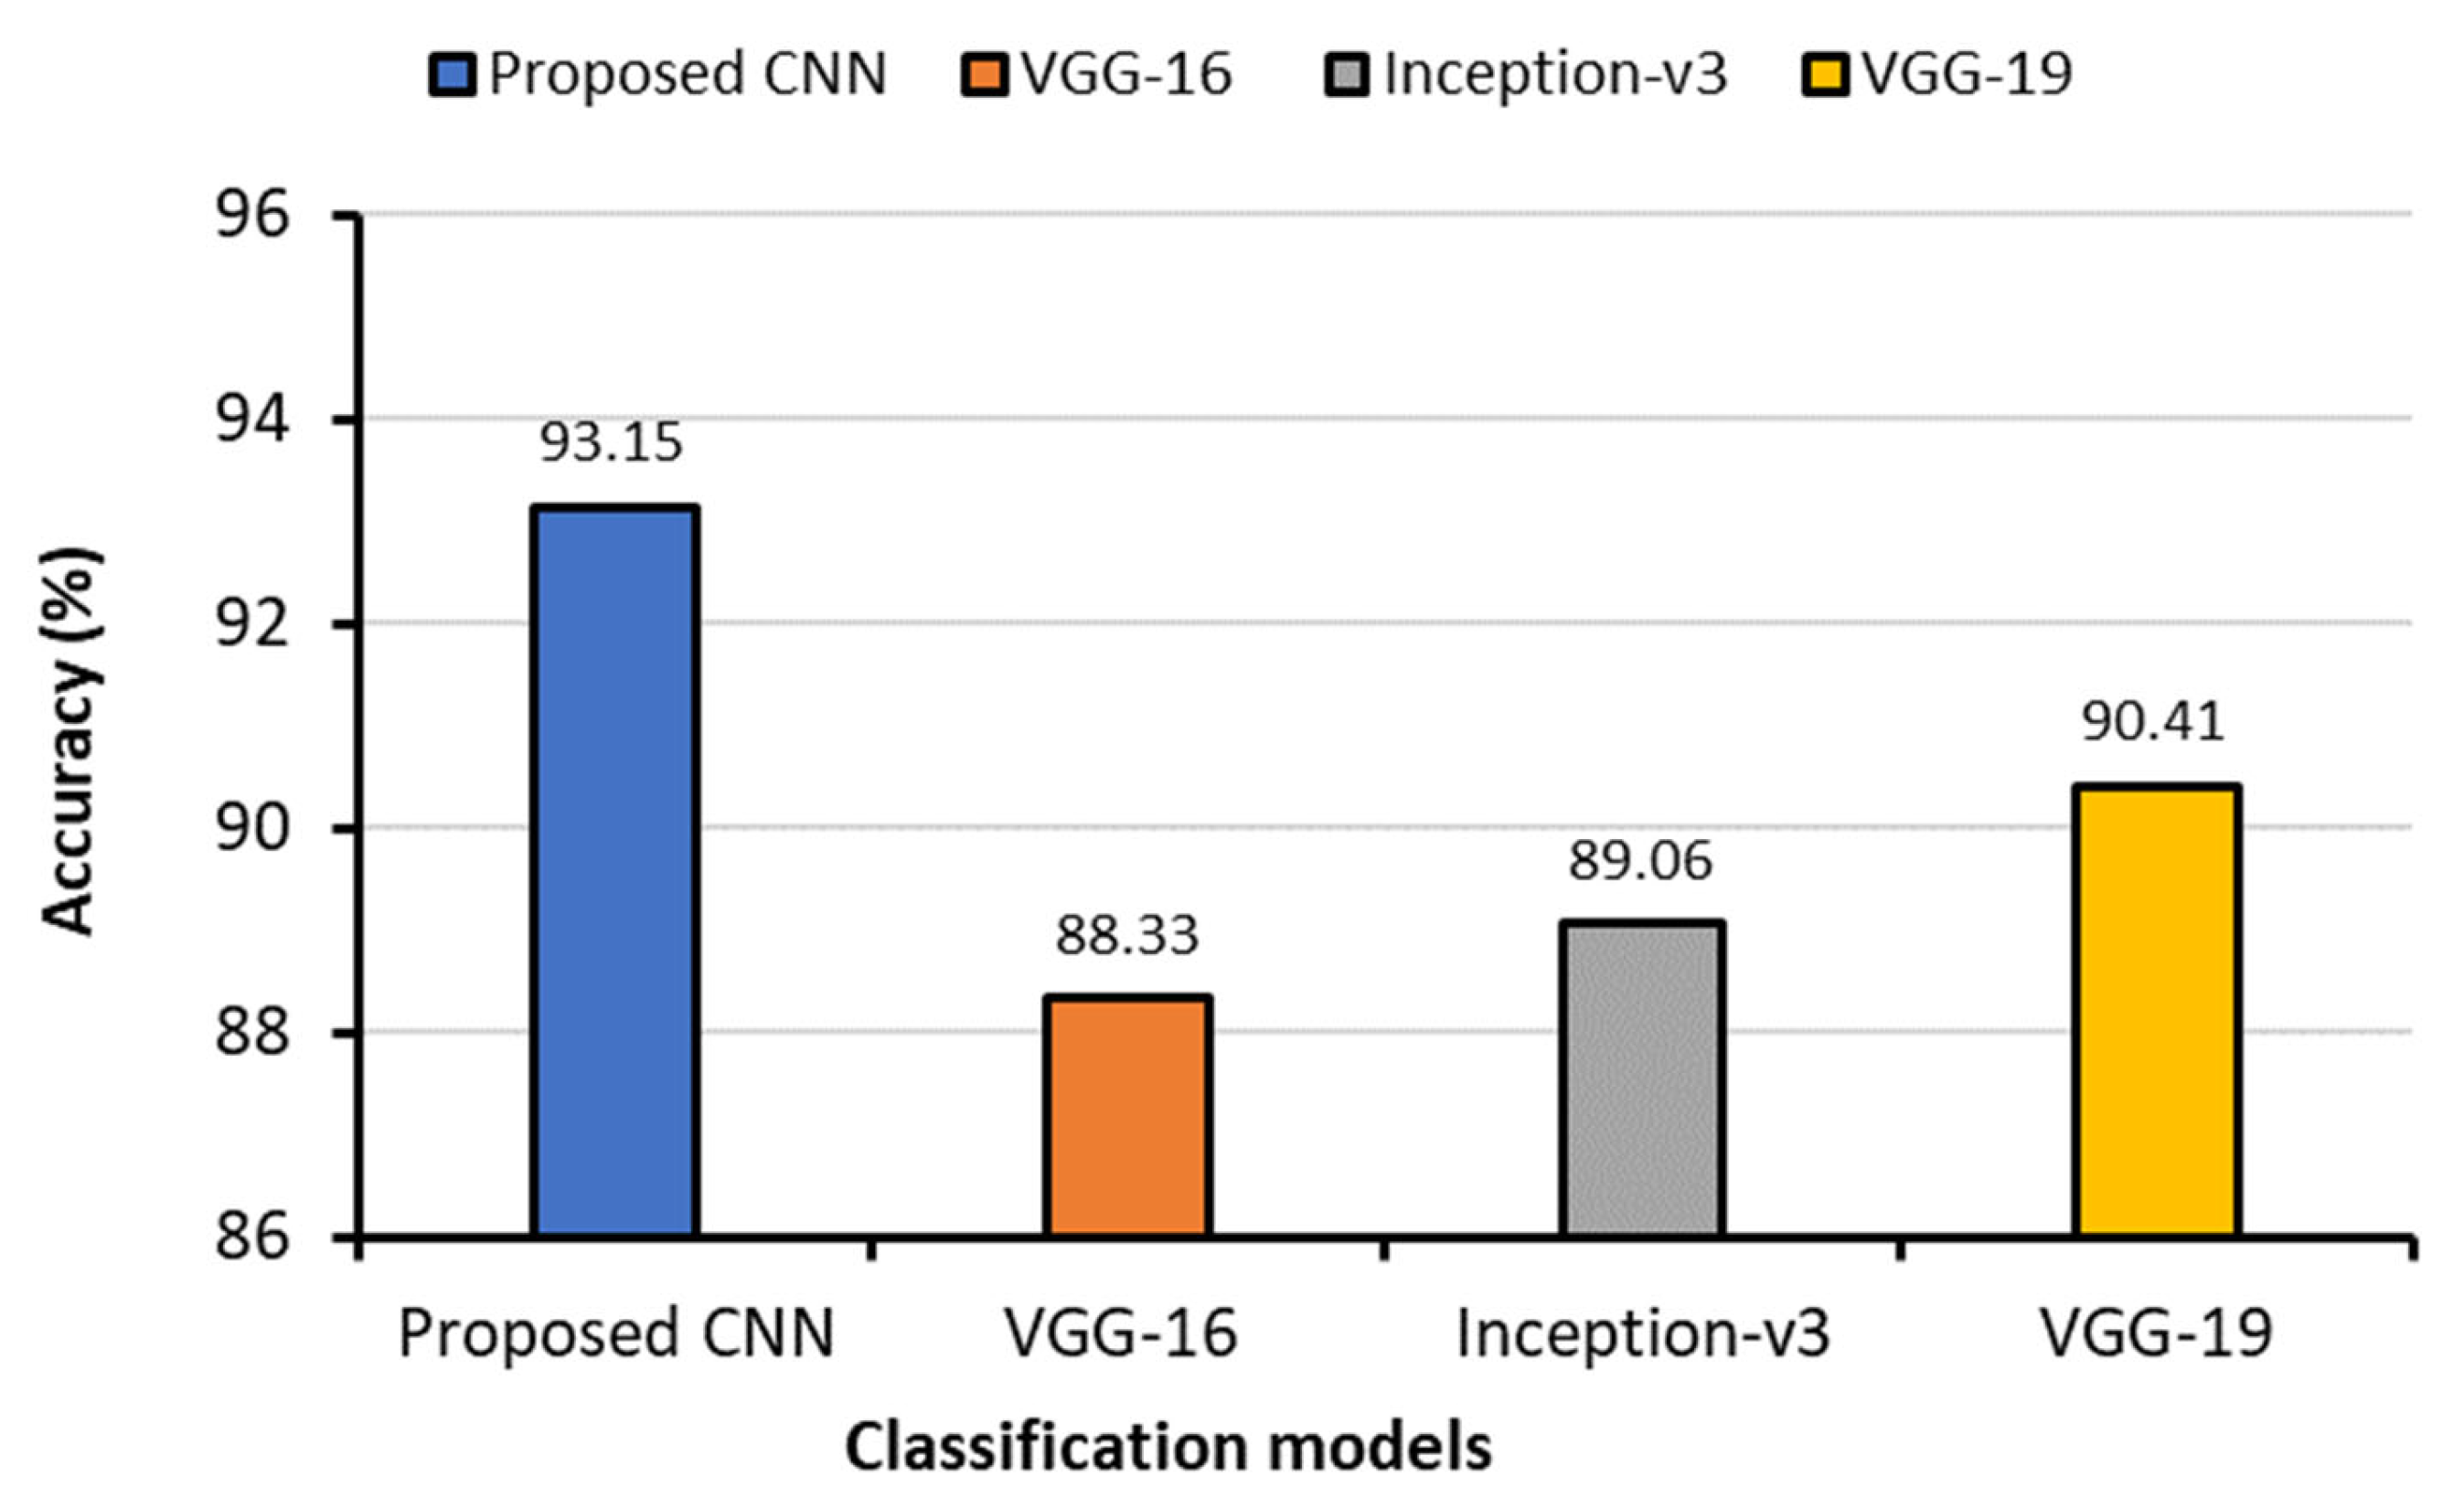
| Proposed CNN | Bacterial Pneumonia (0 *) | 0.97 § | 0.99 | 0.98 | 0.9997 | 93.15 | 0.9343 | 0.9443 | 0.9386 | 0.9939 | 62.74 | 22.37 |
| COVID-19 (1) | 0.96 | 0.95 | 0.95 | 0.9970 | ||||||||
| Fibrosis (2) | 0.99 | 0.98 | 0.98 | 0.9968 | ||||||||
| Lung Opacity (3) | 0.85 | 0.89 | 0.87 | 0.9848 | ||||||||
| Normal (4) | 0.84 | 0.90 | 0.87 | 0.9853 | ||||||||
| Tuberculosis (5) | 0.98 | 0.99 | 0.99 | 0.9991 | ||||||||
| Viral Pneumonia (6) | 0.95 | 0.91 | 0.93 | 0.9947 | ||||||||
| VGG-16 | Bacterial Pneumonia (0) | 0.92 | 0.91 | 0.91 | 0.9961 | 88.33 | 0.8814 | 0.8557 | 0.8614 | 0.9899 | 69.75 | 24.73 |
| COVID-19 (1) | 0.92 | 0.96 | 0.94 | 0.9961 | ||||||||
| Fibrosis (2) | 0.90 | 0.61 | 0.73 | 0.9843 | ||||||||
| Lung Opacity (3) | 0.78 | 0.92 | 0.84 | 0.9852 | ||||||||
| Normal (4) | 0.88 | 0.81 | 0.84 | 0.9807 | ||||||||
| Tuberculosis (5) | 0.98 | 0.98 | 0.98 | 0.9995 | ||||||||
| Viral Pneumonia (6) | 0.79 | 0.80 | 0.79 | 0.9877 | ||||||||
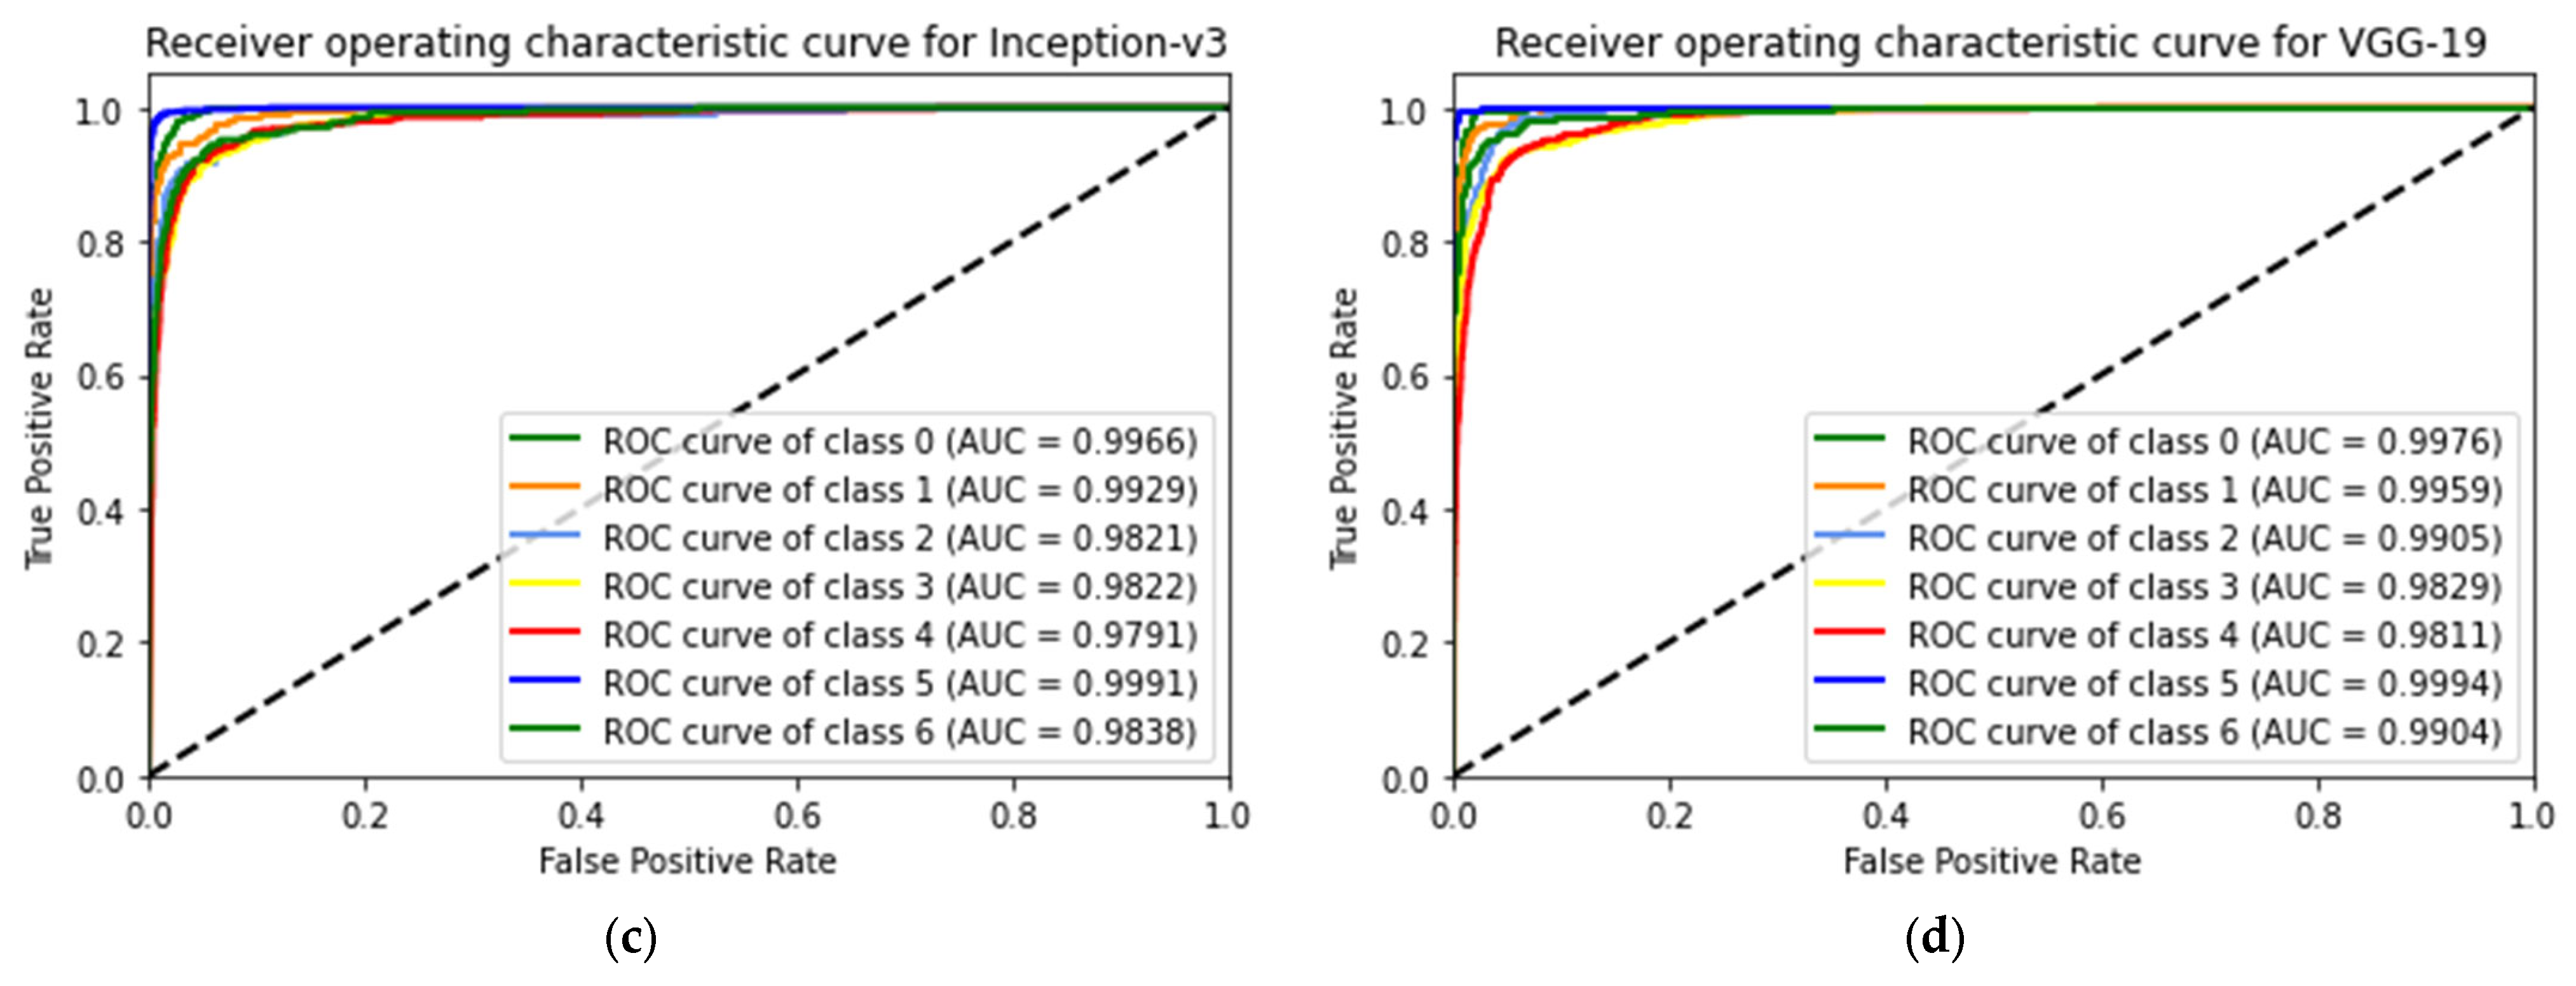
| Inception-v3 | Bacterial Pneumonia (0) | 0.95 | 0.88 | 0.91 | 0.9966 | 89.06 | 0.8886 | 0.8729 | 0.8771 | 0.9879 | 71.57 | 42.42 |
| COVID-19 (1) | 0.95 | 0.89 | 0.92 | 0.9929 | ||||||||
| Fibrosis (2) | 0.89 | 0.75 | 0.81 | 0.9821 | ||||||||
| Lung Opacity (3) | 0.82 | 0.90 | 0.86 | 0.9822 | ||||||||
| Normal (4) | 0.85 | 0.89 | 0.87 | 0.9791 | ||||||||
| Tuberculosis (5) | 0.97 | 0.98 | 0.97 | 0.9991 | ||||||||
| Viral Pneumonia (6) | 0.79 | 0.82 | 0.80 | 0.9838 | ||||||||
| VGG-19 | Bacterial Pneumonia (0) | 092 | 0.96 | 0.94 | 0.9976 | 90.41 | 0.9014 | 0.8929 | 0.8957 | 0.9925 | 76.02 | 27.20 |
| COVID-19 (1) | 0.96 | 0.91 | 0.93 | 0.9959 | ||||||||
| Fibrosis (2) | 0.84 | 0.84 | 0.84 | 0.9905 | ||||||||
| Lung Opacity (3) | 0.87 | 0.88 | 0.87 | 0.9929 | ||||||||
| Normal (4) | 0.84 | 0.88 | 0.86 | 0.9811 | ||||||||
| Tuberculosis (5) | 0.99 | 0.97 | 0.98 | 0.9994 | ||||||||
| Viral Pneumonia (6) | 0.89 | 0.81 | 0.85 | 0.9904 |
| Classification Models | Images Classes | Precision | Recall | F1-Score | AUC | Testing Accuracy (%) | Average Precision | Average Recall | Average F1-Score | Average AUC | Training Time (min) | Testing Time (s) |
|---|---|---|---|---|---|---|---|---|---|---|---|---|
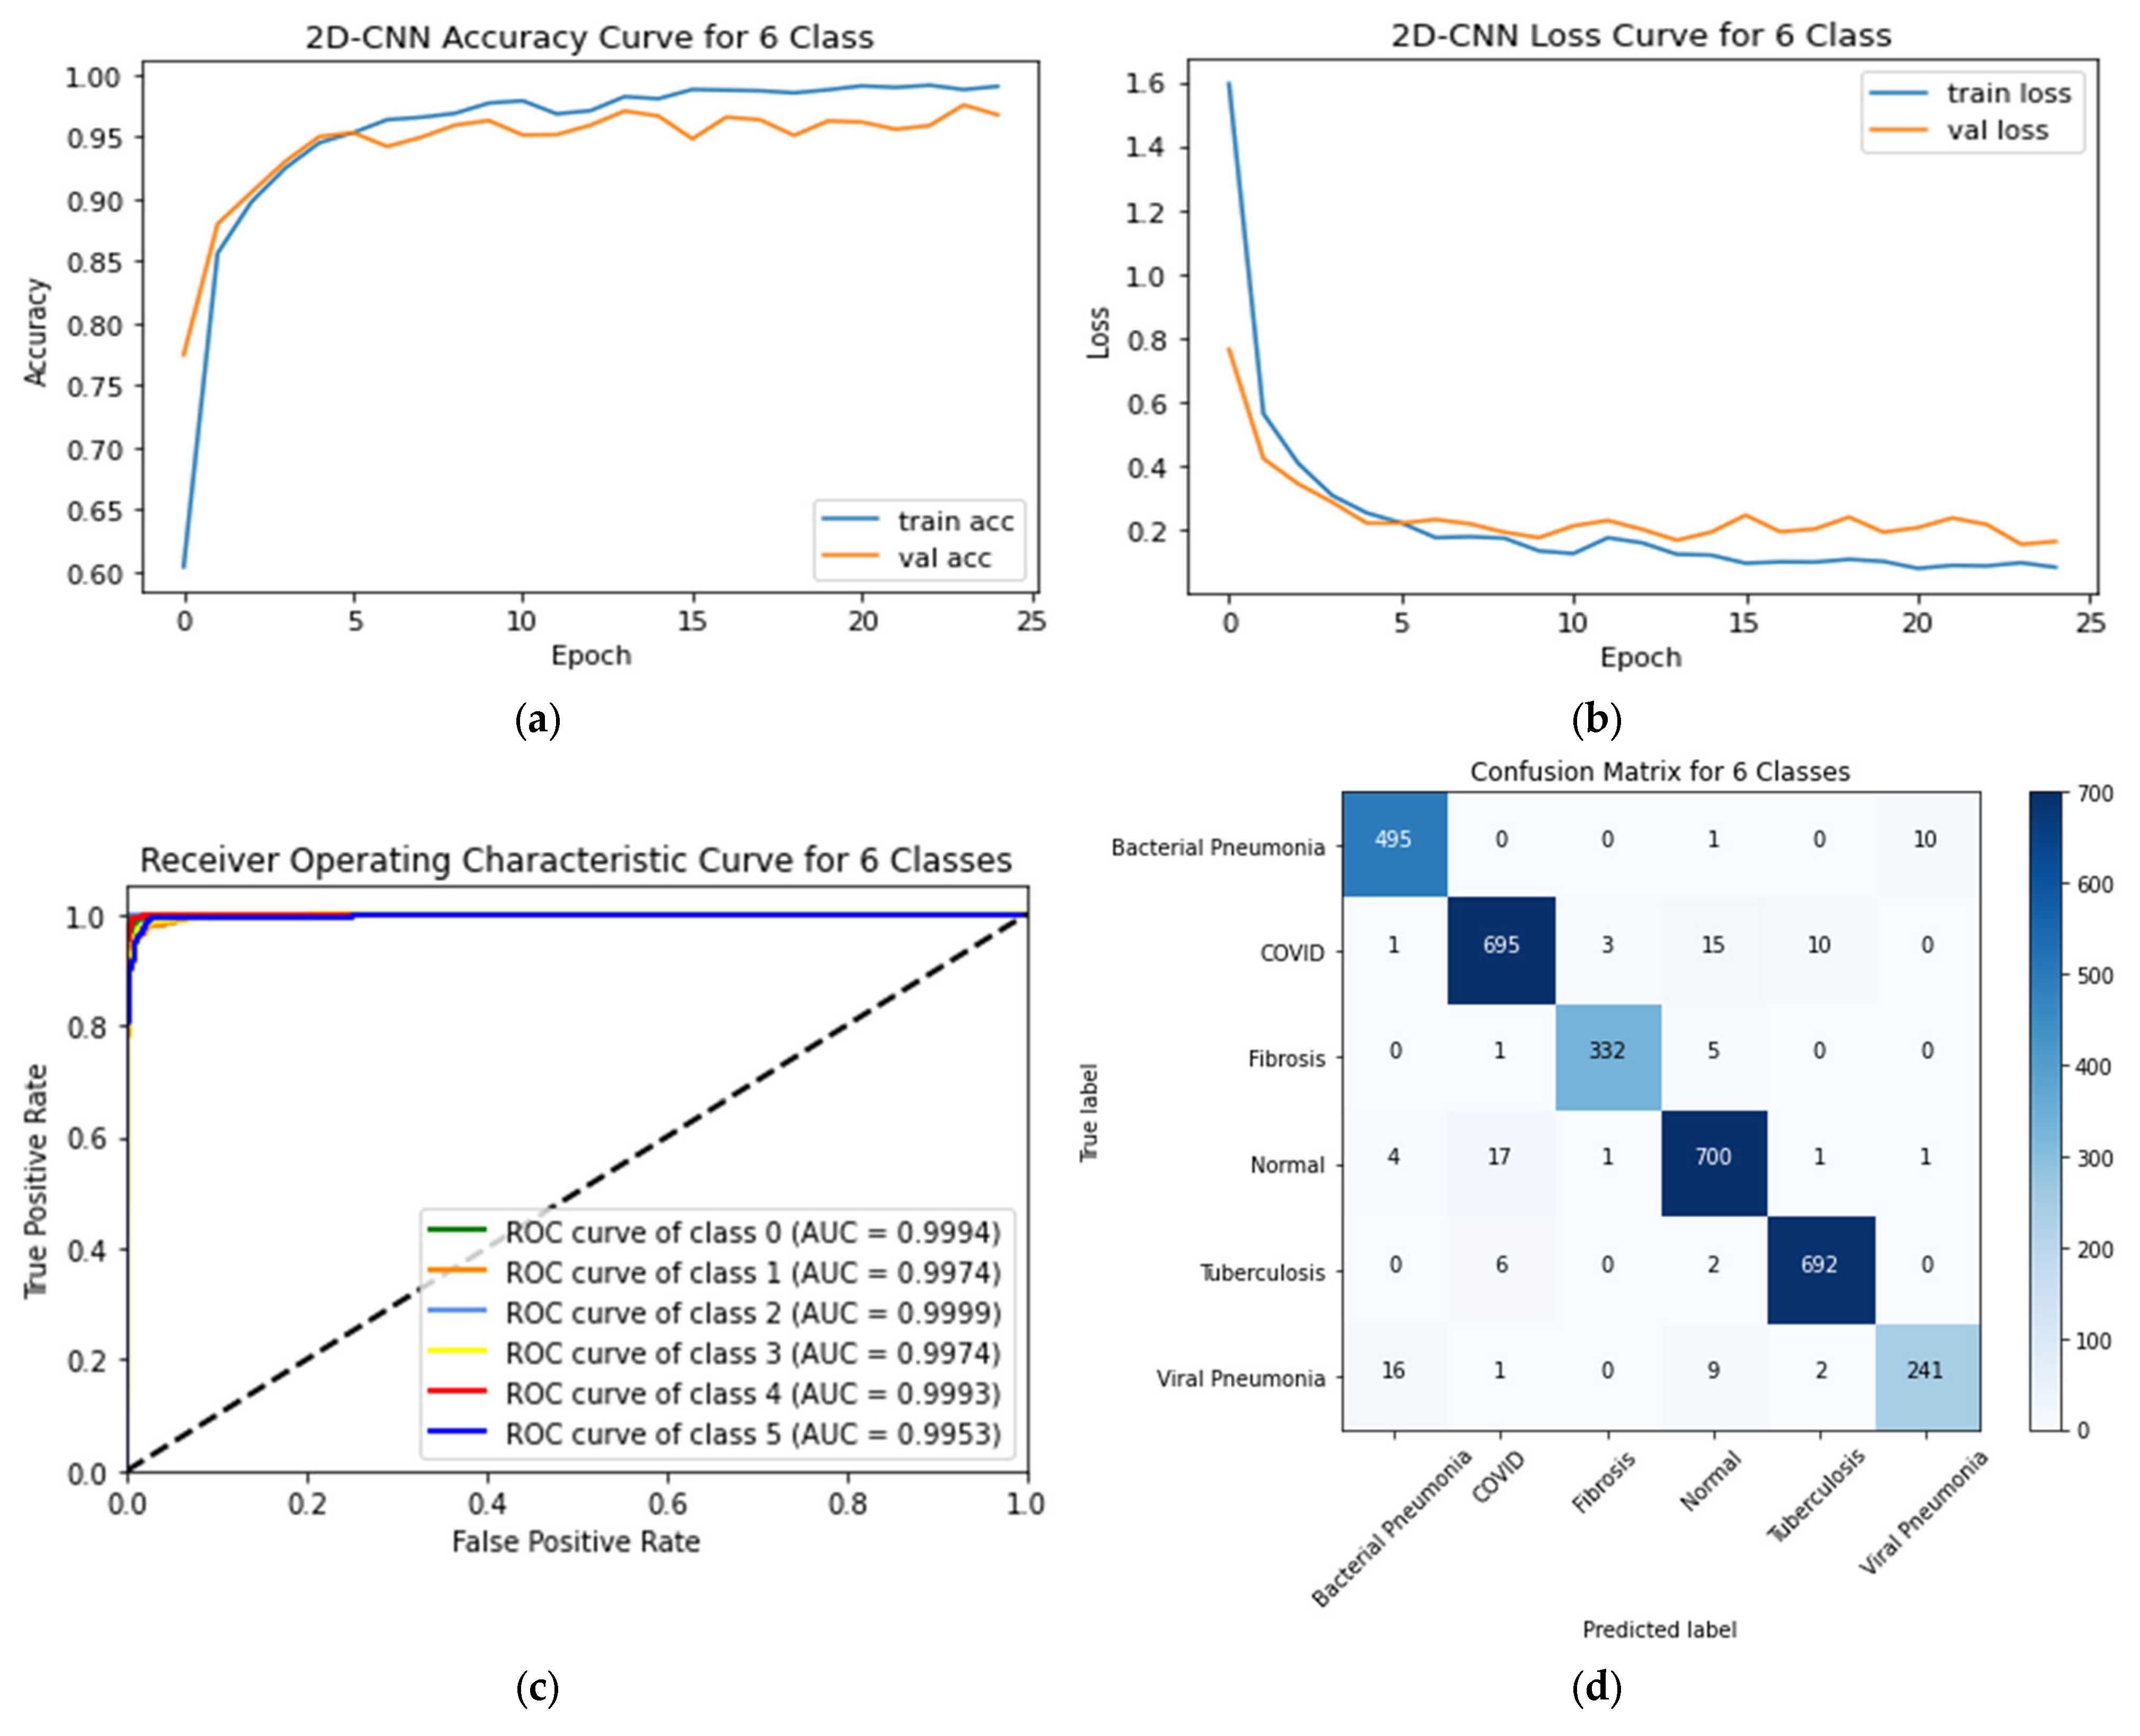
| 2D-CNN | Bacterial Pneumonia (0 *) | 0.96§ | 0.98 | 0.97 | 0.9994 | 96.75 | 0.9343 | 0.9443 | 0.9386 | 0.9939 | 62.74 | 15.20 |
| COVID-19 (1) | 0.97 | 0.96 | 0.96 | 0.9974 | ||||||||
| Fibrosis (2) | 0.99 | 0.98 | 0.99 | 0.9999 | ||||||||
| Normal (3) | 0.96 | 0.97 | 0.96 | 0.9974 | ||||||||
| Tuberculosis (4) | 0.98 | 0.99 | 0.99 | 0.9993 | ||||||||
| Viral Pneumonia (5) | 0.96 | 0.90 | 0.93 | 0.9953 | ||||||||
| VGG-16 | Bacterial Pneumonia (0) | 0.83 | 0.83 | 0.83 | 0.9844 | 90.43 | 0.8814 | 0.8557 | 0.8614 | 0.9899 | 49.79 | 21.72 |
| COVID-19 (1) | 0.98 | 0.95 | 0.96 | 0.9978 | ||||||||
| Fibrosis (2) | 0.91 | 0.86 | 0.88 | 0.9927 | ||||||||
| Normal (3) | 0.90 | 0.93 | 0.92 | 0.9910 | ||||||||
| Tuberculosis (4) | 0.97 | 0.99 | 0.98 | 0.9984 | ||||||||
| Viral Pneumonia (5) | 0.68 | 0.67 | 0.67 | 0.9684 | ||||||||
| Inception-v3 | Bacterial Pneumonia (0) | 0.91 | 0.90 | 0.90 | 0.9930 | 91.90 | 0.8886 | 0.8729 | 0.8771 | 0.9879 | 51.23 | 18.44 |
| COVID-19 (1) | 0.96 | 0.93 | 0.95 | 0.9952 | ||||||||
| Fibrosis (2) | 0.89 | 0.91 | 0.90 | 0.9955 | ||||||||
| Normal (3) | 0.93 | 0.91 | 0.92 | 0.9909 | ||||||||
| Tuberculosis (4) | 0.94 | 0.98 | 0.96 | 0.9981 | ||||||||
| Viral Pneumonia (5) | 0.78 | 0.80 | 0.79 | 0.9824 | ||||||||
| VGG-19 | Bacterial Pneumonia (0) | 0.83 | 0.88 | 0.85 | 0.9857 | 89.51 | 0.9014 | 0.8929 | 0.8957 | 0.9925 | 53.31 | 24.16 |
| COVID-19 (1) | 0.88 | 0.98 | 0.93 | 0.9956 | ||||||||
| Fibrosis (2) | 0.94 | 0.80 | 0.87 | 0.9914 | ||||||||
| Normal (3) | 0.91 | 0.90 | 0.90 | 0.9883 | ||||||||
| Tuberculosis (4) | 0.99 | 0.96 | 0.97 | 0.9990 | ||||||||
| Viral Pneumonia (5) | 0.73 | 0.62 | 0.67 | 0.9666 |
| Classification Model | Class | Precision | Recall | F1-Score | AUC | Testing Accuracy | Testing Time (s) |
|---|---|---|---|---|---|---|---|
| Proposed CNN | Bacterial Pneumonia (0 *) | 1.00 | 0.99 | 0.99 | 0.9999 | - | - |
| COVID-19 (1) | 0.95 | 0.96 | 0.95 | 0.9958 | - | - | |
| Fibrosis (2) | 0.96 | 0.99 | 0.98 | 0.9971 | 96.96% | 16.39 | |
| Normal (3) | 0.96 | 0.93 | 0.95 | 0.9966 | - | - | |
| Tuberculosis (4) | 0.97 | 0.99 | 0.98 | 0.9990 | - | - |
| Classification Model | Class | Precision | Recall | F1-Score | AUC | Testing Accuracy | Testing Time (s) |
|---|---|---|---|---|---|---|---|
| Proposed CNN | Bacterial Pneumonia (0 *) | 0.99 | 1.00 | 1.00 | 1.000 | 97.81% | 14.20 |
| COVID-19 (1) | 0.98 | 0.95 | 0.97 | 0.9982 | |||
| Normal (2) | 0.97 | 0.98 | 0.97 | 0.9986 | |||
| Tuberculosis (3) | 0.98 | 0.99 | 0.98 | 0.9984 |
| Classification Model | Class | Precision | Recall | F1-Score | AUC | Testing Accuracy | Testing Time (s) |
|---|---|---|---|---|---|---|---|
| 2D-CNN | Bacterial Pneumonia (0 *) | 0.99 | 0.99 | 0.99 | 0.9997 | 97.49% | 6.73 |
| COVID-19 (1) | 0.99 | 0.95 | 0.97 | 0.9965 | |||
| Normal (2) | 0.95 | 0.99 | 0.97 | 0.9997 |
| Classification Model | Class | Precision | Recall | F1-Score | AUC | Testing Accuracy | Testing Time (s) |
|---|---|---|---|---|---|---|---|
| 2D-CNN | Normal | 0.9791 | 0.9723 | 0.9756 | 0.9758 | 98% | 6 |
| COVID-19 |
| Research | Classes | Image Count | Model Applied | Results |
|---|---|---|---|---|
| Al-Waisy et al. [43] | 2 | COVID-19 = 400 and Normal = 400 | COVID-CheXNet | Accuracy = 99.99% |
| Al-Shourbaji et al. [44] | 2 | COVID-19 = 3616 and Normal = 10192 | BNCNN | Accuracy = 99.27% |
| Xu et al. [45] | 3 | COVID-19 = 219 Viral pneumonia = 224 Healthy = 175 | ResNet-18 | Accuracy= 86.7% |
| Srivastava et al. [46] | 2 | COVID-19 = 1281 Normal = 3270 viral-pneumonia = 1656 | CoviXNet | Accuracy = 99.47% |
| 3 | Accuracy = 96.61% | |||
| Apostolopoulos et al. [47] | 2 | COVID-19 = 224 Pneumonia = 700 Healthy = 504 | VGG-19 | Accuracy = 98.75% |
| 3 | Accuracy = 93.48% | |||
| Yoo et al. [48] | 4 | Normal = 120 TB = 120 Non-TB = 120 COVID-19 =120 | ResNet18 | Average Accuracy = 95% |
| Hussain et al. [49] | 2 | COVID-19 = 500 Normal = 800 Viral pneumonia = 400 Bacterial Pneumonia = 400 | CoroDet | Accuracy = 99.1% |
| 3 | Accuracy = 94.2% | |||
| 4 | Accuracy = 91.2% | |||
| Khan et al. [50] | 2 | COVID-19 = 290 Normal = 1203 Viral pneumonia = 931 Bacterial Pneumonia = 660 | CoreNet | Accuracy = 99% |
| 3 | Accuracy = 95% | |||
| 4 | Accuracy = 89.6% | |||
| Al-Timemy et al. [51] | 2 | Normal = 439 COVID-19 = 435 Bacterial Pneumonia = 439 Viral Pneumonia = 439 TB = 434 | Resnet-50 with ensemble of subspace discriminant classifier | Accuracy = 99% |
| 5 | Accuracy = 91.60% | |||
| Proposed Work | 2 | COVID-19 = 3616 Normal = 3616 | 2D-CNN | Accuracy: 2D-CNN = 98% |
| 3 | COVID-19 = 3616 Normal = 3616 Bacterial Pneumonia = 2530 | 2D-CNN | Accuracy: 2D-CNN = 97.49% | |
| 4 | COVID-19 = 3616 Normal = 3616 Tuberculosis = 3500 Bacterial Pneumonia = 2530 | 2D-CNN | Accuracy: 2D-CNN = 97.81% | |
| 5 | COVID-19 = 3616 Normal = 3616 Fibrosis = 1686 Bacterial Pneumonia = 2530 Tuberculosis = 3500 | 2D-CNN | Accuracy: 2D-CNN = 96.96% | |
| 6 | COVID-19 = 3616 Normal = 3616 Fibrosis = 1686 Viral Pneumonia = 1345 Bacterial Pneumonia = 2530 Tuberculosis = 3500 | 2D-CNN, VGG-16, Inception-v3, and VGG-19 | Accuracy: 2D-CNN = 96.75% VGG-16 = 90.43% VGG-19 = 89.51% Inception-v3 = 91.90% | |
| 7 | COVID-19 = 3616 Normal = 3616 Lung Opacity = 3616 Viral Pneumonia = 1345 Bacterial Pneumonia = 2530 Tuberculosis = 3500 Fibrosis = 1686 | 2D-CNN, VGG-16, Inception-v3, and VGG-19 | Accuracy: 2D-CNN = 93.15% VGG-16 = 88.33% VGG-19 = 90.41% Inception-v3 = 89.06% |
Disclaimer/Publisher’s Note: The statements, opinions and data contained in all publications are solely those of the individual author(s) and contributor(s) and not of MDPI and/or the editor(s). MDPI and/or the editor(s) disclaim responsibility for any injury to people or property resulting from any ideas, methods, instructions or products referred to in the content. |
© 2023 by the authors. Licensee MDPI, Basel, Switzerland. This article is an open access article distributed under the terms and conditions of the Creative Commons Attribution (CC BY) license (https://creativecommons.org/licenses/by/4.0/).
Share and Cite
Sultana, A.; Nahiduzzaman, M.; Bakchy, S.C.; Shahriar, S.M.; Peyal, H.I.; Chowdhury, M.E.H.; Khandakar, A.; Arselene Ayari, M.; Ahsan, M.; Haider, J. A Real Time Method for Distinguishing COVID-19 Utilizing 2D-CNN and Transfer Learning. Sensors 2023, 23, 4458. https://doi.org/10.3390/s23094458
Sultana A, Nahiduzzaman M, Bakchy SC, Shahriar SM, Peyal HI, Chowdhury MEH, Khandakar A, Arselene Ayari M, Ahsan M, Haider J. A Real Time Method for Distinguishing COVID-19 Utilizing 2D-CNN and Transfer Learning. Sensors. 2023; 23(9):4458. https://doi.org/10.3390/s23094458
Chicago/Turabian StyleSultana, Abida, Md. Nahiduzzaman, Sagor Chandro Bakchy, Saleh Mohammed Shahriar, Hasibul Islam Peyal, Muhammad E. H. Chowdhury, Amith Khandakar, Mohamed Arselene Ayari, Mominul Ahsan, and Julfikar Haider. 2023. "A Real Time Method for Distinguishing COVID-19 Utilizing 2D-CNN and Transfer Learning" Sensors 23, no. 9: 4458. https://doi.org/10.3390/s23094458
APA StyleSultana, A., Nahiduzzaman, M., Bakchy, S. C., Shahriar, S. M., Peyal, H. I., Chowdhury, M. E. H., Khandakar, A., Arselene Ayari, M., Ahsan, M., & Haider, J. (2023). A Real Time Method for Distinguishing COVID-19 Utilizing 2D-CNN and Transfer Learning. Sensors, 23(9), 4458. https://doi.org/10.3390/s23094458