Article

Improved Resting-State Functional MRI Using Multi-Echo Echo-Planar Imaging on a Compact 3T MRI Scanner with High-Performance Gradients

1
Department of Radiology, Mayo Clinic, Rochester, MN 55905, USA
2
Department of Physiology, Hanyang University, Seoul 04763, Republic of Korea
3
Mayo Clinic Graduate School of Biomedical Sciences, Mayo Clinic, Rochester, MN 55905, USA
4
GE Global Research, Niskayuna, NY 12309, USA
5
GE Healthcare, 78530 Buc, France
*
Author to whom correspondence should be addressed.
Sensors 2023, 23(9), 4329; https://doi.org/10.3390/s23094329
Submission received: 17 March 2023 / Revised: 21 April 2023 / Accepted: 25 April 2023 / Published: 27 April 2023
(This article belongs to the Special Issue Sensing Functional Imaging Biomarkers and Artificial Intelligence)

Abstract

:
In blood-oxygen-level-dependent (BOLD)-based resting-state functional (RS-fMRI) studies, usage of multi-echo echo-planar-imaging (ME-EPI) is limited due to unacceptable late echo times when high spatial resolution is used. Equipped with high-performance gradients, the compact 3T MRI system (C3T) enables a three-echo whole-brain ME-EPI protocol with smaller than 2.5 mm isotropic voxel and shorter than 1 s repetition time, as required in landmark fMRI studies. The performance of the ME-EPI was comprehensively evaluated with signal variance reduction and region-of-interest-, seed- and independent-component-analysis-based functional connectivity analyses and compared with a counterpart of single-echo EPI with the shortest TR possible. Through the multi-echo combination, the thermal noise level is reduced. Functional connectivity, as well as signal intensity, are recovered in the medial orbital sulcus and anterior transverse collateral sulcus in ME-EPI. It is demonstrated that ME-EPI provides superior sensitivity and accuracy for detecting functional connectivity and/or brain networks in comparison with single-echo EPI. In conclusion, the high-performance gradient enabled high-spatial-temporal resolution ME-EPI would be the method of choice for RS-fMRI study on the C3T.

1. Introduction

To study brain activity based on hemodynamic signals, blood-oxygen-level-dependent (BOLD) contrast has been widely used in functional MRI (fMRI) [1,2]. The gradient-recalled-echo echo-planar imaging (GRE-EPI) pulse sequence has been a workhorse for localizing brain activation regions and/or assessing intrinsic resting-state (RS) functional connectivity (FC) due to its sensitivity to BOLD signal. It has a short sampling time of a few seconds or less for whole-brain imaging. Since the source of the BOLD signal is caused by variation in magnetic susceptibility driven by vascular flow and relative deoxyhemoglobin concentration, T2* change is directly related to BOLD signal [3]. For a conventional single-echo/one-echo (OE) GRE-EPI acquisitions, the echo time (TE) used at 3T is typically set to approximately 30 ms, which is lower than the optimum (at TE~T2*) and represents a good compromise between BOLD sensitivity, image quality, and temporal resolution without excessive signal losses [4,5,6]. In landmark functional MRI (fMRI) studies, such as the Human Connectome Project (HCP), Alzheimer Disease Neuroimaging Initiative (ADNI) and Adolescent Brain Cognitive Development (ABCD) studies, all recommend the imaging protocol of spatial and temporal resolutions less than 2.5 mm isotropic voxel and 1 s repetition time (TR), respectively [7,8,9], which could be achieved with advanced imaging acceleration techniques, such as parallel imaging and simultaneous-multi-slice (multi-band, MB) imaging [10,11,12,13]. Although studies with multi-subject averaging with large sample sizes have shown group-level trends in RSFC, striving for better image SNR or temporal SNR (TSNR) remains a continuing effort in order to improve measurement robustness for individual subject [14,15].
Compared to single-echo acquisition, multi-echo (ME) is a fascinating approach that can address various goals in one acquisition, including sensitivity/SNR improvement and quantification of T2* relaxation time for clinical and basic neuroscience research. The ME scheme has been demonstrated with robust performance in various applications, including in a line-scanning fMRI with high spatiotemporal resolutions [16], in a combined gradient- and spin-echo acquisition for simultaneous quantify T2* and T2 relaxation time quantification [17], and in blood flow measurements to quantify T2* relaxation time [18]. Recently, a deep learning model was proposed for end-to-end parametric mapping for an overlapped multi-echo sequence [19]. Although a single echo train was used, overlapping multi-echo signals can be generated with multiple excitations. ME fMRI has been increasingly utilized in RS-fMRI studies as it can yield additional TE dependence information. For example, a study used a convolutional neural network to extract a BOLD pulsatility map from ME RS data [20]. ME fMRI combined with independent component analysis (ICA)-based artifact reduction technique has been applied to achieve improved BOLD signal quality in high-motion cohort groups like children [21]. As a promising technological advancement in this regard, ME fMRI has been proposed and shown to be advantageous for better denoising and boosting the reliability of functional connectivity [22,23,24,25].
ME acquisition scheme generally requires repetitive echo train measurements, which can compromise temporal resolution and lead to undesirable late echo time to go past the T2* decay window. One solution to this is to use a high gradient slew rate and reduce the duration of the EPI echo spacing. Advancements in MRI scanner hardware have enabled high-performance gradients, which can directly impact the implementation and performance of the ME acquisition. In this paper, we will use a compact 3T (C3T) scanner as a technology demonstrator for ME-fMRI. A lightweight, low-cryogen C3T MRI system is equipped with a high-performance gradient system mainly for brain imaging. The gradient coil system on the C3T has an inner diameter of 42 cm, yielding a 26 cm diameter of spherical volume for whole-brain imaging. Due to its small size, it can operate at a peak slew rate of 700 T/m/s with a peak amplitude of 80 mT/m on all gradient axes simultaneously [26,27,28,29,30] without peripheral nerve stimulation limitations [31,32]. In comparison, conventional whole-body MR scanners typically offer up to 200 T/m/s gradient slew rate and 40–80 mT/m peak gradient amplitude. The high-performance gradient system of the C3T is particularly beneficial for EPI-based acquisition. The higher gradient slew rate effectively minimizes the echo spacing and thereby reduces the readout duration [33]. Specifically, with the intended spatial-temporal resolution, the echo spacing on the C3T is 17.9 ms, which has been reduced by 43% from the echo spacing of 31.2 ms on a whole-body scanner with a 200 T/m/s slew rate. The third echo time is 47.8 ms, which can yield a late echo with substantial signal and T2* information. On the contrary, the whole-body scanner could only obtain a third echo at 81.5 ms, with the echo signal too weak to be useful. Additional benefits of reduced echo spacing includes greatly improved magnetic-susceptibility-induced geometric distortion [33,34,35]. Additionally, the shortened readout improves SNR obliviating the need for a partial Fourier sampling [36]. Furthermore, the shortened readout on the C3T enables minimal TR increase, which is helpful when high temporal resolution is desired.
Although ME acquisition has been well demonstrated to be superior for fMRI compared to OE acquisition [4,25,37,38,39], previous studies using ME acquisitions were conducted on conventional whole-body MRI systems with imaging parameters that marginally met the requirements for fMRI, such as a ~2 to 3 s TR and/or greater than 3 mm isotropic resolution with partial Fourier acquisition to cover the whole brain. fMRI studies prioritizing higher spatial or temporal resolutions while still maintaining whole brain coverage could not choose ME fMRI despite its benefits [40]. Advanced gradient performance can help break the tradeoffs by enabling the desired spatial and temporal resolutions for ME fMRI that are similar to those of OE fMRI used in landmark fMRI studies [7,8,9].
The purpose of this study was to perform a comprehensive investigation on the feasibility and utility of ME fMRI imaging with a high spatiotemporal resolution by comparing it with an OE fMRI acquisition with matched spatial resolution on the C3T. Our hypothesis is that ME fMRI has improved RS FC detectability on the C3T when compared with OE fMRI, the spatiotemporal resolution of which is similar to those used in the landmark fMRI studies. For a fixed acquisition time, the counterpart OE fMRI has more time frames compared to the ME fMRI. It is not clear if the advantage of ME fMRI still holds, considering the loss of temporal resolution at the spatial resolution. Thus, data from both ME and OE acquisitions were obtained on the C3T from healthy volunteers with the same acquisition parameters, except that OE uses a shorter TR. The performance of ME to OE acquisition was assessed by evaluating explained variance, SNR and TSNRs. The signal intensity recovery by ME acquisition was investigated using cortical coverage analysis and ROI-based functional connectivity. Additionally, seed- and independent-component-analysis (ICA)-based analyses in functional connectivity were used to determine the effectiveness of ME fMRI. It was demonstrated that ME-EPI provides superior sensitivity and accuracy for detecting functional connectivity and/or brain networks in comparison with OE-EPI.

2. Materials and Methods

2.1. Data Acquisition

Following a study protocol approved by the Institutional Review Board, 24 healthy subjects (age = 35.0 ± 10.7 years; 18 females/6 males) participated in this study after written informed consent was obtained. All subjects were scanned on the C3T using a 32-channel brain coil (Nova Medical, Inc., Wilmington, MA, USA). During the RS-fMRI scans, all subjects were instructed to remain still and fix their gaze on the center of a mirror mounted on the head coil. Independent measures of physiological variables (cardiac and respiration) were recorded.
RS-fMRI experiments were conducted using a ME MB gradient-echo EPI sequence with blipped-controlled aliasing in parallel imaging technique [10,37]. The fMRI datasets were separately acquired for OE and ME (three echoes) acquisitions. A whole-brain fMRI protocol, including the following imaging parameters were applied in Table 1. ME acquisition was consecutively repeated twice to fill 10 min of scan duration due to a scanner system memory software limit on the total number of reconstructed images per series (GE Healthcare, DV26) rather than hardware restriction.
As an anatomical reference, a high-resolution T1-weighted image (magnetization-prepared rapid acquisition with gradient echo, or MPRAGE) was obtained on the C3T with the following parameters: TR= 5.4 ms, TE = 2.4 ms, inversion time = 1000 ms, FA = 8°, resolution = 1.0 × 1.0 × 1.0 mm3, field of view = 25.6 × 16.6 × 25.6 cm3. Gradient nonlinearity (GNL) induced distortion on all fMRI and anatomical images obtained with the C3T was corrected in the image domain retrospectively using a tenth-order inline GNL correction (gradwarp) algorithm [30,31].

2.2. Data Preprocessing for fMRI Datasets

The preprocessing procedures for RS-EPI datasets were all carried out using AFNI (Analysis of Functional NeuroImages, https://afni.nimh.nih.gov/, accessed on 26 March 2021)’s suite of programs [41]. For preprocessing and artifact reduction of the RS-EPI data, the following steps were performed in sequence: truncation by initial ten volumes to yield steady-state magnetization, de-spiking (‘3dDespike’ in AFNI), physiological noise elimination including cardiac and respiratory artifacts (‘RETROICOR’ and ‘RVT’) [42,43], slice acquisition timing correction (‘3dTshift’ in AFNI), time-series alignment, Legendre polynomial detrending and motion- and hardware-related linear regressions [44,45,46], in order. For the ME dataset, a T2*-weighted echo combination was performed between the time-series alignment and the detrending and the regressions [4,38,47] by using AFNI (‘@compute_OC_weights’). All datasets were evaluated for artifacts due to abrupt head motion, passing the sudden motion detection of AFNI at the threshold level of 0.2 mm for the Euclidean L2 norm of motion displacement during each TR interval [45].
For functional connectivity (FC) estimation, the artifact-reduced residual time series were bandpass-filtered with a frequency range of 0.009 to 0.1 Hz and smoothed by a Gaussian kernel with a 4 mm full-width-at-half-maximum on volume dataset (‘3dTproject’ in AFNI). The preprocessed datasets were spatially normalized into the 2.0-mm-isotropic-resolution MNI template of ‘MNI152_T1_2009c+tlrc.HEAD’ by ‘auto_tlrc’ in AFNI. For FC investigation, the two ME datasets were concatenated after time-series z-score normalization as performed in the previous study [48] to render the final dataset with ~10-min length.

2.3. Data Analysis

2.3.1. Explained Variance Evaluation

To examine the change in signal variance using a model component, namely a regressor or echo combination, the marginal R2 value was introduced to represent the proportion of the signal variance observed without individual preprocessing steps relative to the variance observed with all preprocessing steps, as performed in the previous study [44]. The value of R2 was evaluated from:
R s t e p 2 1 S S t o t a l S S s t e p ,
where SStotal was the error sum of squares with all preprocessing steps, and SSstep was the error sum of squares with all preprocessing steps except for a certain step. Without bandpass filtering and spatial smoothing, R2 were evaluated for the conventional artifact-related regressors of the RETROICOR [42], ANATICOR [44], motion and global cerebrospinal fluid (CSF) signal, and for the T2*-weighted echo combination only in ME datasets. For comparison between OE and ME acquisitions, ME datasets before the time-course scaling were used and the mean R2 values were calculated in gray matter (GM) and white matter (WM) voxels across all subjects.
To evaluate the dependence between artifact/noise removed by regressors and the T2*-weighted echo combination, the Pearson correlation coefficients were calculated. The numbers of regressors for RETROICOR [42] (up to 2nd order, including 5 regressors of RVT [43]), motion (six parameters for rigid-body motion and their first order derivative), and global-CSF artifacts (first 3 principal components of lateral ventricles) were thirteen, twelve and three for each dataset, respectively. The single time series for each voxel was collected as an ANATICOR regressor. The noise removed by the echo combination was estimated by subtraction between echo-combined and mid-echo-only time courses. The correlation coefficients calculated across regressions and subjects were averaged by mean root square for the summary. Additionally, SNR and TSNR of ME and OE datasets were investigated across GM and WM voxels [49], where TSNR were derived with/without the regressions to compare artifact reduction effect on TSNR in ME and OE datasets.

2.3.2. ROI-Based FC Analysis

The effect of echo combination on signal intensity recovery was investigated for OE and ME datasets. A mask was created with the base EPI image of each dataset binarized by ‘3dAutomask’ in AFNI and converted onto a 3D surface model of ‘suma_TT_N27′ provided in SUMA [50]. The cortical coverage was visualized by overlapping each EPI mask with the gray matter on the corresponding anatomy image [35]. The cortical coverage ratio was evaluated as the percentage of overlap between the averaged EPI masks across subjects and the gray matter on the surface model and [35].
The effect of signal intensity enhancement of echo combination on FC was also investigated by ROI-based FC. 168 cortical parcellations for an individual anatomical image were defined as ROIs by FreeSurfer software [51,52]. The inter-ROI FC was evaluated as the Pearson correlation coefficient between the time courses of the two ROIs. Fisher-transformed FCs composed an FC matrix of 168 × 168. Due to regional signal dropout in images, which depended on the subject’s anatomical shape and position against the B0 field, a paired Student’s t-test for group comparison was applied to the FC matrices obtained from OE and ME datasets from 18 subjects. Inter-ROI FCs were thresholder with a statistically significant difference (uncorrected p < 0.01) and a meaningful FC value (Fisher(r)) > 0.3) in either OE or ME FCs, and the numbers of the inter-ROI FCs survived by the two thresholds were counted.

2.3.3. Seed-Based FC Map

To examine seed-based FC extents, 10 ROIs adopted from AAL3v1 [53] were selected as the seeds for the spatially normalized preprocessed datasets, including anterior cingulate cortex (ACC), insula (Ins), hippocampus (Hipp), posterior cingulate cortex (PCC), and precentral gyrus (PCG) on both hemispheres [54,55]. To evaluate an individual FC map, the Pearson correlation coefficients were calculated between the time courses of each voxel and the seed regions, which were converted into a z-score by Fisher transformation. Average FC maps for both OE and ME datasets were calculated by unpaired two-sample Student’s t-tests, including one-sample tests by ‘3dttest++’ in AFNI with a covariate of global correlation (GCOR) [56] and corrected by the FDR algorithm (‘3dFDR’ in AFNI). The group-level FC maps were statistically thresholded by the FDR-corrected p-value < 0.001. After statistical thresholding, the FC-magnitude threshold was applied to the seed-based group-level FC maps, and the number of voxels that survived was evaluated as the extent of FC.

2.3.4. ICA-Based FC Detection

Independent component analysis (ICA)-based functional connectivity was investigated by using concat-ICA and dual regression methods. Concat-ICA was used to identify a set of independent component (IC) maps from the whole group of OE and ME datasets, which was performed by using the ‘melodic’ command in FSL with an option of 20 dimensions [57,58,59]. Among 20 IC maps, 8 IC maps were identified as brain networks, including default mode network (DMN), lateral visual areas (LOcc), medial visual areas (MVis), right and left frontal-parietal networks (RFPN and LFPN), auditory network (Aud), executive control network (ECN), and sensorimotor network (Sens) [57]. The whole-group IC maps were used as the inputs for dual regression and as the group truth with a statistical threshold to assess OE/ME group results derived by dual regression.
Dual regression was conducted by ‘dual_regression’ provided in FSL with the following two steps [58,59,60]. The first step was to identify a subject-specific time course using spatial regression of the group IC maps derived by concat-ICA. The second step was to identify a subject-specific spatial map using temporal regression of the subject-specific time course. To investigate the scan time dependence, i.e., the effect of scan time length on the sensitivity and specificity of ICA-derived brain network, each subject-specific dataset was truncated to time lengths ranging from 2 to 9 min at increments of 1 min. The same dual regression was applied to each dataset with different time lengths as the group IC maps. For a statistical comparison between the ME and the OE datasets, the OE/ME groups of individual spatial IC maps were tested by using ‘randomise’ command of the FSL’s randomise permutation-testing tool (N = 5000).
In this study, whole-group IC maps were assumed to be the ground truth for brain networks [57,60]. OE-/ME-group IC maps derived from OE/ME datasets were assessed in terms of sensitivity, specificity, and accuracy. For the quantitative assessment, the OE-/ME-group IC maps were binarized by a threshold of p < 0.001 to create the corresponding masks. The numbers of voxels were counted as true positives (TP), true negative (TN), false positive (FP), and false negative (FN) based on the OE-/ME-group IC map mask on the corresponding whole-group IC map mask. Sensitivity, 1—specificity (as false positive rate, FPR), and accuracy for each IC map were evaluated as followings, respectively.
S e n s i t i v i t y = T P T P + F N
F a l s e   p o s i t i v e   r a t e = 1 T N T N + F P
A c c u r a c y = T P + T N T P + T N + F P + F N

3. Results

3.1. Data Selection for Analysis

Among the total of 24 volunteers, two subjects had 70 and 48 time frames censored by the criterion in concatenated ME data and 22 and 32 in OE data, respectively, which were quite larger than the number of censored time frames of other subjects. The datasets from the subjects were considered to be contaminated with high motion [61] and excluded for subsequent analysis. Four volunteers were scanned only with OE fMRI, without ME fMRI. Thus, 22 sets of 11-min for OE datasets and 36 sets of 5-min for ME datasets (2 sets from 18 individual subjects) were used for further analysis.
The average translational motion per TR across datasets were 0.028 ± 0.010 mm and 0.027 ± 0.010 mm for OE and ME acquisitions, respectively, which corresponded to 0.033 ± 0.012 mm and 0.033 ± 0.012 mm average motion per second, which was much smaller than the censoring criterion of 0.2 mm. Time frames with motion exceeding 0.2 mm were censored in each dataset. 1.8 (±2.7) and 1.4 (±2.4) of time frames were censored on average (±standard deviation) for OE and ME acquisitions, respectively. Thus, the average number of samples used was 949 ± 3 and 309 ± 2 for OE and ME session, respectively. After concatenation of ME datasets, all preprocessed datasets ended up with various data length ranging from 10 min 58 s and 9 min 26 s and they were all truncated to 9-min length for comparison purpose, where 772 and 575 time frames were used for further FC analysis of OE and ME acquisitions, respectively.

3.2. Explained Variance

Figure 1A showed an example of R2 spatial maps in ME and OE acquisitions. A great reduction in signal variance by echo combination can be globally visualized (‘Combine’ in Figure 1A), except for regions near large vessels where R2 for the RETROICOR regressors dominates as indicated in ‘Physio’ of Figure 1A. In Figure 1B, average R2 in the GM and WM were both evaluated for conventional regressors and T2*-weighted echo combination of ME acquisitions and for the regressors of OE acquisitions as reference. The conventional regressors for ME acquisitions showed a similar trend in R2 values with those for OE acquisitions except for the scale. R2 for echo combination were substantially higher than R2 for other regressors. It showed that a fairly large portion of signal variance was removed through echo combination. For echo combination, R2 in WM tended to be slightly larger than in GM.
The reduced signal variance led to improve SNR and TSNR of ME acquisitions in Figure 1C. Note that TSNR0 and TSNR were evaluated without and with artifact regression processing, respectively. In terms of TSNR, the artifact regression was more effective with ME datasets than OE datasets. TSNR gains in ME verse OE acquisitions were approximately 1.8 and 2.0 times on GM and WM, respectively. The OE acquisition has the number of time frames 34% more than the ME fMRI (700 vs. 940 ms). Considering TSNRs with the numbers of time frames like T S N R · #   o f   t i m e   f r a m e s [13], its gains in ME verse OE acquisitions were approximately 1.56 and 1.74 times on GM and WM in the same scan time, respectively. In terms of T S N R · #   o f   t i m e   f r a m e s on GM, approximately 2.4 times longer scan time for OE acquisition would be needed to have an equivalent value to ME acquisition.
Correlations of noise reduced by echo combination were calculated and compared to those among other regressors in Figure 1D. The noise removed by echo combination was relatively independent from other regressors or itself. While a voxel-wise regressor of ANATICOR [44] tended to be highly correlated to regressors of adjacent voxels, the voxel-wise noise removed by echo combination showed the low-level correlation with noises removed in adjacent voxels.

3.3. ROI-Based FC Difference

In Figure 2, raw EPI images with multiple echoes were plotted with the corresponding anatomical images of a single subject. The T2*-weighted echo combination enhanced signal intensity effectively in brain regions with high-susceptibility as indicated. For group comparison, the cortical coverage ratio was visualized in anterior and inferior views on the standard surface model for OE and ME datasets in Figure 3A,B, respectively. The overall cortical coverage ratio was improved with ME datasets. Specifically, medial orbital sulci (olfactory sulci) and anterior transverse collateral sulci on both hemispheres as indicated in Figure 3B showed signal intensity improvement across almost all subjects, which were medial orbital sulcus and anterior transverse collateral sulcus defined as ‘S_orbital_med-olfact’ and ‘S_collat_transv_ant’ in the reference [52], respectively.
Through the statistical comparison of 168-ROI-based FC matrices of OE and ME datasets, FC group difference of each ROI was visualized on the surface model as shown in Figure 3C. Four ROI regions, indicated by arrows in Figure 3C, had significant differences in functional connectivity, as well as in signal intensity. The locations of the four ROIs were consistent with the regions indicated in Figure 3B, where cortical coverage on the surface model was dramatically improved by echo combination. For visualization of the meaningful FCs from the four ROIs, i.e., |Fisher(r)| > 0.3, the BrainNet Viewer [62] was used to plot edges for inter-ROI functional connections derived from the four ROIs. In Figure 3D,E, OE datasets showed a much smaller number of FCs from the red nodes than ME datasets.

3.4. Seed-Based FC Extents

Seed-based group-level FC maps were obtained with datasets statistically thresholded with FDR-corrected p < 0.001. Each estimated FC extent was limited with |Fisher(r)| > 0.3. Note that Fisher(r) denoted Fisher-transformed Pearson correlation coefficient. Figure 4A showed average FC maps derived from 10 seeds as group results of 9-min-length OE and ME datasets. ME FC maps showed similar or stronger clusters than the OE FC maps for seeds placed in PCG, Ins, and PCC. For seeds placed in Hipp and ACC, ME datasets detected additional clusters in FC maps as indicated by arrows in Figure 4A. Figure 4B showed quantitative comparisons of the group-level FC extents with 9-min-length datasets, where ME produced broader FC extents with higher number of voxels than OE in most seed-based FC maps. Especially, for Hipp and ACC seeds, FC extents of ME datasets were approximately up to 3 times larger than those of OE datasets.

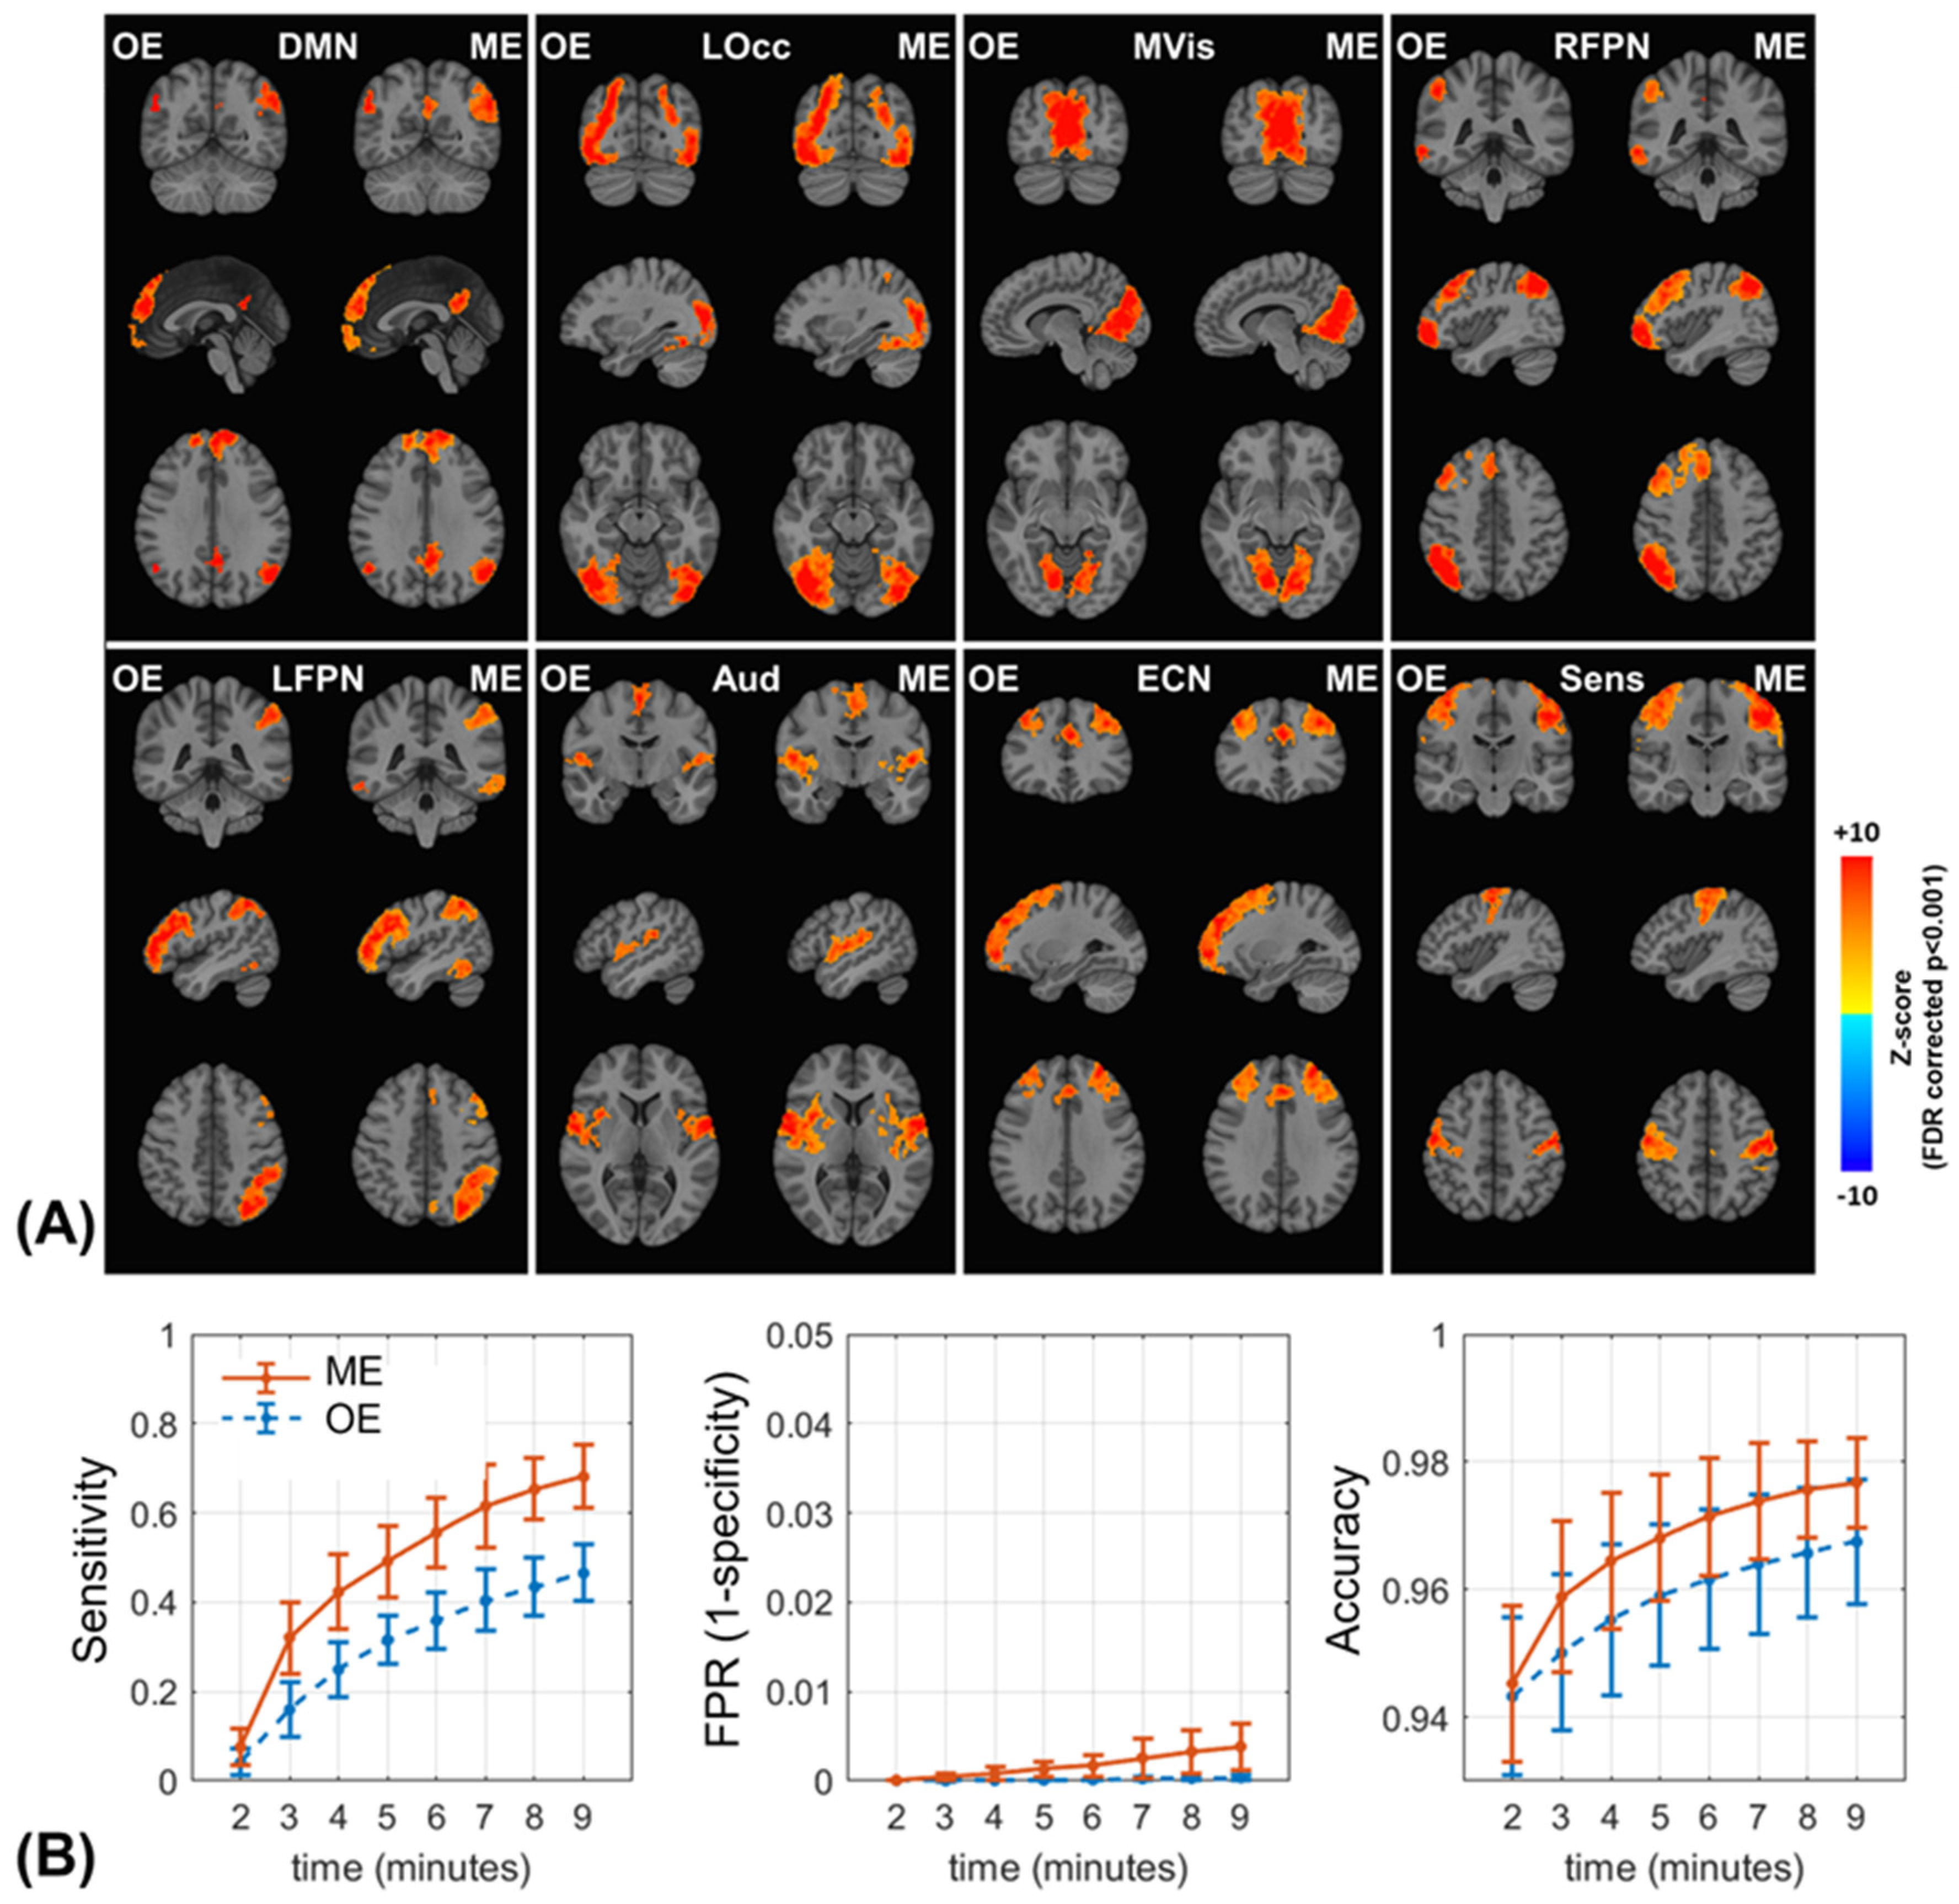
3.5. ICA-Based FC Detection

Eight IC maps were identified as well-known intrinsic brain networks from 20 IC components. Group-level IC maps calculated by dual regression and permutation test with truncated OE/ME datasets are shown in Figure 5A. IC maps were derived by datasets thresholded by FDR corrected p-value < 0.001. Visually, group-level IC maps from ME datasets showed stronger and broader connectivity than those from OE datasets. Sensitivity, false positive rate (FPR, as ‘1-specificity’) and accuracy of OE/ME group IC maps were evaluated with a threshold of FDR corrected p < 0.001. In Figure 5B, the averages of all three metrics across eight IC maps were plotted against scan length. ME datasets produced higher sensitivity than OE datasets through all scan times. Scan lengths shorter than 2 min failed to show acceptable levels of sensitivity for both groups as expected. As sensitivity increased along scan length, although FPR increased for both groups, overall, it remained at a very low level (<0.004) for the threshold. The accuracy of the ME group was superior to that of the OE group at all scan time lengths. For example, a 4-min ME acquisition was comparable to an 8-min OE acquisition in terms of sensitivity and accuracy.

4. Discussion

In this study, the feasibility and capability of multi-echo fMRI was investigated on C3T with the high-performance gradient system. Three-echo fMRI was achieved with a spatial resolution of 2.4-mm isotropic voxel without partial Fourier sampling and a temporal resolution less than 1 s. The spatio-temporal resolution is comparable to the OE fMRI protocols used in landmark fMRI studies, such as HCP, ABCD and ADNI projects [7,8,9]. The shortened echo spacing enabled by higher slew rate allowed for additional echoes to be inserted at a relatively high spatial and temporal resolution with slight increase in TR. Since the ME acquisition extend the TR of OE from 700 ms to 940 ms, ME would yield fewer time frames than OE for a fixed amount of scan time. Our investigation strived to find out if the prospect of ME still holds despite of the loss of temporal resolution. The performance comparison of the ME over the OE acquisition with matched spatial resolution were assessed using signal variance and different types of functional connectivity analyses for further understanding. Compared to the OE acquisition, the ME acquisition was shown to have greatly reduced in thermal noise variance and recovered signal intensity/functional connectivity at brain regions suffering from high susceptibility. This resulted in a broad extent FC with several clusters in seed-based RSFC analysis, even in the regions of hippocampus and ACC suffering from distortions. Additionally, it was demonstrated that ME acquisition provided superior sensitivity and accuracy for detecting intrinsic brain networks in ICA-based RSFC analysis. Hence, a ME acquisition with higher TSNR and broader functional coverage was more beneficial than an OE acquisition with higher temporal resolution using the high-performance gradient on the C3T. With the advent of more high-performance gradient, such as the MAGNUS gradient insert [63] and Connectome 2.0 gradient [64], this study can shed some light to investigators who have access to these systems on which sequence to choose between ME-EPI or OE-EPI for RS-fMRI studies.
The absence of a direct comparison with conventional whole-body 3T scanner is primarily due to limitations of whole-body scanner gradients. To achieve the same spatial resolution and brain coverage, the three echo times on whole-body scanner (i.e., GE 750 3T MRI scanner) would be 19.1 ms, 50.3 ms, and 81.5 ms, respectively. The last echo would be far out in the T2* decay window and useless for signal contribution. As shown in Figure 6, an imaging parameter comparison at various isotropic spatial resolutions ranging from 1.4 mm to 3.5 mm showed a significant gap between the C3T and a conventional GE 750 scanner (200 T/m/s gradient slew rate and 50 mT/m peak gradient amplitude), where echo times, repetition time, echo spacing, and inter-TE duration were present depending on isotropic voxel size available on the C3T and conventional whole-body scanners. In this survey, full sampling in k-space was applied because partial Fourier sampling causes spatial resolution loss in phase-encoding direction. 2.4 mm imaging on the C3T scanner can achieve similar echo times, TR and inter-TE duration to those in 3.5 mm imaging on a conventional scanner. Even though the voxel volume in 2.4 mm imaging is only at 32.2% of the voxel volume in 3.5 mm imaging, it was demonstrated that 2.4 mm OE imaging could produce sufficient SNR for fMRI protocol in the functional MRI studies [7,8]. Thus, the study on the conventional whole-body 3T was omitted and we chose to only focus on the ME and OE comparison on the C3T. Additionally, our previous OE fMRI study between the C3T and the conventional 3T scanners demonstrated that the shortened echo spacing directly mitigates the geometric distortion on naïve EPI images to improve fidelity in a registration with anatomy images [35]. It was expected that this improvement is still valid for ME imaging on the C3T.
In this study, 3-echo acquisition was chosen based on the balanced consideration of T2* decay window, temporal resolution, and number of echoes for the spatial resolution that we used as shown in Figure 6. The fourth echo would fall close to T2*~66.0 ms of a gray matter at 3T [65] and yield minimum signal, which would not contribute much to the combined-echo SNR. Additionally, any echoes added after the third one won’t be beneficial to signal recovery for a voxel with short T2* because the first echo dominates the signal recovery in the T2*-weighted echo combination. On the other head, echoes with longer TE (>60 ms) could potentially be beneficial for voxels with long T2* and helpful in accurate estimation of T2* [3] or the automated classifier for TE-dependent signal, i.e., BOLD component in MEICA [54], which will be included in future study.
The signal variance in RS-fMRI could originate from various sources, such as pulsation and respiration, head motion, CSF fluctuation, hardware malfunction, and thermal noise, as well as BOLD signal. Preprocessing steps to improve sensitivity for functional connectivity have been developed to reduce the effect of artifacts caused by well-known sources, such as physiological fluctuation, head motion, and hardware instability [42,43,44,61]. For signal variance reduction related to thermal noise, smoothing and filtering have widely been used. For ME preprocessing, T2*-weighted echo combination has been used as a conventional method to boost contrast-to-noise and BOLD sensitivity [4]. We evaluated the impact of the echo combination on signal variance reduction. The reduced variance by echo combination was greater than from other regressors and tended to be uniformly distributed across the whole brain. Interestingly, the noise reduced by echo combination was not strongly correlated with other regressors and noise from adjacent voxels. This could be attributed to the fact that the variance removed by echo combination originated from thermal noise, since this is not strongly correlated with other artifact sources or the BOLD signal.
Along with the reduction in signal variance, ME fMRI produced the same or higher sensitivity for functional connectivity than the OE fMRI results via various FC analyses. This indicates that the small BOLD signal is well preserved during the echo combination and that the variance reduction is related to thermal noise rather than other noise/artifact sources. Since there is no specific regression model for thermal noise in the absence of temporal or spatial filtering, ME providing a higher SNR could be a preferred method over OE acquisition for RS-fMRI. Additionally, the R2 of the echo combination in WM appeared to be higher than in GM because WM has a lower level of signal variance than GM due to less BOLD signal variance and other physiological noise sources [66].
In the ICA-based FC evaluations, enhanced sensitivity was demonstrated for ME compared to OE acquisition. Although slightly higher FPRs were also observed for ME compared to OE acquisition, in all cases they are relatively low (<0.01) for all threshold values. In terms of accuracy, ME acquisition outperforms OE acquisition at statistical threshold with p < 0.001. The time dependency analysis indicated that ME acquisition with a shorter scan time could be considered as a better substitute to longer OE acquisition for RS-fMRI studies as they showed comparable sensitivity and accuracy.
Previous task-based BOLD fMRI studies have shown that signal intensity enhancement by echo combination offers the opportunity to study regions with rapid susceptibility spatial variation, especially along the inferior cerebral hemispheres, such as the ventromedial prefrontal cortex [39,67]. Inter-ROI FC comparison in this study with high performance gradients supports that signal intensity enhancement by echo combination helps to extract even spontaneous BOLD signal in regions of high susceptibility, such as medial orbital sulci (olfactory sulci) and anterior transverse collateral sulci. Echo combination has yet to fully recover signal dropout that intrinsically occurs in EPI acquisition. When it is combined with other susceptibility reduction techniques, such as z-shimming [68], it is expected to further improve cortical coverage.
ICA-based fMRI de-noising methods, such as ICA-AROMA, MEICA, TEDANA, etc. [54,69] has shown the potential for data quality improvements, as well as the capability to subject-specifically separate signal versus noise/artifacts. These methods could provide noise and artifact component removal and, thus, improved performance for FC detection [25,70]. The primary focus of this work is to compare the benefit of only ME combination to the shorter (but comparable) TR of OE acquisition on the condition of high-spatial-temporal resolution implementation, especially when it is performed on the C3T fully using the high gradient slew rate. However, the IC classifiers for these ICA-based de-noising methods were extensively studied with relatively higher SNR fMRI data, such as low-spatial-temporal resolution fMRI datasets. As described in previous studies [22,69,71], the classifiers could fail in case of ambiguous components and an expert/interpreter may be required to manually intervene and decide whether components were classified correctly. For these reasons, ICA-based de-noising methods were excluded in preprocessing of data cleaning in this study, which would be examined in future study. Instead of detecting ICA-based subject-specific artifact components, concat-ICA was applied to detect ‘well-known’ brain network components common to all subjects and all datasets. Echo combination served as a single extra pre-processing step for the ME fMRI. All the other denoising steps remained the same between ME and OE acquisitions. Even without ICA-based denoising pre-processing, ME fMRI still outperforms OE fMRI based on several analysis methods.
A limitation in this study was that the scan length of the ME acquisition was restricted by a scanner software limit on the total number of reconstructed images per scan. With the limit, the proposed ME imaging protocol (Table 1) was restricted to only 5 min per scan. To achieve a longer scan length, two ME scans had to be performed consecutively and concatenated together afterwards. Due to this, there is a potential loss in temporal continuity introduced by data truncation and concatenation. Since RS FC estimates are modulated by slow frequency dynamics with cycles on the order of several minutes [72], data truncation of any RS-fMRI dataset could cause biased reliability and reproducibility in FC estimate [73]. As an alternative approach, data scrubbing, such as delta function regression has been suggested to minimize a loss in reliability and reproducibility on the FC estimate [73]. Although the previous study demonstrated that data concatenation could improve the reliability of functional connectomics [48], it is still unclear how a potential loss in temporal continuity caused by the data concatenation would influence the FC estimate [48]. With a recent software upgrade of the C3T scanner, the system currently allows a non-stop acquisition of the ME scan over 10 min. This enables comparison of concatenated data with data acquired without discontinuity. As part of future works, the effect of data concatenation with different preprocessing steps will be investigated.
For future works, the enhanced sensitivity of ME fMRI will be applied to clinical RS-fMRI studies of aging and neurodegenerative diseases, such as dementia as the brain suffers from signal dropout in regions with iron deposition and increased partial volume effect due to brain atrophy [74]. Additionally, ME fMRI provides opportunities for improved functional connectivity detection in regions, such as the hippocampus and ACC, which would benefit cognitive neuroscience studies related to memory or cognition [75]. From a technical point of view, the choice of echo number for ME fMRI needs to be evaluated when ICA-based fMRI methods are used for denoising and motion correction. The ME acquisition studied here is based on 2D EPI acquisition. Emerging new techniques, such as wave-CAIPI [76,77] could potentially enable 3D ME imaging. The high-performance gradient on the C3T would also be beneficial for shortening the sinusoidal acquisition window and facilitate ME fMRI, which makes it an interesting topic for future study.

5. Conclusions

Multi-echo-EPI acquisition was feasible with a spatial resolution < 2.5 mm isotropic voxel and a temporal resolution < 1 s on a high-performance gradient system of C3T and was demonstrated to provide superior SNR, TSNRs, sensitivity and accuracy to the corresponding OE-EPI acquisition with matching spatial resolution despite the temporal resolution loss. The high-performance gradient enabled high-spatial-temporal resolution ME EPI would be the method of choice for RS-fMRI study on the C3T.

Author Contributions

Conceptualization, D.K., M.-H.I., H.J.J. and Y.S.; Methodology, D.K.; Formal analysis, D.K.; Data curation, M.A.H., E.M.G. and J.H.III; Writing—original draft, D.K. and Y.S.; Writing—review & editing, D.K., M.-H.I., H.J.J., N.K.M., Z.A., R.M., T.K.F., B.F., D.F.B., K.M.W., J.D.T., J.H.III, M.A.B. and Y.S.; Visualization, D.K.; Supervision, Y.S.; Project administration, Y.S.; Funding acquisition, M.A.B. and Y.S. All authors have read and agreed to the published version of the manuscript.

Funding

This research was funded by National Institute of Biomedical Imaging and Bioengineering (NIBIB) at the National Institutes of Health (NIH) (Grant/Award Nos. U01 EB024450 and U01 EB026976).

Institutional Review Board Statement

The study was conducted in accordance with the Declaration of Helsinki, and approved by the Institutional Review Board of Mayo Clinic (IRB 14-001036).

Informed Consent Statement

Written informed consent was obtained from all subjects involved in the study.

Data Availability Statement

The original contributions presented in the study are included in the article, further inquiries can be directed to the corresponding author.

Acknowledgments

The authors acknowledge the assistance of Sonia Watson, in preparation of the manuscript.

Conflicts of Interest

Authors Y.S., J.D.T. and M.A.B. acknowledge the following financial interest: Mayo Clinic has licensed intellectual property related to the compact 3T to GE Healthcare. Authors T.K.F. and R.M. are employed by GE Global Research Center. Author B.F. is employed by GE Healthcare.

References

  1. Ogawa, S.; Lee, T. Brain magnetic resonance imaging with contrast dependent on blood oxygenation. Proc. Natl. Acad. Sci. USA 1990, 87, 9868–9872. [Google Scholar] [CrossRef] [PubMed]
  2. Menon, R.S.; Ogawa, S.; Tank, D.W.; Uğurbil, K. Tesla gradient recalled echo characteristics of photic stimulation-induced signal changes in the human primary visual cortex. Magn. Reson. Med. 1993, 30, 380–386. [Google Scholar] [CrossRef] [PubMed]
  3. Speck, O.; Hennig, J. Functional imaging by I0- and T2*-parameter mapping using multi-image EPI. Magn. Reson. Med. J. Soc. Magn. Reson. Med. Soc. Magn. Reson. Med. 1998, 40, 243–248. [Google Scholar] [CrossRef]
  4. Poser, B.a.; Versluis, M.J.; Hoogduin, J.M.; Norris, D.G. BOLD contrast sensitivity enhancement and artifact reduction with multiecho EPI: Parallel-acquired inhomogeneity-desensitized fMRI. Magn. Reson. Med. 2006, 55, 1227–1235. [Google Scholar] [CrossRef]
  5. Kang, D.; Sung, Y.W.; Shioiri, S. Estimation of physiological sources of nonlinearity in blood oxygenation level-dependent contrast signals. Magn. Reson. Imaging 2018, 46, 121–129. [Google Scholar] [CrossRef] [PubMed]
  6. Norris, D.G. Principles of magnetic resonance assessment of brain function. J. Magn. Reson. Imaging 2006, 23, 794–807. [Google Scholar] [CrossRef]
  7. Casey, B.J.; Cannonier, T.; Conley, M.I.; Cohen, A.O.; Barch, D.M.; Heitzeg, M.M.; Soules, M.E.; Teslovich, T.; Dellarco, D.V.; Garavan, H.; et al. The Adolescent Brain Cognitive Development (ABCD) study: Imaging acquisition across 21 sites. Dev. Cogn. Neuros-Neth 2018, 32, 43–54. [Google Scholar] [CrossRef]
  8. Gunter, J.L.; Borowski, B.J.; Thostenson, K.; Arani, A.; Reid, R.I.; Cash, D.M.; Thomas, D.L.; Zhang, H.; DeCarli, C.S.; Fox, N.C.; et al. ADNI-3 MRI PROTOCOL. Alzheimer’s Dement. 2017, 13, P104–P105. [Google Scholar] [CrossRef]
  9. Glasser, M.F.; Sotiropoulos, S.N.; Wilson, J.A.; Coalson, T.S.; Fischl, B.; Andersson, J.L.; Xu, J.; Jbabdi, S.; Webster, M.; Polimeni, J.R.; et al. The minimal preprocessing pipelines for the Human Connectome Project. Neuroimage 2013, 80, 105–124. [Google Scholar] [CrossRef]
  10. Setsompop, K.; Gagoski, B.A.; Polimeni, J.R.; Witzel, T.; Wedeen, V.J.; Wald, L.L. Blipped-controlled aliasing in parallel imaging for simultaneous multislice echo planar imaging with reduced g-factor penalty. Magn. Reson. Med. 2012, 67, 1210–1224. [Google Scholar] [CrossRef]
  11. Griswold, M.A.; Jakob, P.M.; Heidemann, R.M.; Nittka, M.; Jellus, V.; Wang, J.; Kiefer, B.; Haase, A. Generalized autocalibrating partially parallel acquisitions (GRAPPA). Magn. Reson. Med. 2002, 47, 1202–1210. [Google Scholar] [CrossRef] [PubMed]
  12. Pruessmann, K.P.; Weiger, M.; Scheidegger, M.B.; Boesiger, P. SENSE: Sensitivity encoding for fast MRI. Magn. Reson. Med. 1999, 42, 952–962. [Google Scholar] [CrossRef]
  13. Todd, N.; Moeller, S.; Auerbach, E.J.; Yacoub, E.; Flandin, G.; Weiskopf, N. Evaluation of 2D multiband EPI imaging for high-resolution, whole-brain, task-based fMRI studies at 3T: Sensitivity and slice leakage artifacts. Neuroimage 2016, 124, 32–42. [Google Scholar] [CrossRef] [PubMed]
  14. Triantafyllou, C.; Hoge, R.D.; Krueger, G.; Wiggins, C.J.; Potthast, A.; Wiggins, G.C.; Wald, L.L. Comparison of physiological noise at 1.5 T, 3 T and 7 T and optimization of fMRI acquisition parameters. NeuroImage 2005, 26, 243–250. [Google Scholar] [CrossRef]
  15. Murphy, K.; Bodurka, J.; Bandettini, P.A. How long to scan? The relationship between fMRI temporal signal to noise ratio and necessary scan duration. Neuroimage 2007, 34, 565–574. [Google Scholar] [CrossRef]
  16. Raimondo, L.; Priovoulos, N.; Passarinho, C.; Heij, J.; Knapen, T.; Dumoulin, S.O.; Siero, J.C.W.; van der Zwaag, W. Robust high spatio-temporal line-scanning fMRI in humans at 7T using multi-echo readouts, denoising and prospective motion correction. J. Neurosci. Methods 2023, 384, 109746. [Google Scholar] [CrossRef]
  17. Kuppers, F.; Yun, S.D.; Shah, N.J. Development of a novel 10-echo multi-contrast sequence based on EPIK to deliver simultaneous quantification of T(2) and T(2)(*) with application to oxygen extraction fraction. Magn. Reson. Med. 2022, 88, 1608–1623. [Google Scholar] [CrossRef]
  18. Devi, R.; Lepsien, J.; Lorenz, K.; Schlumm, T.; Mildner, T.; Moller, H.E. Multi-echo investigations of positive and negative CBF and concomitant BOLD changes. Neuroimage 2022, 263, 119661. [Google Scholar] [CrossRef]
  19. Yang, Q.; Ma, L.; Zhou, Z.; Bao, J.; Yang, Q.; Huang, H.; Cai, S.; He, H.; Chen, Z.; Zhong, J.; et al. Rapid high-fidelity T2* mapping using single-shot overlapping-echo acquisition and deep learning reconstruction. Magn. Reson. Med. 2023, 89, 2157–2170. [Google Scholar] [CrossRef]
  20. Valsamis, J.J.; Luciw, N.J.; Haq, N.; Atwi, S.; Duchesne, S.; Cameron, W.; MacIntosh, B.J. An imaging-based method of mapping multi-echo BOLD intracranial pulsatility. Magn. Reson. Med. 2023; online early view. [Google Scholar] [CrossRef]
  21. Alvand, A.; Kuruvilla-Mathew, A.; Kirk, I.J.; Roberts, R.P.; Pedersen, M.; Purdy, S.C. Altered brain network topology in children with auditory processing disorder: A resting-state multi-echo fMRI study. Neuroimage Clin. 2022, 35, 103139. [Google Scholar] [CrossRef] [PubMed]
  22. Power, J.D.; Plitt, M.; Gotts, S.J.; Kundu, P.; Voon, V.; Bandettini, P.A.; Martin, A. Ridding fMRI data of motion-related influences: Removal of signals with distinct spatial and physical bases in multiecho data. Proc. Natl. Acad. Sci. USA 2018, 115, E2105–E2114. [Google Scholar] [CrossRef] [PubMed]
  23. Dipasquale, O.; Sethi, A.; Lagana, M.M.; Baglio, F.; Baselli, G.; Kundu, P.; Harrison, N.A.; Cercignani, M. Comparing resting state fMRI de-noising approaches using multi- and single-echo acquisitions. PLoS ONE 2017, 12, e0173289. [Google Scholar] [CrossRef] [PubMed]
  24. Moia, S.; Termenon, M.; Urunuela, E.; Chen, G.; Stickland, R.C.; Bright, M.G.; Caballero-Gaudes, C. ICA-based denoising strategies in breath-hold induced cerebrovascular reactivity mapping with multi echo BOLD fMRI. Neuroimage 2021, 233, 117914. [Google Scholar] [CrossRef]
  25. Lynch, C.J.; Power, J.D.; Scult, M.A.; Dubin, M.; Gunning, F.M.; Liston, C. Rapid Precision Functional Mapping of Individuals Using Multi-Echo fMRI. Cell Rep. 2020, 33, 108540. [Google Scholar] [CrossRef] [PubMed]
  26. Foo, T.K.F.; Laskaris, E.; Vermilyea, M.; Xu, M.; Thompson, P.; Conte, G.; Van Epps, C.; Immer, C.; Lee, S.K.; Tan, E.T.; et al. Lightweight, compact, and high-performance 3T MR system for imaging the brain and extremities. Magn. Reson. Med. 2018, 80, 2232–2245. [Google Scholar] [CrossRef] [PubMed]
  27. Weavers, P.T.; Shu, Y.; Tao, S.; Huston, J., 3rd; Lee, S.K.; Graziani, D.; Mathieu, J.B.; Trzasko, J.D.; Foo, T.K.; Bernstein, M.A. Technical Note: Compact three-tesla magnetic resonance imager with high-performance gradients passes ACR image quality and acoustic noise tests. Med. Phys. 2016, 43, 1259–1264. [Google Scholar] [CrossRef]
  28. Weavers, P.T.; Tao, S.; Trzasko, J.D.; Frigo, L.M.; Shu, Y.; Frick, M.A.; Lee, S.K.; Foo, T.K.; Bernstein, M.A. B0 concomitant field compensation for MRI systems employing asymmetric transverse gradient coils. Magn. Reson. Med. 2018, 79, 1538–1544. [Google Scholar] [CrossRef]
  29. Tao, S.; Weavers, P.T.; Trzasko, J.D.; Shu, Y.; Huston, J., 3rd; Lee, S.K.; Frigo, L.M.; Bernstein, M.A. Gradient pre-emphasis to counteract first-order concomitant fields on asymmetric MRI gradient systems. Magn. Reson. Med. 2017, 77, 2250–2262. [Google Scholar] [CrossRef]
  30. Tao, S.; Trzasko, J.D.; Gunter, J.L.; Weavers, P.T.; Shu, Y.; Huston, J.; Lee, S.K.; Tan, E.T.; Bernstein, M.A. Gradient nonlinearity calibration and correction for a compact, asymmetric magnetic resonance imaging gradient system. Phys. Med. Biol. 2017, 62, N18–N31. [Google Scholar] [CrossRef]
  31. Lee, S.K.; Mathieu, J.B.; Graziani, D.; Piel, J.; Budesheim, E.; Fiveland, E.; Hardy, C.J.; Tan, E.T.; Amm, B.; Foo, T.K.; et al. Peripheral nerve stimulation characteristics of an asymmetric head-only gradient coil compatible with a high-channel-count receiver array. Magn. Reson. Med. 2016, 76, 1939–1950. [Google Scholar] [CrossRef] [PubMed]
  32. In, M.H.; Shu, Y.; Trzasko, J.D.; Yarach, U.; Kang, D.; Gray, E.M.; Huston, J.; Bernstein, M.A. Reducing PNS with minimal performance penalties via simple pulse sequence modifications on a high-performance compact 3T scanner. Phys. Med. Biol. 2020, 65, 15NT02. [Google Scholar] [CrossRef] [PubMed]
  33. Tan, E.T.; Lee, S.K.; Weavers, P.T.; Graziani, D.; Piel, J.E.; Shu, Y.; Huston, J., 3rd; Bernstein, M.A.; Foo, T.K. High slew-rate head-only gradient for improving distortion in echo planar imaging: Preliminary experience. J. Magn. Reson. Imaging 2016, 44, 653–664. [Google Scholar] [CrossRef]
  34. In, M.H.; Tan, E.T.; Trzasko, J.D.; Shu, Y.; Kang, D.; Yarach, U.; Tao, S.; Gray, E.M.; Huston, J., 3rd; Bernstein, M.A. Distortion-free imaging: A double encoding method (DIADEM) combined with multiband imaging for rapid distortion-free high-resolution diffusion imaging on a compact 3T with high-performance gradients. J. Magn. Reson. Imaging 2020, 51, 296–310. [Google Scholar] [CrossRef] [PubMed]
  35. Kang, D.; Jo, H.J.; In, M.H.; Yarach, U.; Meyer, N.K.; Bardwell Speltz, L.J.; Gray, E.M.; Trzasko, J.D.; Huston, J., III; Bernstein, M.A.; et al. The benefit of high-performance gradients on echo planar imaging for BOLD-based resting-state functional MRI. Phys. Med. Biol. 2020, 65, 235024. [Google Scholar] [CrossRef] [PubMed]
  36. Chen, N.K.; Oshio, K.; Panych, L.P. Improved image reconstruction for partial Fourier gradient-echo echo-planar imaging (EPI). Magn. Reson. Med. 2008, 59, 916–924. [Google Scholar] [CrossRef] [PubMed]
  37. Cohen, A.D.; Yang, B.; Fernandez, B.; Banerjee, S.; Wang, Y. Improved resting state functional connectivity sensitivity and reproducibility using a multiband multi-echo acquisition. Neuroimage 2021, 225, 117461. [Google Scholar] [CrossRef]
  38. Heunis, S.; Breeuwer, M.; Caballero-Gaudes, C.; Hellrung, L.; Huijbers, W.; Jansen, J.F.; Lamerichs, R.; Zinger, S.; Aldenkamp, A.P. The effects of multi-echo fMRI combination and rapid T2*-mapping on offline and real-time BOLD sensitivity. Neuroimage 2021, 238, 118244. [Google Scholar] [CrossRef]
  39. Fernandez, B.; Leuchs, L.; Samann, P.G.; Czisch, M.; Spoormaker, V.I. Multi-echo EPI of human fear conditioning reveals improved BOLD detection in ventromedial prefrontal cortex. Neuroimage 2017, 156, 65–77. [Google Scholar] [CrossRef]
  40. Lynch, C.J.; Elbau, I.; Liston, C. Improving precision functional mapping routines with multi-echo fMRI. Curr. Opin. Behav. Sci. 2021, 40, 113–119. [Google Scholar] [CrossRef]
  41. Cox, R.W. AFNI: Software for analysis and visualization of functional magnetic resonance neuroimages. Comput Biomed. Res. 1996, 29, 162–173. [Google Scholar] [CrossRef] [PubMed]
  42. Glover, G.H.; Li, T.Q.; Ress, D. Image-based method for retrospective correction of physiological motion effects in fMRI: RETROICOR. Magn. Reson. Med. 2000, 44, 162–167. [Google Scholar] [CrossRef] [PubMed]
  43. Birn, R.M.; Smith, M.A.; Jones, T.B.; Bandettini, P.A. The respiration response function: The temporal dynamics of fMRI signal fluctuations related to changes in respiration. Neuroimage 2008, 40, 644–654. [Google Scholar] [CrossRef] [PubMed]
  44. Jo, H.J.; Saad, Z.S.; Simmons, W.K.; Milbury, L.A.; Cox, R.W. Mapping sources of correlation in resting state FMRI, with artifact detection and removal. Neuroimage 2010, 52, 571–582. [Google Scholar] [CrossRef]
  45. Jo, H.J.; Gotts, S.J.; Reynolds, R.C.; Bandettini, P.A.; Martin, A.; Cox, R.W.; Saad, Z.S. Effective Preprocessing Procedures Virtually Eliminate Distance-Dependent Motion Artifacts in Resting State FMRI. J. Appl. Math. 2013, 2013, 935154. [Google Scholar] [CrossRef]
  46. Jo, H.J.; Reynolds, R.C.; Gotts, S.J.; Handwerker, D.A.; Balzekas, I.; Martin, A.; Cox, R.W.; Bandettini, P.A. Fast detection and reduction of local transient artifacts in resting-state fMRI. Comput. Biol. Med. 2020, 120, 103742. [Google Scholar] [CrossRef]
  47. Posse, S.; Wiese, S.; Gembris, D.; Mathiak, K.; Kessler, C.; Grosse-Ruyken, M.L.; Elghahwagi, B.; Richards, T.; Dager, S.R.; Kiselev, V.G. Enhancement of BOLD-contrast sensitivity by single-shot multi-echo functional MR imaging. Magn. Reson. Med. 1999, 42, 87–97. [Google Scholar] [CrossRef]
  48. Cho, J.W.; Korchmaros, A.; Vogelstein, J.T.; Milham, M.P.; Xu, T. Impact of concatenating fMRI data on reliability for functional connectomics. Neuroimage 2021, 226, 117549. [Google Scholar] [CrossRef]
  49. Welvaert, M.; Rosseel, Y. On the definition of signal-to-noise ratio and contrast-to-noise ratio for FMRI data. PLoS ONE 2013, 8, e77089. [Google Scholar] [CrossRef]
  50. Saad, Z.S.; Reynolds, R.C.; Argall, B.; Japee, S.; Cox, R.W. SUMA: An interface for surface-based intra- and inter-subject analysis with AFNI. In Proceedings of the 2004 2nd IEEE International Symposium on Biomedical Imaging: Macro to Nano, Arlington, VA, USA, 18 April 2004; Volume 2, pp. 1510–1513. [Google Scholar]
  51. Reuter, M.; Schmansky, N.J.; Rosas, H.D.; Fischl, B. Within-subject template estimation for unbiased longitudinal image analysis. Neuroimage 2012, 61, 1402–1418. [Google Scholar] [CrossRef]
  52. Destrieux, C.; Fischl, B.; Dale, A.; Halgren, E. Automatic parcellation of human cortical gyri and sulci using standard anatomical nomenclature. Neuroimage 2010, 53, 1–15. [Google Scholar] [CrossRef] [PubMed]
  53. Rolls, E.T.; Huang, C.C.; Lin, C.P.; Feng, J.; Joliot, M. Automated anatomical labelling atlas 3. Neuroimage 2020, 206, 116189. [Google Scholar] [CrossRef] [PubMed]
  54. Kundu, P.; Inati, S.J.; Evans, J.W.; Luh, W.-M.M.; Bandettini, P.A. Differentiating BOLD and non-BOLD signals in fMRI time series using multi-echo EPI. NeuroImage 2012, 60, 1759–1770. [Google Scholar] [CrossRef] [PubMed]
  55. Cohen, A.D.; Nencka, A.S.; Lebel, R.M.; Wang, Y. Multiband multi-echo imaging of simultaneous oxygenation and flow timeseries for resting state connectivity. PLoS ONE 2017, 12, e0169253. [Google Scholar] [CrossRef] [PubMed]
  56. Saad, Z.S.; Reynolds, R.C.; Jo, H.J.; Gotts, S.J.; Chen, G.; Martin, A.; Cox, R.W. Correcting brain-wide correlation differences in resting-state FMRI. Brain Connect 2013, 3, 339–352. [Google Scholar] [CrossRef] [PubMed]
  57. Beckmann, C.F.; DeLuca, M.; Devlin, J.T.; Smith, S.M. Investigations into resting-state connectivity using independent component analysis. Philos. Trans. R. Soc. B Biol. Sci. 2005, 360, 1001–1013. [Google Scholar] [CrossRef] [PubMed]
  58. Nickerson, L.D.; Smith, S.M.; Ongur, D.; Beckmann, C.F. Using Dual Regression to Investigate Network Shape and Amplitude in Functional Connectivity Analyses. Front Neurosci. 2017, 11, 115. [Google Scholar] [CrossRef] [PubMed]
  59. Jenkinson, M.; Beckmann, C.F.; Behrens, T.E.; Woolrich, M.W.; Smith, S.M. FSL. Neuroimage 2012, 62, 782–790. [Google Scholar] [CrossRef]
  60. Beckmann, C.F.; Mackay, C.E.; Filippini, N.; Smith, S.M. Group comparison of resting-state FMRI data using multi-subject ICA and dual regression. Neuroimage 2009, 47, S148. [Google Scholar] [CrossRef]
  61. Power, J.D.; Barnes, K.A.; Snyder, A.Z.; Schlaggar, B.L.; Petersen, S.E. Spurious but systematic correlations in functional connectivity MRI networks arise from subject motion. Neuroimage 2012, 59, 2142–2154. [Google Scholar] [CrossRef]
  62. Xia, M.; Wang, J.; He, Y. BrainNet Viewer: A network visualization tool for human brain connectomics. PLoS ONE 2013, 8, e68910. [Google Scholar] [CrossRef] [PubMed]
  63. Foo, T.K.F.; Tan, E.T.; Vermilyea, M.E.; Hua, Y.H.; Fiveland, E.W.; Piel, J.E.; Park, K.; Ricci, J.; Thompson, P.S.; Graziani, D.; et al. Highly efficient head-only magnetic field insert gradient coil for achieving simultaneous high gradient amplitude and slew rate at 3.0T (MAGNUS) for brain microstructure imaging. Magn. Reson. Med. 2020, 83, 2356–2369. [Google Scholar] [CrossRef] [PubMed]
  64. Huang, S.Y.; Witzel, T.; Keil, B.; Scholz, A.; Davids, M.; Dietz, P.; Rummert, E.; Ramb, R.; Kirsch, J.E.; Yendiki, A.; et al. Connectome 2.0: Developing the next-generation ultra-high gradient strength human MRI scanner for bridging studies of the micro-, meso- and macro-connectome. Neuroimage 2021, 243, 118530. [Google Scholar] [CrossRef] [PubMed]
  65. Peters, A.M.; Brookes, M.J.; Hoogenraad, F.G.; Gowland, P.a.; Francis, S.T.; Morris, P.G.; Bowtell, R. T2* measurements in human brain at 1.5, 3 and 7 T. Magn. Reson. Imaging 2007, 25, 748–753. [Google Scholar] [CrossRef]
  66. Li, M.; Newton, A.T.; Anderson, A.W.; Ding, Z.; Gore, J.C. Characterization of the hemodynamic response function in white matter tracts for event-related fMRI. Nat. Commun. 2019, 10, 1140. [Google Scholar] [CrossRef]
  67. Deichmann, R.; Josephs, O.; Hutton, C.; Corfield, D.R.; Turner, R. Compensation of susceptibility-induced BOLD sensitivity losses in echo-planar fMRI imaging. Neuroimage 2002, 15, 120–135. [Google Scholar] [CrossRef]
  68. Constable, R.T.; Spencer, D.D. Composite image formation in z-shimmed functional MR imaging. Magn. Reson. Med. 1999, 42, 110–117. [Google Scholar] [CrossRef]
  69. Pruim, R.H.R.; Mennes, M.; van Rooij, D.; Llera, A.; Buitelaar, J.K.; Beckmann, C.F. ICA-AROMA: A robust ICA-based strategy for removing motion artifacts from fMRI data. Neuroimage 2015, 112, 267–277. [Google Scholar] [CrossRef]
  70. Kundu, P.; Voon, V.; Balchandani, P.; Lombardo, M.V.; Poser, B.A.; Bandettini, P.A. Multi-echo fMRI: A review of applications in fMRI denoising and analysis of BOLD signals. Neuroimage 2017, 154, 59–80. [Google Scholar] [CrossRef]
  71. Gonzalez-Castillo, J.; Panwar, P.; Buchanan, L.C.; Caballero-Gaudes, C.; Handwerker, D.A.; Jangraw, D.C.; Zachariou, V.; Inati, S.; Roopchansingh, V.; Derbyshire, J.A.; et al. Evaluation of multi-echo ICA denoising for task based fMRI studies: Block designs, rapid event-related designs, and cardiac-gated fMRI. Neuroimage 2016, 141, 452–468. [Google Scholar] [CrossRef]
  72. Birn, R.M.; Molloy, E.K.; Patriat, R.; Parker, T.; Meier, T.B.; Kirk, G.R.; Nair, V.A.; Meyerand, M.E.; Prabhakaran, V. The effect of scan length on the reliability of resting-state fMRI connectivity estimates. Neuroimage 2013, 83, 550–558. [Google Scholar] [CrossRef] [PubMed]
  73. Shah, L.M.; Cramer, J.A.; Ferguson, M.A.; Birn, R.M.; Anderson, J.S. Reliability and reproducibility of individual differences in functional connectivity acquired during task and resting state. Brain Behav. 2016, 6, e00456. [Google Scholar] [CrossRef] [PubMed]
  74. Kang, D.; In, M.-H.; Gray, E.; Foo, T.K.; Madhavan, R.; Meyer, N.K.; Bardwell-Speltz, L.J.; Ahmed, Z.; Gunter, J.; Fernandez, B.; et al. Potential Benefit of Multiband Multiecho EPI for Resting-state Functional MRI in Alzheimer’s disease on a compact 3T system: A Preliminary study. In Proceedings of the International Society for Magnetic Resonance in Medicine, Online, 15–20 May 2021; p. 1514. [Google Scholar]
  75. Gilmore, A.W.; Agron, A.M.; Gonzalez-Araya, E.I.; Gotts, S.J.; Martin, A. A Comparison of Single- and Multi-Echo Processing of Functional MRI Data During Overt Autobiographical Recall. Front. Neurosci. 2022, 16, 854387. [Google Scholar] [CrossRef] [PubMed]
  76. Bilgic, B.; Setsompop, K.; Cohen-Adad, J.; Wedeen, V.; Wald, L.L.; Adalsteinsson, E. Accelerated diffusion spectrum imaging with compressed sensing using adaptive dictionaries. Med. Image Comput Comput Assist Interv. 2012, 15, 1–9. [Google Scholar] [CrossRef] [PubMed]
  77. Polak, D.; Setsompop, K.; Cauley, S.F.; Gagoski, B.A.; Bhat, H.; Maier, F.; Bachert, P.; Wald, L.L.; Bilgic, B. Wave-CAIPI for highly accelerated MP-RAGE imaging. Magn. Reson. Med. 2018, 79, 401–406. [Google Scholar] [CrossRef]
Figure 1. (A) The explained variance (R2) maps for each regressor or echo combination of a single subject with ME and OE datasets. The R2 maps are derived by regressions related with eroded local white matter (WMe), six rigid-body motion parameter estimates (Motion), eroded four large ventricles (CSFe), and recorded respiration and cardiac pulsation (Physio) and by T2*-weighted echo combination (Combine). The total effect on R2 map by all regressions and echo combination is given (Full). The T1-weighted anatomical images with the corresponding locations are also shown at left. (B) Average R2 of each regressor or echo combination were plotted for ME and OE datasets across gray and white matters of subjects. Note that average R2 of OE datasets has a different scale on the right side of the plot. Additionally, (C) SNR and TSNRs of ME and OE datasets are present. TSNR0 denotes TNSR evaluated without regression. (D) Root mean square of correlation coefficients between regressors and noises removed by echo combination to assess the dependence between time series of artifacts/noises removed. Through plots (B,C), error bars denote global means and standard deviations for voxels of gray and white matter across the corresponding datasets.
Sensors 23 04329 g001aSensors 23 04329 g001b
Figure 2. T1-weighted anatomical image and three echo time EPI images obtained on compact 3T. Echo combined EPI image shows signal intensity recovery in brain regions which suffers from signal dropout in single-echo EPI images as indicated. The yellow arrows indicate brain regions suffering from signal dropout with high magnetic susceptibility in EPI images.
Sensors 23 04329 g002
Figure 3. Cortical coverage ratio and functional connectivity. Cortical coverage ratio viewed on surface model. The cortical coverage was estimated by converting intensity-clipped images of (A) OE and (B) T2*-weighted echo-combined ME-EPI images onto a surface template. Cortical coverage ratio in frontal and temporal brain regions was dramatically improved with the multi-echo combination. (C) Functional connectivity between 168 ROIs defined in individual anatomical images were examined. Through the comparison between OE and ME group-level functional connectivity, the numbers of significantly different FCs on each ROI were evaluated. The indicated regions in (B,C) shows differences both in functional connectivity and cortical coverage ratio, which are left and right medial orbital sulci (olfactory sulci) and anterior transverse collateral sulci. The functional connections from the four regions are visualized by BrainNet Viewer with (D) OE and (E) ME datasets.
Sensors 23 04329 g003
Figure 4. (A) Group-level seed-based functional connectivity of OE and ME datasets with 9-min-length datasets. Seed regions are precentral gyrus (PCG), insula (Ins), posterior cingulate cortex (PCC), hippocampus (Hipp), and anterior cingulate cortex (ACC) of left/right hemispheres (as a prefix of L_/R_) defined in AAL3v1 on MNI template. In visual inspection, the FC maps of ME group were compatible to those of OE group with seeds of PCG, Ins, and PCG and superior with seeds of Hipp and ACC to show additional FC clusters as indicated. The FC maps used in the analysis were thresholded with |Fisher(r)| > 0.3 after the statistical threshold of FDR-corrected p < 0.001. (B) Quantitative comparison of FC extents in the seed-based functional connectivity with 9-min-length datasets. The FC extents were calculated based on the group-level FC maps with statistical and functional thresholds. The number on each bar for ME-EPI shows the relative difference of FC extent between ME and OE. Note that Fisher(r) denoted Fisher-transformed Pearson correlation coefficient.
Sensors 23 04329 g004aSensors 23 04329 g004b
Figure 5. (A) Group-level ICA-derived brain networks of single- and multi-echo datasets with 9-min-length datasets. Dual regression and permutation testing (N = 5000) were performed to evaluate individual- and group-level IC maps, respectively. (B) Sensitivity, false positive rate, and accuracy were evaluated with single- and multi-echo datasets in ICA-derived brain networks. Eight IC maps obtained from Concat-ICA were assumed as ground truth for the representative brain networks. The single- and multi-echo group-level IC maps like (A) were calculated with a variety of scan times and were compared to the ground truth IC maps. Mean and standard deviation of the three metrics (columns) were evaluated across the eight brain networks on each scan time length. Abbreviations. DMN: default mode network, LOcc: lateral visual areas, MVis: medial visual areas, RFPN and LFPN: right and left frontal-parietal networks, respectively, Aud: auditory network, ECN: executive control network, and Sens: sensorimotor network.
Sensors 23 04329 g005
Figure 6. Potentials of the compact 3T scanner in multi-echo EPI imaging parameters (three echo times, repetition time, echo spacing and inter-TE duration) determined by isotropic voxel sizes. For a comparison, the imaging parameters available on conventional 3T scanner were given. In this study, spatial resolution was chosen to 2.4 mm with a repetition time less than 1 s.
Sensors 23 04329 g006
Table 1. Details of imaging parameters for single- and multi-echo EPI acquisitions.
Imaging ParameterSingle-Echo EPIMulti-Echo EPI
Field of view (FOV, mm)224 × 224
Matrix size94 × 94
In-plane resolution (mm)2.38 × 2.38
k-space partial Fourier factorNo partial Fourier
Slice thickness (mm)2.4
Number of slices52
Inter-slice gap (mm)0.3
Inferior-to-superior coverage (mm)140.4
In-plane acceleration factor2
Multi-band factor4
Echo spacing (µs)352
Receiver bandwidth (Hz)±250 k
Echo time (TE, ms)3011.9, 29.8, 47.8
Repetition time (TR, ms)700940
RF flip angle (FA, °) 15259
Number of volumes per scan961320
Scan duration (mm:ss)11:125:00
Note-Scan twice
1 FAs were applied based on the calculated Ernst angles assuming T1 of 1.4 s in gray matter at 3T.
Disclaimer/Publisher’s Note: The statements, opinions and data contained in all publications are solely those of the individual author(s) and contributor(s) and not of MDPI and/or the editor(s). MDPI and/or the editor(s) disclaim responsibility for any injury to people or property resulting from any ideas, methods, instructions or products referred to in the content.

