1. Introduction
Forensic photography is essential for and is a major part of crime and accident scene investigations, as well as in many evidence investigation and documentation steps in forensic labs. It is used for collecting and registering relevant information, for maintaining a chain of evidence, and for transferring all kinds of information to parties in the criminal justice system [
1,
2,
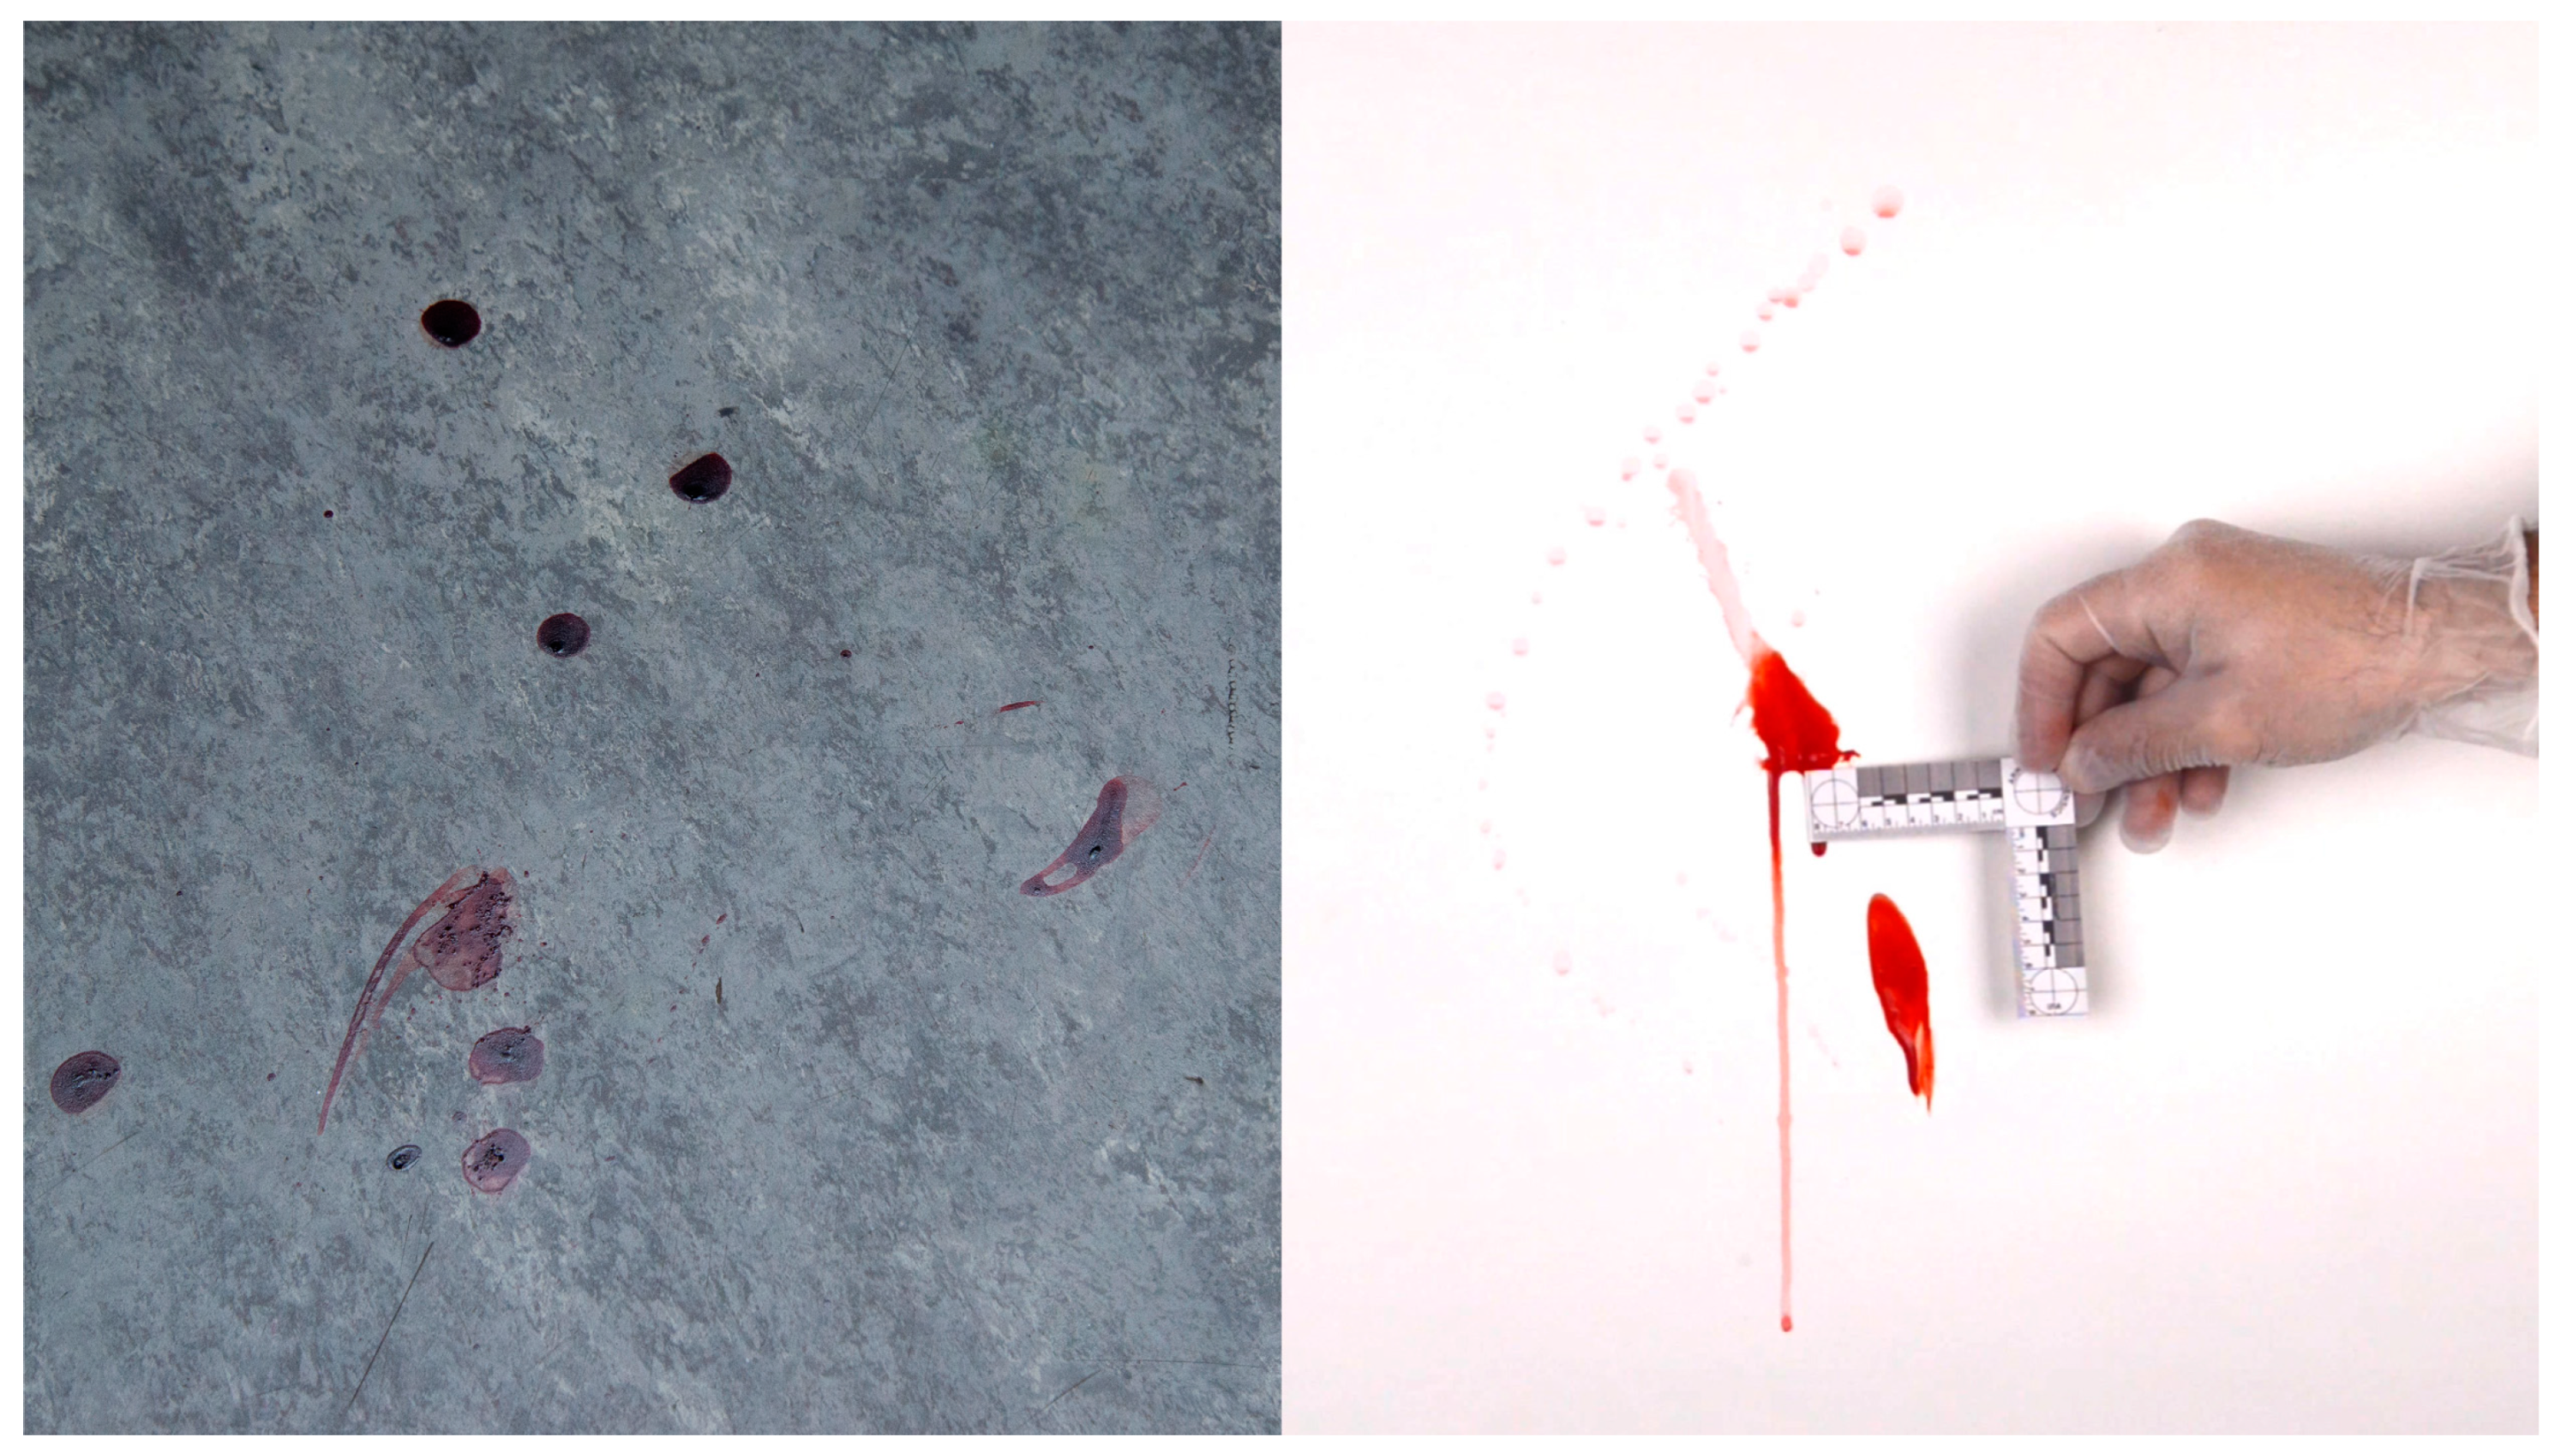
3]. It is often hard, or even impossible, to tell a scale from a photograph, such as with a blood stain on a plastered wall, or a shoeprint on a plain floor (
Figure 1 left). Therefore, it is common practice to place a physical size reference, such as a ruler or reference sticker, next to details, objects or traces of which the size might be relevant [
4,
5]. With the use of such references, the real-world dimensions of objects can be determined from just a photograph.
Although the use of size references is often an absolute necessity, there are several drawbacks to having to place them physically [
2,
4,
5]. An investigator will have to stand close to the evidence, often having to step over other traces or objects, which takes time and introduces risks of disturbing the scene. Any rulers may subsequently be placed at different locations, requiring the rulers to be cleaned before each move to avoid contamination. When photographing traces on vertical surfaces (e.g., on walls) or the underside of a surface (e.g., on ceilings or under tables), one may have to first climb up to a trace to place reference stickers, work in difficult poses, or may have to ask a colleague to hold up the size reference while the photo is being taken (
Figure 1 right).
Eliminating the need for physical size references would achieve the following:
Reduce risks of evidence disturbance and contamination;
Reduce the time needed for investigating crime or accident scenes and for processing evidence in the lab;
Reduce the required manpower for investigating crime or accident scenes;
Potentially reduce the financial cost of evidence processing and crime or accident scene investigations.
Once a photo has been taken with a physical size reference, performing any measurements on the photo requires several manual user actions, which may be prone to errors. The dimensions of the size reference must be determined (in pixels for digital photos and in mm for hard copies) to obtain a scaling factor that can be used to translate the dimensions of the object or trace of interest in the photo to its real-world dimensions. This process is rather laborious and measurement accuracy is highly sensitive to perspective effects and to deviations from orthogonal viewpoints [
3,
4,
5]. Therefore, investigators often struggle at crime scenes to find a pose or position from which an item and the size reference can be orthogonally photographed. This introduces further delays, scene disturbance and contamination risks.
In order to facilitate, increase the safety of, and speed up placing and using size references in evidence photography, an automated size reference projection and processing system was developed. The system, named “FreeRef-1”, was developed by the authors in collaboration between a technical university and a national forensic institute (see authors’ affiliations), and with support from the national police of the same country. In order for this system to be suitable for forensic use, it should, besides complying to usability and safety requirements, above all provide a robust and reliable size reference. Therefore, the aim of the current work was to present the FreeRef-1 system and to assess its measurement accuracy in a broad range of situations relevant in forensic practice at crime or accident scenes and in laboratories.
3. Results
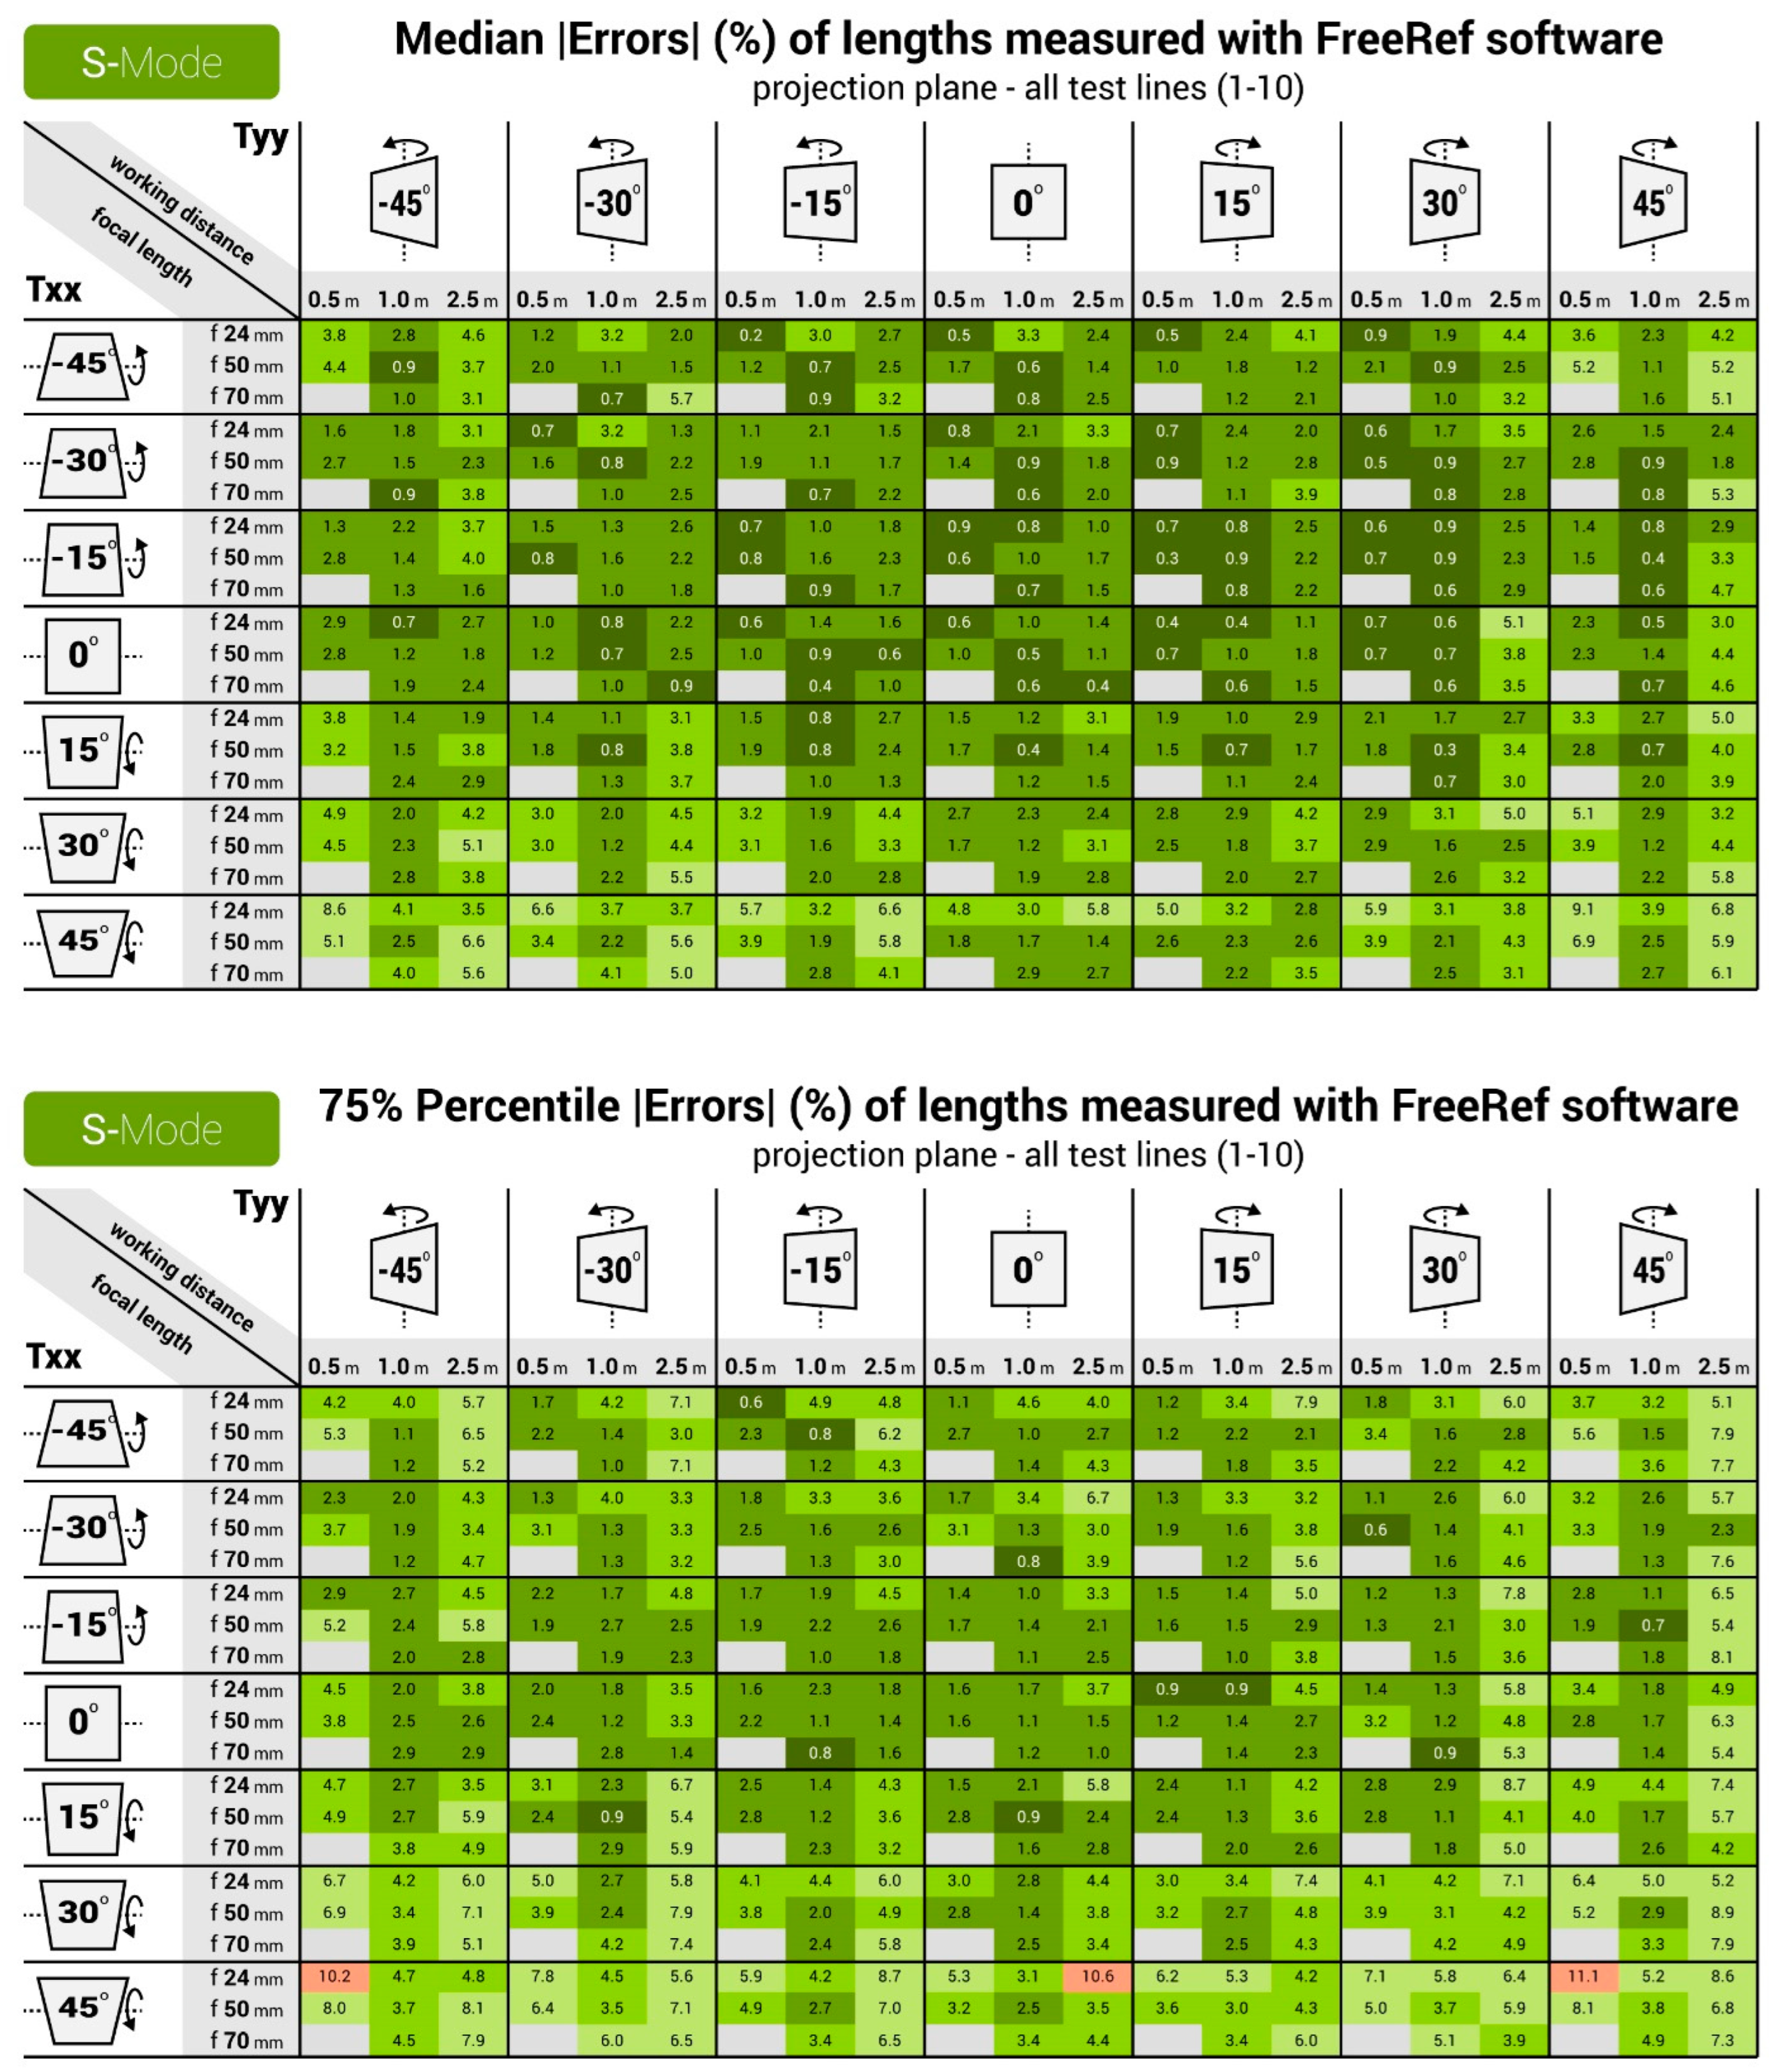
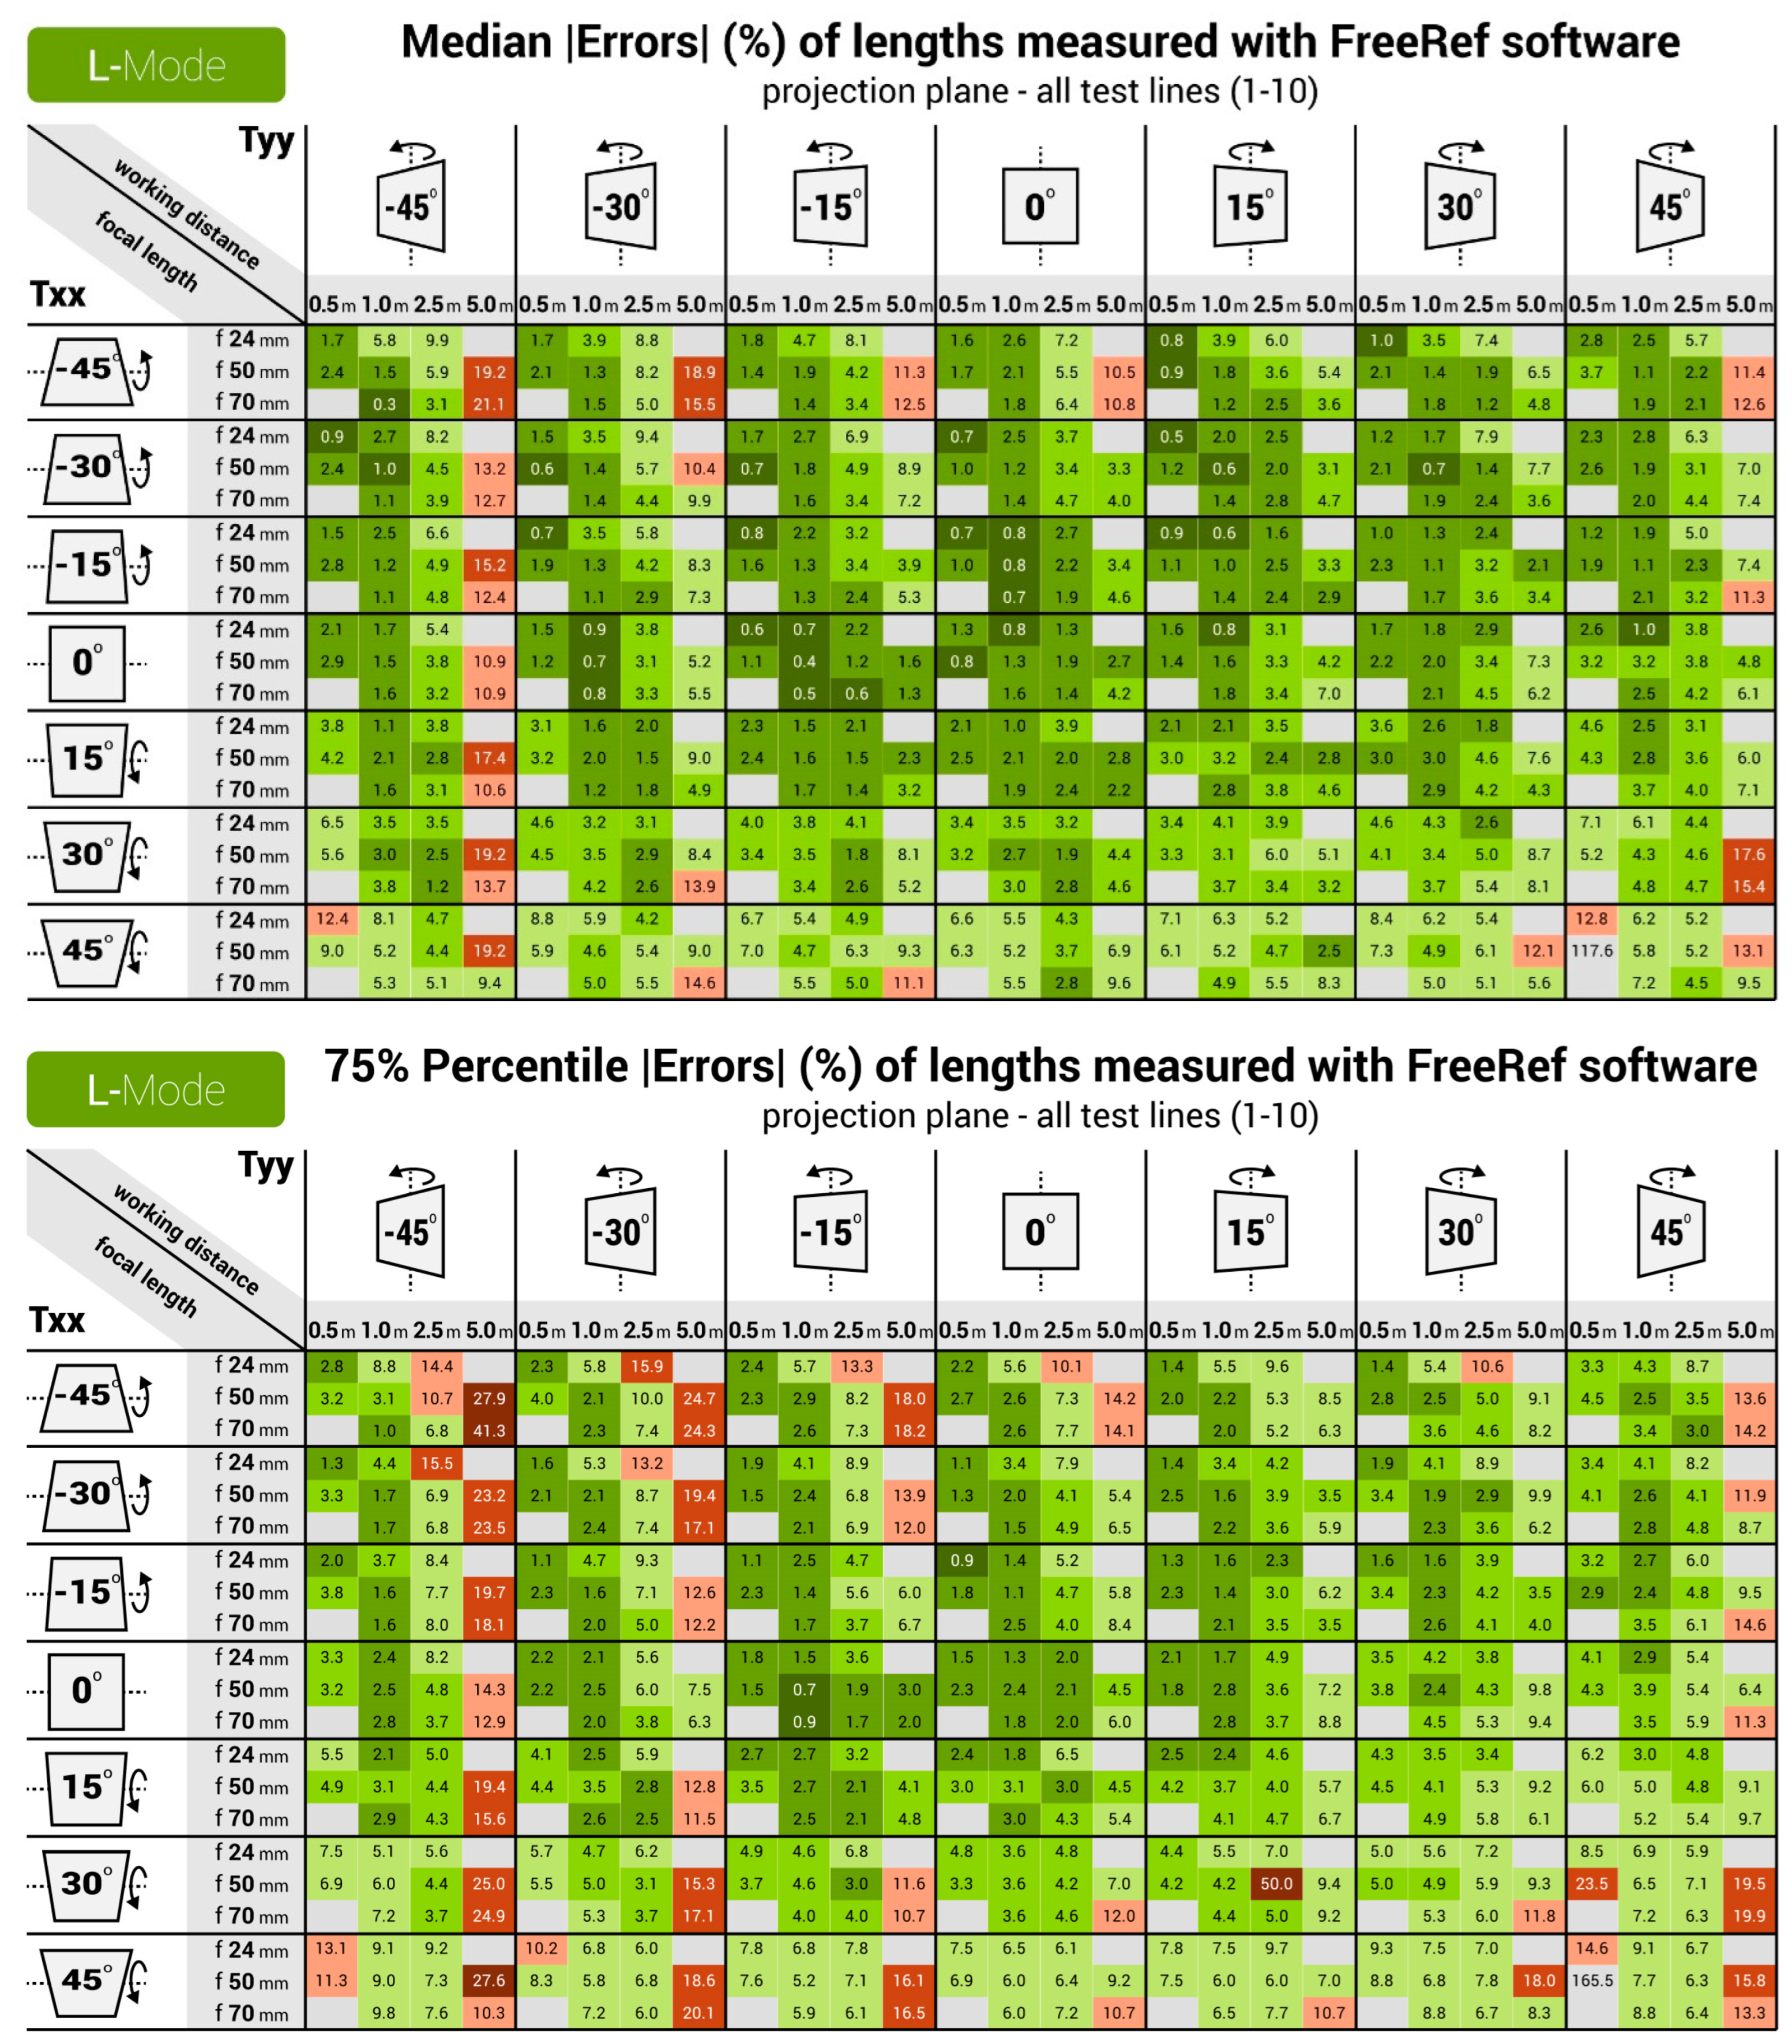
Figure 10 and
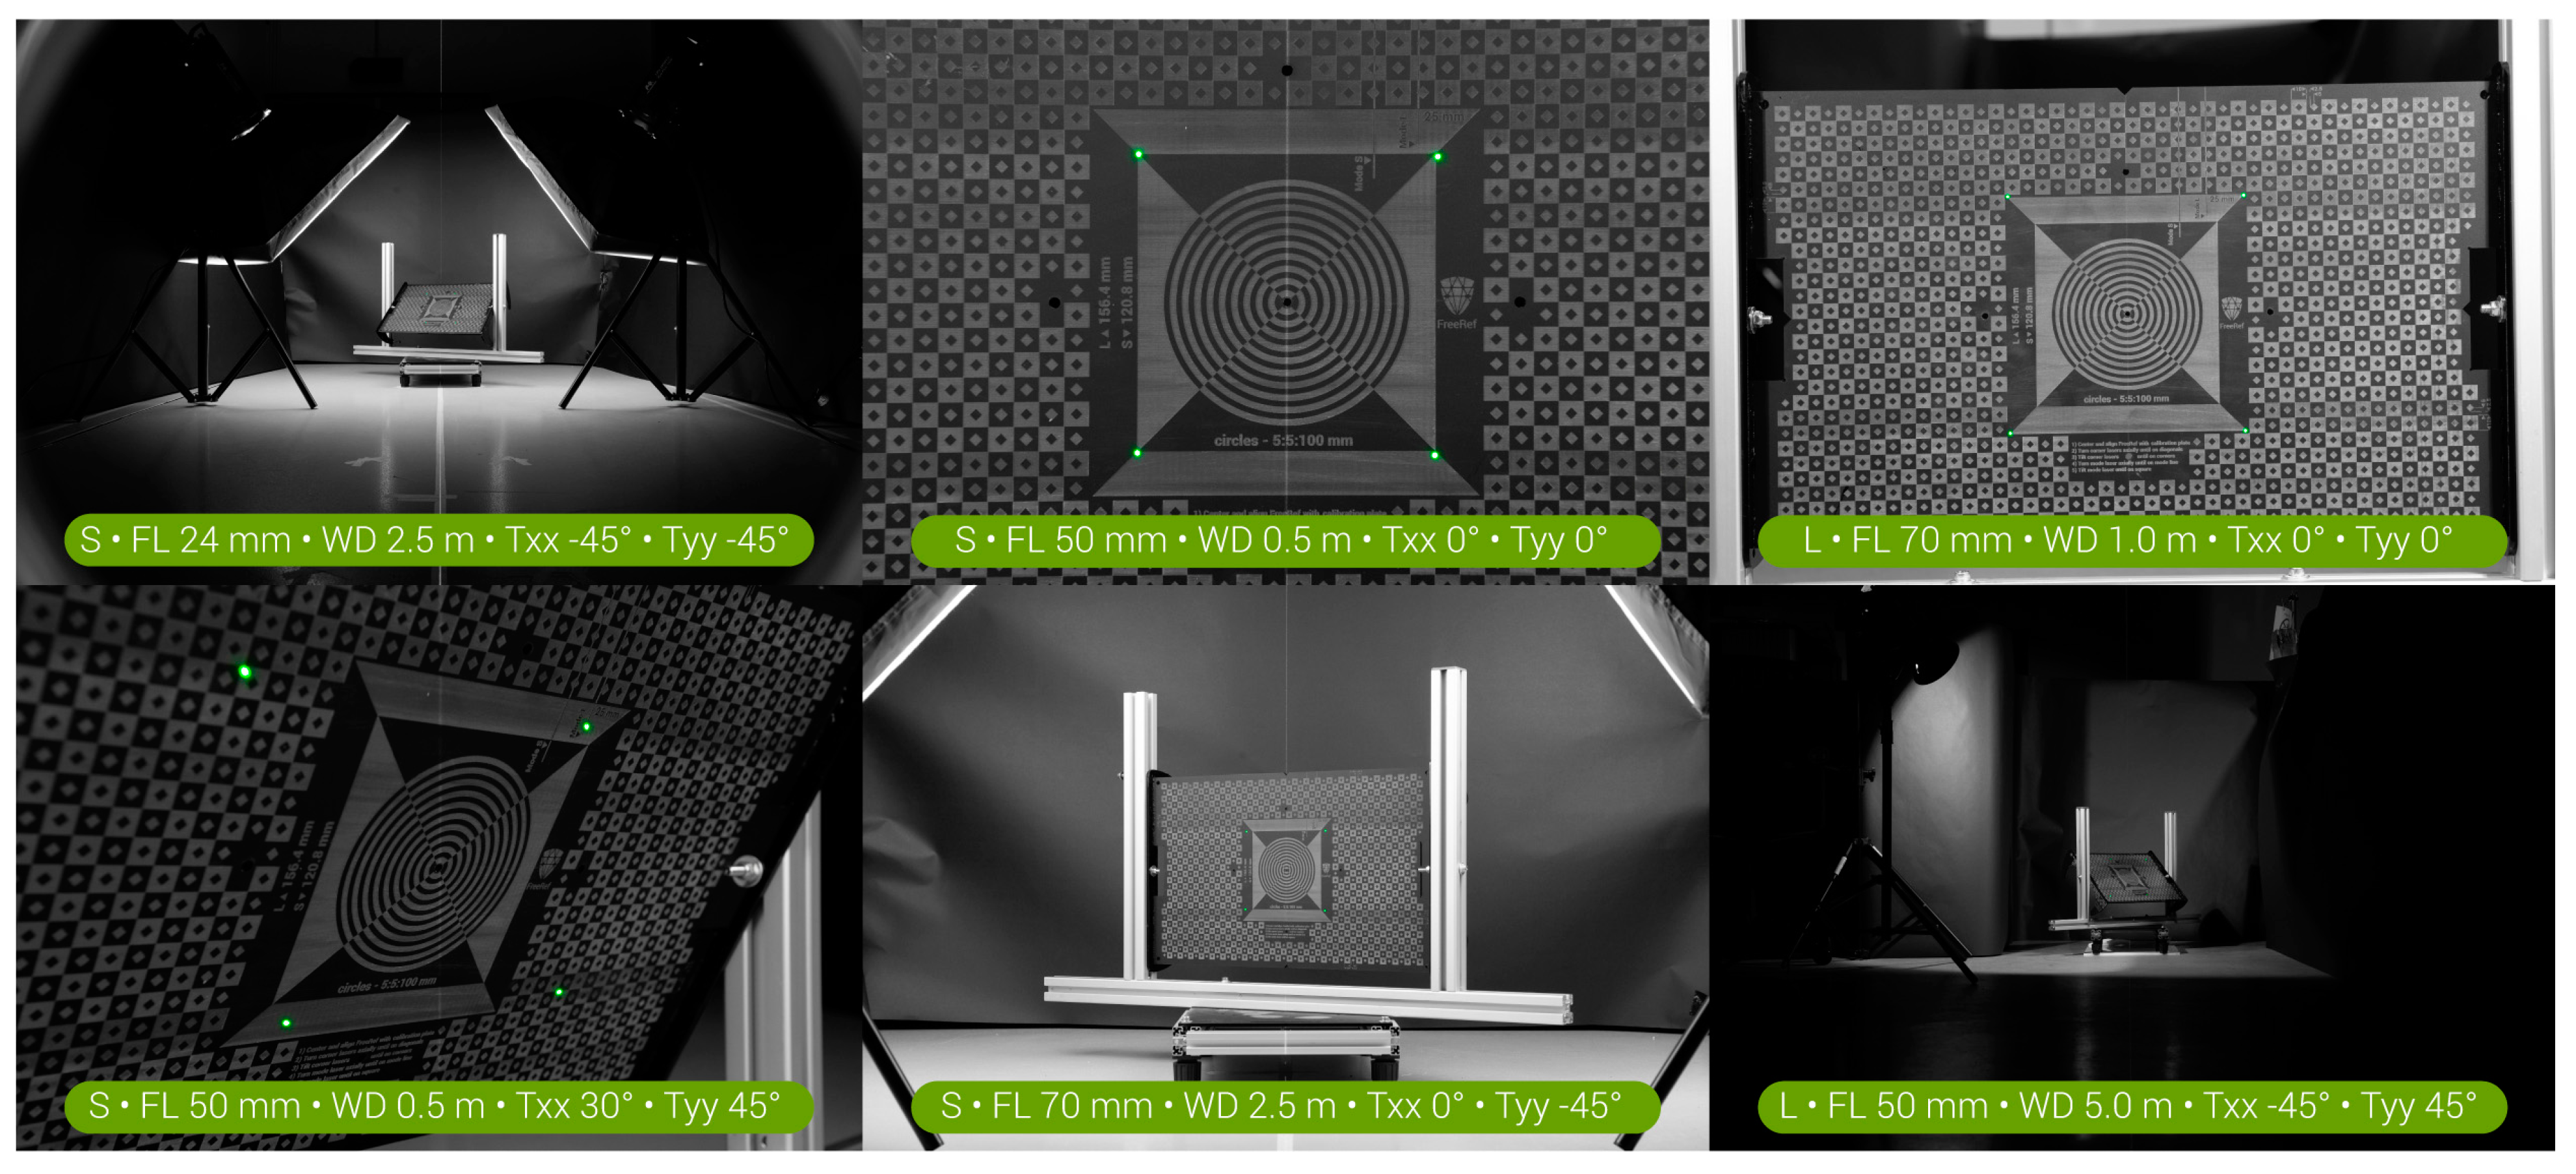
Figure 11 show the median and 75% quartile absolute percentage measurement errors for the S- and L-mode photographs. For the S-mode, all of the medians and the vast majority of the 75% quartile values are below the 5% absolute measurement error. The largest measurement errors were found for extreme values of Txx and Tyy, in particular when combined with a large working distance. For the L-mode, the accuracy turned out slightly lower than for the S-mode. It turned out that the FreeRef-1 projector L-mode calibration was slightly incorrect because the calibration plate holder was not fully leveled, as can be observed in the top right photo in
Figure 7. As a result, the rotation angle detection performed slightly worse than for the S-mode photos. This underlines the necessity of designing a projector that is always properly mounted. In general, the L-mode still had median errors that were mostly under 5% for all situations, except for the 5.0 m working distance. At this distance, the perspective effects and sizes of the laser dots with respect to the image resolution were simply too small (see bottom right photo in
Figure 7) to provide accurate rotation angle calculations at the largest tested rotations Txx and Tyy. There was one extreme outlier in the L-mode photos (focal length 50 mm, working distance 0.5 m, Txx and Tyy both 45°), with a median percentage absolute error of 117.6%. This was not due to the assistant errors or flaws in the measurement algorithm, but was caused by the software failing to detect the correct four laser dots. Due to this, Rxx and Ryy were incorrectly calculated, which affected all other outcomes. Although this data point could have been removed as an outlier, we decided to include it to illustrate the importance of correctly detecting the laser dots. All measurement data and the R-code used for analysis are provided in [
6].
For the S- and the L-mode, the ANOVA test showed significant effects (all with p < 0.001) on the percentage absolute measurement error of the working distance, Txx and Tyy. For the L-mode, this was also the case for the focal length. Furthermore, there were interaction effects (all with p < 0.001) of working distance with Txx and with Tyy for the S- and L-mode, and of focal length with Tyy for the S-mode.
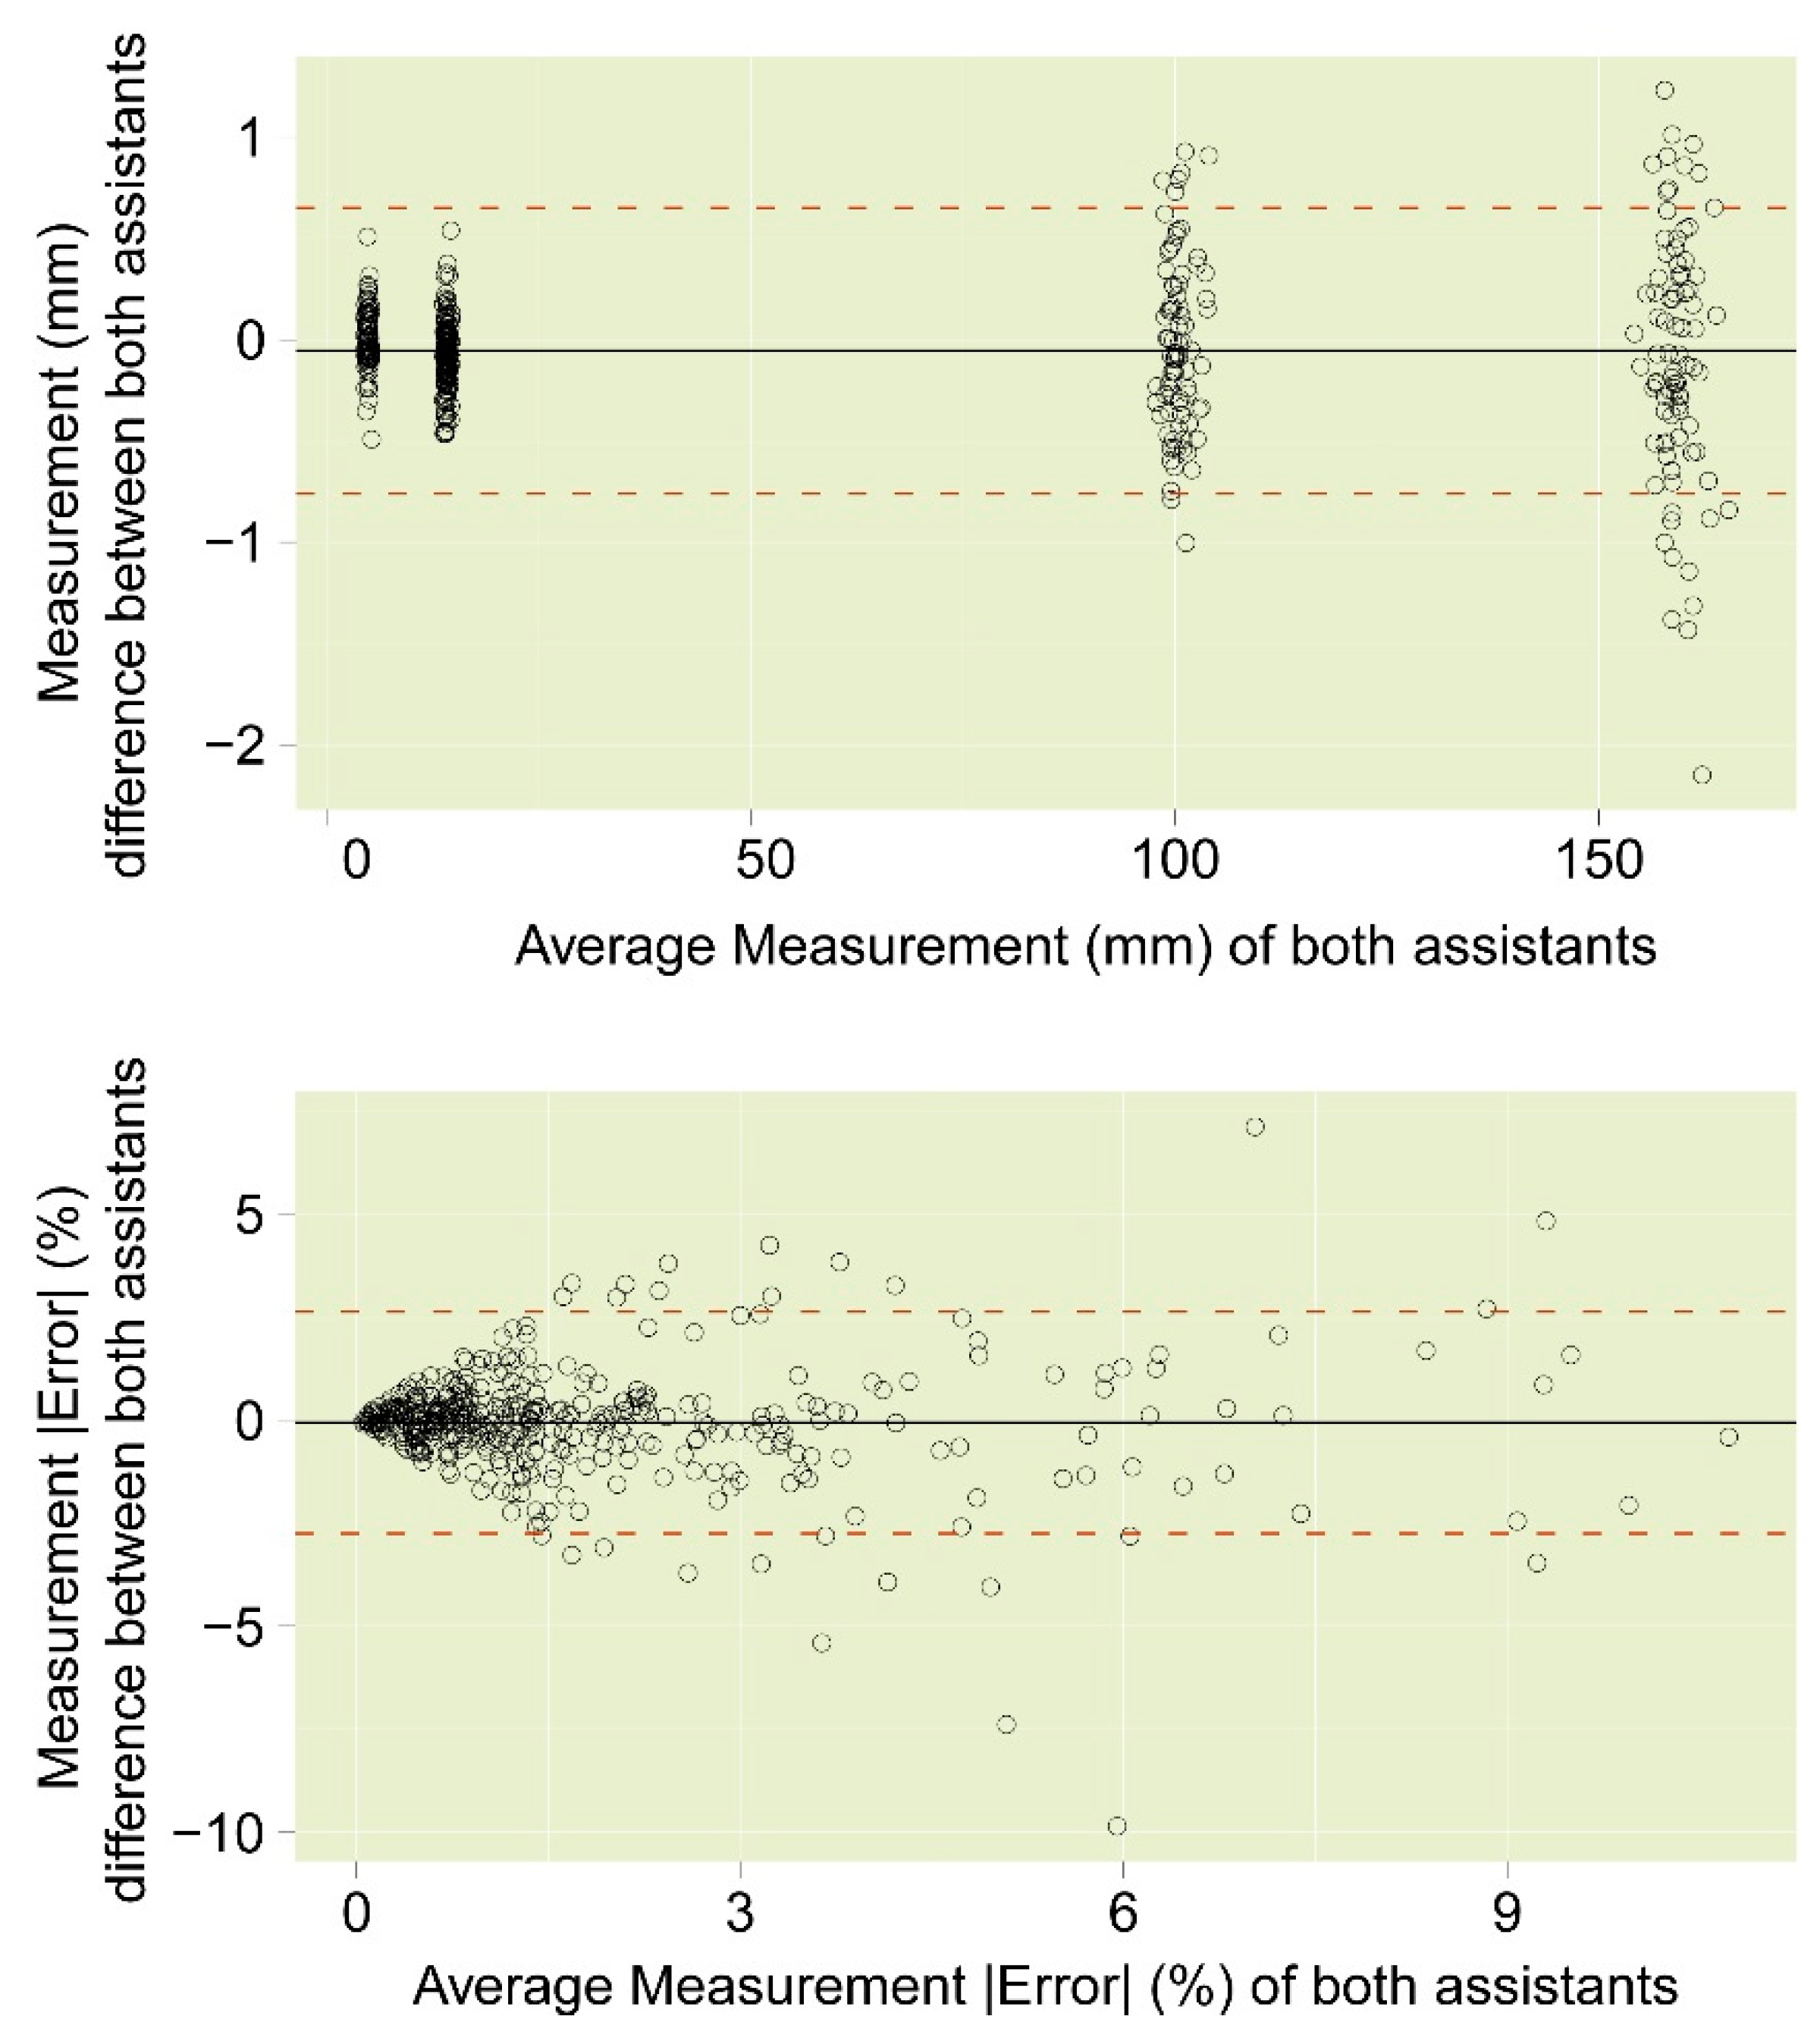
The inter-assistant t-test did not show any statistically significant differences between the two assistants (
p = 0.32). The Bland–Altman plots (
Figure 12) showed strong agreement between the two assistants. The largest absolute differences between the two assistants were between 1 and 2 mm, and were only found for the largest lengths of 160 mm. In terms of absolute percentage measurement errors, the inter-observer differences were in general not larger than about 2%.
4. Discussion
The FreeRef-1 measurement errors are generally only a few percent, including the user error. From near to far and from straight to 45° dual-angled photographs, the FreeRef-1 accuracy was shown to be well within the limits of practical forensic use in lab conditions. Furthermore, the inter-assistant tests showed that inter-assistant variations amounted for measurement percentage errors of the same order of magnitude as the verification results in general. This suggests that the measurement errors mainly originate from user inaccuracies and not from inaccuracies in the system itself.
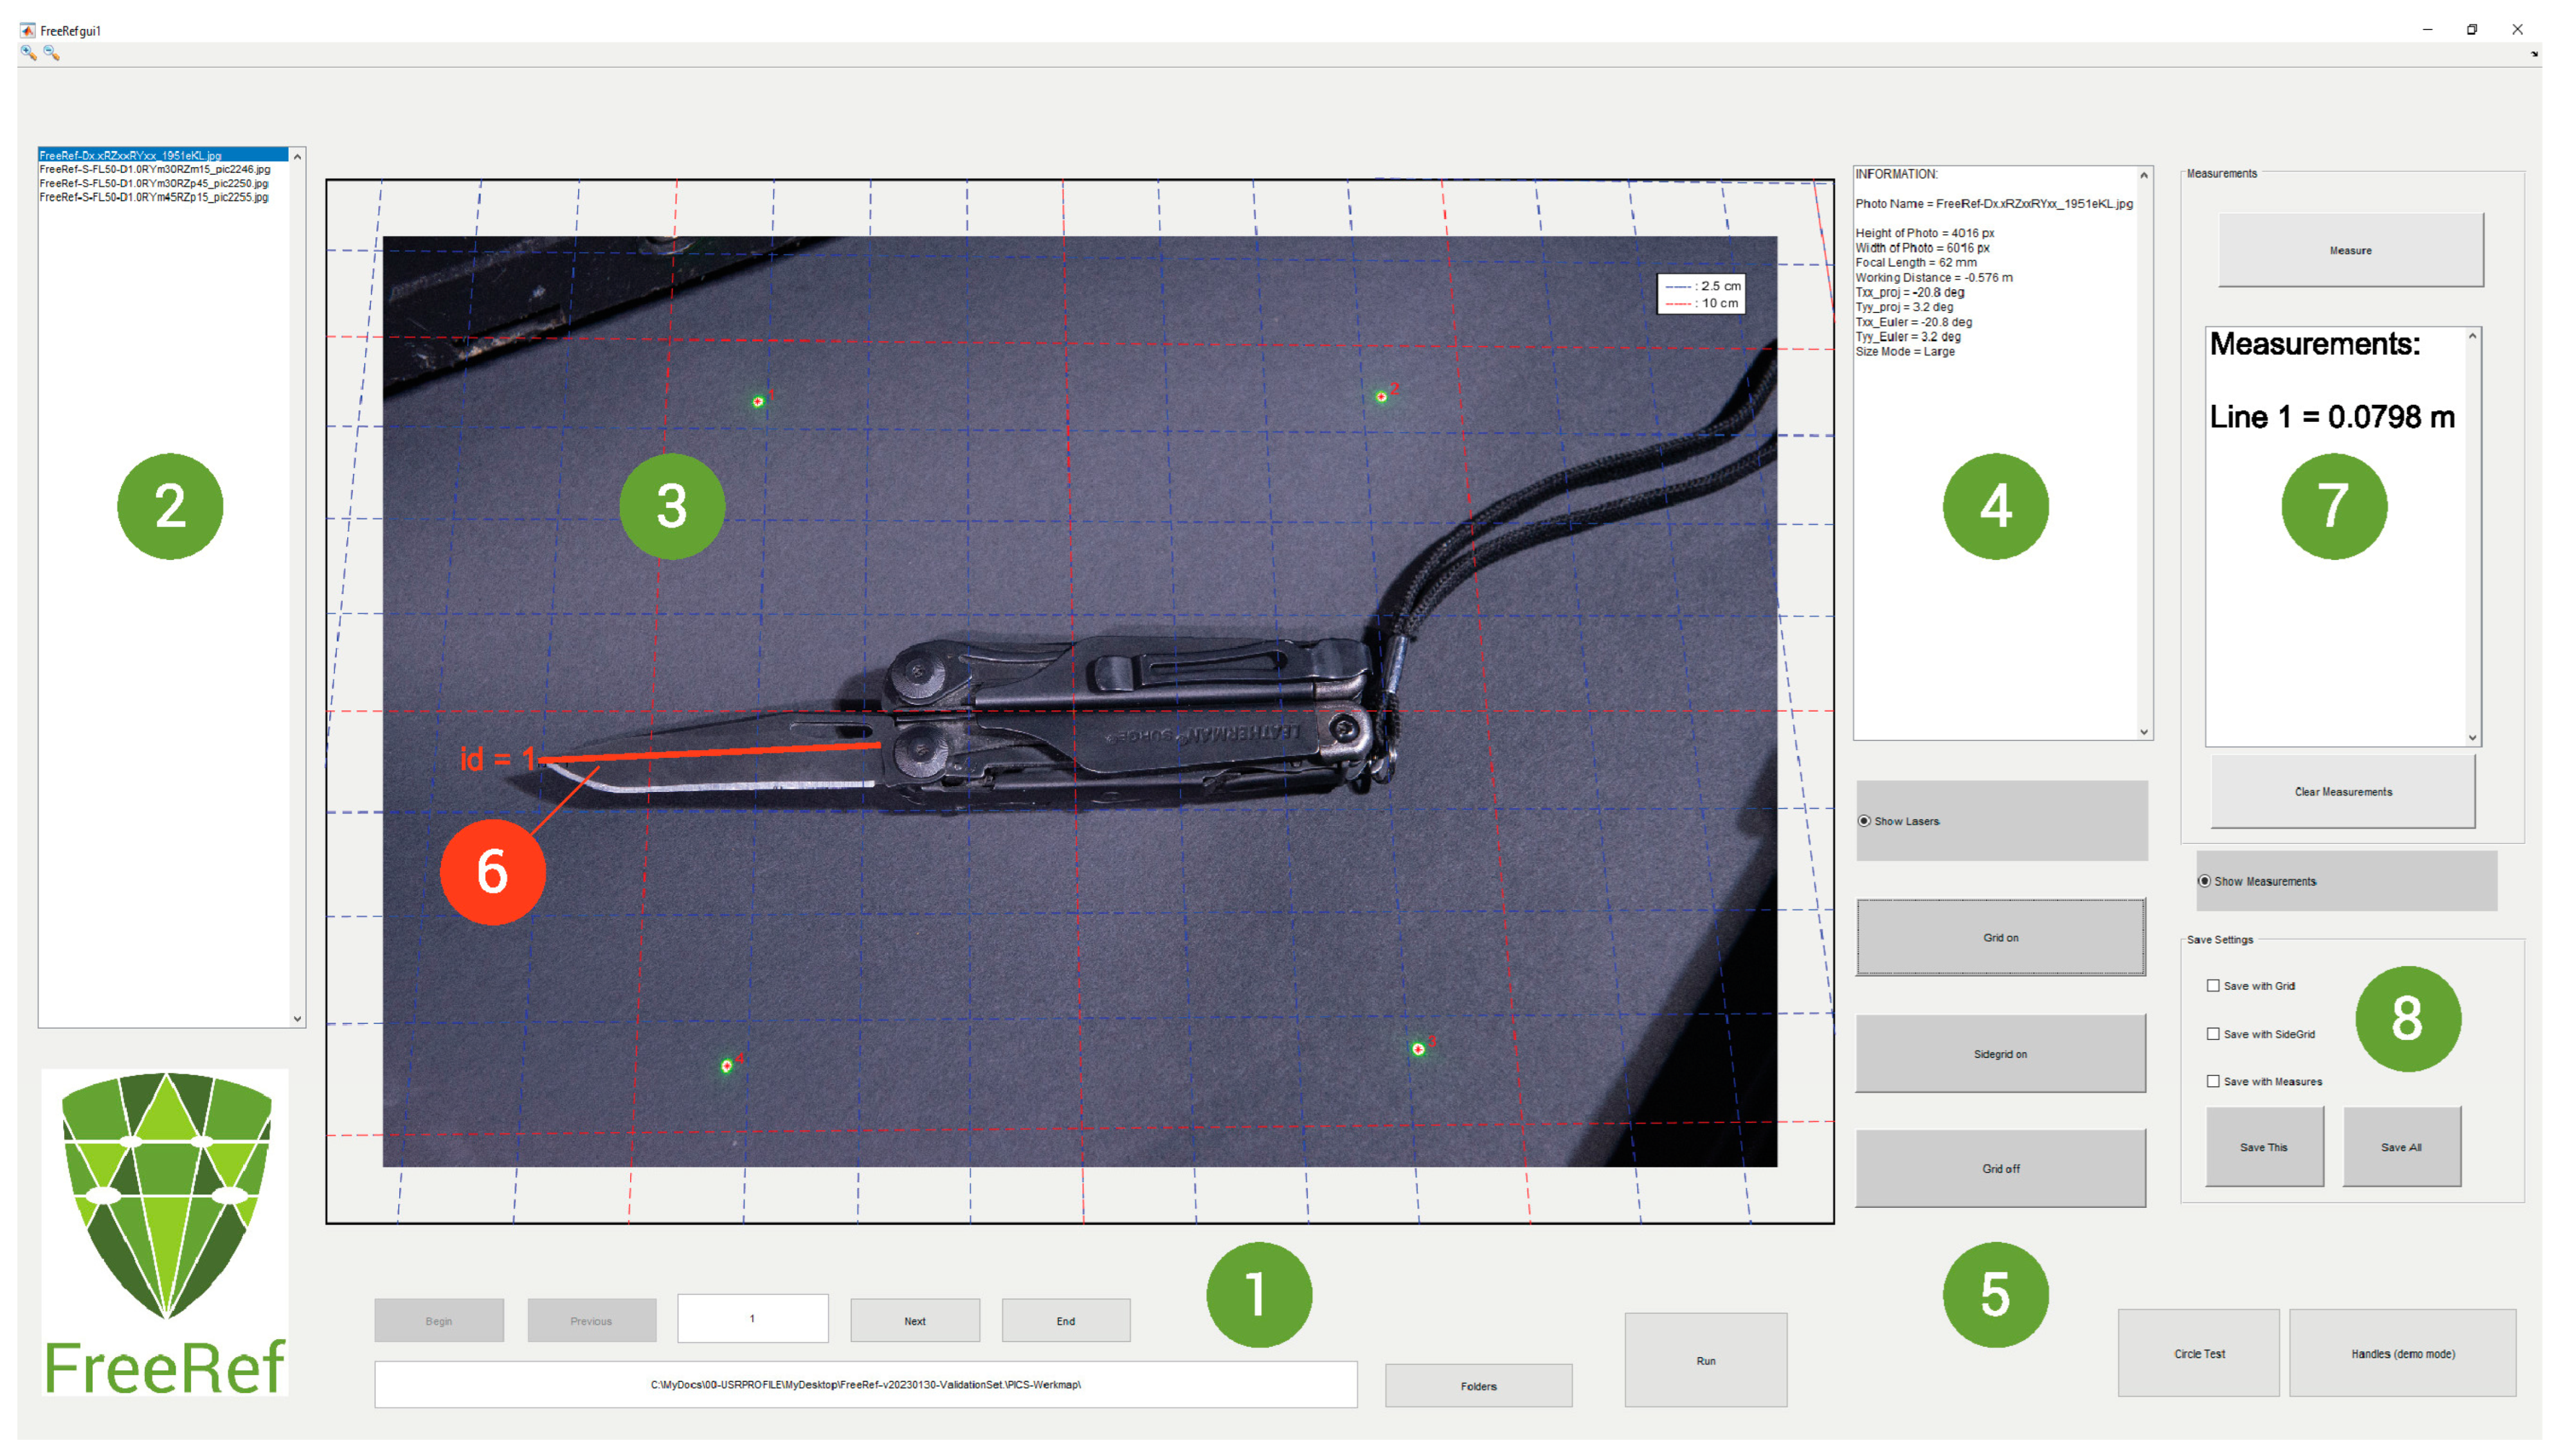
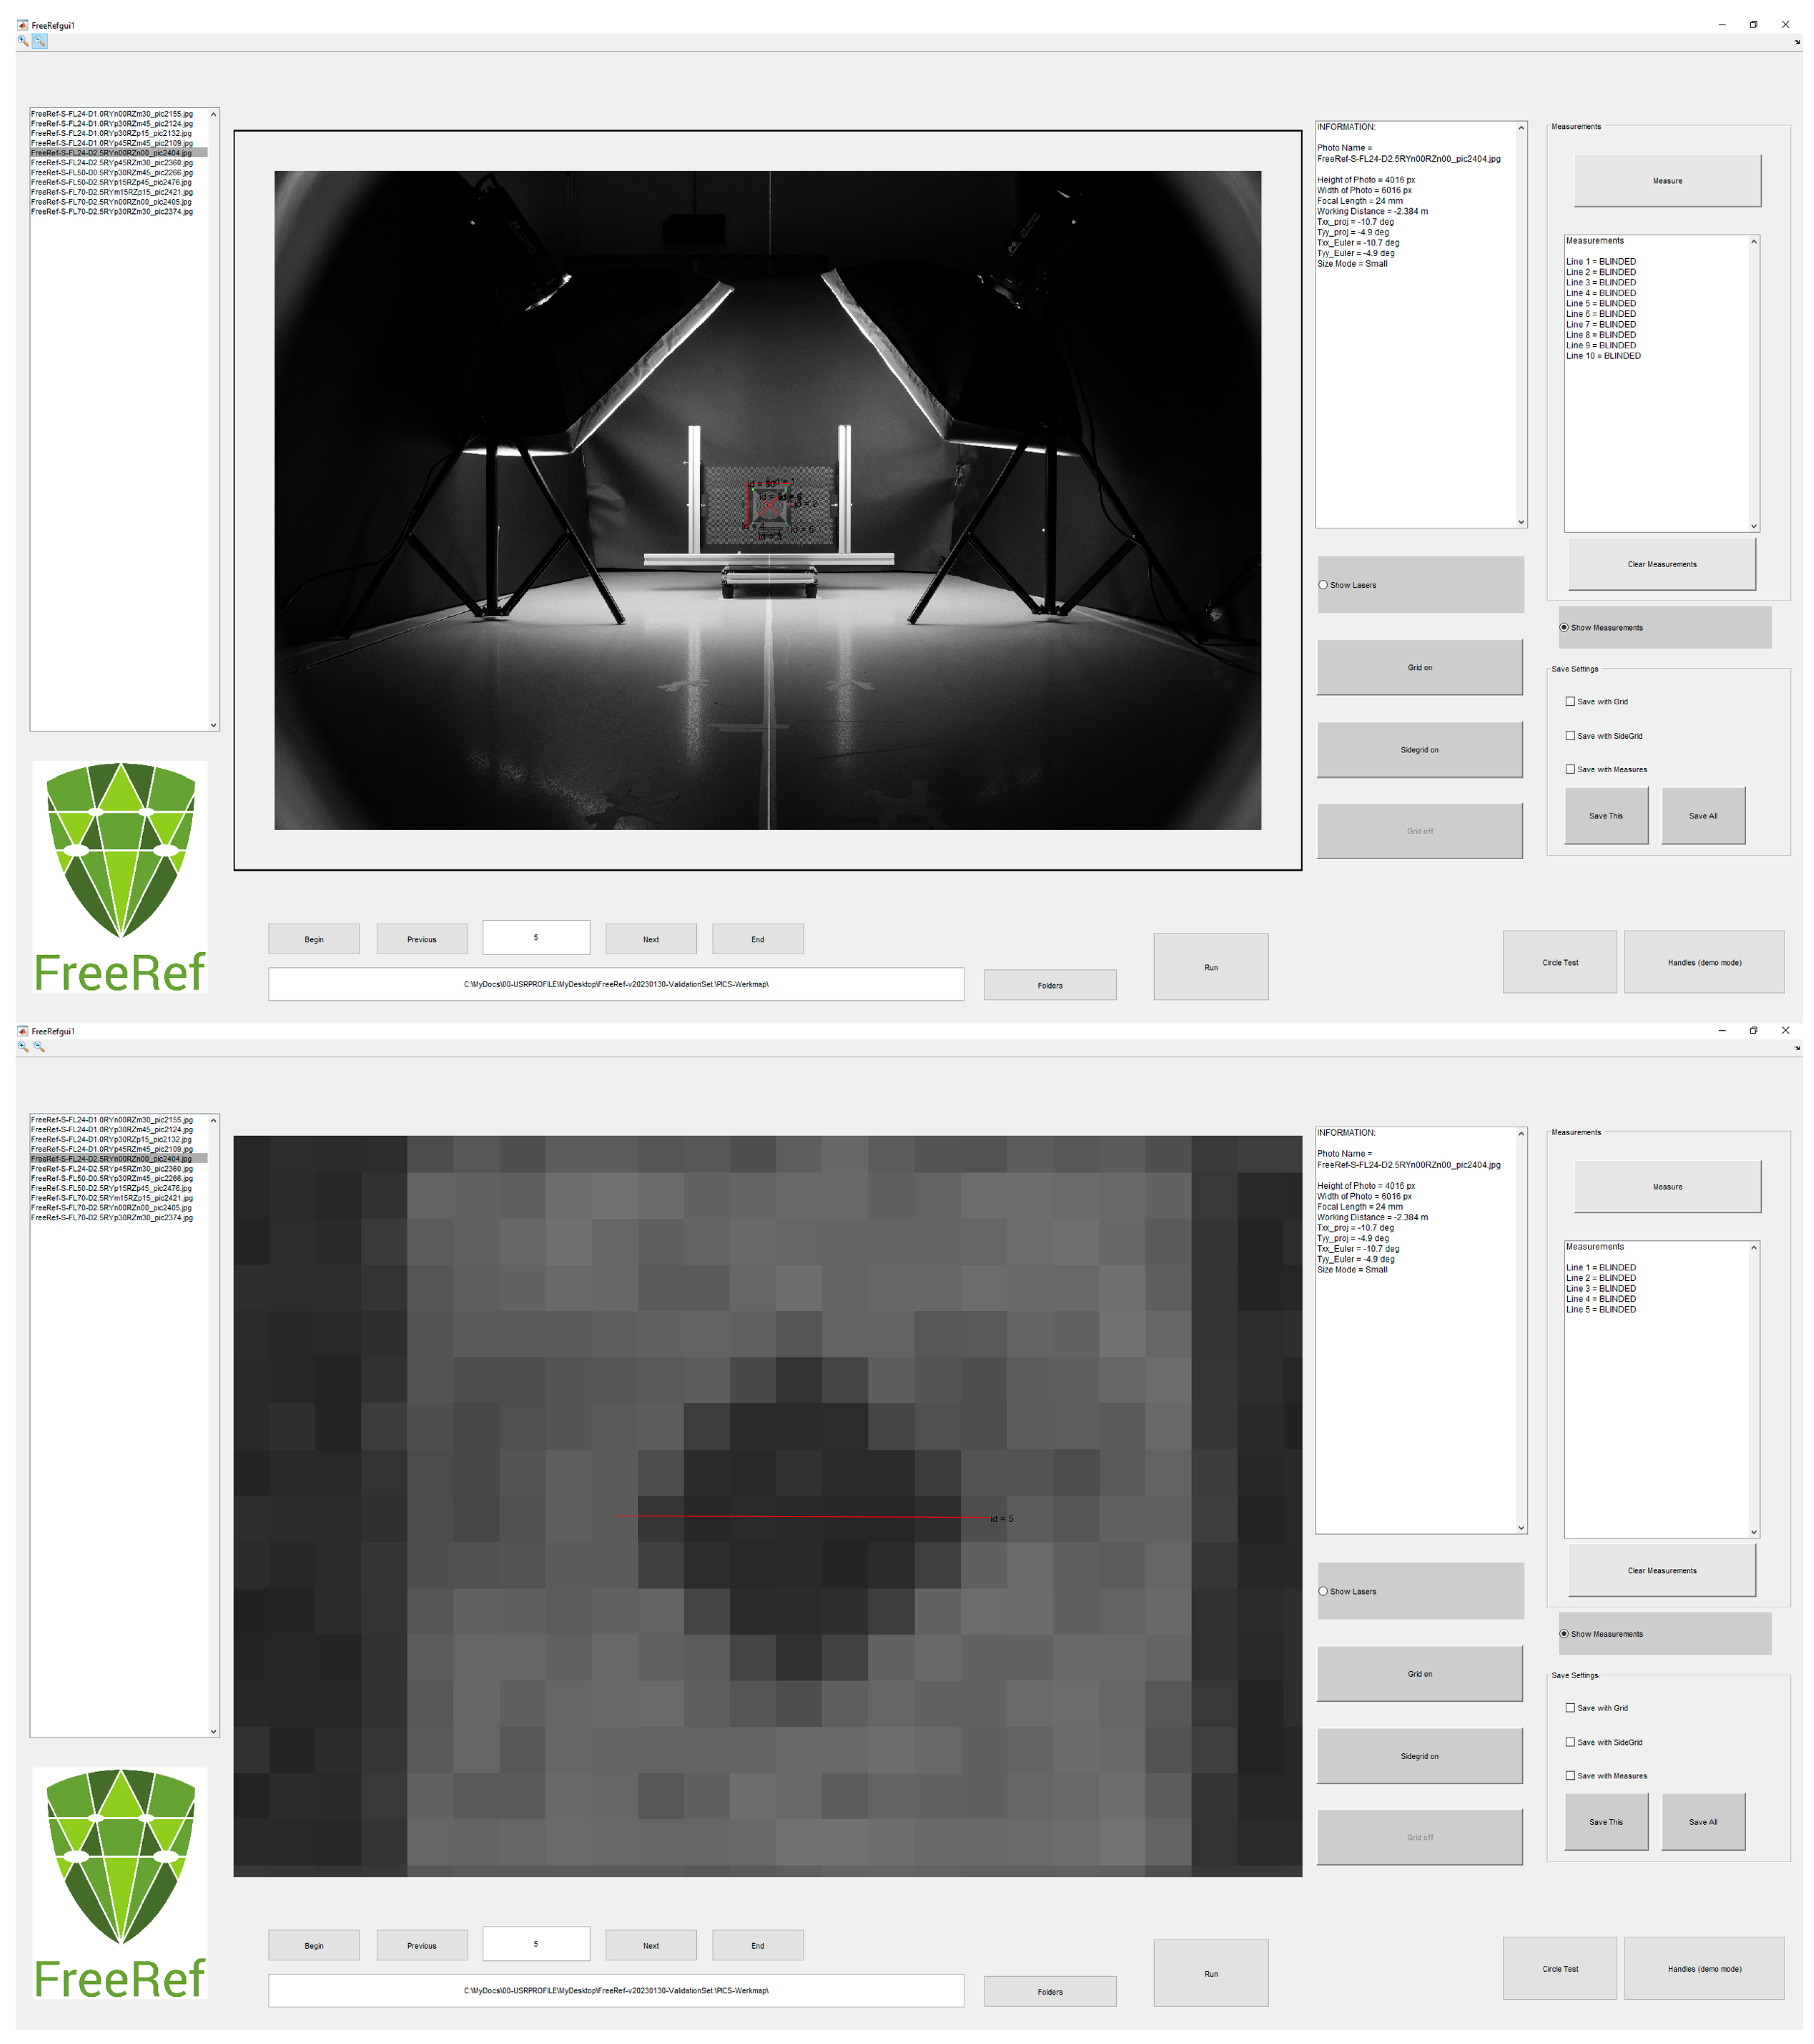
Figure 14 shows an arbitrary example of how the measurement lines were placed in the FreeRef-1 software by the assistants. It is clear that at large working distances, one has to zoom in so much for the smallest verification lengths that accurately clicking on the intended points on the calibration becomes a matter of a well-aimed guess between pixels. Hence, the measurement errors at these large distances, and the statistically significant effects of working distance and of focal length in interaction with Tyy seem to be simply caused by the limits of photo resolution. Therefore, users should, in a future improved software version, be made aware, either through user instructions or FreeRef-1 software warning messages, when measurements taken in photographs are too close to the photo resolution limits.
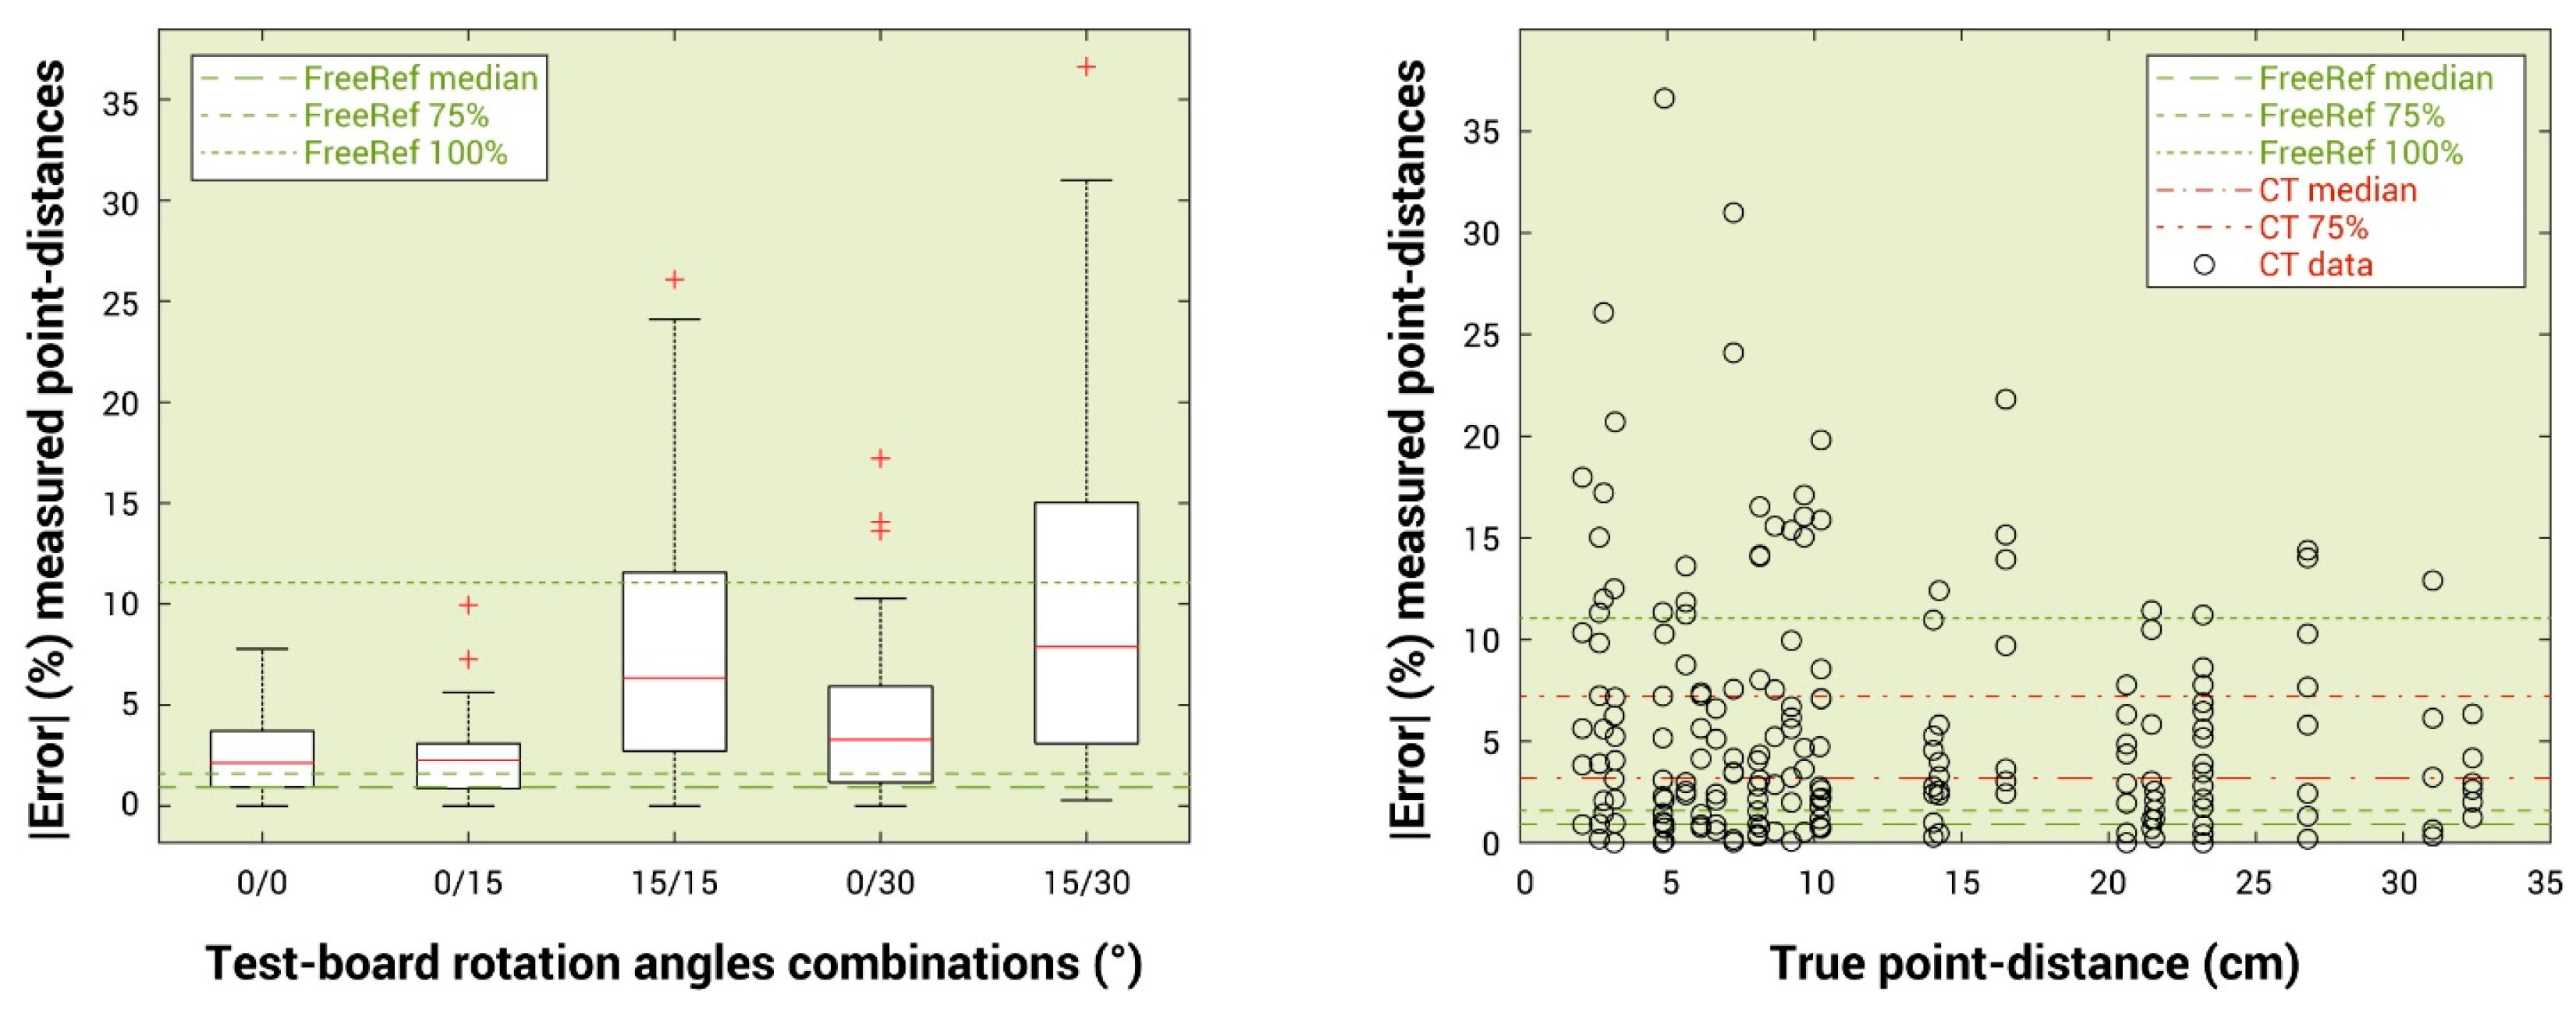
The FreeRef-1 verification results matched and mostly even surpassed the accuracy reached by police forensic investigators using their currently preferred techniques. This also holds for photographs taken at large angles (beyond 15° to 30°) that are currently deemed unsuitable for in-photo measurements. In addition, despite the users having had no prior experience with the FreeRef-1 software, they did perform faster using the FreeRef-1 software than with their own preferred methods. Yet, it should be noted that the accuracy of the measurements taken by the participants using their currently preferred methods in this test should by no means be interpreted as being representative of size referencing accuracy in actual forensic case work. This is because in the experiment, the participants were asked to conduct measurements in strongly angled photographs, which they would normally not do. Furthermore, the used photographs were clean, well-lit and taken in a lab setting. Conditions in forensic practice will often be much more complex, e.g. because crime scenes are usually messier than labs. Nonetheless, the results show that the FreeRef-1 system can accurately measure even when the projection plane angles are large. Hence, the FreeRef-1 system will allow for reliable measurements in angled photos, and hence allows us to photograph traces in hard-to-reach places that could previously not, or only with much effort and inconvenience, be photographed with reliable size references.
LiDAR (light detection and ranging, or 3D laser scanning) [
7] could be a potential alternative to physical size references, as it provides a contactless, remote measurement of real-world dimensions while taking photographs. However, LiDAR is a built-in technique. Broadly introducing this in the forensic field would require significant investments in replacing all the existing photo cameras and mobile phones currently being used for evidence photography, which would first need to be developed. Furthermore, next to requiring large amounts of data to store LiDAR data with a full set of photogrammetry images, its absolute accuracy for small objects > 10 cm is only about 1 cm (using an iPhone) [
7], which is up to 10 times worse than the FreeRef-1 system, depending on the distance and projection plane angles. When using specialized LiDAR equipment, the accuracies of point locations can be in the sub-centimeter range, but besides being still insufficiently accurate for small dimensions, these devices are bulky and expensive and require expert operators [
8,
9,
10].
Stereoscopic photogrammetry is another means for obtaining 3D real-world dimensions from sets of 2D photos. A test on artificial wounds on a mannequin resulted in measurement errors of about 6.1% on average with stereoscopy, against 13.95% when using conventional techniques (measuring in photographs, similar to our user study) [
11]. However, stereoscopic photogrammetry requires dual-objective or dual-camera systems, which are generally expensive and require well-trained operators [
11]. Monoscopic photogrammetry using a mobile phone camera and open-source software could make photogrammetry cheaper and more widely available [
12]. However, these techniques still always require having a physical size reference in at least a part of the photographs, and require a set of convergent photographs that are taken under approximately the same lighting conditions. Hence, the user must move around the object of interest many times to capture a plurality of photographs from various angles and ensure proper and constant light conditions for image stitching. The former is undesirable when considering contamination and disturbance of the scene and both are often not possible at a crime scene.
In contrast to the potential alternatives discussed above, the FreeRef-1 projector is both a simple and highly accurate tool, potentially suitable for use with any kind of camera, including mobile phones, without the need to adapt the camera itself. The FreeRef-1 contactless, projection-angle-tolerant, accurate measurements potentially offer great advantages in the forensic field. For example, even with a wide-angle photograph taken at an extreme angle between the projection plane and the camera, one could strongly zoom in on a blood spatter pattern and be able to measure, for example, blood stains of a millimeter in size with an error below 0.05 mm. Due to the measurement errors being relative and not absolute by nature, this new technique enables us to take a single shot of an entire wall with blood spatter patterns on a crime scene and still be able to measure the individual stains within a few percent. Because the photograph does not have to be taken at an as straight as possible angle, as is essential in the current techniques, one could easily photograph evidence under tables, on ceilings above objects and various other hard-to-reach places and still have reliable size references.
Because the FreeRef-1 provides contactless placement of size references and accurate measurements at large Txx and Tyy angles up to at least 2.5 m working distances, the system is believed to be very suitable for use in traffic accident investigations, damage investigations of ship bows (currently often requires photographing from another boat on moving water), placing a real-world size reference in 3D scans, and measuring crop growth in greeneries (currently a laborious manual process). The future market-ready FreeRef project is aimed to cost about the same as a regular external camera flash, that is, about EUR 500. In return, the contactless, projection-angle-tolerant, accurate FreeRef-1 system will offer many opportunities for saving time, workforce and money, while increasing measurement accuracies and reducing contamination risks due to the reduced need for photographers and assistants to be close to the evidence. This is particularly valuable because size references are often placed for precautionary reasons in case measurements are needed in the future, but regularly end up not being used at all.
One of the limitations in this study is the potential inaccuracy of establishing the ground truth of verification line lengths and point distances. If the ground truth deviated from the actual lengths or distances, this may have also caused the measurement errors to be slightly affected. However, because the errors were averaged per ten, this is unlikely to have had any relevant effect on the outcomes. The calibration plate rotations Txx and Tyy may have also slightly deviated from their intended positions; therefore, the reported values may have been for rotations that were not exactly the Txx and Tyy values reported. Yet, the FreeRef-1 detected projection plane rotations Rxx and Ryy were mostly within 1° and almost always within 2° of Txx and Tyy, except for the 2.5 m working distance. At the 2.5 m working distance, the detected Ryy was still usually within 2°, sporadically up to 5° and eight times up to 10 or 20° due to wrong laser detections, likely caused by the laser dots being too difficult to discern, due to photo resolution limitations. At the 5 m working distance, the accuracy should be considered too low for practical use, although it is expected that with better alignment of the projector on the camera and improved laser dot detection algorithms, this can be further improved. Overall, the results suggest that the FreeRef-1 system accurately detects the projection plane rotation angles and that the test setup was fit for purpose.
Improvements of the FreeRef-1 projector are being implemented to make it robust and light-weight. In addition,, the FreeRef-1 software may benefit from machine learning algorithms to improve the speed, user experience, and accuracy of the laser dots detection in practical situations. The system should be tested with crime scene investigators on mock-up crime and accident scenes, which are often much messier environments than our lab, and in forensic laboratories to assess its practical usability. Finally, the usability, cost effectiveness and performance of the final system and its workflow from crime scenes to use in court should be compared to the current techniques before its implementation in forensic practice.


 ,
, 


