Abstract
The photosensitivity, responsivity, and signal-to-noise ratio of organic phototransistors depend on the timing characteristics of light pulses. However, in the literature, such figures of merit (FoM) are typically extracted in stationary conditions, very often from IV curves taken under constant light exposure. In this work, we studied the most relevant FoM of a DNTT-based organic phototransistor as a function of the timing parameters of light pulses, to assess the device suitability for real-time applications. The dynamic response to light pulse bursts at ~470 nm (close to the DNTT absorption peak) was characterized at different irradiances under various working conditions, such as pulse width and duty cycle. Several bias voltages were explored to allow for a trade-off to be made between operating points. Amplitude distortion in response to light pulse bursts was also addressed.
1. Introduction
Organic field-effect transistors (OFETs) are attracting the interest of the scientific community as a valid alternative to standard semiconductor-based devices. This is due to their several interesting properties, such as cost-effective fabrication over large areas, flexibility, and light weight. The recent progress in OFET fabrication techniques has led to the development of devices with high field-effect mobilities μ, low threshold voltages Vth, and high current on/off ratios Ion/off. OFETs can be successfully employed as building blocks in electronic circuits, as well as sensors in applications such as chemical and biological sensing, gas analysis, and pressure monitoring [1,2,3,4]. Several works also demonstrated how OFETs can be efficiently used as organic phototransistors (OPTs). The potential of such devices lies in the good photosensitive properties of organic semiconductors, combined with the transistor intrinsic amplification capability [5,6]. Fields of application of OPTs also include optical memory, light communication [7,8,9], and radiation detection and dosimetry in radiotherapy [10,11,12]. Several organic semiconductor materials have been investigated for OPT development, including TIPS-pentacene and dinaphtho[2,3-b:2′,3′-f]thieno[3,2-b′]thiophene (DNTT). For those materials, field-effect mobility comparable to that of amorphous silicon, typically μ~1 cm2/Vs, low turn-on voltage, and on/off current ratio larger than 106 have been reported [13,14,15].
The origin of the photoresponse in OPTs is usually attributed to the increase in the minority carrier trap generation rate under light exposure [16,17]. For a p-type device (i.e., hole-transporting device), the accumulation of photogenerated electrons in trap states in the phototransistor channel causes a shift in the threshold voltage, resulting in multiple holes injected into the channel for a single photogenerated carrier pair. Such a mechanism is known as photoconductive gain. The transverse electric field induced by the gate plays the role of helping to segregate photogenerated electron–hole pairs, decreasing the probability of recombination. The photoconductive gain is recognized as a slow process: phototransistors that exhibit high photoconductive gain usually do not operate as fast as a photodiode with similar carrier transit time [16,18]. Hence, characterizing the dynamic photoresponse to transient light pulses is of paramount importance for devices of interest for real-time applications.
The organic thin-film charge photogeneration has been investigated in the range from picoseconds to seconds after excitation [19,20]. The optical response has been also investigated in depth in OPTs. Among others, we mention here studies on devices based on P3OT [21], PQT-12 [22], PBDFTDTBT [23], P3H3 [24], PDVT-8/PC61BM [25], DNTT [26,27,28], and TIPS-pentacene [15]. Most of these works studied the performance of OPTs under quasi-static light conditions at different irradiance, whereas a characterization of the device dynamic response to short light pulses at low irradiance has been barely investigated. Quasi-static characterization is useful for comparing the performance of different materials and devices; however, it is not sufficient for assessing their suitability for detection of short light pulses.
In this paper, we present a systematic characterization of a DNTT-based OPT, specifically developed for real-time radiation detection and dosimetry applications [12,29,30], where fast photoresponse to weak, fast light pulses is expected to be a key feature. Specifically, we report on the response to ~470 nm light pulses, under various timing conditions, at different irradiances and operating points. Several figures of merit (FoM), such as photosensitivity, responsivity, and signal-to-noise ratio, have been investigated. In all the explored regions, these quantities strongly depend on the timing characteristics of the light pulses. In this work, we have characterized them as a function of the pulse width, frequency, and duty cycle, studying the correlation with the bias voltages. We also have studied stress and distortion effects in the photoresponse when light pulse bursts are applied, to evaluate the exploitation of such devices in applications where random light pulse sequences are expected.
2. Materials and Methods
2.1. Organic Phototransistor Layout
The device under characterization is a thin-film transistor based on DNTT. The device was designed, engineered, and realized at the CNR-IMM laboratory (Rome, Italy). Details on the fabrication process are given in Refs. [29,30]. Here, we only recall some useful information. The OPT was fabricated in a bottom-gate/top-contact configuration on a 100 µm thick substrate of polyethylene-naphthalate. The gate is made by a 70 nm thick Al layer. Source and drain are made by 30 nm thick interdigitated finger electrodes of Au. The semiconductor is 50 nm thick. A dielectric layer, made of a 600 nm thick fluoropolymer-based material (CytopTM), separates the semiconductor from the gate. The whole structure is encapsulated within a 240 nm thick layer of Cytop.
OPT are arranged in a 2 × 2 matrix (see Figure 1a). Each OPT has a channel length L = 100 µm and a width W = 40 mm. The active area A = L × W is 0.04 cm2.
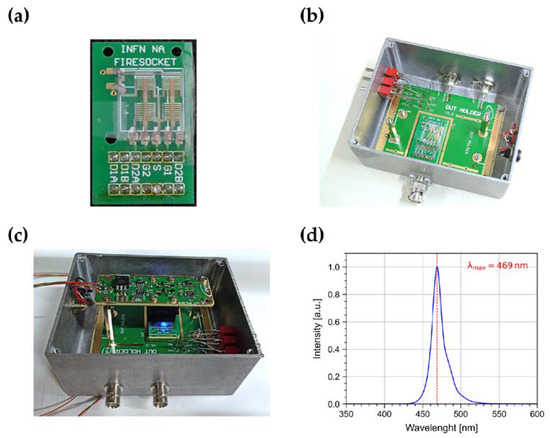
Figure 1.
Pictures of (a) the 2 × 2 OPT matrix bonded on a custom-made socket; (b) the OPT matrix on the socket arranged on a motherboard within an aluminum box used as Faraday cage; (c) the aforementioned setup with a LED source and its driver circuit mounted on top of the OPT. (d) Emission spectrum of the LED source.
2.2. Electrical and Photoresponse Characterization Setup
The device was bonded on a custom-made socket (Figure 1a) arranged on a motherboard enclosed in a Faraday cage (Figure 1b), which also acts as a black box to shield the samples from environmental light.
The electrical characterization was performed by means of a B1500A Semiconductor Device Parameter Analyzer, equipped with three source meter units (SMUs) connected to the device source, gate, and drain. The SMUs were used to bias the OPT and to collect transfer and output curves.
For the dynamic photoresponse characterization, the device was illuminated with an LED source (Broadcom HLMP-KB45-A0000) installed on the top of the motherboard housing the device under test (DUT) within the Faraday cage (Figure 1c).
The LED emission spectrum (Figure 1d) was characterized by means of a CCD-based Ocean Insight Spectrometer with a sub-nm resolution. Such a LED was chosen due to its emission wavelength peak (469 nm) close to the absorption peak of the DNTT: ~450 nm (see Ref. [29]). The LED current was controlled by a driver circuit connected to a function generator used to supply control pulses with variable timing. An irradiance in the range from a few nW/cm2 to about 10 µW/cm2 was achieved with a collimated flat-top spot with a diameter of ~4 mm on the DUT surface. The irradiance was calibrated by means of a Thorlabs PM100USB power meter equipped with a S120C silicon photodiode.
The B1500A unit was used in the “I/V-t sampling measurement” mode [31] to sample at a rate of 20 Hz the OPT drain current trend under illumination.
All measurements were conducted under ambient atmospheric conditions at room temperature.
3. Results and Discussion
3.1. Electrical Characterization in Dark
We measured the output and transfer characteristics of the device in the dark. Output curves (Figure 2a) were acquired with a forward and reverse drain voltage Vds scan in the range [+1 V, −12 V], for gate voltage Vgs values between −3 V and −12 V in steps of 3V. Transfer curves (Figure 2b,c) were acquired in linear (Vds = −1 V) and saturation regimes (Vds = −20 V) with a forward and reverse Vgs scan in the range [+4 V, −9 V].
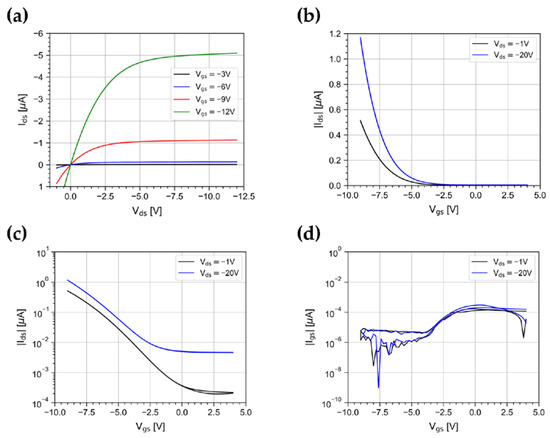
Figure 2.
(a) Output characteristics for Vgs varying between −3 V and −12 V in steps of 3 V, and transfer characteristics in linear (Vds = −1 V) and saturation regimes (Vds = −20 V) represented in (b) linear and (c) log-y scale. (d) Gate leakage current curves for Vds = −1 V and Vds = −20 V.
The curves show a typical p-type field-effect transistor behavior: outputs clearly show the modulation effect due to Vgs, good linearity for low Vds, and saturation characteristics at high Vds. Curves show minimal hysteresis between forward and reverse gate-voltage sweeps in both the linear and saturation regimes. The gate leakage current Igs (Figure 2d) is lower than 10−10 A, indicating a high-quality gate insulation.
From the curves, we extracted several characteristic parameters of the DUT [32]. The field-effect mobility, computed in the linear regime (Vds = −1 V), is ~ 0.5 cm2 V−1 s−1 at Vgs = −12 V. The threshold voltage is around −10 V. The onset voltage is in the range +2 V to −3 V. The subthreshold slope is ~2.4 V dec−1. The log(Ion/Ioff) ratio is around 5, where Ion is measured at Vgs = −12 V. All the extracted parameters in the explored ranges are in good agreement with values reported in the literature for DNTT-based OFETs [13,14,26,27,28,29,30].
3.2. Dynamic Photoresponse
We measured the device photoresponse to light bursts at ~470 nm. Upon illumination, the device shows a fast switching of the drain current. As an example, we show in Figure 3a the drain current measured when illuminating the device with a burst of 5 pulses at an irradiance of 500 nW/cm2, with a repetition period T = 60 s (see Figure 3b) at Vds = −5 V and Vgs = −5 V. The signal shows a temporal development that can be parameterized as the sum of two exponentials [33,34,35,36]. The measured characteristic times are s and s, as shown in Figure 3c. When the light is turned off, the device response drops very slowly, with characteristic times s and s, as shown in Figure 3d. Both rise and fall times are almost constant within the burst. The slow return of Ids to the initial conditions when light is turned off is due to the time it takes for trapped photogenerated traps to recombine [33].
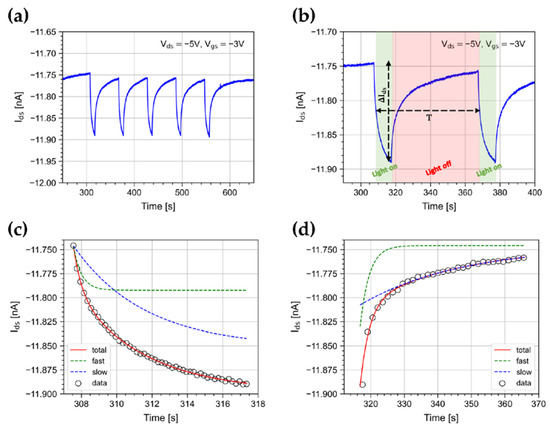
Figure 3.
(a) Ids current when illuminating the device with a 5-pulse burst with a period of T = 60 s. (b) Details of the first two pulses of the burst. Data and best-fit curve with details on the fast and slow exponential function components for the (c) signal growth and (d) decay.
We investigated several key FoMs, as well as studied the correlation of the pulse timing and burst structure with the irradiance and the bias voltages, in order to characterize the response in real-time applications.
The photosensitivity P and the photoresponsivity R were computed as follows [1,15]:
where , and and are the drain current in dark conditions and under illumination, respectively; A is the active device area; and IRR is the irradiance of the light source. R and P depend on the transistor layout and on the polarization conditions [29].
Figure 4 shows the trend of R and P as a function of Vgs for Vds = −1 V and for pulse widths up to 10 s at a constant irradiance of 500 nW/cm2. The values shown in the plot are the average taken on bursts of 5 pulses. The responsivity has a minimum as Vgs approaches 0 V, while it gradually increases up to 0.03 AW−1 at Vgs = −7 V, as a result of the increasing exciton dissociation rate due to the transversal electrical field in the channel [27,37]. The maximum value of P is 0.024, reached at Vgs = 0 V. This is near the turn on voltage, as a result of the abundance of photogenerated carriers over scarce field-generated carriers. At more negative Vgs values, the photoresponse is subdued to the increasing number of field-induced charge carriers [27].
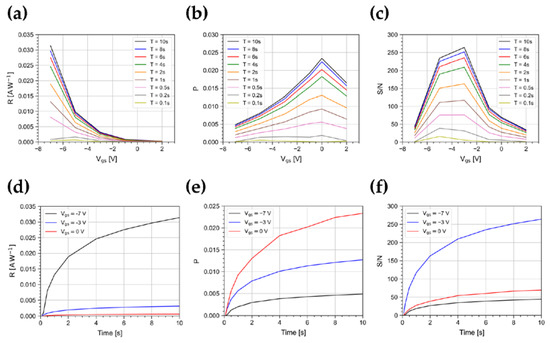
Figure 4.
(a) Responsivity, (b) photosensitivity, and (c) signal-to-noise ratio as a function of Vgs for Vds = −1 V for light pulse widths from 0.1 s to 10 s. (d) Responsivity, (e) photosensitivity, and (f) signal-to-noise ratio as a function of the light pulse width at Vgs = −7, −3, 0 V and Vds = −1 V. All these FoMs are shown at an irradiance of 500 nW/cm2.
Furthermore, we measured the signal-to-noise ratio S/N, where the noise N is evaluated as the RMS of the dark current measured immediately before the arrival of the light pulse. Figure 4c shows the trend of S/N as a function of Vgs and for different pulse widths. The maximum value is ~260, reached at Vgs = −3 V for a pulse width of 10 s. For a width shorter than 0.5 s, the photoresponse reduces, and the highest S/N ratio occurs at Vgs = −5 V.
As shown in Figure 4d–f, the magnitude of R, P, and S/N reduces for shorter pulse widths, because of the finite slew rate of Ids. As an example, at Vgs = −7 V, by varying the light pulse width in the range from 100 ms to 1 s, R changes by a factor 30, while from 1 s to 10 s, R changes only by a factor ~2. A similar behavior is observed for P and S/N. As a consequence, the device characterizations achieved in quasi-stationary regimes are not representative of the device response to short light pulses, as expected in various photodetection applications.
We studied R, P and S/N for two more Vds values (−5 V, −10 V) and compared the results, as shown in Figure 5a–c. The responsivity monotonically increases with the absolute values of gate and drain voltages. From the measured values of R, we derived the external quantum efficiency (EQE) of the device, i.e., the ratio between the number of incident photons and photogenerated carriers, as follows [1]:
where q is the elementary charge, h is the Planck constant, and c is the speed of light in the vacuum. Values as high as 20% were measured at Vgs = −7 V and Vds = −10 V.
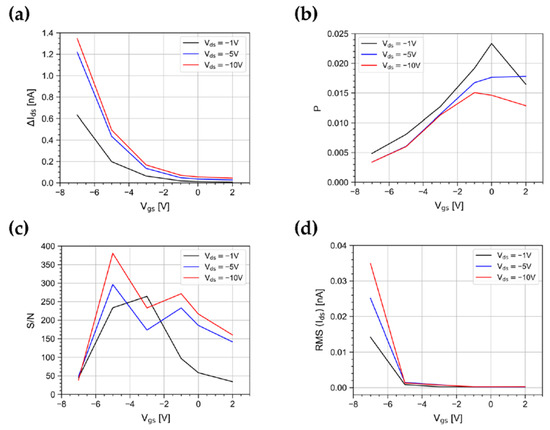
Figure 5.
(a) Responsivity, (b) photosensitivity, (c) signal-to-noise ratio, and (d) root mean square of the Ids dark current as a function of Vgs for Vds = −1, −5, −10 V at an irradiance of 500 nW/cm2.
It should be noted that as Vgs and Vds increase, the dark current Ids grows as well, as shown in transfer curves in Figure 2b. As a consequence, in applications where the OPT is DC coupled to the front-end circuit, and the read-out of short light pulses asks for high-gain trans-impedance amplifiers, the increment of the dark current could bring the amplifier in saturation.
Differently from R, both P and S/N correlate the photoresponse with the dark current and its root mean square (Figure 5d). The highest photosensitivity value was obtained with the lowest drain bias applied in our tests (Vds = −1 V) and with a gate voltage Vgs = 0 V. On the contrary, the S/N plot suggests the best operating point to be at Vgs = −5 V and Vds = −10 V. However, for high values of Vds, it is well known that the high electrical field lowers the device stability [18]. Indeed, we have observed that random telegraph signal (RTS) phenomena arise. RTS consists of the discrete, fast fluctuation of the dark current Ids between two or more values [38]. Figure 6 shows, as an example, a time window where the drain current was affected by RTS behaviors. The onset of RTS is clearly to avoid. The dark current fluctuations generate swift P variations and the step changes in the signal baseline could be interpreted as a photoresponse. A good compromise is then achieved by decreasing the gate and drain bias down to values as low as Vds = −1 V and Vgs = −3 V. Taking all that into account, the optimal operating point clearly depends on the specific application and the experimental setup to be used.
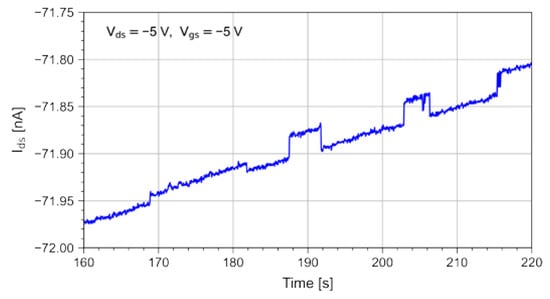
Figure 6.
Random telegraph signal behavior in the drain dark current observed for the OPT polarization of Vds = −5 V, Vgs = −5 V.
In order to study possible channel stress effects due to light exposure, we illuminated the DUT with bursts of 20 pulses for different repetition periods: T = 15, 20, 35, 60 s. Figure 7 shows the drain current trend when illuminating the device with bursts of light pulses with different periods. As noted in [29], the exposure to repeated light pulses causes a drift of the drain current. This can be explained by the pile-up of a persistent component of the photocurrent [33,39,40].
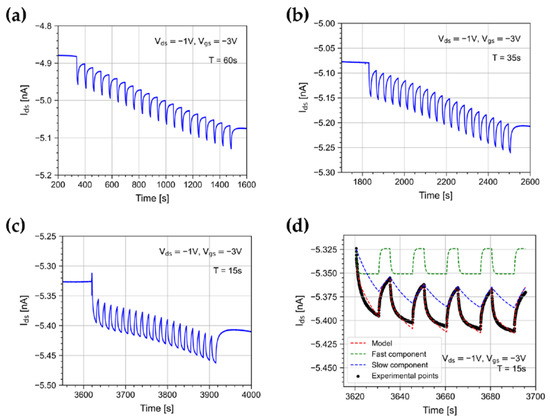
Figure 7.
Drain current when illuminating the device with 10 s width light pulses with a period of (a) T = 60 s, (b) T = 35 s, and (c) T = 15 s. The OPT was polarized with Vds = −1 V and Vgs = −3 V, and the irradiance was 500 nW/cm2. (d) Drain current measured under 10 s light pulses with a period of 15 s (black points) and the eq. 6 model best-fit curve (red dotted line). The fitted slow and fast model components are shown in green and blue, respectively.
Moreover, a pulse height reduction between the first pulse of the burst and the following ones is observed. A similar effect was shown in [41]; however, it has neither been discussed nor interpreted. Figure 7a–c clearly shows that the shorter the period between pulses, the greater the pulse height reduction.
We found that such phenomena can be described by composing models taken from the literature [12,42,43]. As suggested in [42,43], we assumed that the photocurrent I’o is linearly dependent on the total number of photogenerated minority carrier traps n:
The time evolution of the defect density is governed by a rate equation:
where a is the defect generation rate, which is ultimately related to irradiance, and b is the defect recombination rate.
The phenomena we observed require the presence of two populations of defects with densities nx and ny, whose activation energies are different [12]. In such an approach, nx is responsible for the fast photocurrent component, while ny for the persistent photocurrent component. Differently from [12], where two defect populations with continuous activation energy values were considered, here we simply assumed two discrete values. The overall photocurrent is hence given by:
where both nx and ny follow a rate equation in the form of Equation (5).
Figure 7d shows the measured drain current (in black) and superimposed the Equation (6) model best-fit curve (red dotted curve). The fast and persistent photocurrent components due to the nx and ny defect densities’ evolution are shown in green and blue, respectively.
The model reproduces the decrease of the signal height observed in data between the first pulse and the following ones well. This phenomenon happens because of the build-up of the persistent photocurrent component, which after the first burst does not return to zero. The wander of the drain current baseline changes the response to the light pulses in the burst as a function of the burst length.
Figure 8a,c show the trend of R and P for the pulses of the burst for different periods. R and P show a marked reduction between the first and the second pulse, while they remain nearly constant afterward. Figure 8b,d show R and P values averaged over the burst pulses and normalized to the value achieved at 60 s, as a function of the light pulse period. They clearly show that the shorter the pulse period, the smaller are R and P. A similar trend is observed at different gate polarizations.
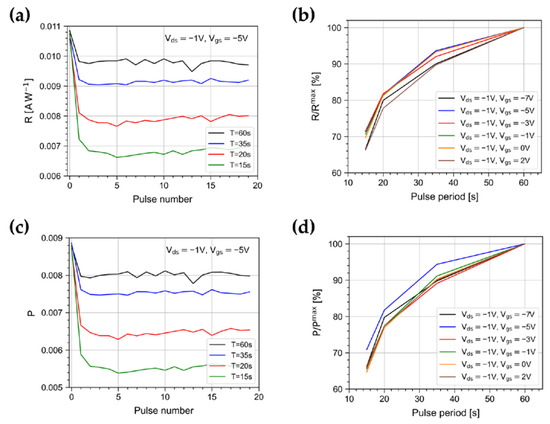
Figure 8.
Trends of (a) R and (c) P for pulses in the burst, for different periods, at Vds = −1 V and Vgs = −5 V. Averages of (b) R and (d) P in the burst, normalized to the values at 60 s, as a function of the light pulse period for different gate polarizations.
Finally, we have investigated the OPT photoresponse to 10 s light pulses as a function of the irradiance in the range from 100 nW/cm2 to 1900 nW/cm2. As shown in Figure 9, ΔIds increases with the irradiance and values as high as ~120 pA are reached at 1900 nW/cm2. On the other hand, light pulses at an irradiance as low as 100 nW/cm2 still produce a detectable response of ~20 pA. A nonlinear behavior is observed in Figure 9a, which is likely to be attributed to the limiting nature of charge transport mechanisms in the polymer [44]. As a consequence, at the largest irradiance applied in our test, R reduces, and values as low as 1.5 mAW−1 are reached (Figure 9b).
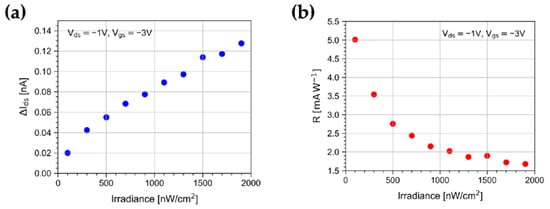
Figure 9.
Trend of (a) ΔIds and (b) R for 10 s light pulses as a function of the irradiance at Vgs = −3 V and Vds = −1 V.
4. Conclusions
Our results aim to evaluate the dynamic performance of a DNTT-based OPT in the view of deployment in applications that foresee the detections of fast, random light pulse sequences, such as radiation detection, dosimetry, and visible light communication. We have characterized the dynamic photoresponse to ~470 nm light pulses, close to the DNTT absorption peak.
We investigated several FoMs, such as photosensitivity, responsivity, and signal-to-noise ratio, under various timing conditions, at different irradiances and operating points. In all the explored regions, we observed that photosensitivity, responsivity, and signal-to-noise ratio strongly depend on the timing characteristics of the light pulses. R changes by more than an order of magnitude from 100 ms to 1 s, while R changes only by a factor ~2 from 1 s to 10 s. Stationary conditions are reached only after an exposition of a couple of minutes. P and S/N behave in a similar fashion.
The maximum of the responsivity is obtained at the higher gate and drain voltages explored. Differently, the highest photosensitivity value is obtained with the lowest drain bias applied in our tests and with the gate and source shorted to ground. The S/N plots suggest increasing both Vgs and Vds to achieve the best operating point. It is noticeable, however, that for high values of Vds, random telegraph signal effects in the drain current arise. Their occurrence makes it questionable to quantify the S/N ratio, and moreover, is clearly to be avoided, because such step-like fluctuations could be interpreted as a true signal. In applications where signal amplitude is paramount, both Vgs and Vds should be increased to the limit allowed by the stability of the device operation and bias stress effects. On the other hand, in order to avoid saturation in DC-coupled high-gain trans-impedance amplifiers, a low dark current is mandatory, and hence low bias voltages are required.
We also studied stress and distortion effects in the photoresponse when pulse bursts are applied. We observed a reduction in the ΔIds photoresponse, between the first and the second pulse, while it remains approximately constant in the following pulses. We found that such an effect in the data is well reproduced by composing models taken from the literature, in which the photocurrent is assumed to be proportional to the defect density. Supposing the presence of just two kinds of defects with discrete activation energies allowed us to reproduce the experimental data accurately in a time window of minutes.
In future works, we aim to correlate the OPT detectivity and the limit of detection to the timing of the incoming light pulses.
Author Contributions
Conceptualization and methodology, A.A. and M.C.; measurements, A.A., M.C. and P.D.M.; data analysis, M.C.; writing—original draft preparation, A.A. and M.C.; writing—review and editing, A.A. and M.C.; visualization, A.A., M.C., P.B., F.D.C. and P.D.M. All authors have read and agreed to the published version of the manuscript.
Funding
This research has been funded by the CSN V of INFN, in the framework of the FIRE experiment and by Horizon 2020 Marie Sklodowska-Curie RISE project JENNIFER2 (European grant agreement No. 822070).
Institutional Review Board Statement
Not applicable.
Informed Consent Statement
Not applicable.
Data Availability Statement
The data presented in this study are available on request from the corresponding author.
Acknowledgments
The authors would like to thank Antonio Anastasio (INFN-Napoli), Alfonso Boiano (INFN-Napoli), and Lorenzo Roscilli (INFN-Napoli) for the design of equipment used in this paper.
Conflicts of Interest
The authors declare no conflict of interest.
References
- Luo, L.; Liu, Z. Recent progress in organic field-effect transistor-based chem/bio-sensors. VIEW 2022, 3, 20200115. [Google Scholar] [CrossRef]
- Liu, K.; Ouyang, B.; Guo, X.; Guo, Y.; Liu, Y. Advances in flexible organic field-effect transistors and their applications for flexible electronics. npj Flex Electron 2022, 6, 1. [Google Scholar] [CrossRef]
- Yuvaraja, S.; Nawaz, A.; Liu, Q.; Dubal, D.; Surya, S.G.; Salama, K.N.; Sonar, P. Organic field-effect transistor-based flexible sensors. Chem. Soc. Rev. 2020, 49, 3423–3460. [Google Scholar] [CrossRef] [PubMed]
- Tang, W.; Huang, Y.; Han, L.; Liu, R.; Su, Y.; Guo, X.; Yan, F. Recent progress in printable organic field effect transistors. J. Mater. Chem. C 2019, 7, 790–808. [Google Scholar] [CrossRef]
- Ostroverkhova, O. Organic Optoelectronic Materials: Mechanisms and Applications. Chem. Rev. 2016, 116, 13279–13412. [Google Scholar] [CrossRef] [PubMed]
- Wakayama, Y.; Hayakawa, R.; Seo, H.S. Recent progress in photoactive organic field-effect transistors. Sci. Technol. Adv. Mater. 2014, 15, 024202. [Google Scholar] [CrossRef] [PubMed]
- Tavasli, A.; Gurunlu, B.; Gunturkun, D.; Isci, R.; Faraji, S. A Review on Solution-Processed Organic Phototransistors and Their Recent Developments. Electronics 2022, 11, 316. [Google Scholar] [CrossRef]
- Vega-Colado, C.; Arredondo, B.; Torres, J.C.; López-Fraguas, E.; Vergaz, R.; Martín-Martín, D.; Del Pozo, G.; Romero, B.; Apilo, P.; Quintana, X.; et al. An All-Organic Flexible Visible Light Communication System. Sensors 2018, 18, 3045. [Google Scholar] [CrossRef]
- Manousiadis, P.P.; Yoshida, K.; Turnbull, G.A.; Samuel, I.D.W. Organic semiconductors for visible light communications. Phil. Trans. R. Soc. 2020, A378, 20190186. [Google Scholar] [CrossRef]
- Griffith, M.J.; Cottam, S.; Stamenkovic, J.; Posar, J.A.; Petasecca, M. Printable Organic Semiconductors for Radiation Detection: From Fundamentals to Fabrication and Functionality. Front. Phys. 2020, 8, 22. [Google Scholar] [CrossRef]
- Zeidell, A.M.; Ren, T.; Filston, D.S.; Iqbal, H.F.; Holland, E.; Bourland, J.D.; Anthony, J.E.; Jurchescu, O.D. Organic Field-Effect Transistors as Flexible, Tissue-Equivalent Radiation Dosimeters in Medical Applications. Adv. Sci. 2020, 7, 2001522. [Google Scholar] [CrossRef] [PubMed]
- Calvi, S.; Basiricò, L.; Carturan, S.M.; Fratelli, I.; Valletta, A.; Aloisio, A.; De Rosa, S.; Pino, F.; Campajola, M.; Ciavatti, A.; et al. Flexible fully organic indirect detector for MeV proton beams. npj Flex Electron 2023, 7, 5. [Google Scholar] [CrossRef]
- Za’aba, N.K.; Morrison, J.J.; Taylor, D.M. Effect of relative humidity and temperature on the stability of DNTT transistors: A density of states investigation. Org. Electron. 2017, 45, 174–181. [Google Scholar] [CrossRef]
- Kraft, U.; Takimiya, K.; Kang, M.J.; Rödel, R.; Letzkus, F.; Burghartz, J.N.; Weber, E.; Klauk, H. Detailed analysis and contact properties of low-voltage organic thin- film transistors based on dinaphtho[2,3-b:20,30-f]thieno[3,2-b] thiophene (DNTT) and its didecyl and diphenyl derivatives. Org. Electron. 2016, 18, 33–40. [Google Scholar] [CrossRef]
- Bharti, D.; Raghuwanshi, V.; Varun, I.; Mahato, A.K.; Tiwari, S.P. Photo-Response of Low Voltage Flexible TIPS-Pentacene Organic Field-Effect Transistors. IEEE Sensors 2017, 17, 12. [Google Scholar] [CrossRef]
- Pierre, A.; Arias, A.C. Solution-processed image sensors on flexible substrates. Flex. Print. Electron. 2016, 1, 043001. [Google Scholar] [CrossRef]
- Baeg, K.-J.; Binda, M.; Natali, D.; Caironi, M.; Noh, Y.-Y. Organic Light Detectors: Photodiodes and Phototransistors. Adv. Mater. 2013, 25, 4267–4295. [Google Scholar] [CrossRef] [PubMed]
- Bai, S.; Li, R.; Huang, H.; Qi, Y.; Xu, Y.; Song, J.; Yao, F.; Sandberg, O.J.; Meredith, P.; Armin, A.; et al. Transient analysis of photomultiplication-type organic photodiodes. Appl. Phys. Rev. 2022, 9, 021405. [Google Scholar] [CrossRef]
- Ostroverkhova, O.; Shcherbyna, S.; Cooke, D.G.; Egerton, R.; Tykwinski, R.R.; Anthony, J.E.; Hegmann, F.A. Fast photoresponse in organic semiconductors: Understanding the mechanisms and structure-property relationships. In Linear and Nonlinear Optics of Organic Materials IV, Proceedings of the Optical Science and Technology, the SPIE 49th Annual Meeting, Denver, CO, USA, 2–6 August 2004; SPIE: Bellingham, WA, USA, 2004. [Google Scholar]
- Day, J.; Subramanian, S.; Anthony, J.E.; Lu, Z.; Twieg, R.J.; Ostroverkhova, O. Photoconductivity in organic thin films: From picoseconds to seconds after excitation. J. Appl. Phys. 2008, 103, 123715. [Google Scholar] [CrossRef]
- Narayan, K.S.; Kumar, N. Light responsive polymer field-effect transistor. Appl. Phys. Lett. 2001, 79, 1891. [Google Scholar] [CrossRef]
- Wasapinyokul, K.; Milne, W.I.; Chu, D.P. Photoresponse and saturation behavior of organic thin film transistors. J. Appl. Phys. 2009, 105, 024509. [Google Scholar]
- Huang, W.; Yang, B.; Sun, J.; Liu, B.; Yang, J.; Zou, Y.; Xiong, J.; Zhou, C.; Gao, Y. Organic field-effect transistor and its photoresponse using a benzo[1,2-b:4,5-b0]difuran-based donor–acceptor conjugated polymer. Org. Electron. 2014, 15, 1050–1055. [Google Scholar] [CrossRef]
- Kösemen, Z.A.; Kösemen, A.; Öztürk, S.; Canımkurbey, B.; Erkovan, M.; Yerli, Y. Performance improvement in photosensitive organic field effect transistor by using multi-layer structure. Thin Solid Films 2019, 672, 90–99. [Google Scholar] [CrossRef]
- Zhong, J.; Wu, X.; Lan, S.; Fang, Y.; Chen, H.; Guo, T. High Performance Flexible Organic Phototransistors with Ultrashort Channel Length. ACS Photonics 2018, 5, 3712–3722. [Google Scholar] [CrossRef]
- Za’aba, N.K.; Taylor, D.M. Photo-induced effects in organic thin film transistors based on dinaphtho [2,3-b:2′,3′-f] Thieno[3,2-b′] thiophene (DNTT). Org. Electron. 2019, 65, 39–48. [Google Scholar] [CrossRef]
- Milvich, J.; Zaki, T.; Aghamohammadi, M.; Rödel, R.; Kraft, U.; Klauk, H.; Burghartz, J.N. Flexible low-voltage organic phototransistors based on air-stable dinaphtho[2,3-b:20,30-f]thieno[3,2-b]thiophene (DNTT). Org. Electron. 2015, 20, 63–68. [Google Scholar] [CrossRef]
- Yu, F.; Wu, S.; Wang, X.; Zhang, G.; Lu, H.; Qiu, L. Flexible and low-voltage organic phototransistor. RSC Adv. 2017, 7, 11572. [Google Scholar] [CrossRef]
- Calvi, S.; Rapisarda, M.; Valletta, A.; Scagliotti, M.; De Rosa, S.; Tortora, L.; Branchini, P.; Mariucci, L. Highly sensitive organic phototransistor for flexible optical detector arrays. Organic Electronics 2022, 102, 106452. [Google Scholar] [CrossRef]
- Becharguia, H.; Mahdouani, M.; Bourguiga, R.; Branchini, P.; Fabbri, A.; De Rosa, S.; Calvi, S.; Mariucci, L.; Valletta, A.; Tortora, L. Effects of illumination on the electrical characteristics in organic thin-film transistors based on dinaphtho [2,3-b:2′,3′-f] thieno[3,2-b] thiophene (DNTT): Experiment and modeling. Synthetic Metals 2022, 283, 116985. [Google Scholar] [CrossRef]
- Available online: https://www.manualslib.com/manual/1273314/Agilent-Technologies-B1500a.html?page=34#manual (accessed on 10 January 2023).
- Klauk, H. Organic thin-film transistors. Chem. Soc. Rev. 2010, 39, 2643–2666. [Google Scholar] [CrossRef]
- Jia, R.; Wu, X.; Deng, W.; Zhang, X.; Huang, L.; Niu, K.; Chi, L.; Jie, J. Unraveling the Mechanism of the Persistent Photoconductivity in Organic Phototransistors. Adv. Funct. Mater. 2019, 29, 1905657. [Google Scholar] [CrossRef]
- Jin, Z.; Gao, L.; Zhou, Q.; Wang, J. High-performance flexible ultraviolet photoconductors based on solutionprocessed ultrathin ZnO/Au nanoparticle composite films. Sci. Rep. 2015, 4, 4268. [Google Scholar]
- Sun, Z.; Liu, Z.; Li, J.; Tai, G.; Lau, S.; Yan, F. Infrared Photodetectors Based on CVD-Grown Graphene and PbS Quantum Dots with Ultrahigh Responsivity. Adv. Mater. 2012, 24, 5878–5883. [Google Scholar] [CrossRef]
- Dey, A.; Singh, A.; Das, D.; Iyer, P.K. Photosensitive organic field effect transistors: The influence of ZnPc morphology and bilayer dielectrics for achieving a low operating voltage and low bias stress effect. Phys. Chem. Chem. Phys. 2016, 18, 32602–32609. [Google Scholar] [CrossRef] [PubMed]
- Bhargava, K.; Singh, V. High-sensitivity organic phototransistors prepared by floating film transfer method. APEX 2016, 9, 091601. [Google Scholar] [CrossRef]
- Simoen, E.; Claeys, C. Random Telegraph Signals in Semiconductor Devices; IOP Publishing: Bristol, UK, 2016. [Google Scholar]
- Singh, S.; Mohapatra, Y.N. Persistent photocurrent (PPC) in solution-processed organic thin film transistors: Mechanisms of gate voltage control. J. Appl. Phys. 2016, 120, 045501. [Google Scholar] [CrossRef]
- Lutsyk, P.; Janus, K.; Mikołajczyk, M.; Sworakowski, J.; Boratyński, B.; Tłaczała, M. Long-lived persistent currents in poly(3-octylthiophene) thin film transistors. Org. Electron. 2010, 11, 490–497. [Google Scholar] [CrossRef]
- Kösemen, Z.A.; Kösemen, A.; Öztürk, S.; Canimkurbey, B.; San, S.E.; Yerli, Y.; Tunç, A.V. Effect of intrinsic polymer properties on the photo sensitive organic field-effect transistors (Photo-OFETs). Microelectron. Eng. 2016, 161, 36–42. [Google Scholar] [CrossRef]
- Mullenbach, T.K.; Curtin, I.J.; Zhang, T.; Holmes, R.J. Probing dark exciton diffusion using photovoltage. Nat. Commun. 2017, 8, 14215. [Google Scholar] [CrossRef]
- Street, R.A.; Yang, Y.; Thompson, B.C.; McCulloch, I. Capacitance Spectroscopy of Light Induced Trap States in Organic Solar Cells. J. Phys. Chem. C 2016, 120, 22169–22178. [Google Scholar] [CrossRef]
- Hamilton, M.C.; Martin, S.; Kanicki, J. Thin-Film organic polymer phototransistors. IEEE Trans. Electron. Dev. 2004, 51, 877–885. [Google Scholar] [CrossRef]
Disclaimer/Publisher’s Note: The statements, opinions and data contained in all publications are solely those of the individual author(s) and contributor(s) and not of MDPI and/or the editor(s). MDPI and/or the editor(s) disclaim responsibility for any injury to people or property resulting from any ideas, methods, instructions or products referred to in the content. |
© 2023 by the authors. Licensee MDPI, Basel, Switzerland. This article is an open access article distributed under the terms and conditions of the Creative Commons Attribution (CC BY) license (https://creativecommons.org/licenses/by/4.0/).