
Load Estimation of Moving Passenger Cars Using Inductive-Loop Technology

 , , ,
, , , 
Abstract
:1. Introduction
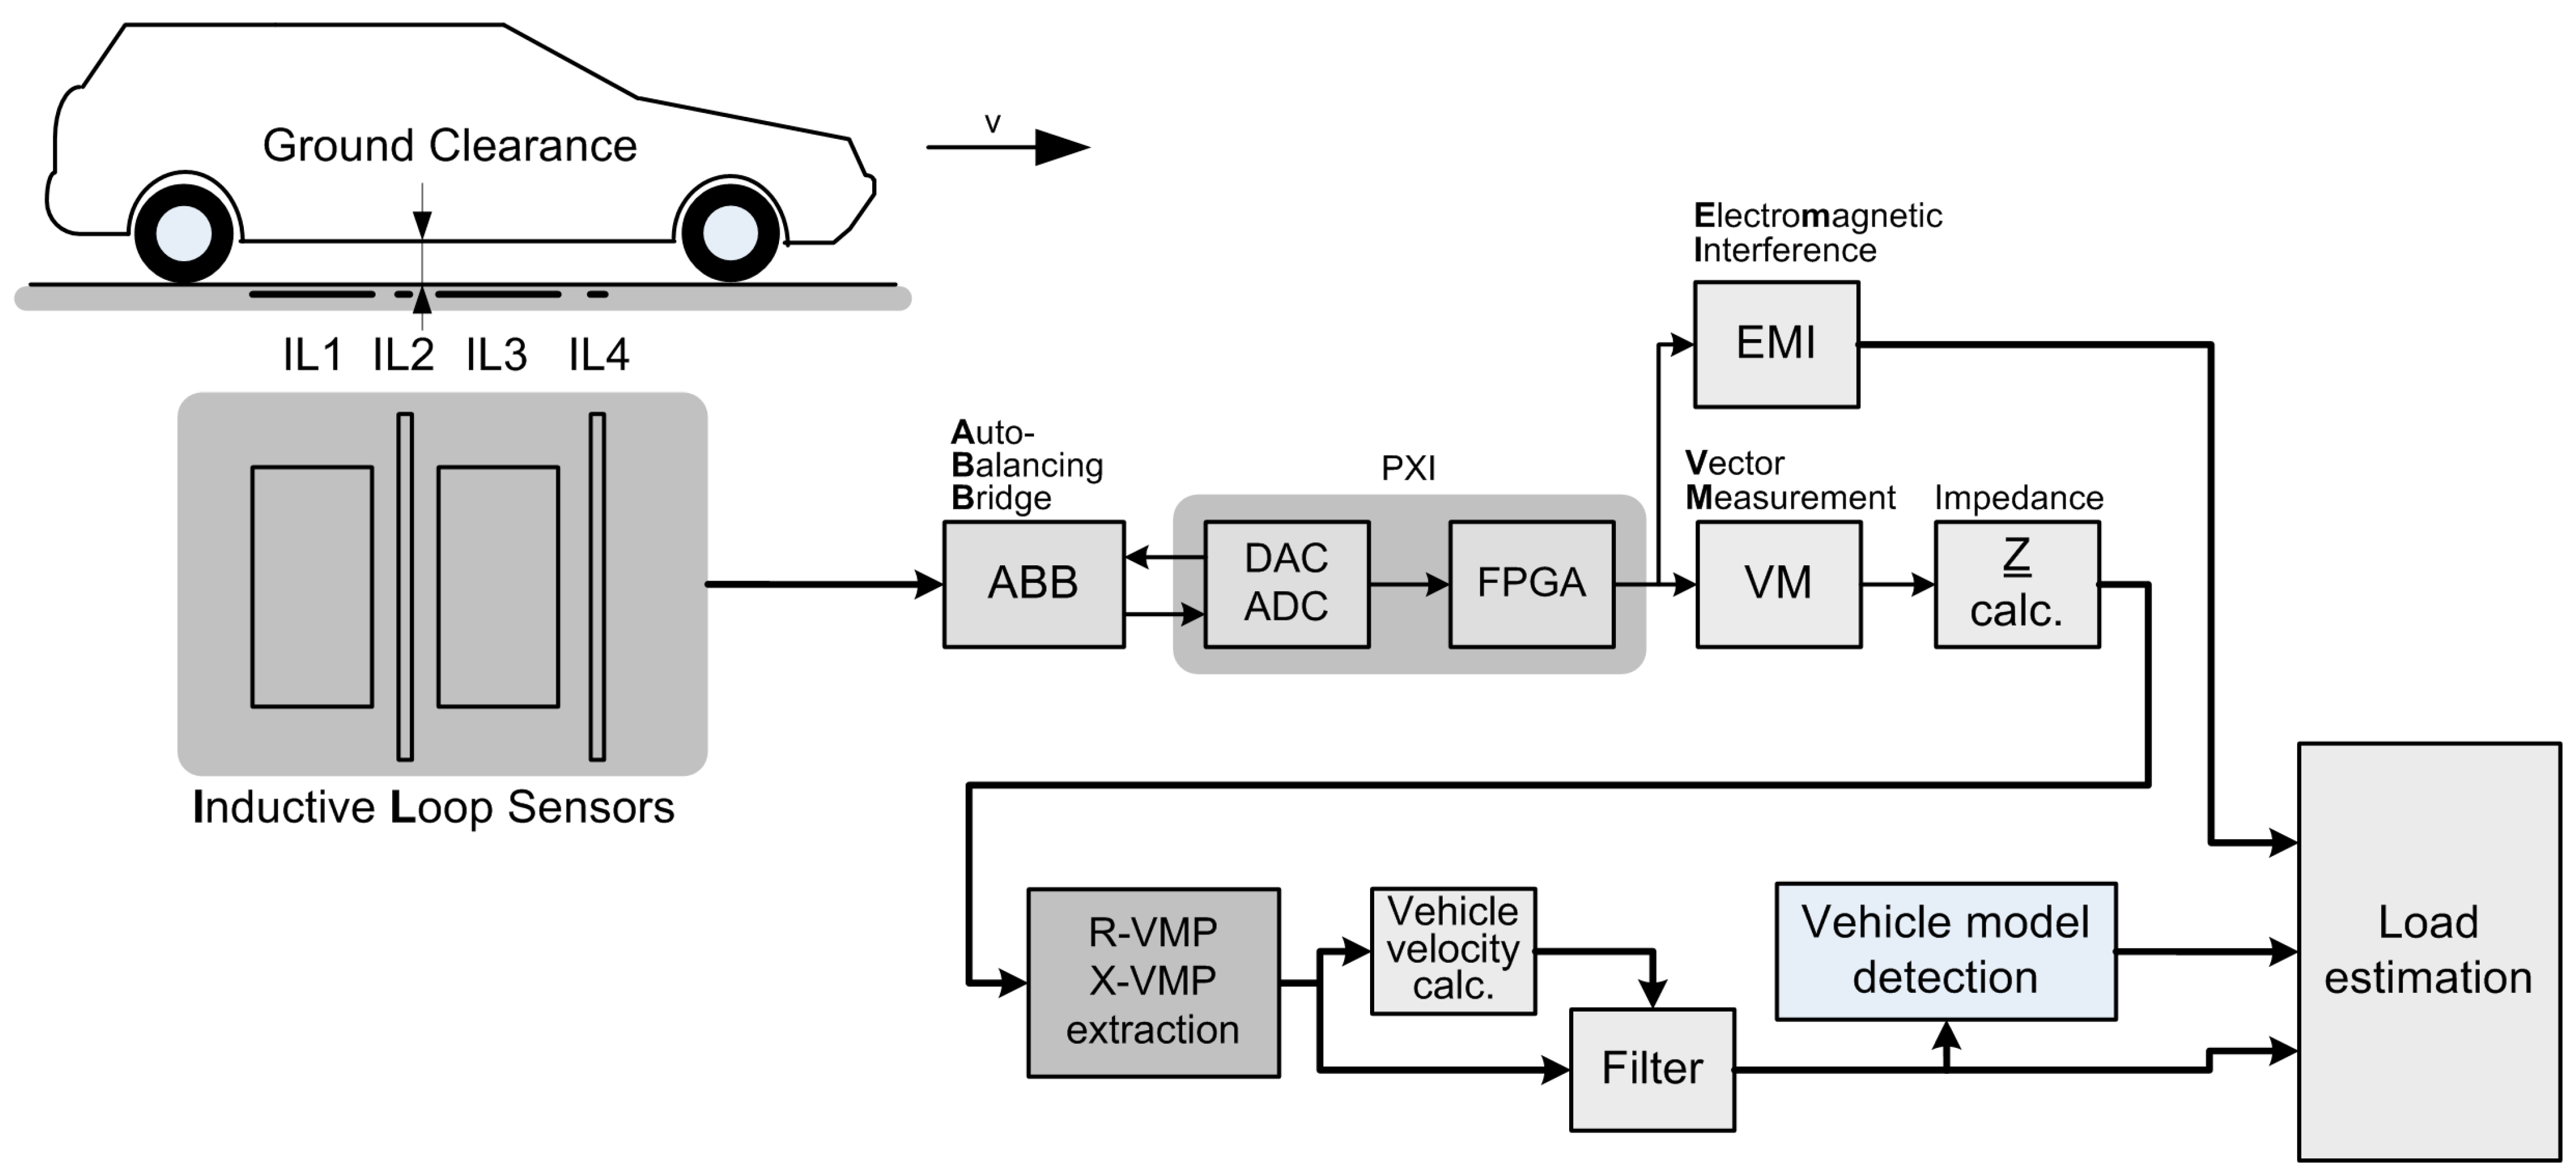
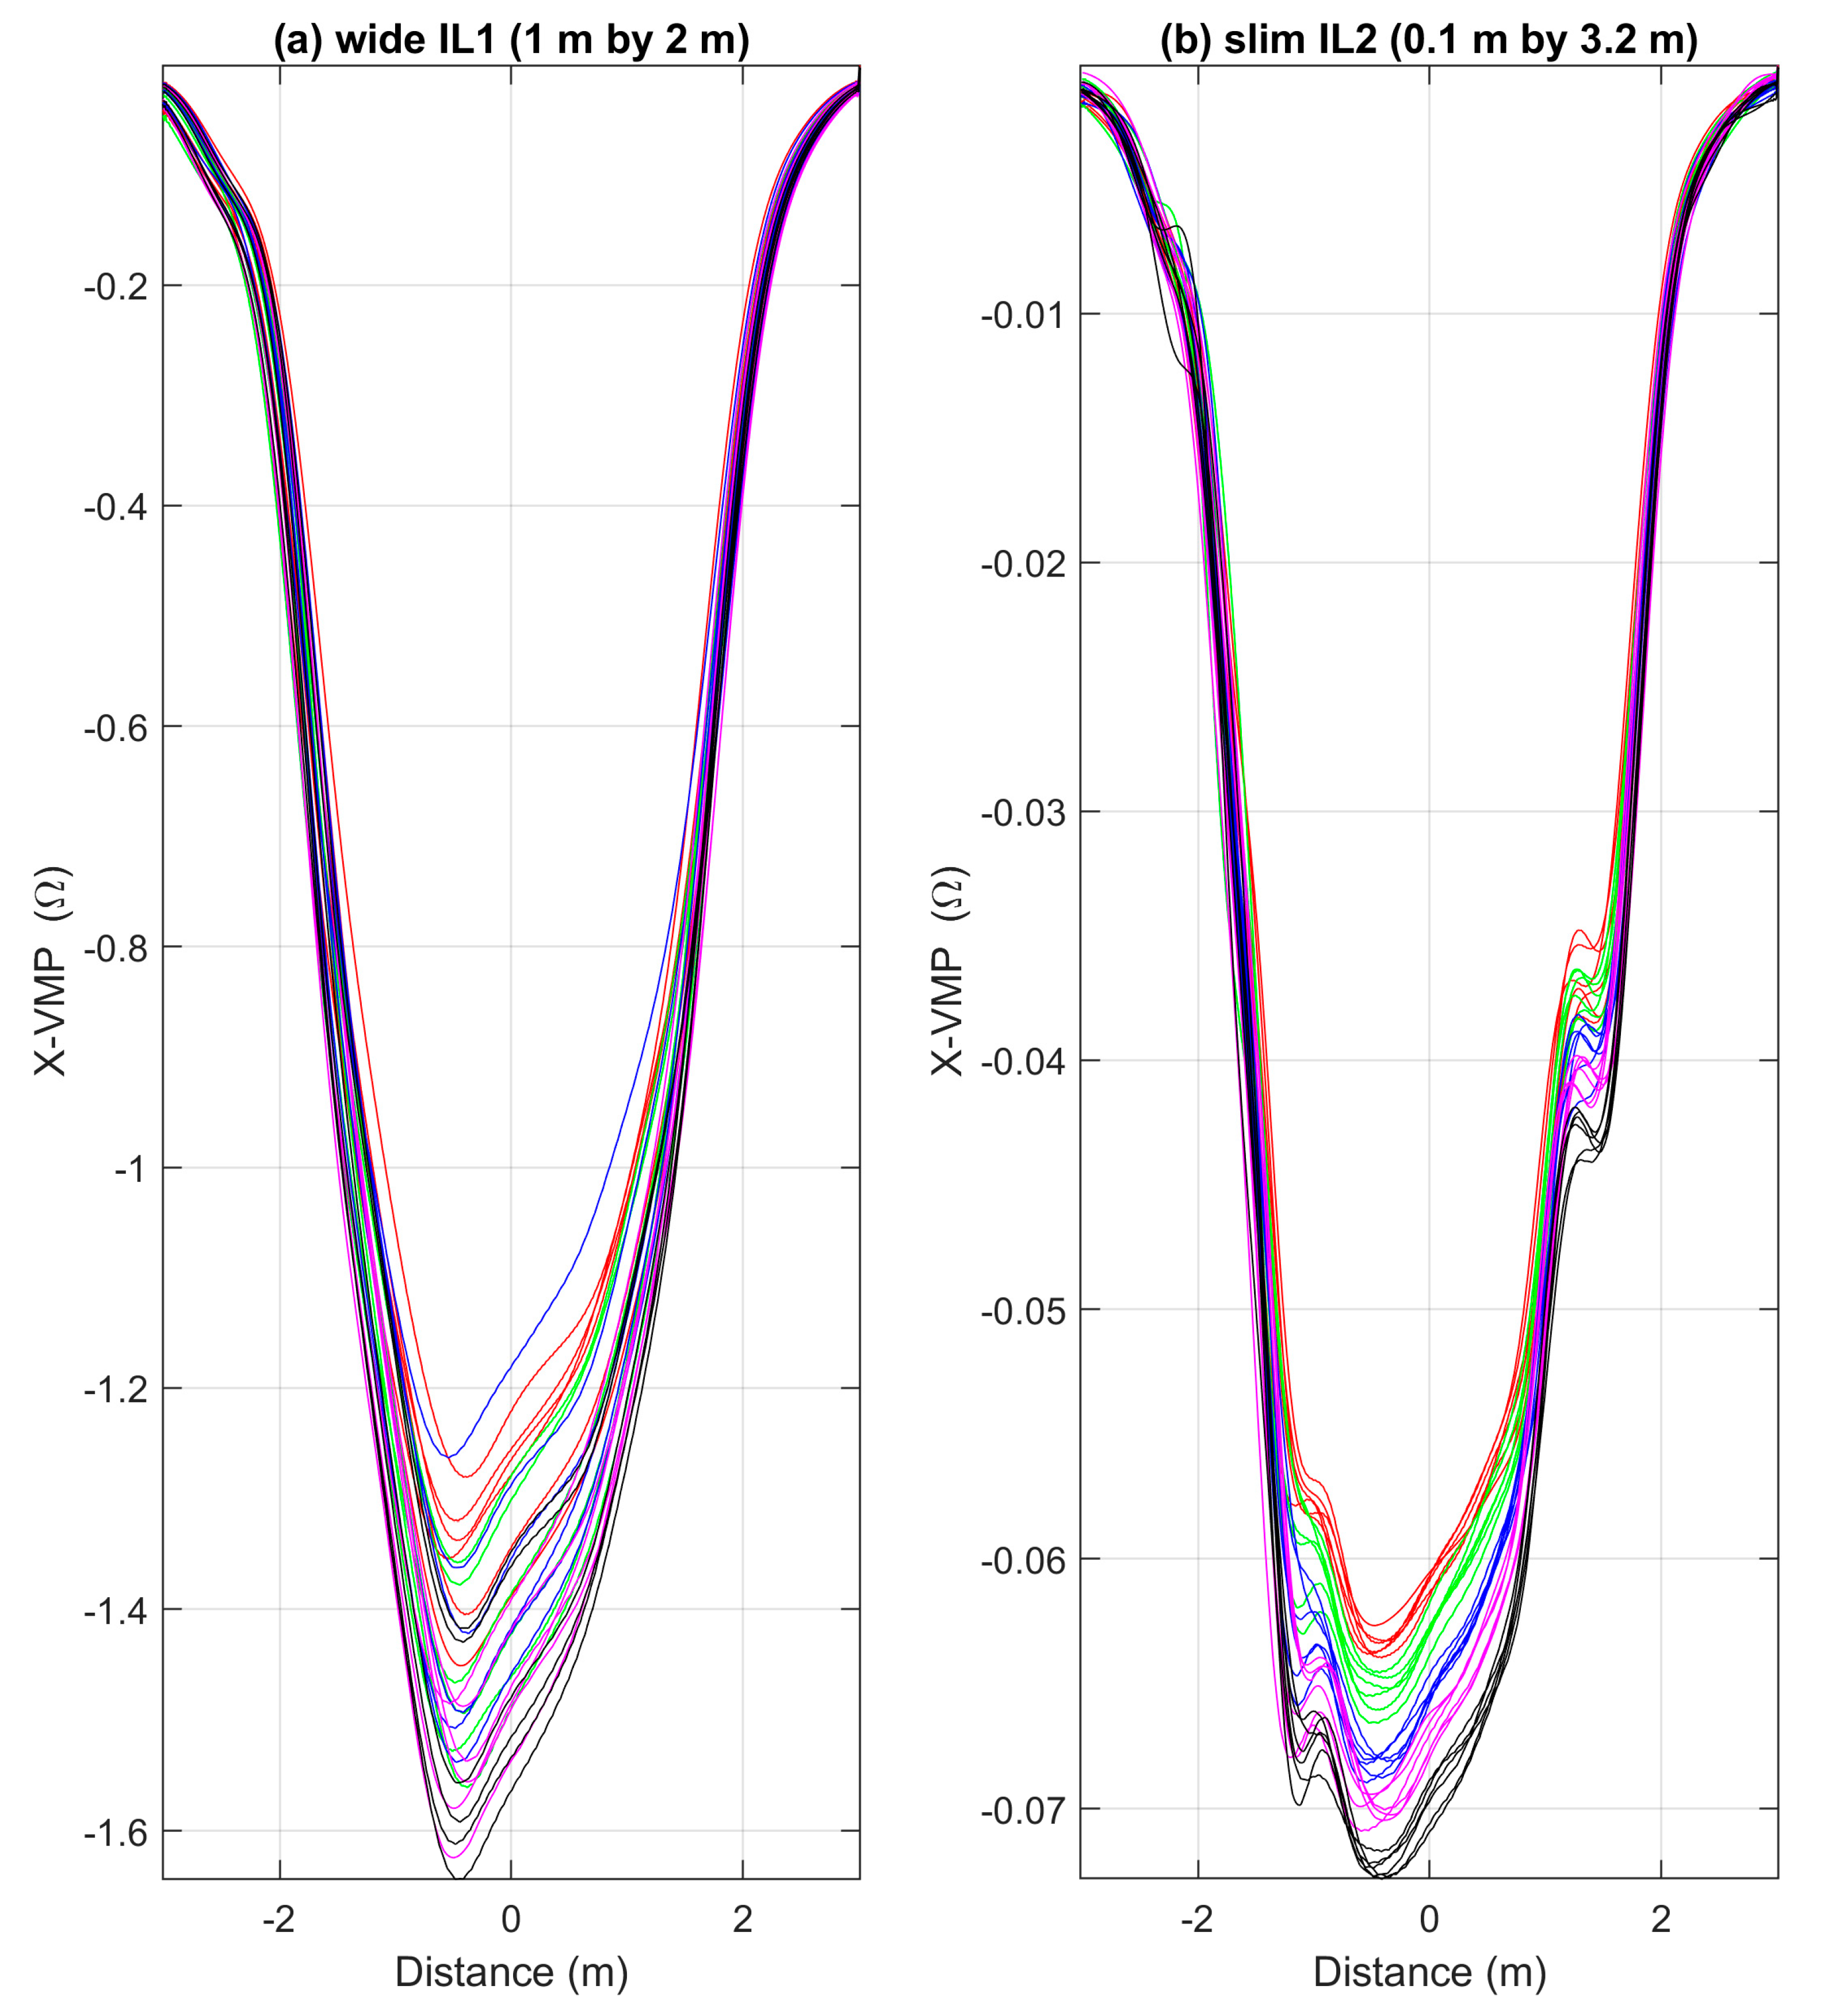
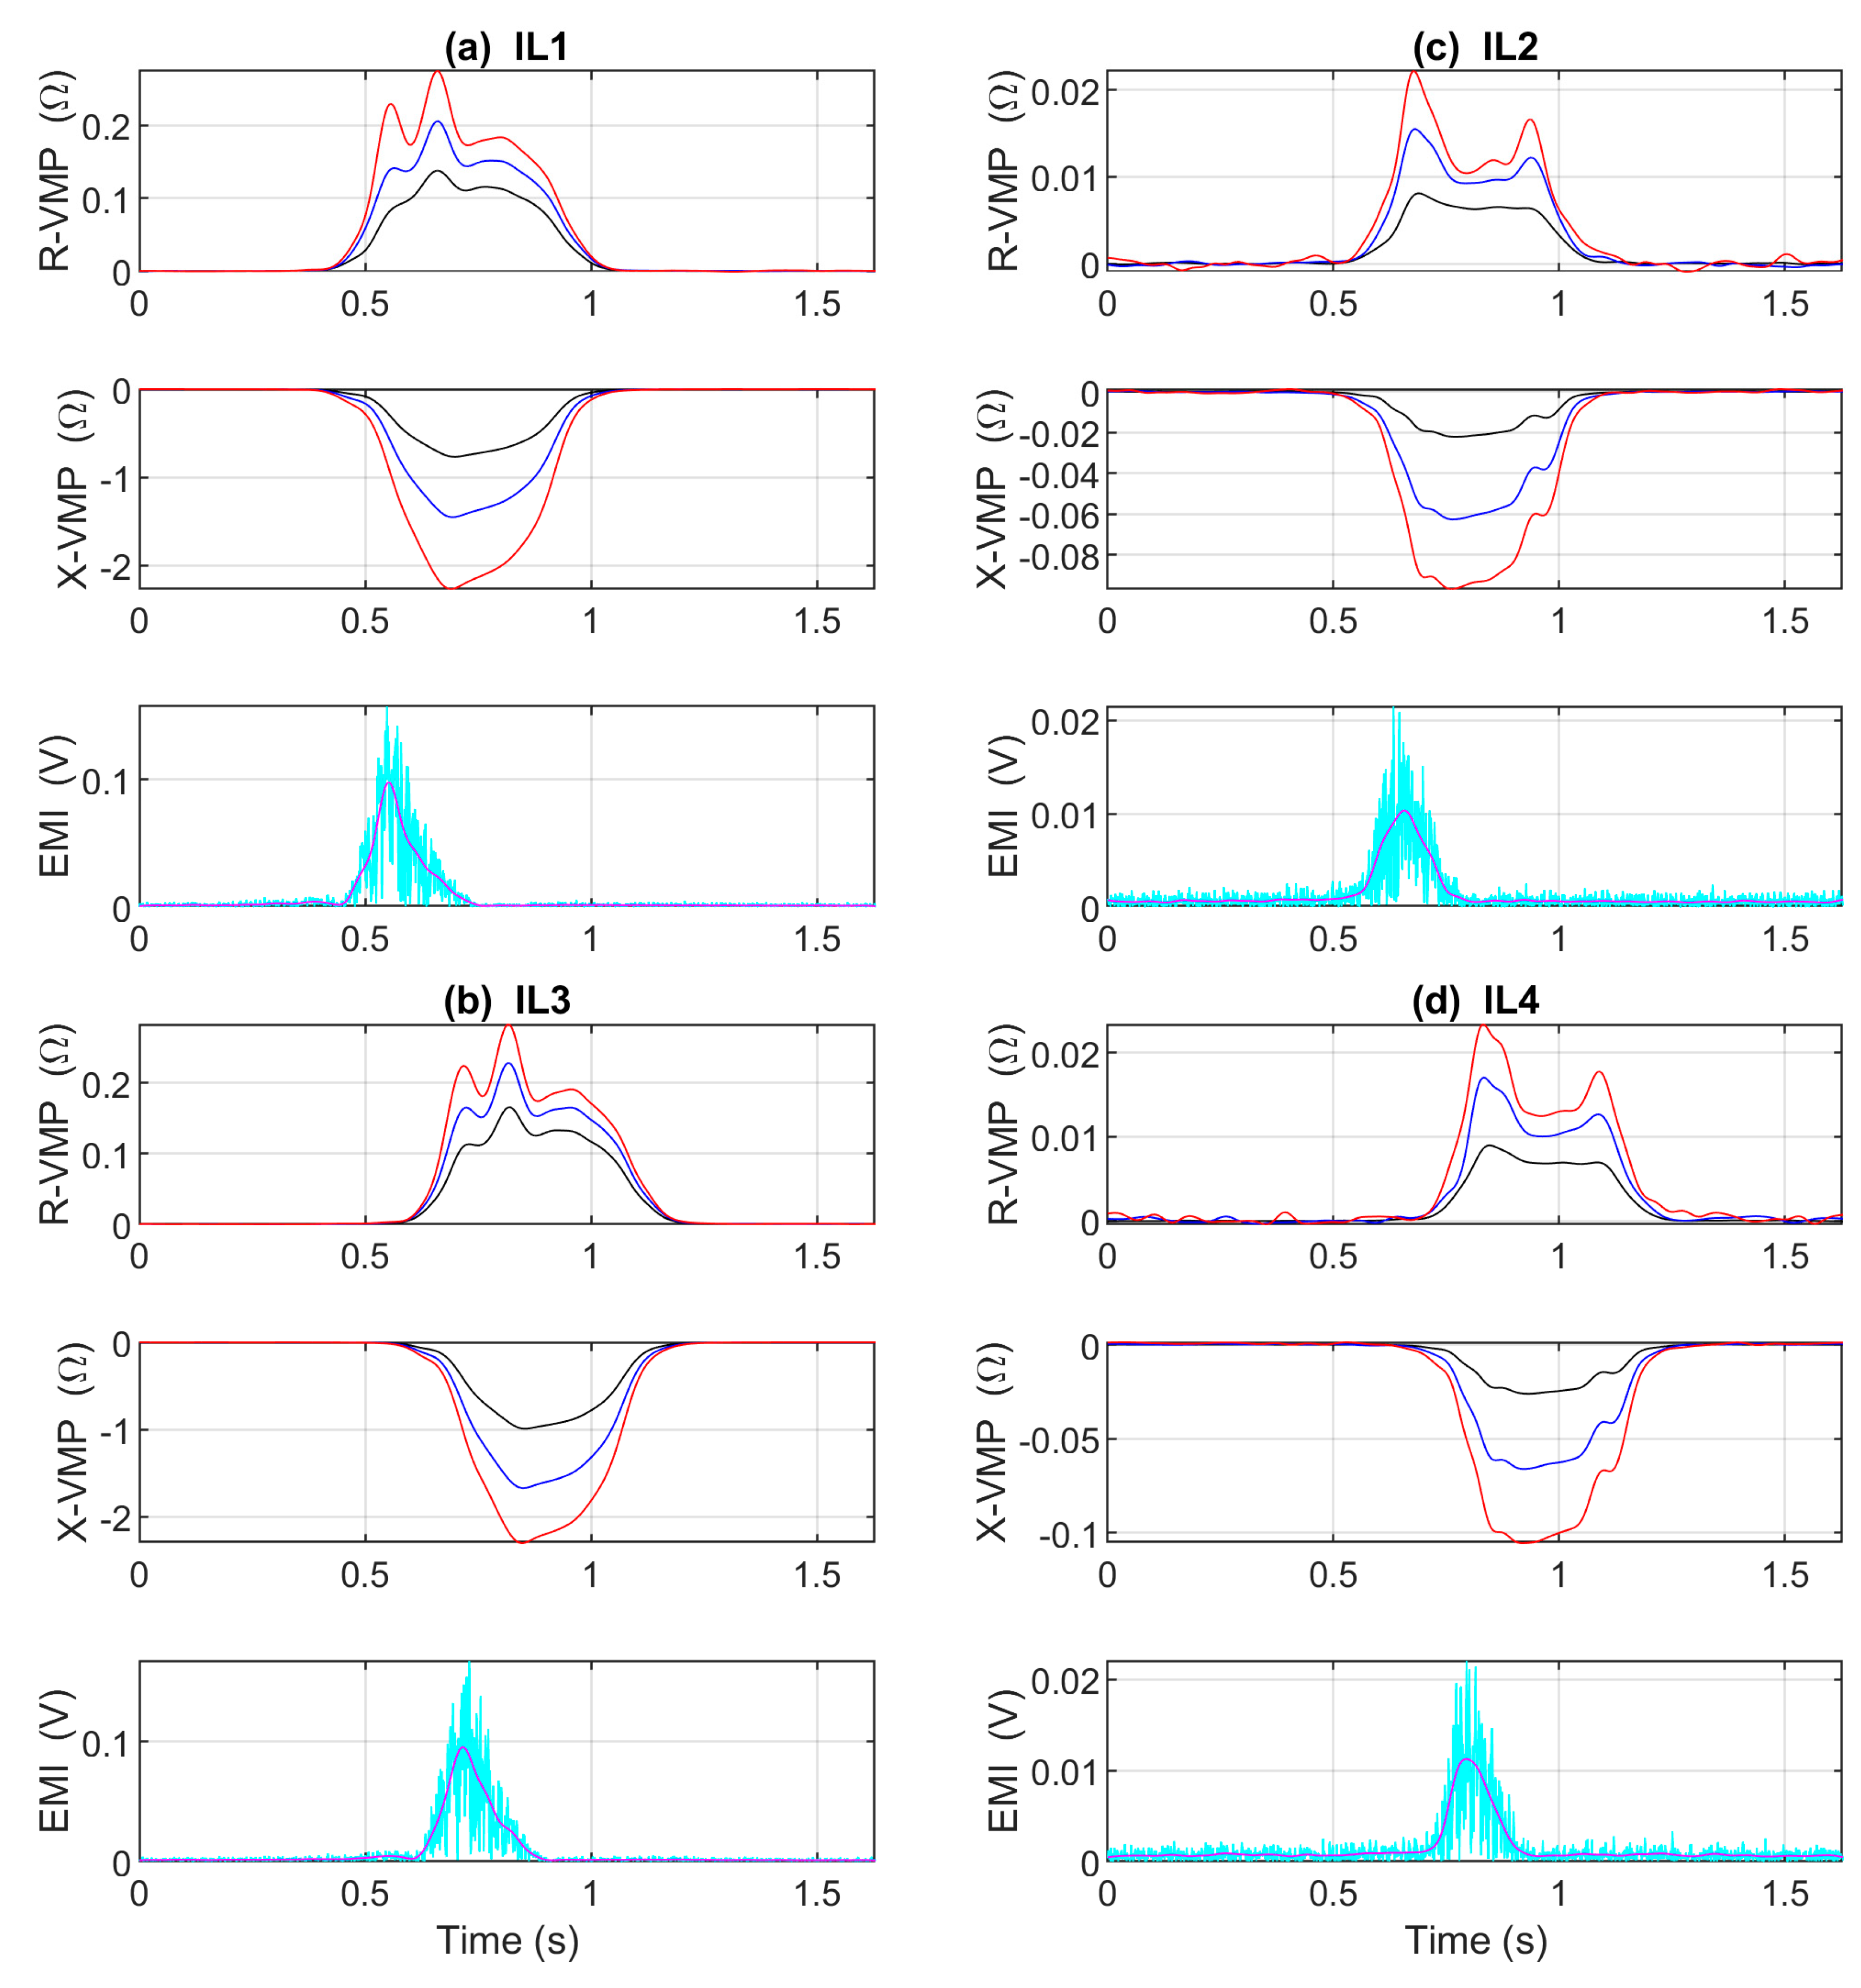
2. Measurement System
3. Experiment
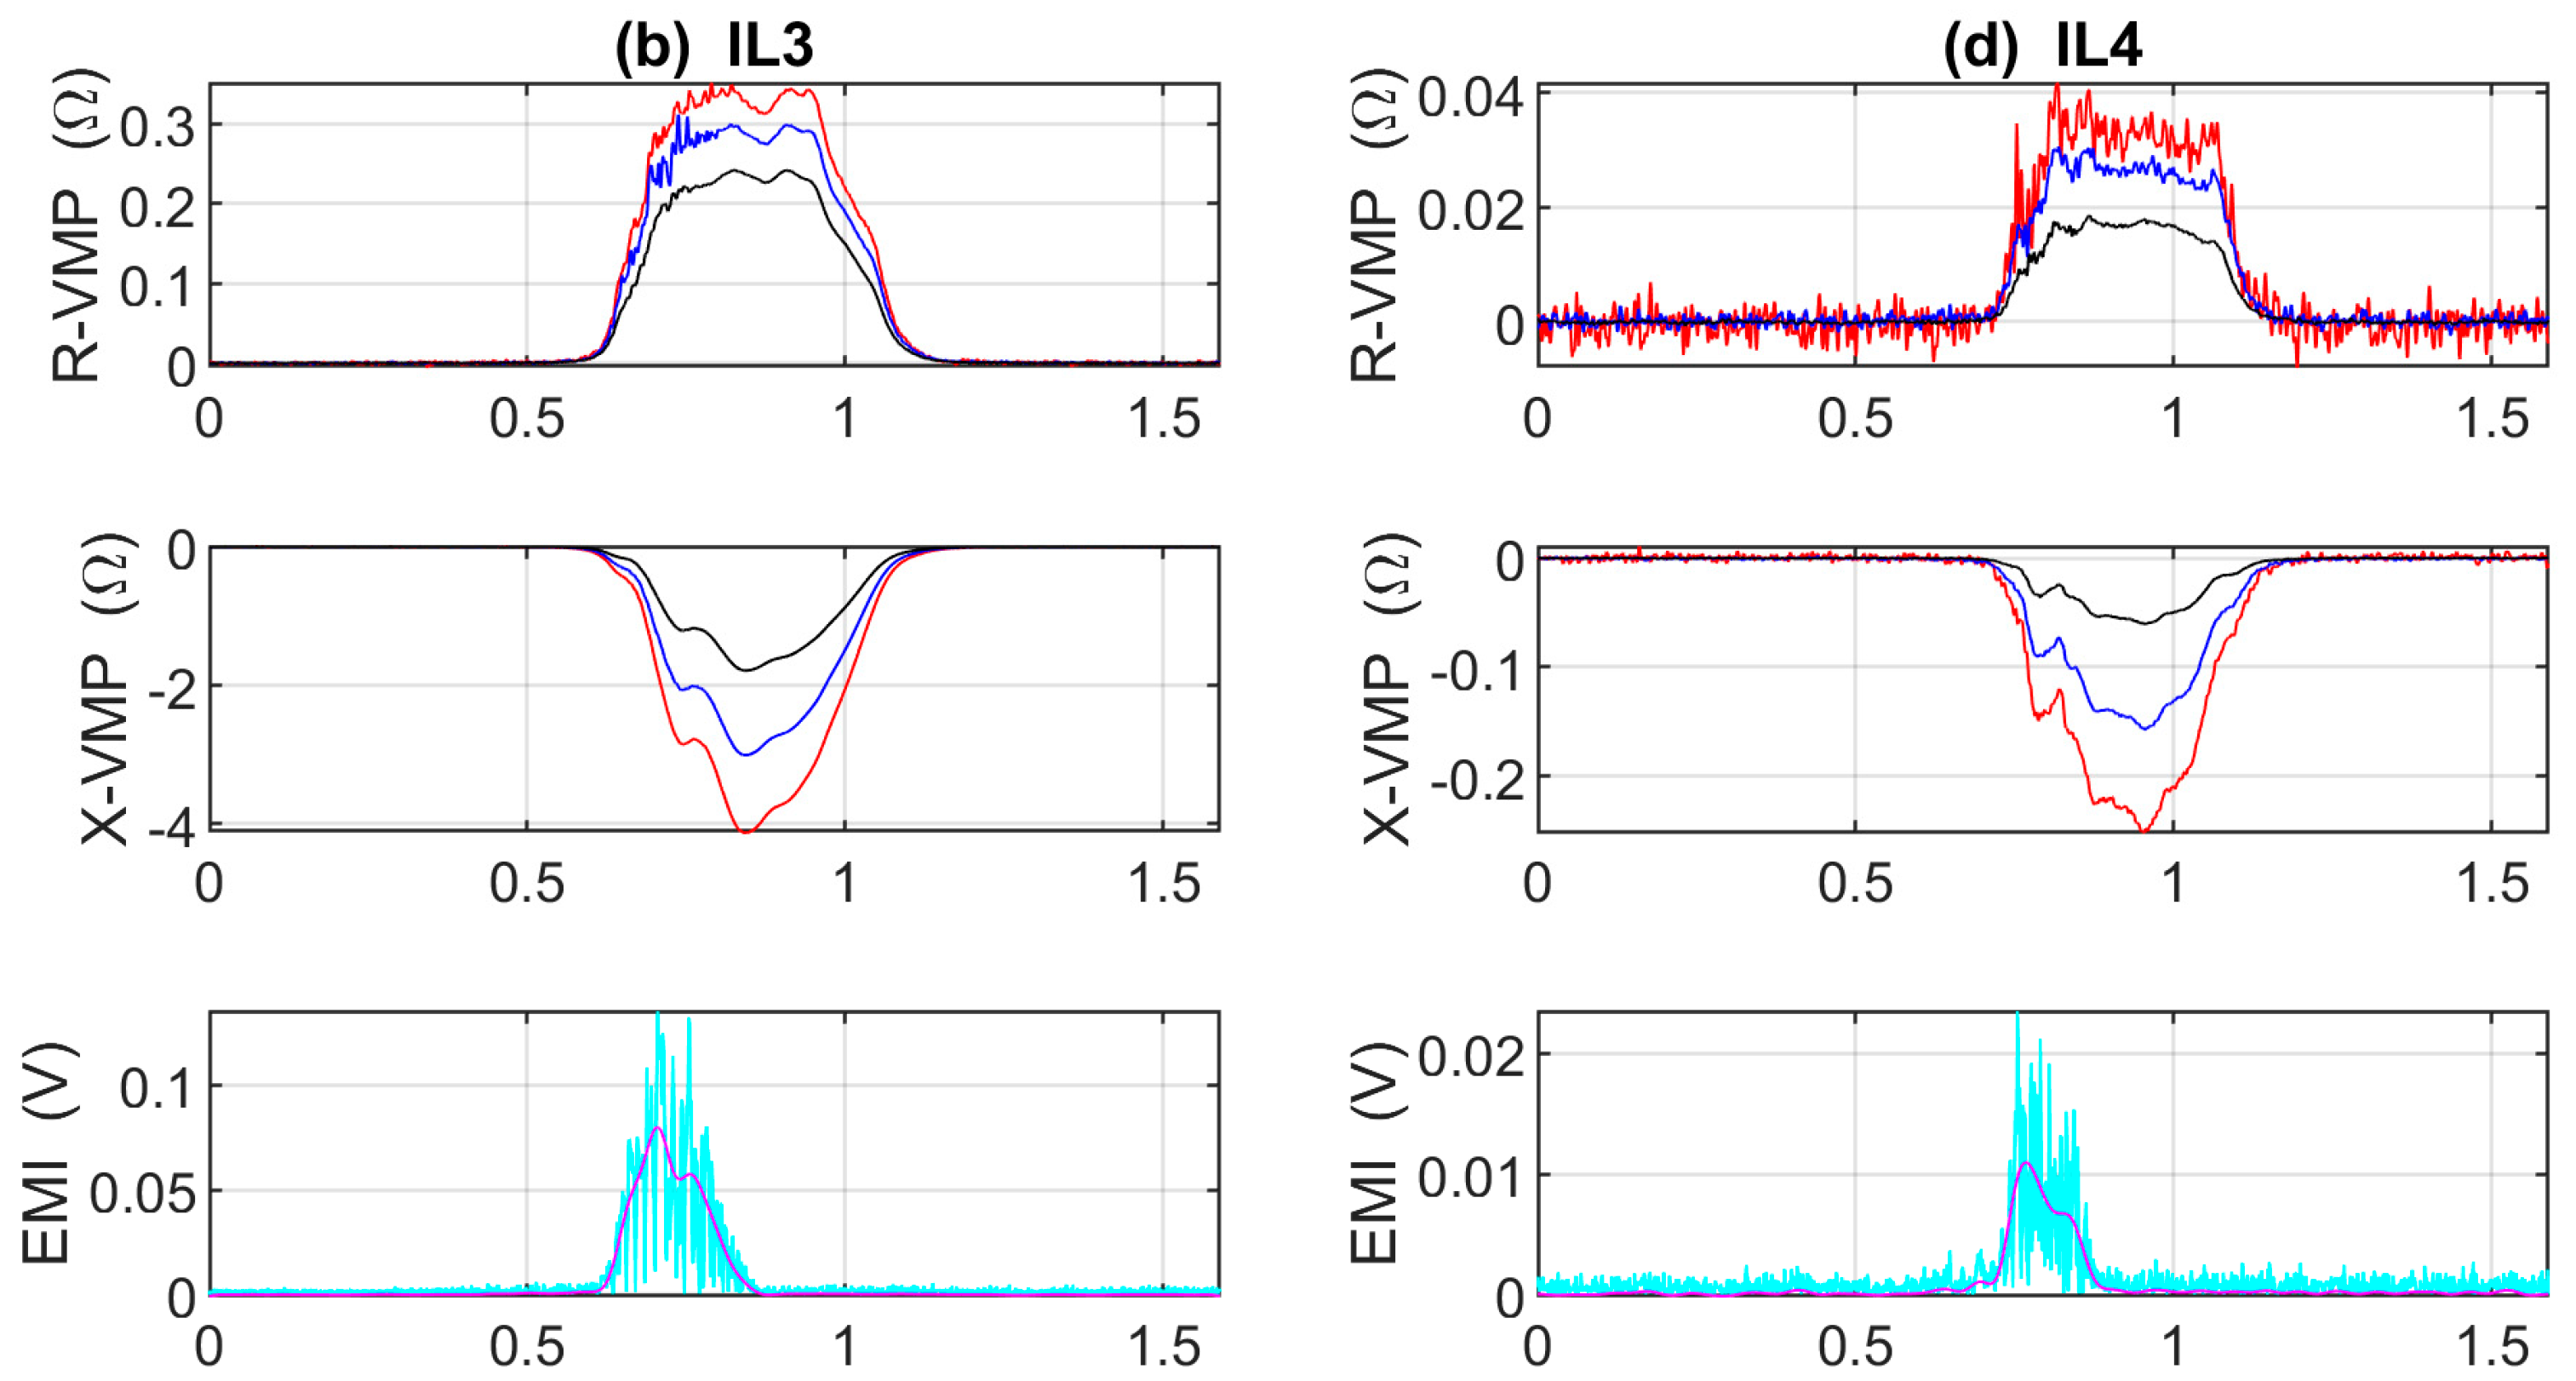
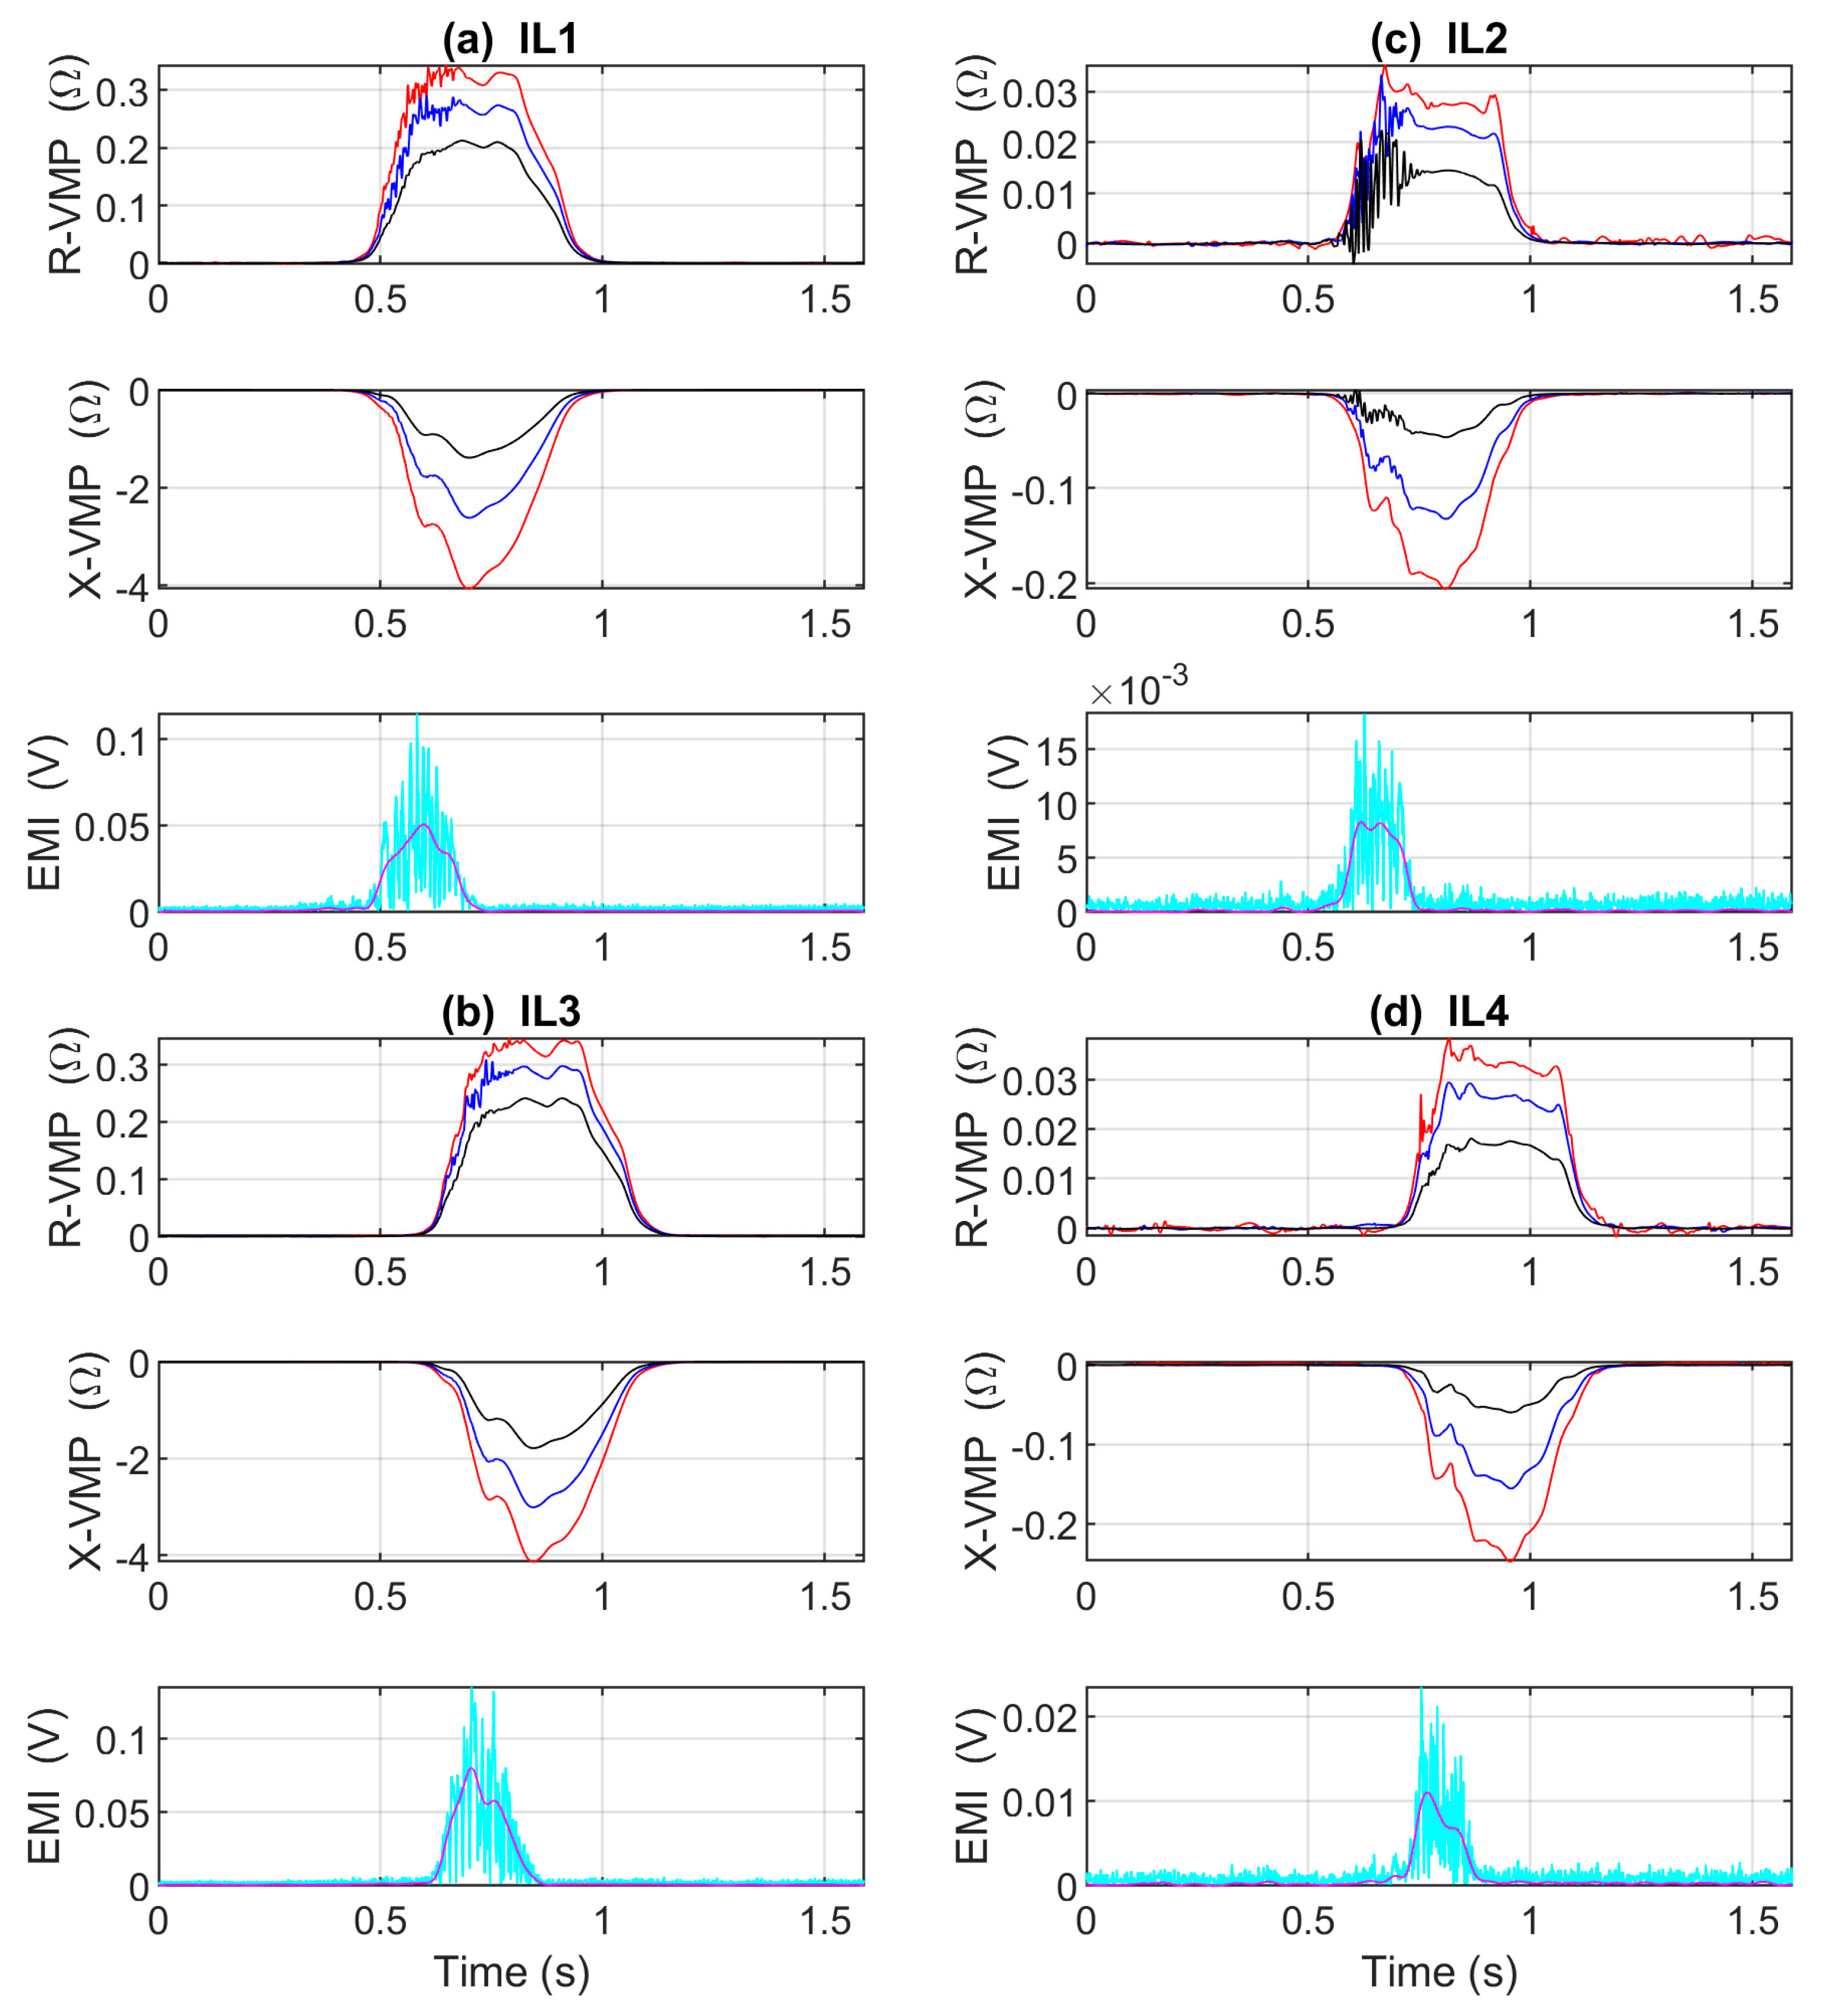
4. Results
5. Discussion
6. Conclusions
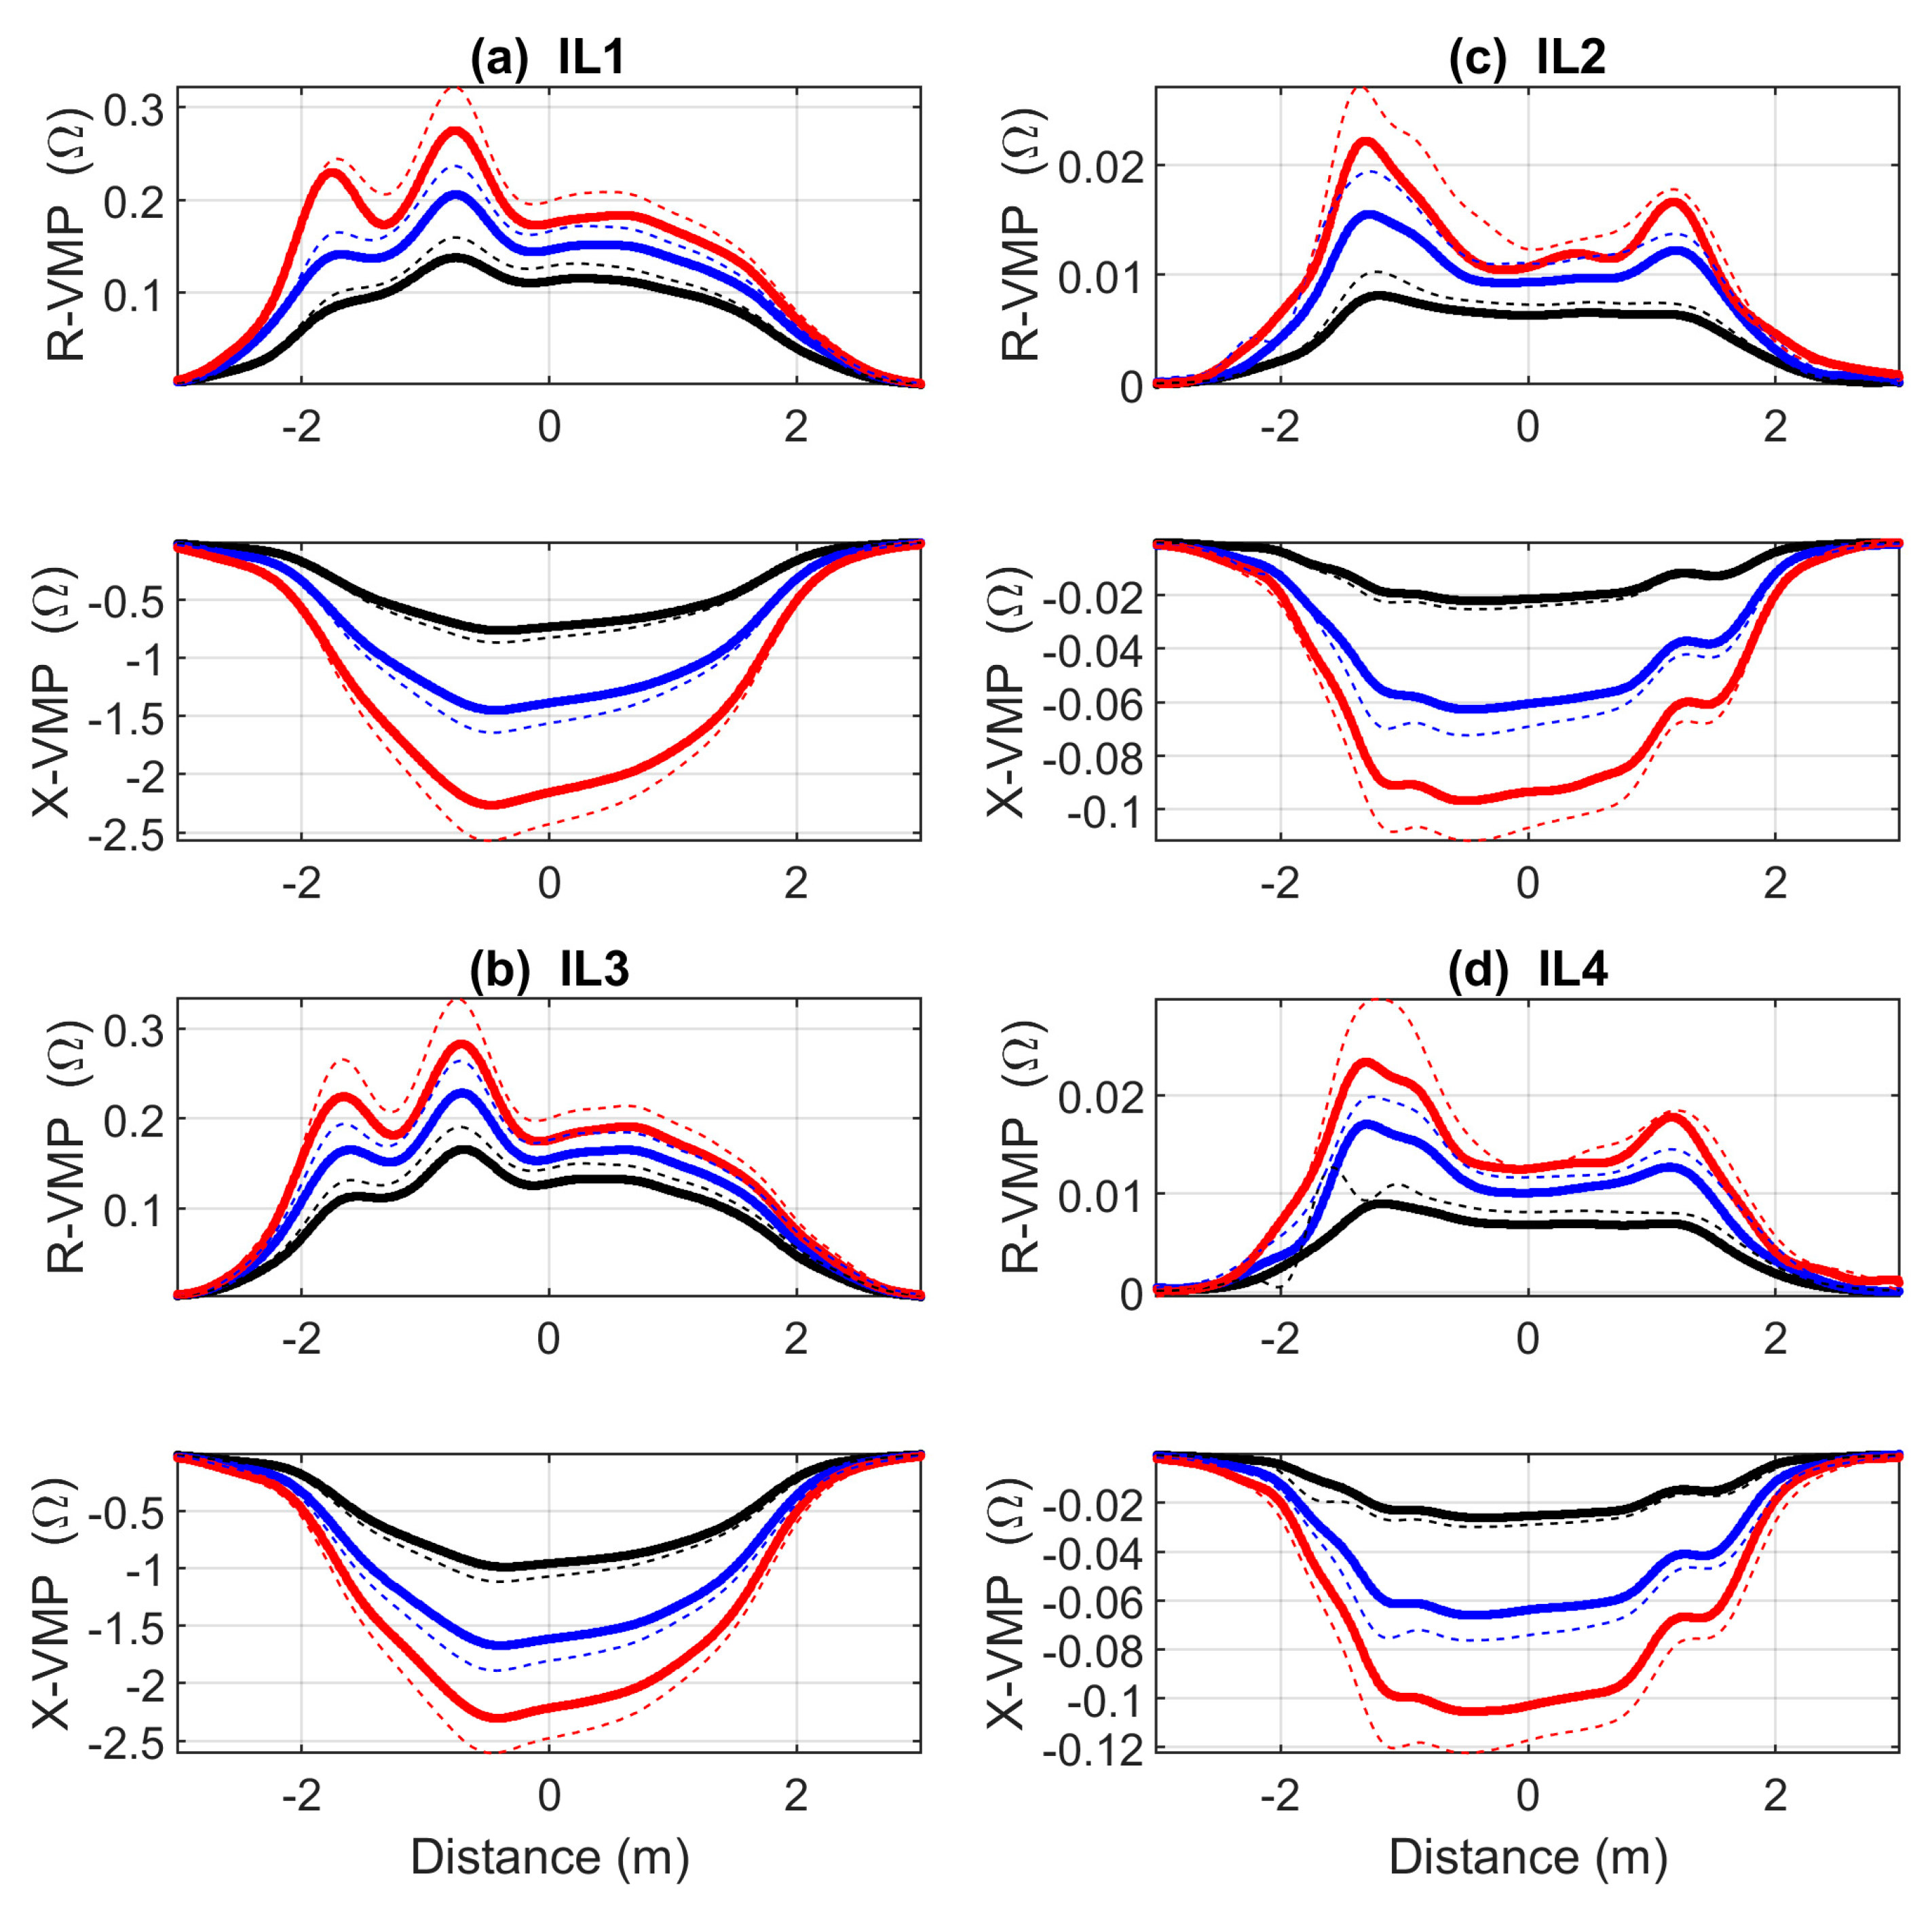
- Enables obtaining multi-frequency VMPs representing changes in the IL sensor impedance component;
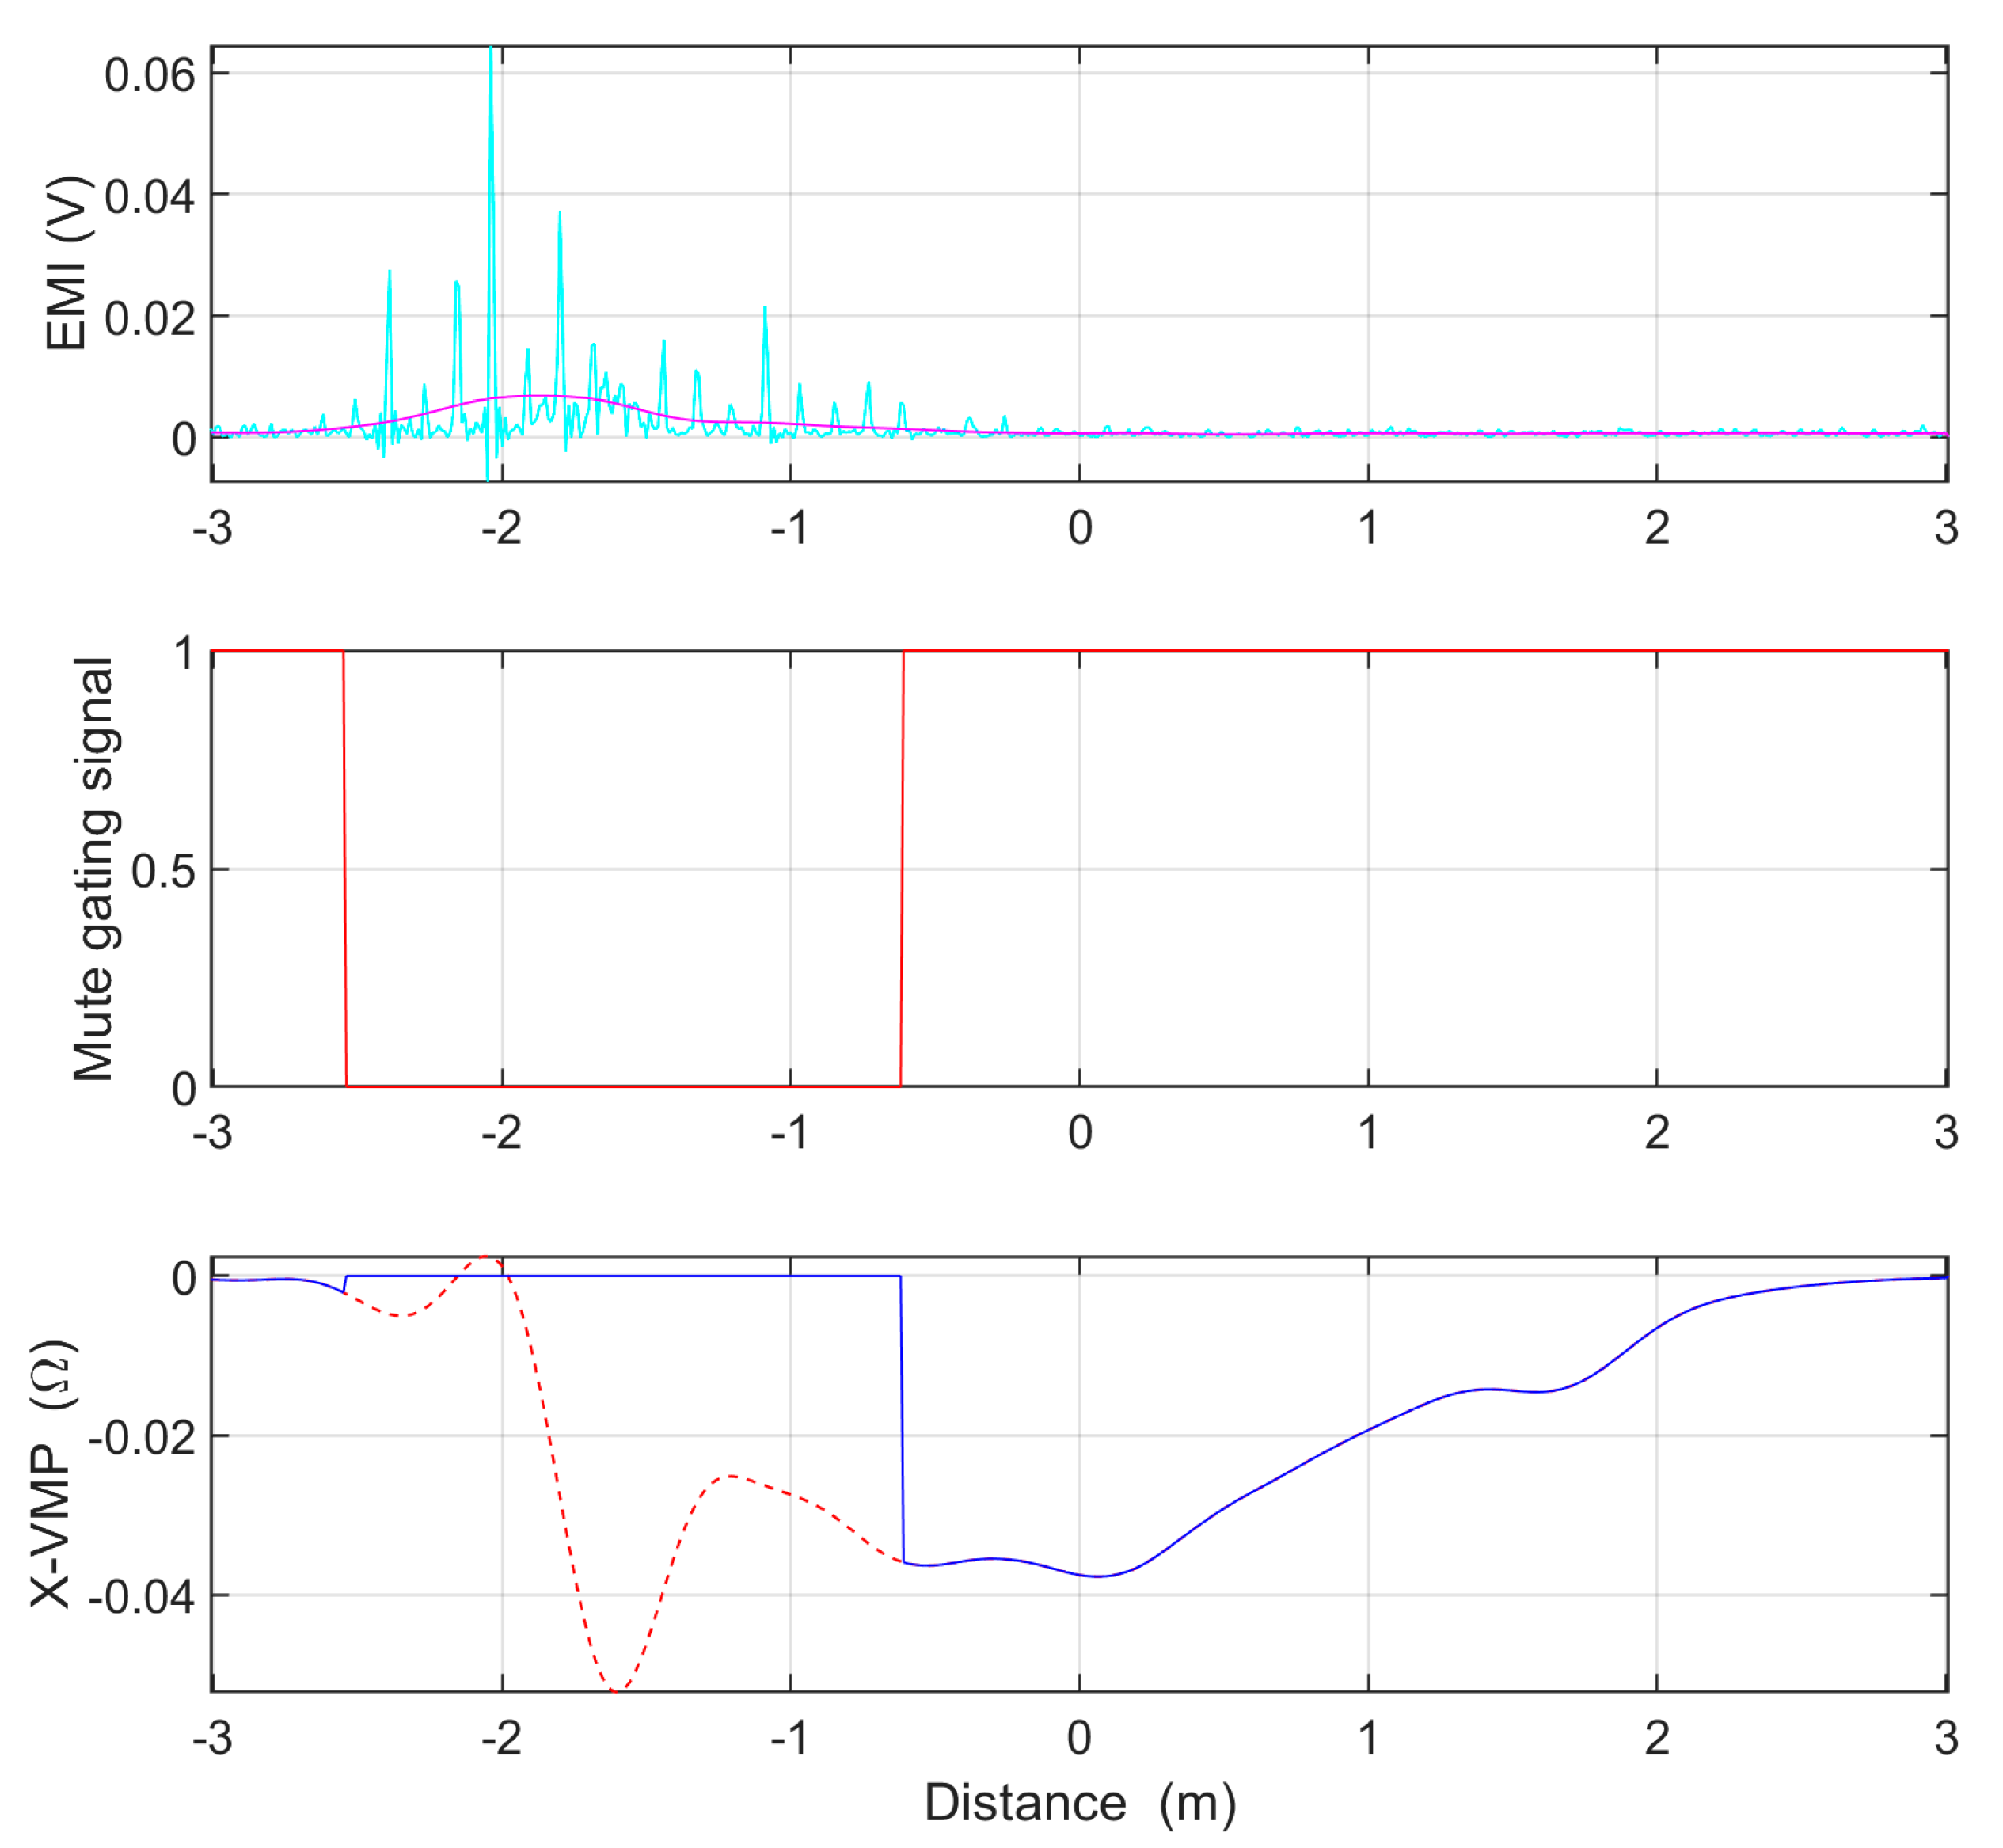
- Allows the capture of the EMI of a car drive;
- Allows the use of EMI to indicate and mute disturbances in the VMP;
- Allows for reliable identification of the car model;
- For cars where the clearance depends on the load, slim IL sensors enables rough estimation of the load.
Author Contributions
Funding
Institutional Review Board Statement
Informed Consent Statement
Data Availability Statement
Conflicts of Interest
Abbreviations
| IL | Inductive Loop |
| ABB | Auto Balancing Bridge |
| MFIM | Multi-frequency Impedance Measurement |
| VMP | Vehicle Magnetic Profile |
| R-VMP | Resistance VMP |
| X-VMP | Reactance VMP |
| EMI | Electromagnetic Interference |
| WIM | Weigh in Motion |
Appendix A


Appendix B

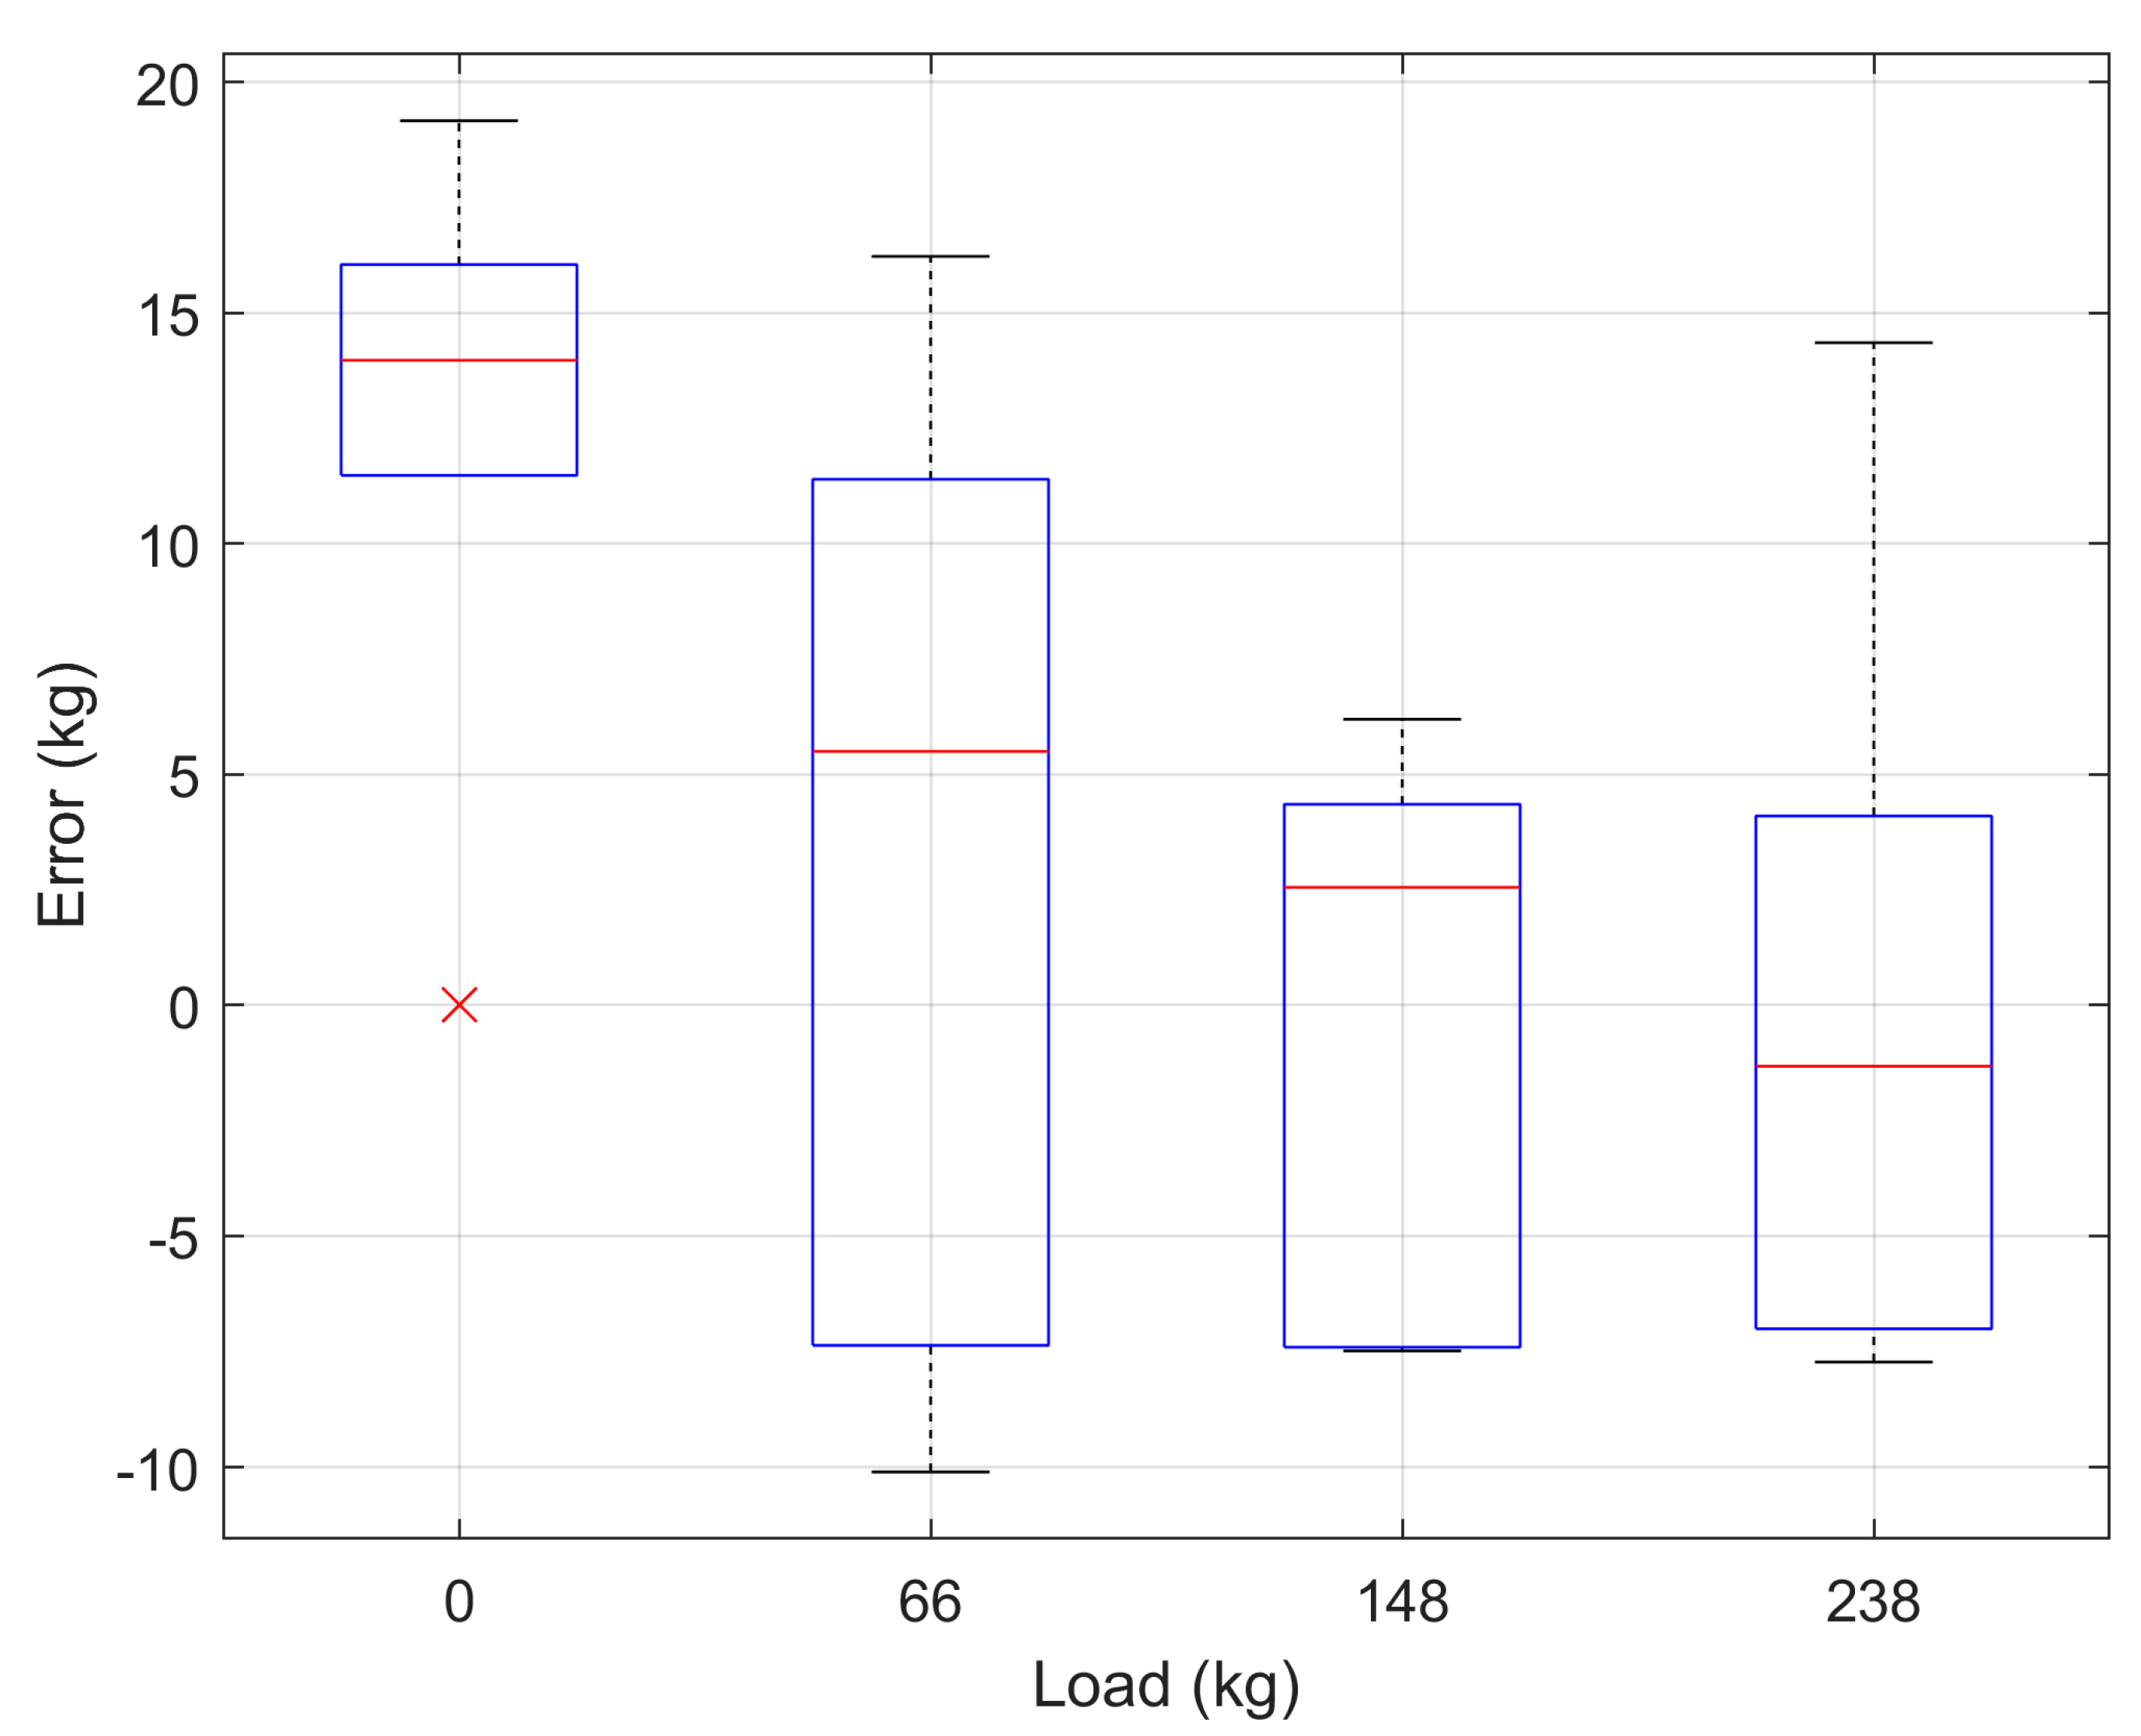
| Load (kg) | Load Parameter (Ω) | Load Estimation (kg) | Error (kg) |
|---|---|---|---|
| 0 | 0.144270 | 5.611 | 5.611 |
| 0.145538 | 2.889 | 2.889 | |
| 0.144594 | 3.436 | 3.436 | |
| 0.145481 | 2.512 | 2.512 | |
| 0.144370 | 4.939 | 4.939 | |
| 0.144869 | 1.593 | 1.593 | |
| 73 | 0.155279 | 68.185 | −4.815 |
| 0.156426 | 75.868 | 2.868 | |
| 0.154817 | 65.087 | −7.913 | |
| 0.156938 | 79.305 | 6.305 | |
| 0.155116 | 67.089 | −5.911 | |
| 0.156728 | 77.895 | 4.895 | |
| 149 | 0.167596 | 150.738 | 1.738 |
| 0.168864 | 159.236 | 10.236 | |
| 0.166910 | 146.144 | −2.856 | |
| 0.167964 | 153.204 | 4.204 | |
| 0.167142 | 147.695 | −1.305 | |
| 0.168214 | 154.880 | 5.880 | |
| 225 | 0.177390 | 216.388 | −8.612 |
| 0.179763 | 232.294 | 7.294 | |
| 0.180187 | 235.136 | 10.136 | |
| 0.179939 | 233.469 | 8.469 | |
| 0.178145 | 221.444 | −3.556 | |
| 0.179561 | 230.936 | 5.936 | |
| 306 | 0.189486 | 297.465 | −8.535 |
| 0.191468 | 310.747 | 4.747 | |
| 0.189236 | 295.788 | −10.212 | |
| 0.190659 | 305.327 | −0.673 | |
| 0.189484 | 297.449 | −8.551 | |
| 0.190819 | 306.395 | 0.395 |
| Load (kg) | Load Parameter (Ω) | Load Estimation (kg) | Error (kg) |
|---|---|---|---|
| 0 | 0.100565 | 5.530 | 5.530 |
| 0.099123 | 17.637 | 17.637 | |
| 0.099631 | 9.478 | 9.478 | |
| 0.099729 | 7.893 | 7.893 | |
| 0.099014 | 19.392 | 19.392 | |
| 0.099380 | 13.510 | 13.510 | |
| 73 | 0.105506 | 84.892 | 11.892 |
| 0.104393 | 67.016 | −5.984 | |
| 0.103971 | 60.246 | −12.754 | |
| 0.104086 | 62.083 | −10.917 | |
| 0.105381 | 82.891 | 9.891 | |
| 0.104765 | 72.992 | −0.008 | |
| 149 | 0.109545 | 149.783 | 0.783 |
| 0.109004 | 141.084 | −7.916 | |
| 0.108925 | 139.813 | −9.187 | |
| 0.108783 | 137.538 | −11.462 | |
| 0.110233 | 160.830 | 11.830 | |
| 0.108953 | 140.266 | −8.734 | |
| 225 | 0.114997 | 237.358 | 12.358 |
| 0.113949 | 220.524 | −4.476 | |
| 0.114803 | 234.240 | 9.240 | |
| 0.114319 | 226.462 | 1.462 | |
| 0.114965 | 236.839 | 11.839 | |
| 0.113899 | 219.715 | −5.285 | |
| 306 | 0.120755 | 329.861 | 23.861 |
| 0.118507 | 293.734 | −12.266 | |
| 0.118558 | 294.558 | −11.442 | |
| 0.118296 | 290.356 | −15.644 | |
| 0.117915 | 284.230 | −21.770 | |
| 0.117873 | 283.564 | −22.436 |
| Load (kg) | Load Parameter (Ω) | Load Estimation (kg) | Error (kg) |
|---|---|---|---|
| 0 | 0.063210 | 5.085 | 5.085 |
| 0.063293 | 2.389 | 2.389 | |
| 0.063582 | 7.006 | 7.006 | |
| 0.062971 | 12.878 | 12.878 | |
| 0.063192 | 5.682 | 5.682 | |
| 0.062587 | 25.394 | 25.394 | |
| 73 | 0.065571 | 71.794 | −1.206 |
| 0.065081 | 55.840 | −17.160 | |
| 0.066163 | 91.100 | 18.100 | |
| 0.065477 | 68.760 | −4.240 | |
| 0.066240 | 93.601 | 20.601 | |
| 0.065437 | 67.431 | −5.569 | |
| 149 | 0.068783 | 176.449 | 27.449 |
| 0.067600 | 137.907 | −11.093 | |
| 0.068750 | 175.376 | 26.376 | |
| 0.067958 | 149.564 | 0.564 | |
| 0.068341 | 162.054 | 13.054 | |
| 0.068087 | 153.771 | 4.771 | |
| 225 | 0.070670 | 237.902 | 12.902 |
| 0.070260 | 224.564 | −0.436 | |
| 0.071073 | 251.033 | 26.033 | |
| 0.070135 | 220.461 | −4.539 | |
| 0.070546 | 233.854 | 8.854 | |
| 0.069880 | 212.179 | −12.821 | |
| 306 | 0.072971 | 312.860 | 6.860 |
| 0.072207 | 287.957 | −18.043 | |
| 0.072357 | 292.862 | −13.138 | |
| 0.071873 | 277.098 | −28.902 | |
| 0.072712 | 304.434 | −1.566 | |
| 0.072251 | 289.414 | −16.586 |
Appendix C

| Load (kg) | Load Parameter (Ω) | Load Estimation (kg) | Error (kg) |
|---|---|---|---|
| 0 | 0.130616 | 19.165 | 19.165 |
| 0.132966 | 0.002 | 0.002 | |
| 0.131179 | 14.572 | 14.572 | |
| 0.134374 | 11.481 | 11.481 | |
| 0.130998 | 16.050 | 16.050 | |
| 0.131325 | 13.379 | 13.379 | |
| 66 | 0.139821 | 55.904 | −10.096 |
| 0.142186 | 75.188 | 9.188 | |
| 0.140156 | 58.635 | −7.365 | |
| 0.142456 | 77.396 | 11.396 | |
| 0.141281 | 67.811 | 1.811 | |
| 0.143049 | 82.227 | 16.227 | |
| 148 | 0.150196 | 140.516 | −7.484 |
| 0.151358 | 149.991 | 1.991 | |
| 0.151648 | 152.354 | 4.354 | |
| 0.151496 | 151.116 | 3.116 | |
| 0.150206 | 140.594 | −7.406 | |
| 0.151874 | 154.196 | 6.196 | |
| 238 | 0.161203 | 230.275 | −7.725 |
| 0.162150 | 237.999 | −0.001 | |
| 0.161826 | 235.355 | −2.645 | |
| 0.162653 | 242.100 | 4.100 | |
| 0.161291 | 230.992 | −7.008 | |
| 0.163910 | 252.356 | 14.356 |
Appendix D
References
- Jacob, B.; Feypell-de La Beaumelle, V. Improving Truck Safety: Potential of Weigh-in-Motion Technology. IATSS Res. 2010, 34, 9–15. [Google Scholar] [CrossRef]
- Jacob, B.; Cottineau, L.-M. Weigh-in-Motion for Direct Enforcement of Overloaded Commercial Vehicles. Transp. Res. Procedia 2016, 14, 1413–1422. [Google Scholar] [CrossRef]
- Jo, Y.; Oh, C.; Kim, S. Estimation of Heavy Vehicle-Involved Rear-End Crash Potential Using WIM Data. Accid. Anal. Prev. 2019, 128, 103–113. [Google Scholar] [CrossRef]
- Ji, S.; Wang, R.; Shu, M.; Han, W.; Lan, X.; Wang, X.; Yin, W.; Cheng, Y. Improvement of Vehicle Axle Load Test Method Based on Portable WIM. Measurement 2021, 173, 108626. [Google Scholar] [CrossRef]
- Xiong, H.; Zhang, Y. Feasibility Study for Using Piezoelectric-Based Weigh-In-Motion (WIM) System on Public Roadway. Appl. Sci. 2019, 9, 3098. [Google Scholar] [CrossRef]
- Ryguła, A.; Maczyński, A.; Brzozowski, K.; Grygierek, M.; Konior, A. Influence of Trajectory and Dynamics of Vehicle Motion on Signal Patterns in the WIM System. Sensors 2021, 21, 7895. [Google Scholar] [CrossRef]
- González, B.; Jiménez, F.J.; De Frutos, J. A Virtual Instrument for Road Vehicle Classification Based on Piezoelectric Transducers. Sensors 2020, 20, 4597. [Google Scholar] [CrossRef]
- Masud, M.M.; Haider, S.W. Effect of Static Weight Errors on Weigh-in-Motion (WIM) System Accuracy. Measurement 2023, 206, 112301. [Google Scholar] [CrossRef]
- Burnos, P.; Gajda, J.; Sroka, R.; Wasilewska, M.; Dolega, C. High Accuracy Weigh-In-Motion Systems for Direct Enforcement. Sensors 2021, 21, 8046. [Google Scholar] [CrossRef]
- Gajda, J.; Burnos, P.; Sroka, R. Accuracy Assessment of Weigh-in-Motion Systems for Vehicle’s Direct Enforcement. IEEE Intell. Transport. Syst. Mag. 2018, 10, 88–94. [Google Scholar] [CrossRef]
- Xiang, T.; Huang, K.; Zhang, H.; Zhang, Y.; Zhang, Y.; Zhou, Y. Detection of Moving Load on Pavement Using Piezoelectric Sensors. Sensors 2020, 20, 2366. [Google Scholar] [CrossRef]
- Hernandez, S.V.; Tok, A.; Ritchie, S.G. Integration of Weigh-in-Motion (WIM) and Inductive Signature Data for Truck Body Classification. Transp. Res. Part C Emerg. Technol. 2016, 68, 1–21. [Google Scholar] [CrossRef]
- Gajda, J.; Sroka, R.; Stencel, M.; Zeglen, T.; Piwowar, P.; Burnos, P.; Marszałek, Z. Design and Accuracy Assessment of the Multi-Sensor Weigh-in-Motion System. In Proceedings of the 2015 IEEE International Instrumentation and Measurement Technology Conference (I2MTC), Pisa, Italy, 11–14 May 2015; pp. 1036–1041. [Google Scholar] [CrossRef]
- Gajda, J.; Piwowar, P.; Sroka, R.; Stencel, M.; Zeglen, T. Application of Inductive Loops as Wheel Detectors. Transp. Res. Part C Emerg. Technol. 2012, 21, 57–66. [Google Scholar] [CrossRef]
- Day, C.M.; Brennan, T.M.; Harding, M.L.; Premachandra, H.; Jacobs, A.; Bullock, D.M.; Krogmeier, J.V.; Sturdevant, J.R. Three-Dimensional Mapping of Inductive Loop Detector Sensitivity with Field Measurement. Transp. Res. Rec. 2009, 2128, 35–47. [Google Scholar] [CrossRef]
- Lai, Y.-K.; Ho, C.-Y.; Lai, C.-L.; Taun, C.-Y.; Hsieh, K.-C. Assessment of Standing Multi-Frequency Bioimpedance Analyzer to Measure Body Composition of the Whole Body and Limbs in Elite Male Wrestlers. IJERPH 2022, 19, 15807. [Google Scholar] [CrossRef]
- Abdelwahed, M.; Zerioul, L.; Pitti, A.; Romain, O. Using Novel Multi-Frequency Analysis Methods to Retrieve Material and Temperature Information in Tactile Sensing Areas. Sensors 2022, 22, 8876. [Google Scholar] [CrossRef]
- Lehti-Polojärvi, M.; Koskela, O.; Hyttinen, J. Multifrequency Electrical Impedance Tomography in Biological Applications: A Multimodal Perspective. In Bioimpedance and Spectroscopy; Elsevier: Amsterdam, The Netherlands, 2021; pp. 157–189. ISBN 978-0-12-818614-5. [Google Scholar] [CrossRef]
- Luo, Y.-F. A Multi-Frequency Electrical Impedance Spectroscopy Technique of Artificial Neural Network-Based for the Static State of Charge. Energies 2021, 14, 2526. [Google Scholar] [CrossRef]
- Kadir, M.A.; Wilson, A.J.; Siddique-e Rabbani, K. A Multi-Frequency Focused Impedance Measurement System Based on Analogue Synchronous Peak Detection. Front. Electron. 2021, 2, 791016. [Google Scholar] [CrossRef]
- Porzuczek, J. Multifrequency Impedance Tomography System for Research on Environmental and Thermal Processes. Energies 2021, 14, 6366. [Google Scholar] [CrossRef]
- Qiao, X.; Zhang, Z.; Chen, X. Multifrequency Impedance Method Based on Neural Network for Root Canal Length Measurement. Appl. Sci. 2020, 10, 7430. [Google Scholar] [CrossRef]
- Sui, J.; Gandotra, N.; Xie, P.; Lin, Z.; Scharfe, C.; Javanmard, M. Multi-Frequency Impedance Sensing for Detection and Sizing of DNA Fragments. Sci. Rep. 2021, 11, 6490. [Google Scholar] [CrossRef]
- Marszalek, Z.; Duda, K. Multifrequency Vector Measurement System for Reliable Vehicle Magnetic Profile Assessment. Sensors 2020, 20, 4933. [Google Scholar] [CrossRef]
- Marszalek, Z.; Gawedzki, W.; Duda, K. A Reliable Moving Vehicle Axle-to-Axle Distance Measurement System Based on Multi-Frequency Impedance Measurement of a Slim Inductive-Loop Sensor. Measurement 2021, 169, 108525. [Google Scholar] [CrossRef]
- Antoniadis, A.; Oppenheim, G. (Eds.) Wavelets and Statistics; Springer: New York, NY, USA, 1995. [Google Scholar] [CrossRef]
- Duda, K.; Zieliński, T.P.; Barczentewicz, S.H. Perfectly Flat-Top and Equiripple Flat-Top Cosine Windows. IEEE Trans. Instrum. Meas. 2016, 65, 1558–1567. [Google Scholar] [CrossRef]
- McGill, R.; Tukey, J.W.; Larsen, W.A. Variations of Box Plots. Am. Stat. 1978, 32, 12. [Google Scholar] [CrossRef]
- Walpole, S.C.; Prieto-Merino, D.; Edwards, P.; Cleland, J.; Stevens, G.; Roberts, I. The Weight of Nations: An Estimation of Adult Human Biomass. BMC Public Health 2012, 12, 439. [Google Scholar] [CrossRef]
- Fryar, C.D.; Carroll, M.D.; Gu, Q.; Afful, J.; Ogden, C.L. Anthropometric Reference Data for Children and Adults: United States, 2015–2018. 2021. Available online: https://stacks.cdc.gov/view/cdc/100478 (accessed on 6 January 2023).


| Frequency Value in kHz in a Given Channel: | f1 | f2 | f3 |
|---|---|---|---|
| #1: for the first standard IL1 sensor | 10 | 18 | 27 |
| #3: for the second standard IL3 sensor | 13 | 21 | 28 |
| #2: for the first slim IL2 sensor | 6 | 15 | 22 |
| #4: for the second slim IL4 sensor | 7 | 16 | 24 |
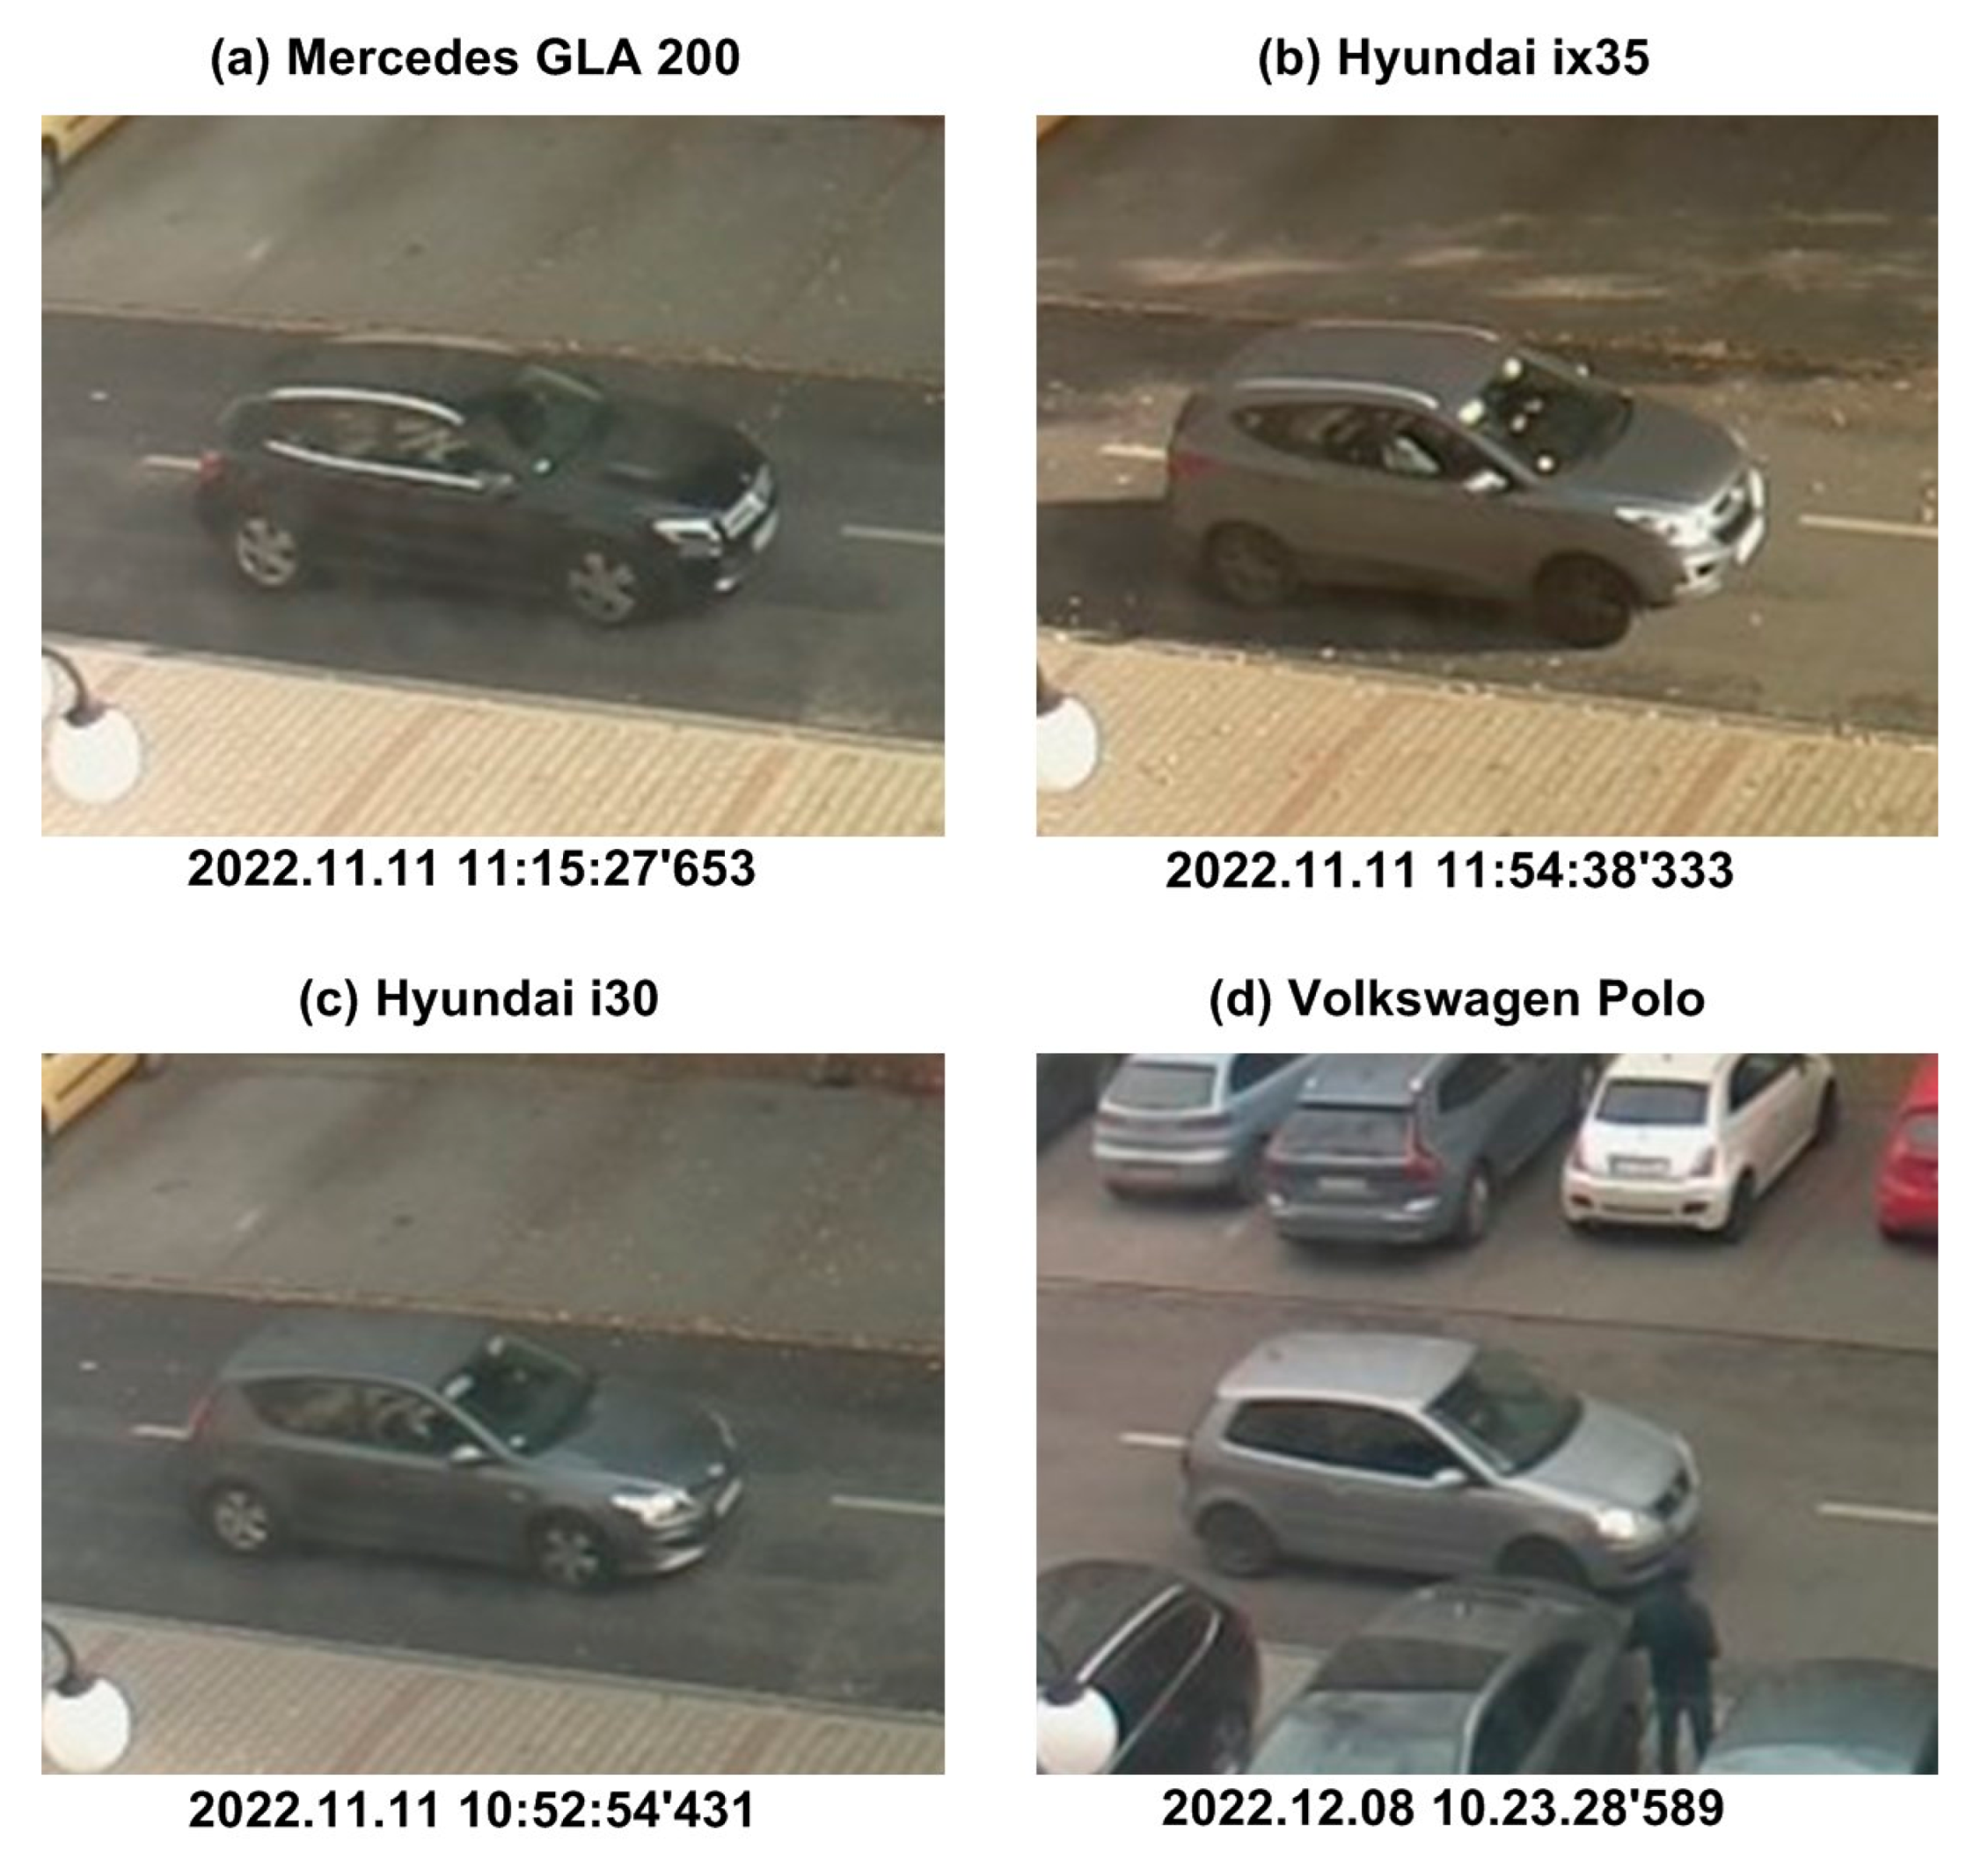
| Car Model | Car Weight (kg) | Permissible Load (kg) | Driver Weight (kg) | M (%) |
|---|---|---|---|---|
| Mercedes GLA200 | 1320 | 600 | 85 | 65.1 |
| Hyundai i30 | 1193 | 527 | 68 | 71.2 |
| Hyundai ix35 | 1366 | 464 | 82 | 83.6 |
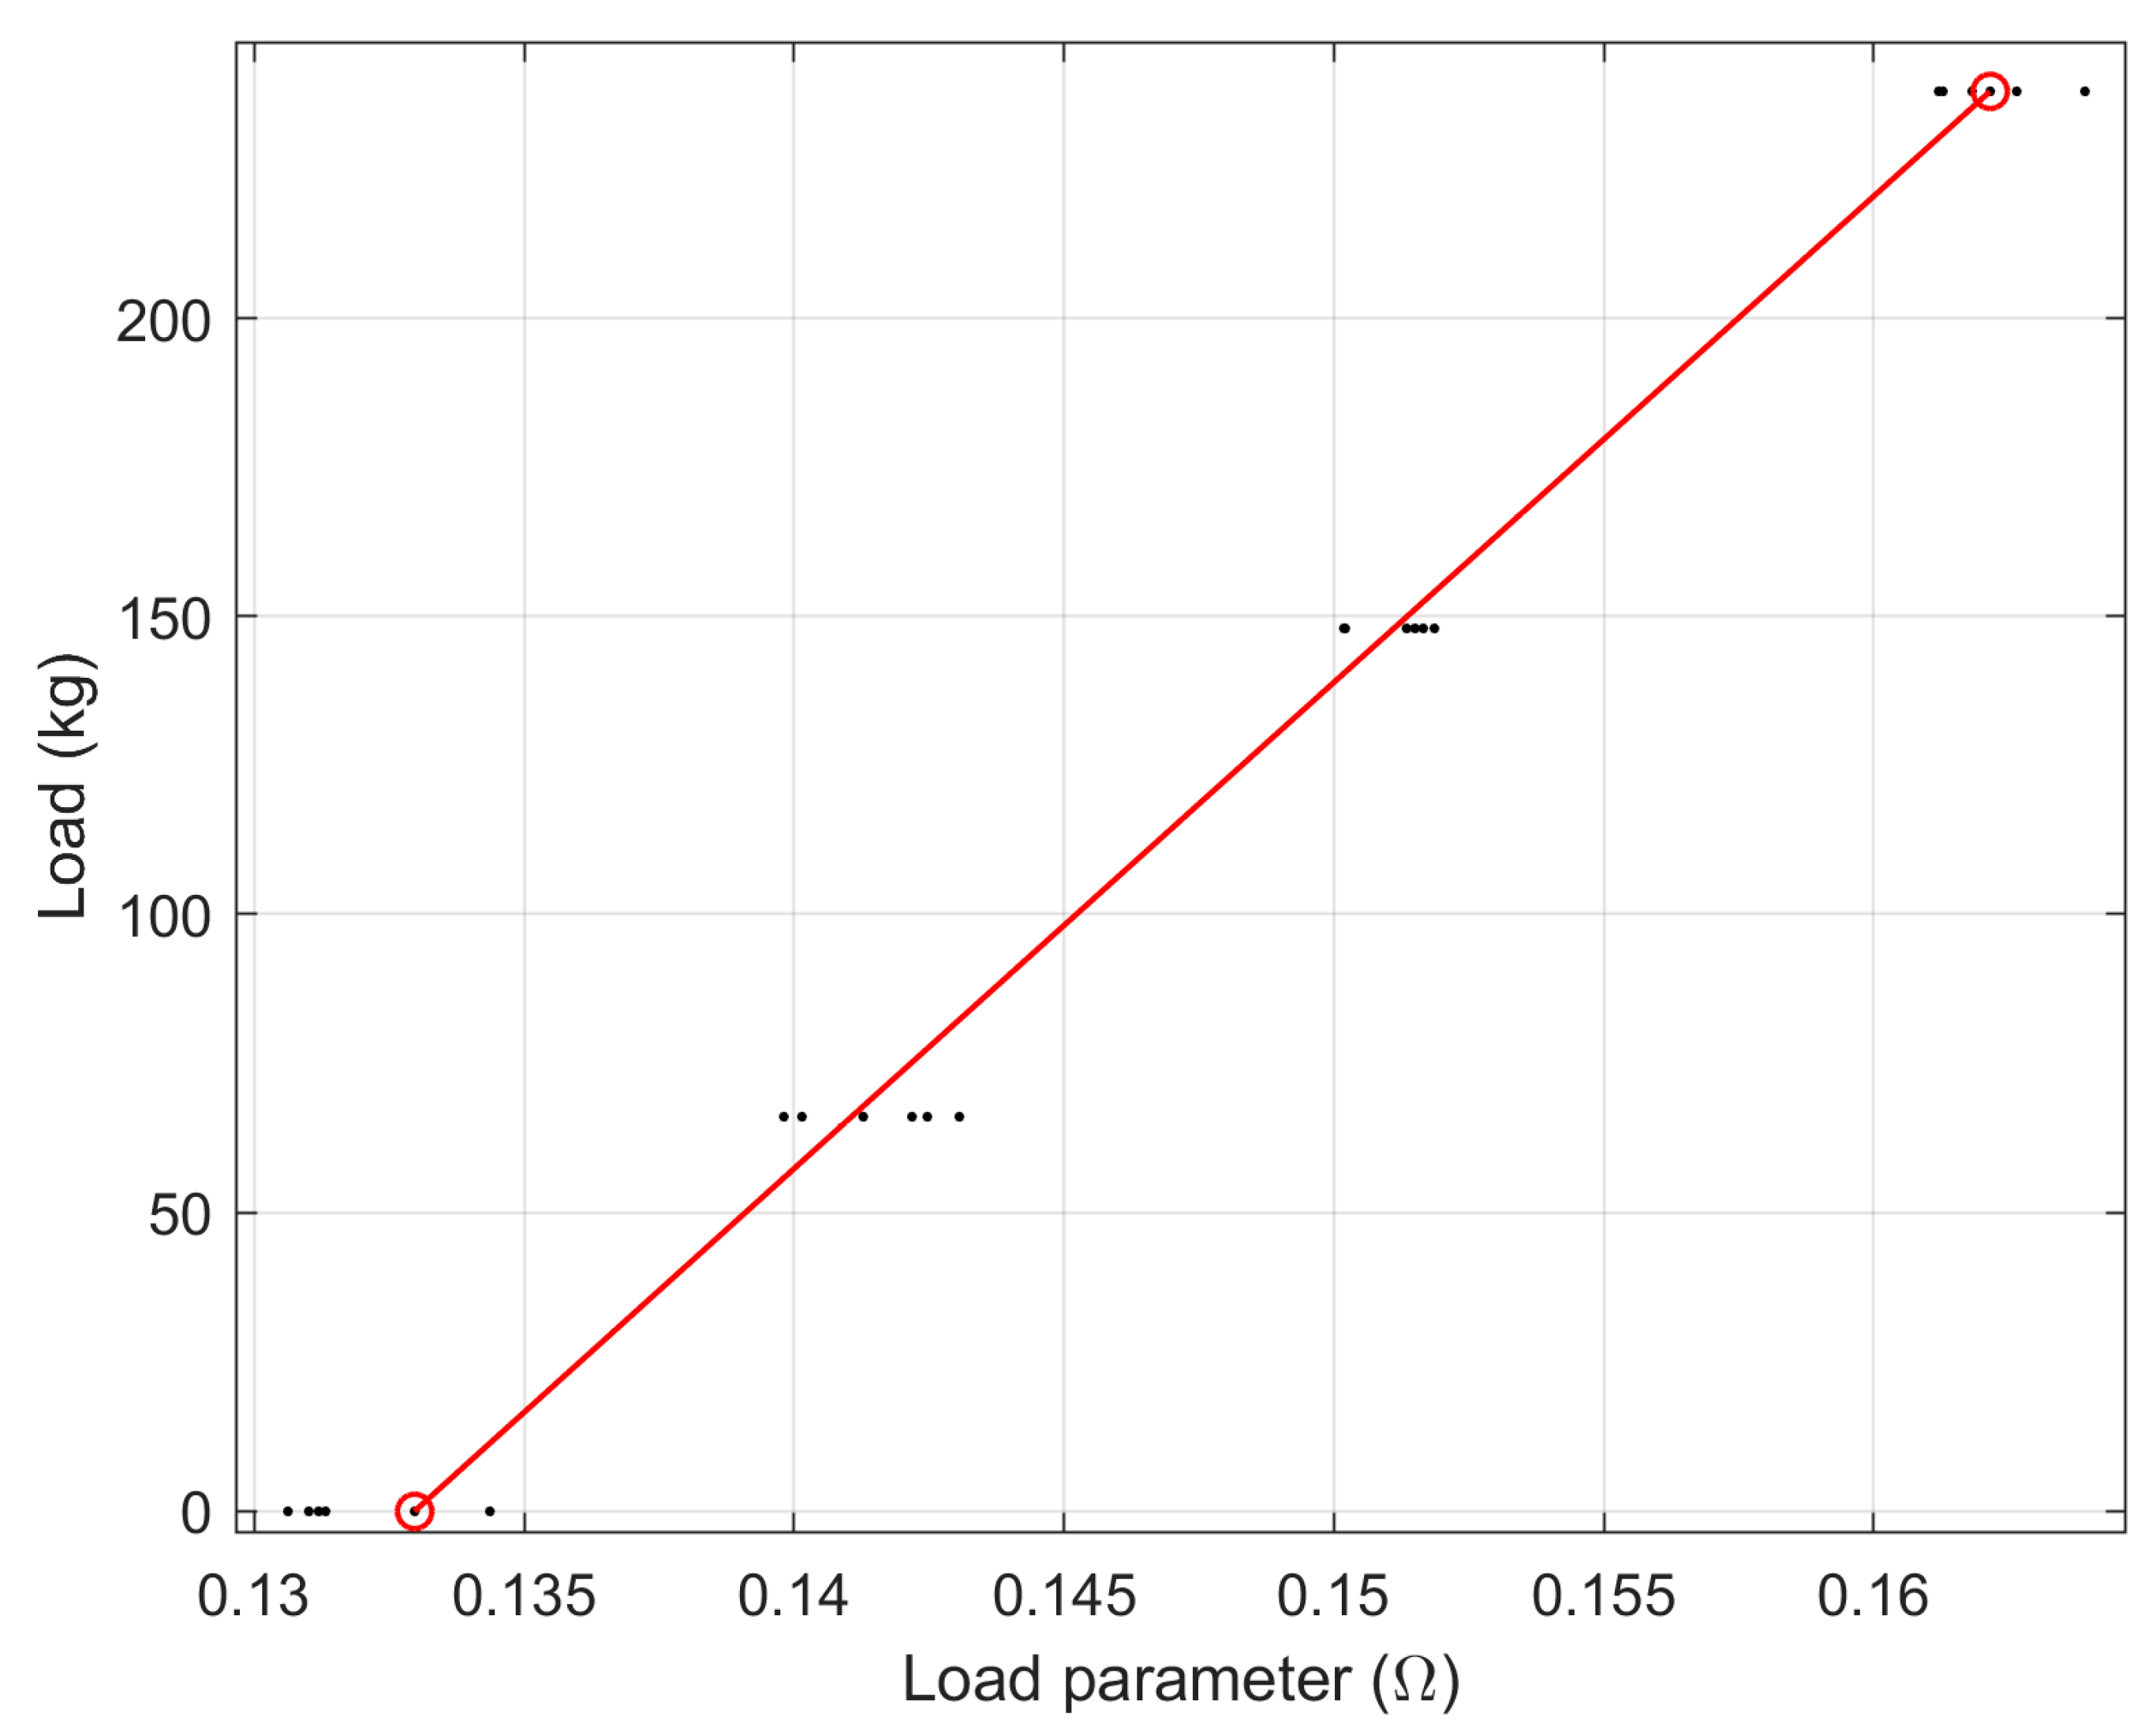
| Car Model | a (kg/Ω) | b (kg) | S (Ω/kg) |
|---|---|---|---|
| Mercedes GLA200 | 16,063.551 | −1609.901 | 62.25 × 10⁻⁶ |
| Hyundai i30 | 6702.737 | −972.612 | 149.2 × 10⁻⁶ |
| Hyundai ix35 | 32,574.053 | −2064.104 | 30.7 × 10⁻⁶ |
Disclaimer/Publisher’s Note: The statements, opinions and data contained in all publications are solely those of the individual author(s) and contributor(s) and not of MDPI and/or the editor(s). MDPI and/or the editor(s) disclaim responsibility for any injury to people or property resulting from any ideas, methods, instructions or products referred to in the content. |
© 2023 by the authors. Licensee MDPI, Basel, Switzerland. This article is an open access article distributed under the terms and conditions of the Creative Commons Attribution (CC BY) license (https://creativecommons.org/licenses/by/4.0/).
Share and Cite
Marszalek, Z.; Duda, K.; Piwowar, P.; Stencel, M.; Zeglen, T.; Izydorczyk, J. Load Estimation of Moving Passenger Cars Using Inductive-Loop Technology. Sensors 2023, 23, 2063. https://doi.org/10.3390/s23042063
Marszalek Z, Duda K, Piwowar P, Stencel M, Zeglen T, Izydorczyk J. Load Estimation of Moving Passenger Cars Using Inductive-Loop Technology. Sensors. 2023; 23(4):2063. https://doi.org/10.3390/s23042063
Chicago/Turabian StyleMarszalek, Zbigniew, Krzysztof Duda, Piotr Piwowar, Marek Stencel, Tadeusz Zeglen, and Jacek Izydorczyk. 2023. "Load Estimation of Moving Passenger Cars Using Inductive-Loop Technology" Sensors 23, no. 4: 2063. https://doi.org/10.3390/s23042063
APA StyleMarszalek, Z., Duda, K., Piwowar, P., Stencel, M., Zeglen, T., & Izydorczyk, J. (2023). Load Estimation of Moving Passenger Cars Using Inductive-Loop Technology. Sensors, 23(4), 2063. https://doi.org/10.3390/s23042063