Efficient Internet-of-Things Cyberattack Depletion Using Blockchain-Enabled Software-Defined Networking and 6G Network Technology
Abstract
:1. Introduction
1.1. Paper Organization
1.2. Research Contributions
- Virtual network function technology is used with software-defined networking to optimize network architecture and improve the overall network performance. IoT devices obtain faster response times, improved network security management, and high threat detection rates.
- VNFSDN incorporates threat filtration, collection, and decision-driven algorithms to avoid and reduce cyber risks for IoT devices and improve network performance. Furthermore, data integrity for IoT devices is protected by addressing three categories of risks (data deletion, data insertion, and data manipulation).
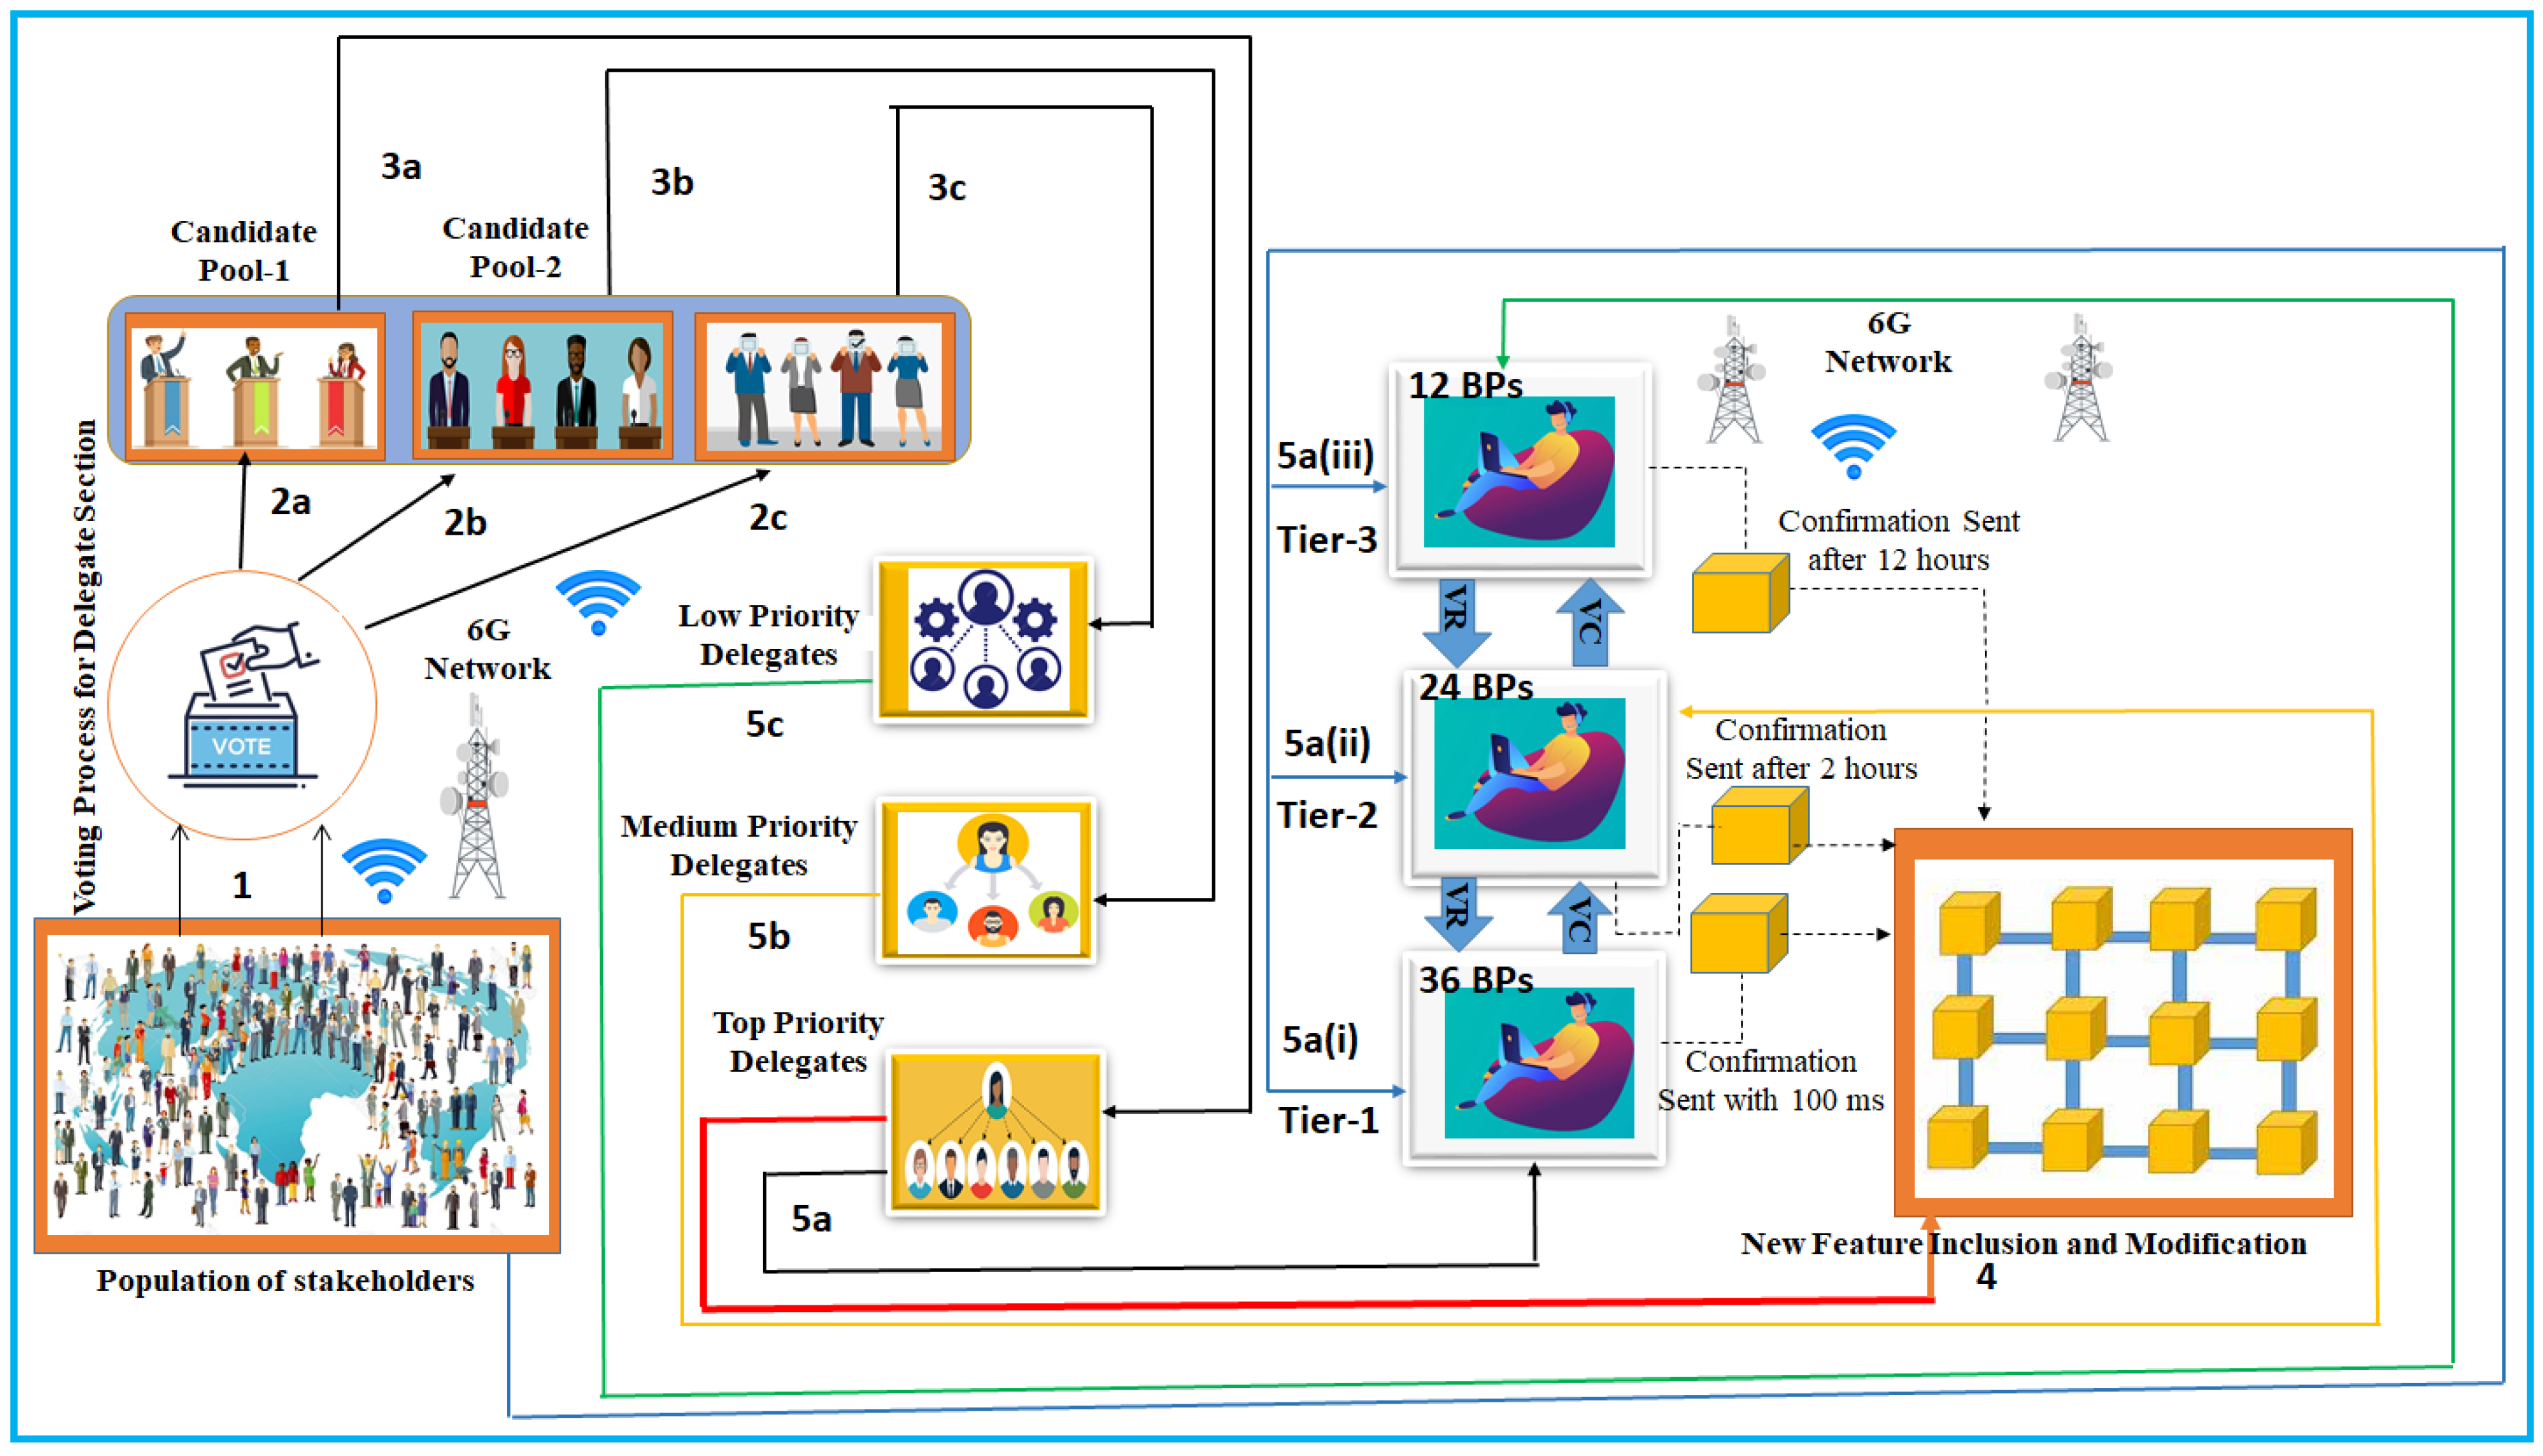
- Prioritized delegated proof of stake is an entirely novel consensus variant implemented to combat attacks. This variant addresses the scalability issue of blockchain technology by providing a safe and adaptable environment for IoT devices that can quickly be scaled up and down to suit the changing demands of the organization, allowing IoT devices to efficiently utilize resources.
1.3. Problem Identification and Significance
2. Related Work
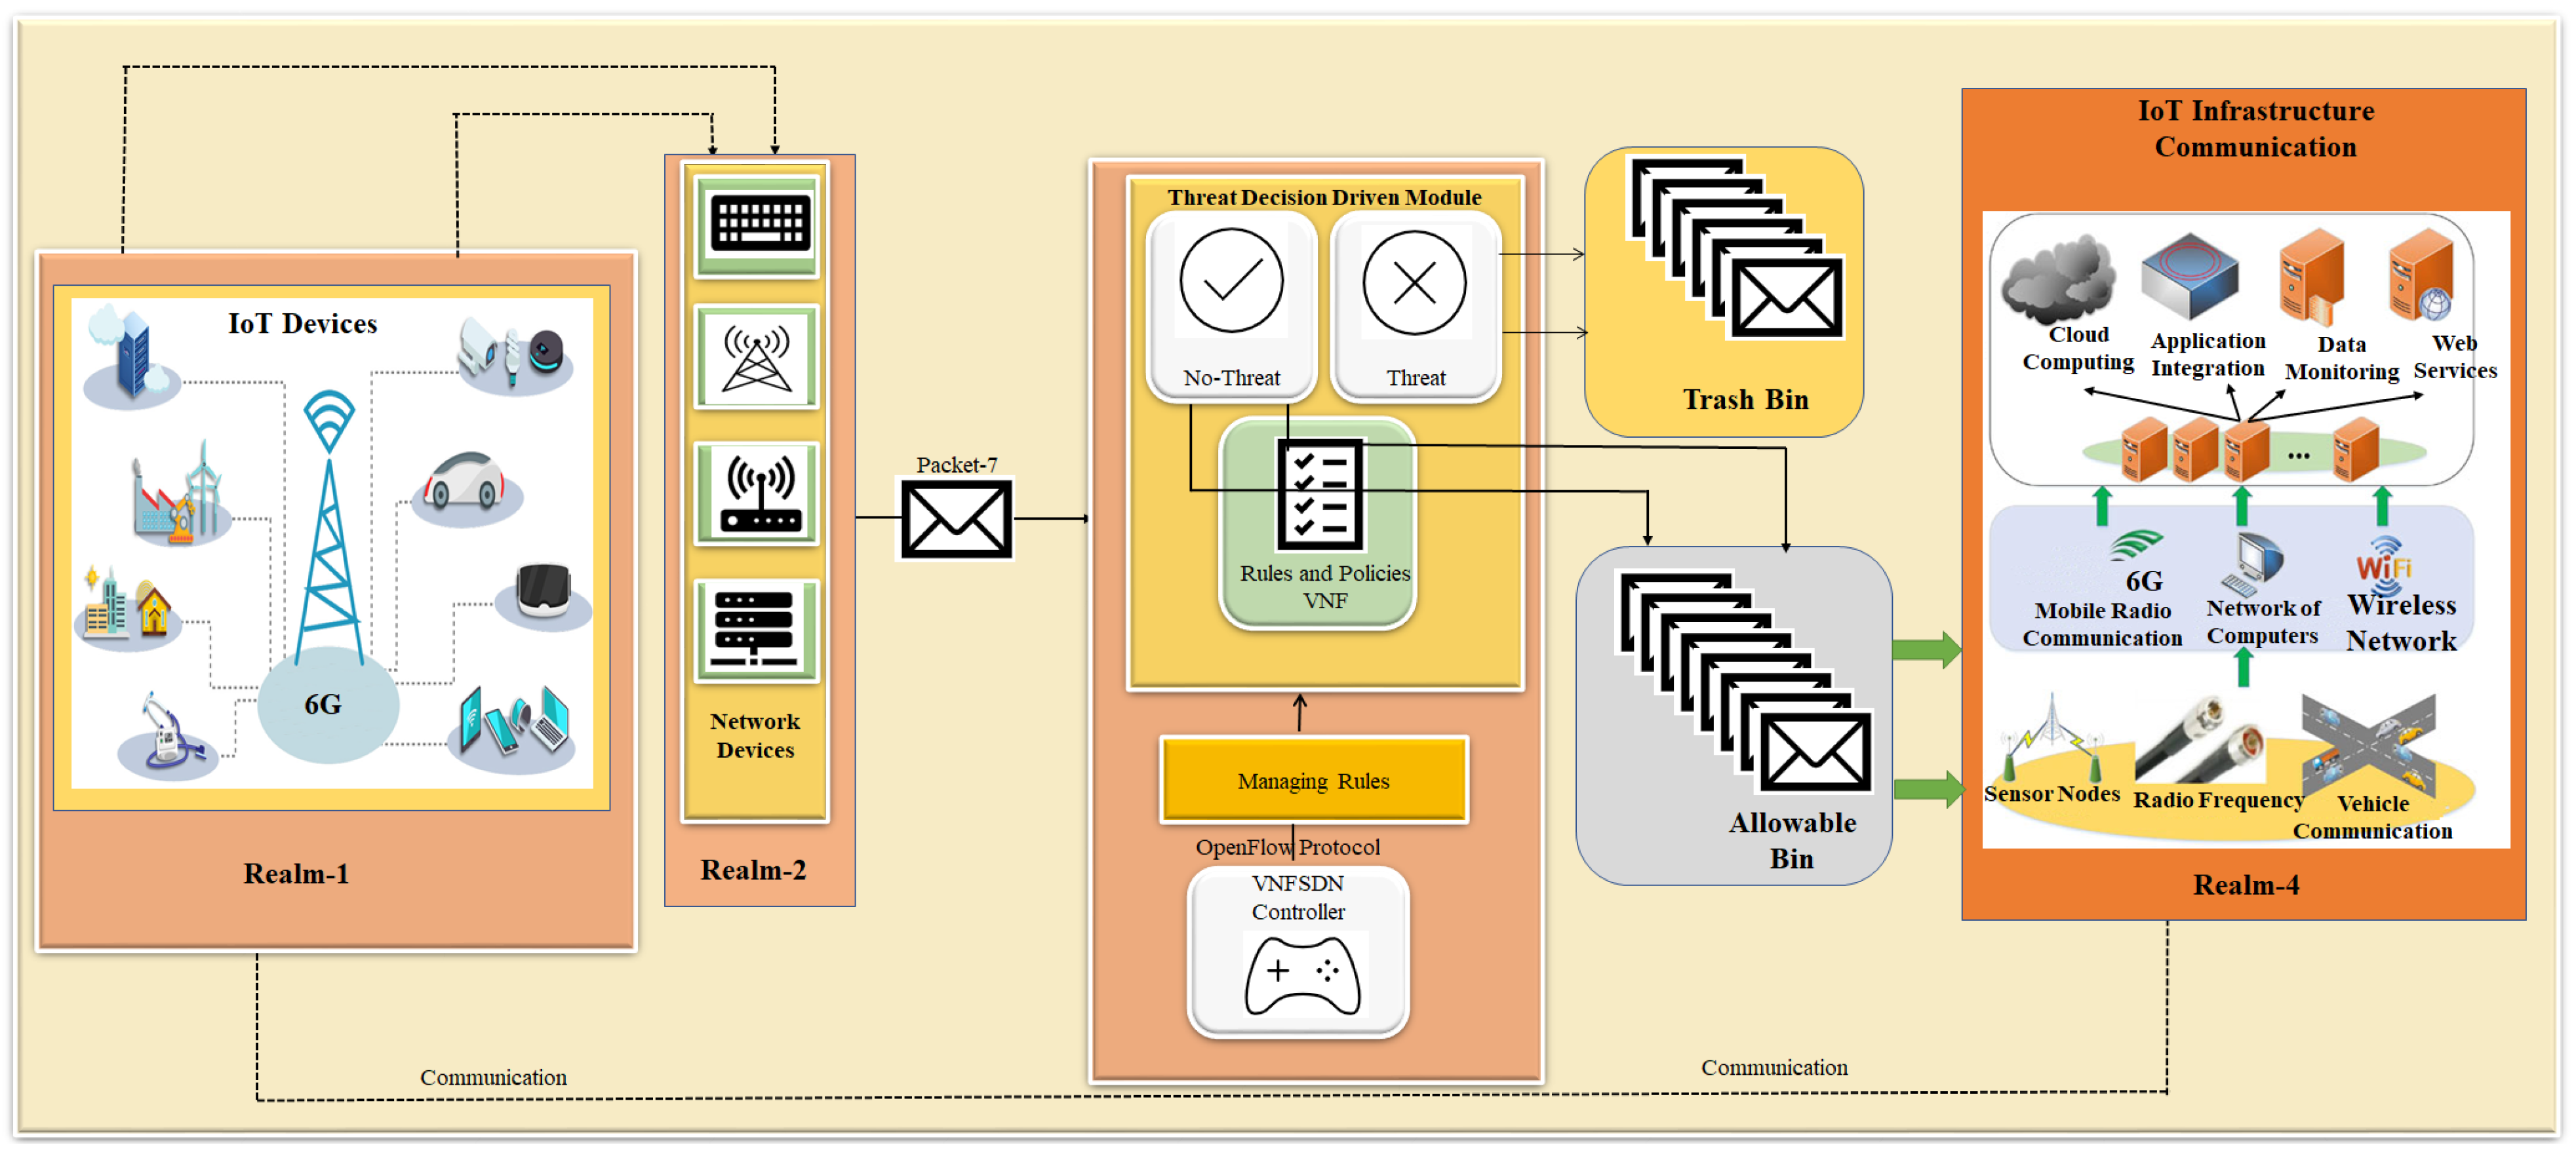
3. Proposed Efficient IoT Cyberattack Depletion Using VNFSDN and 6G
- Threat filtration process for IoT devices;
- Threat-capturing and decision-driven process for IoT devices;
- Modeling of a blockchain-enabled consensus algorithm for cyberattack depletion.
3.1. Threat Filtration Process for IoT Devices Using VNFSDN and 6G Technology
| Algorithm 1: Threat filtration process using VNFSDN and 6G technology |
|
3.2. Threat-Capturing and Decision-Driven Process for IoT Devices
| Algorithm 2: Threat-capturing and -mitigating processes using VNFSDN |
|
- For each historical sample, a vector derived from the efficiency of the CPU, the main memory, and the number of VMs is achieved. All three parts have the same significance level.
- The PM on the cloud calculates the Euclidean distance between the current state and the best settings. The configuration is said to be optimal or acceptable when it is within the range of efficiency accepted by the PM of the cloud server. These settings are stored to meet efficiency requirements.
- The PM also calculates the distance of the total configuration to the total shutdown of the PM state for the cloud.
3.3. Modeling of the Blockchain-Enabled Consensus Algorithm for Cyberattack Depletion
- If the blockchain is operating during the crisis, then = ();
- If the blockchain functions in a secure manner, then = ();
- If the blockchain works under restricted conditions, then = ().
4. Experimental Setup and Results
4.1. Experimental Setup
4.2. Experimental Scenarios
- Scenario 1: A cyberattack is generated for IoT devices in the presence of SDN and a 6G network, and the network availability using the VNFSDN, VNFSDN with a firewall, and competing methods are measured.
- Scenario 2: Different network security measures are evaluated for DDoS attack mitigation and found that the VNFSDN approach is the most effective in improving the packet loss rate for IoT devices.
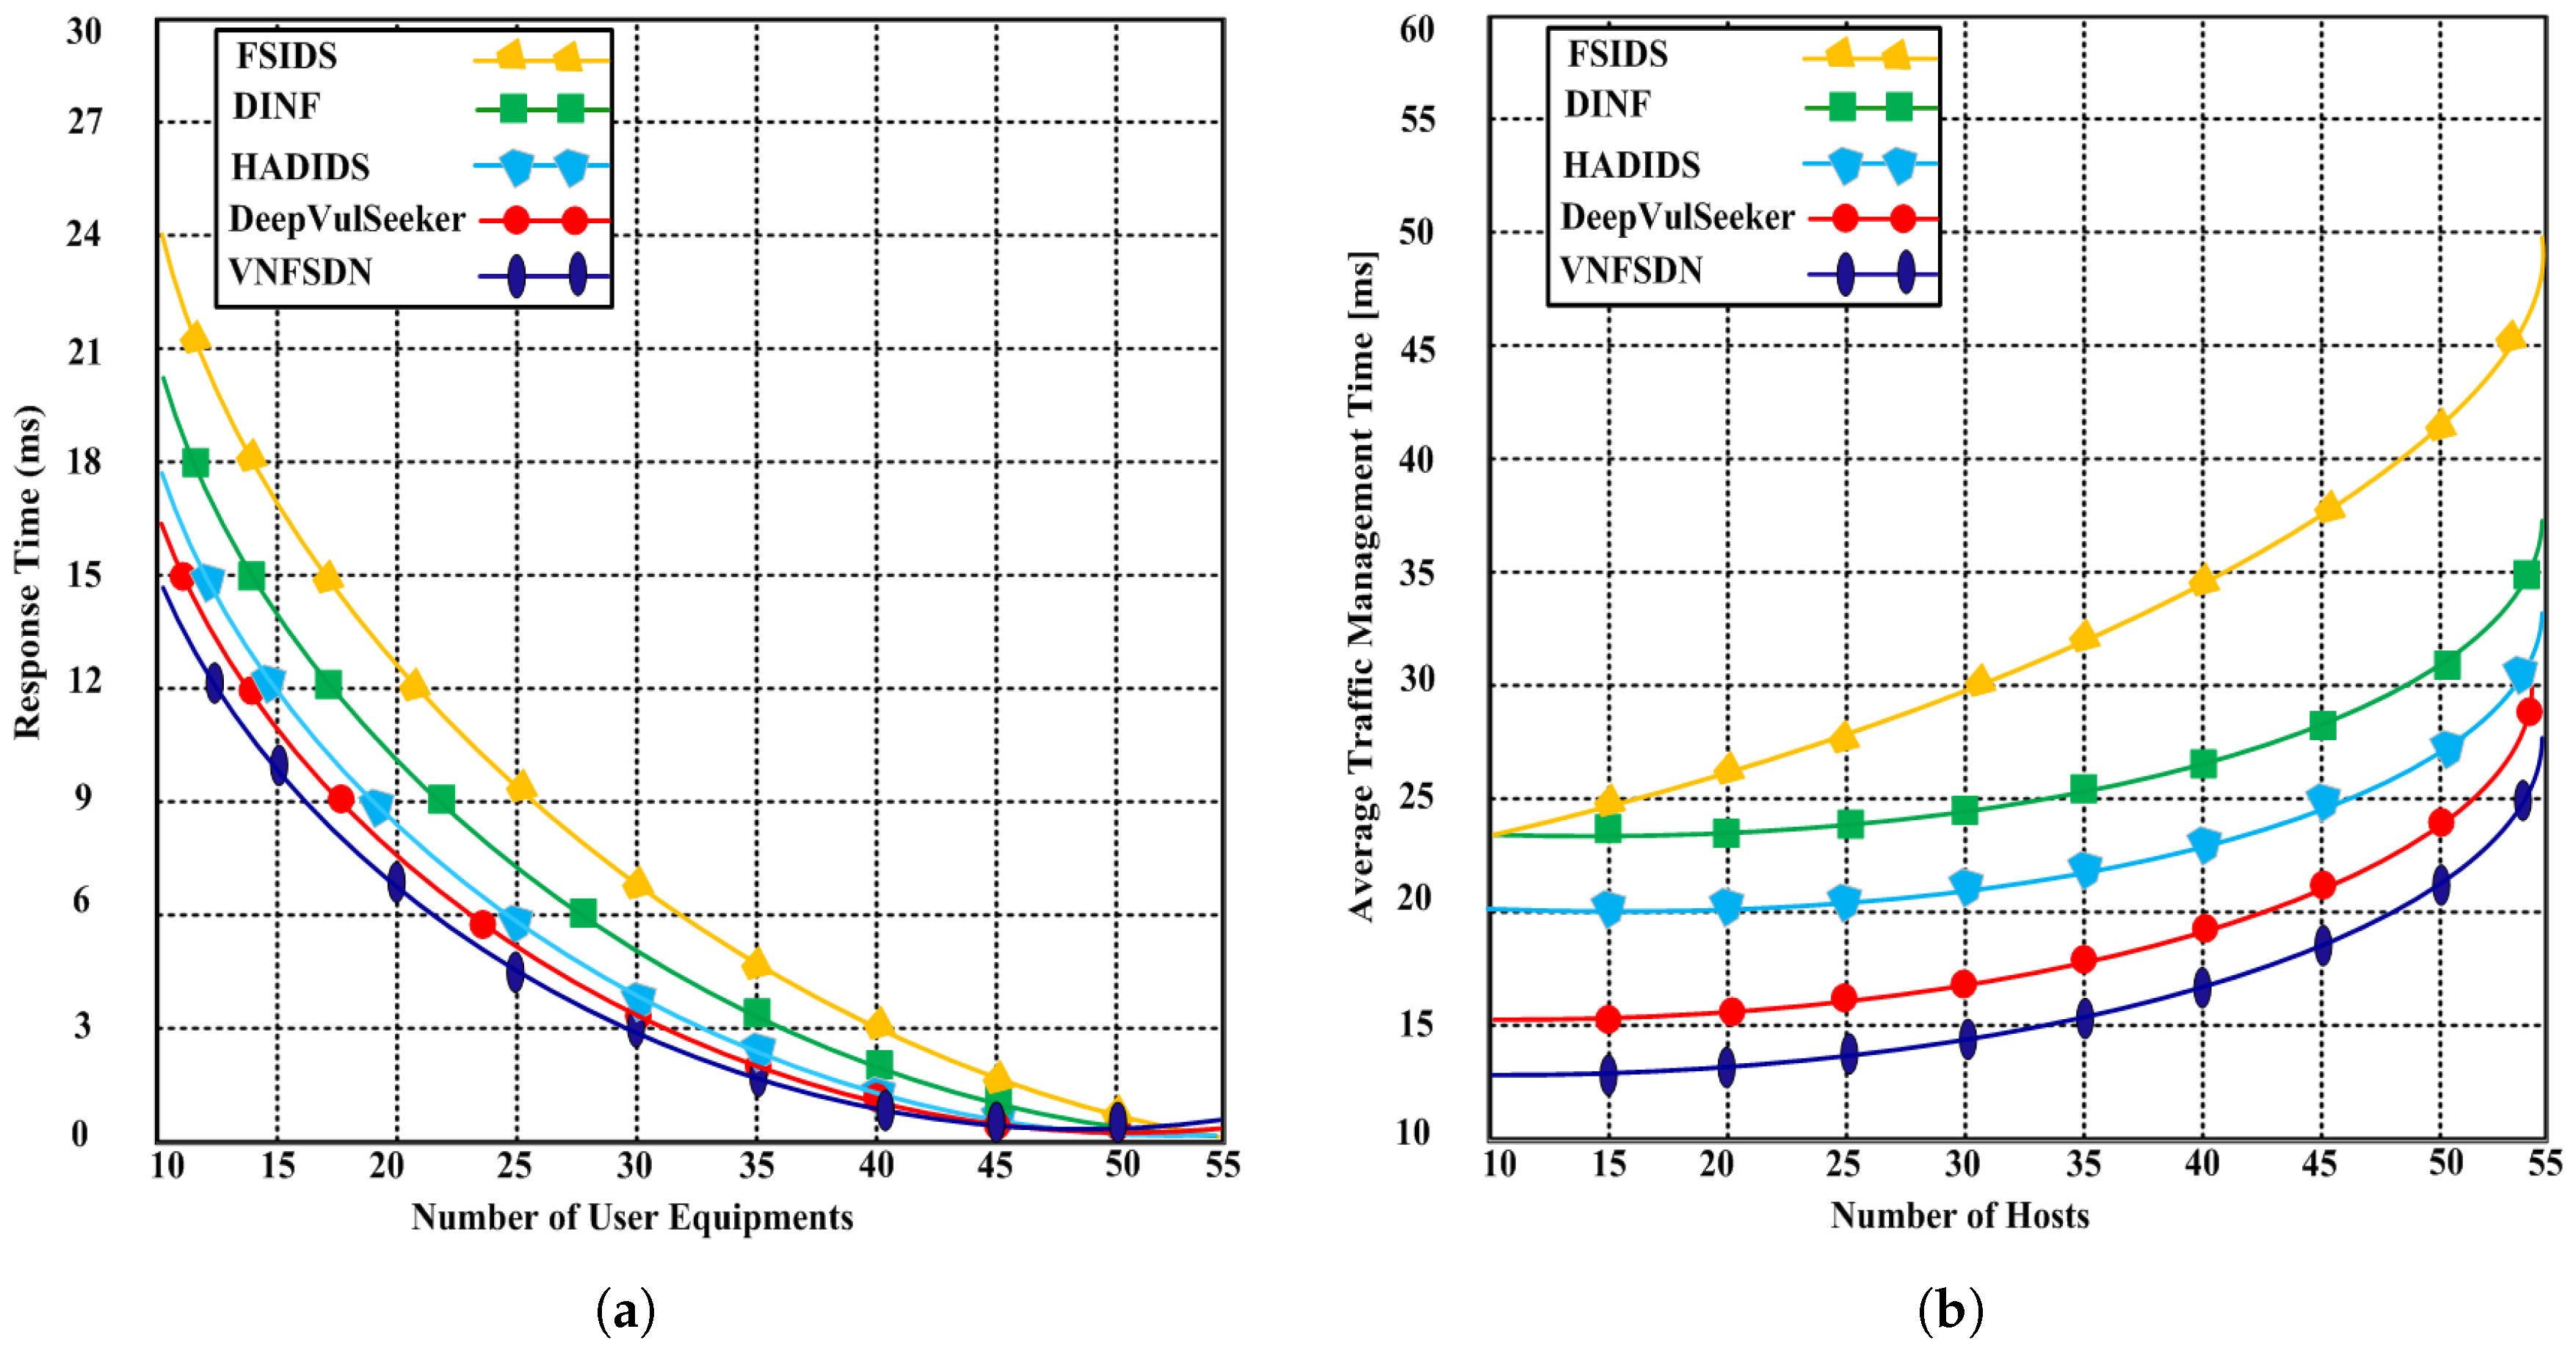
- Scenario 3: The impact of the VNFSDN approach is evaluated on traffic management in a 6G network by measuring the response to gradually increasing the number of IoT devices or user equipments (UEs) in the network.
- Scenario 4: A high-traffic 6G network is employed with a VNFSDN and PDPoS algorithm to manage the traffic flow for the IoT devices in the presence of potential attacks.
- Scenario 5: The threat detection rate of different security configurations is compared using a network without security, VNFSDN, VNFSDN with a firewall, IDS system, and a firewall.
- Scenario 6: The effectiveness of various network security solutions is evaluated for preventing data insertion, deletion, and alteration attacks by employing the PDPoS algorithm, VNFSDN and 6G technology and other competing methods (HADIDS, DINF, FSIDS, DeepVulSeeker approaches).
4.3. Testing Results
- Network availability;
- Packet loss;
- Response time;
- Average traffic management time;
- Threat detection with traffic intensity;
- Undetected data;
- Malicious threat detection accuracy.
4.3.1. Network Availability
4.3.2. Packet Loss
4.3.3. Response Time
4.3.4. Average Traffic Management Time
4.3.5. Threat Detection with Traffic Intensity
4.3.6. Undetected Data
4.3.7. Malicious Threat Detection Accuracy
5. Discussion
6. Conclusions and Future Work
6.1. Conclusions
6.2. Future Work
Author Contributions
Funding
Informed Consent Statement
Data Availability Statement
Conflicts of Interest
References
- D’Angelo, G.; Eslam, F.; Massimo, F.; Francesco, P.; Antonio, R. Privacy-preserving malware detection in Android-based IoT devices through federated Markov chains. Future Gener. Comput. Syst. 2023, 148, 93–105. [Google Scholar] [CrossRef]
- Sánchez-Zas, C.; Víctor, A.V.; Vega-Barbas, M.; Larriva-Novo, X.; Moreno, J.I.; Berrocal, J. Ontology-based approach to real-time risk management and cyber-situational awareness. Future Gener. Comput. Syst. 2023, 141, 462–472. [Google Scholar] [CrossRef]
- Beibei, L.; Yujie, C.; Hanyuan, H.; Wenshan, L.; Tao, L.; Wen, C. Artificial immunity based distributed and fast anomaly detection for Industrial Internet of Things. Future Gener. Comput. Syst. 2023, 148, 367–379. [Google Scholar]
- Martini, B.; Gharbaoui, M.; Castoldi, P. Intent-based network slicing for SDN vertical services with assurance: Context, design and preliminary experiments. Future Gener. Comput. Syst. 2023, 142, 101–116. [Google Scholar] [CrossRef]
- Salman, M.I.; Bin, W. Near-optimal responsive traffic engineering in software defined networks based on deep learning. Future Gener. Comput. Syst. 2022, 135, 172–180. [Google Scholar] [CrossRef]
- Nguyen, V.G.; Anna, B.; Karl-Johan, G.; Javid, T. SDN/NFV-based mobile packet core network architectures: A survey. IEEE Commun. Surv. Tutor. 2017, 19, 1567–1602. [Google Scholar] [CrossRef]
- Hu, T.; Quan, R.; Peng, Y.; Ziyong, L.; Julong, L.; Yuxiang, H.; Qian, L. An efficient approach to robust controller placement for link failures in Software-Defined Networks. Future Gener. Comput. Syst. 2021, 124, 187–205. [Google Scholar] [CrossRef]
- Miao, W.; Geyong, M.; Yulei, W.; Haojun, H.; Zhiwei, Z.; Haozhe, W.; Chunbo, L. Stochastic performance analysis of network function virtualization in future Internet. IEEE J. Sel. Areas Commun. 2019, 37, 613–626. [Google Scholar] [CrossRef]
- Ma, Z.; Xiaoming, Y.; Kai, L.; Jie, F.; Li, Z.; Dajun, Z.; Yu, F.R. Blockchain-escorted distributed deep learning with collaborative model aggregation towards 6G networks. Future Gener. Comput. Syst. 2023, 141, 555–566. [Google Scholar] [CrossRef]
- You, X.; Wang, C.; Huang, J.; Gao, X.; Zhang, Z.; Wang, M.; Huang, Y.; Zhang, C.; Jiang, Y.; Wang, J.; et al. Towards 6G wireless communication networks: Vision, enabling technologies, and new paradigm shifts. Sci. China Inf. Sci. 2021, 64, 110301. [Google Scholar] [CrossRef]
- Alotaibi, A.; Ahmed, B. A federated and softwarized intrusion detection framework for massive internet of things in 6G network. J. King Saud Univ. Comput. Inf. Sci. 2023, 35, 101575. [Google Scholar] [CrossRef]
- Wang, J.; Hui, X.; Shuwen, Z.; Yinhao, X. DeepVulSeeker: A novel vulnerability identification framework via code graph structure and pre-training mechanism. Future Gener. Comput. Syst. 2023, 148, 15–26. [Google Scholar] [CrossRef]
- Daeyoung, H.; Jinyoug, K.; Dongjin, H.; Jaehoon (Paul), J. SDN-based network security functions for effective DDoS attack mitigation. In Proceedings of the 2017 International Conference on Information and Communication Technology Convergence (ICTC), Jeju Island, Republic of Korea, 18–20 October 2017; pp. 834–839. [Google Scholar]
- Razaque, A.; Aloqaily, M.; Almiani, M.; Jararweh, Y.; Srivastava, G. Efficient and reliable forensics using intelligent edge computing. Future Gener. Comput. Syst. 2021, 118, 230–239. [Google Scholar] [CrossRef]
- Ahmad, I.; Tanesh, K.; Madhusanka, L.; Jude, O.; Mika, Y.; Andrei, G. overview of 5G security challenges and solutions. IEEE Commun. Stand. Mag. 2018, 2, 36–43. [Google Scholar] [CrossRef]
- Rejeb, A.; Karim, R.; Andrea, A.; Sandeep, J.; Mohammad, I.; Salem, A.; Yaser, A.; Yasanur, K. Unleashing the power of internet of things and blockchain: A comprehensive analysis and future directions. Internet Things Cyber. Phys. Syst. 2023, 4, 1–18. [Google Scholar] [CrossRef]
- Patterson, C.M.; Nurse, J.R.C.; Franqueira, V.N.L. Learning from cyber security incidents: A systematic review and future research agenda. Comput. Secur. 2023, 132, 103309. [Google Scholar] [CrossRef]
- Razaque, A.; Fathi, A.; Musbah, A.; Bandar, A.; Fawaz, A.; Duisen, G.; Saraju, P.M.; Salim, H. A Mobility-Aware Human-Centric Cyber-Physical System for Efficient and Secure Smart Healthcare. IEEE Internet Things J. 2022, 9, 22434–22452. [Google Scholar] [CrossRef]
- Razaque, A.; Yaser, J.; Bandar, A.; Munif, A.; Salim, H.; Muder, A. Energy-efficient and secure mobile fog-based cloud for the Internet of Things. Future Gener. Comput. Syst. 2022, 127, 1–13. [Google Scholar] [CrossRef]
- Rani, S.; Himansh, B.; Gautam, S.; Thippa, R.; Gaurav, D. Security Framework for Internet-of-Things-Based Software-Defined Networks Using Blockchain. IEEE Internet Things 2022, 10, 6074–6081. [Google Scholar] [CrossRef]
- Ahmad, W.; Radzi, N.; Samidi, F.; Ismail, A.; Abdullah, F.; Jamaludin, M.; Zakaria, M. 5G technology: Towards dynamic spectrum sharing using cognitive radio networks. IEEE Access 2020, 13, 14460–14488. [Google Scholar] [CrossRef]
- Wang, Y.; Jun, Z. A survey of mobile edge computing for the metaverse: Architectures, applications, and challenges. In Proceedings of the 8th International Conference on Collaboration and Internet Computing (CIC), Atlanta, GA, USA, 14–16 December 2022; pp. 1–9. [Google Scholar]
- Karakus, M.; Arjan, D. Quality of service (QoS) in software defined networking (SDN): A survey. Future Gener. Comput. Syst. 2017, 80, 200–218. [Google Scholar] [CrossRef]
- Li, W.; Yu, W.; Weizhi, M.; Jin, L.; Chunhua, S. Towards blockchain-based collaborative intrusion detection in software defined networking. IEICE Trans. Inf. Syst. 2022, 105, 272–279. [Google Scholar] [CrossRef]
- Yang, S.; Fan, L.; Stojan, T.; Ramin, Y.; Xiaoming, F. Recent advances of resource allocation in network function virtualization. IEEE Trans. Parallel Distrib. Syst. 2020, 32, 295–314. [Google Scholar] [CrossRef]
- Xu, F.; Liu, F.; Jin, H.; Vasilakos. Mobile Cloud Computing Framework for Securing Data. Proc. IEEE 2013, 102, 11–31. [Google Scholar] [CrossRef]
- Basu, D.; Abhishek, J.; Uttam, G.; Raja, D. QoS-aware Dynamic Network Slicing and VNF Embedding in Softwarized 5G Networks. In Proceedings of the 2022 National Conference on Communications (NCC), Virtual, 24–27 May 2022; pp. 100–105. [Google Scholar]
- Kim, S.; Kim, H. A vnf placement method based on vnf characteristics. In Proceedings of the 2021 International Conference on Information Networking (ICOIN), Virtual, 27–30 July 2021; pp. 864–869. [Google Scholar]
- Taniguchi, A.; Norihiko, S. A Method of Service Function Chain Configuration to Minimize Computing and Network Resources for VNF Failures. In Proceedings of the TENCON 2021–2021 IEEE Region 10 Conference (TENCON), Auckland, New Zealand, 7–10 December 2021; pp. 453–458. [Google Scholar]
- Yao, W.; Han, S.; Hai, Z. Scalable anomaly-based intrusion detection for secure Internet of Things using generative adversarial networks in fog environment. J. Netw. Comput. Appl. 2023, 214, 103622. [Google Scholar] [CrossRef]
- Zheng, Y.; Zheng, L.; Xiaolong, X.; Qingzhan, Z. Dynamic defenses in cyber security: Techniques, methods and challenges. Digit. Commun. Networks 2022, 8, 422–435. [Google Scholar] [CrossRef]
- Lee, P.H.; Fuchun, J.L. Tackling IoT scalability with 5G NFV-enabled network slicing. Advances in Internet of Things. J. Netw. Comput. Appl. 2021, 11, 123–139. [Google Scholar]
- Yang, K.; Zhang, H.; Hong, P. Energy-aware service function placement for service function chaining in data centers. In Proceedings of the 2016 IEEE Global Communications Conference (GLOBECOM), Washington, DC USA, 4–8 December 2016; pp. 1–6. [Google Scholar]



| Related Works | Solutions | Characteristics | Limitations |
|---|---|---|---|
| Rani et al. [20] | Machine learning-basedintrusion detection system forsoftware-defined networking | Predicts network traffic andoptimizes network performance | Requires a large amountof data to train the algorithms |
| Ahmed et al. [21] | A survey on networkvirtualization techniques andchallenges | Provides a comprehensive overview ofnetwork virtualization techniques andtheir potential benefits inimproving network performance,flexibility, and management | The proposed solutions maynot be applicable to allnetwork virtualization scenarios |
| Wang and Zhao [22] | A survey of mobile edgeComputing for the Metaverse:architectures, applications, and challenges | Reduces latency and bandwidthrequirements and improves networkperformance | Limited processing power andstorage capacity at thenetwork edge |
| Karakus and Durresi [23] | Quality of service (QoS)in software-defined networkingsurvey | Prioritizes network traffic andallocates bandwidth more effectively | Complexity in designing andimplementing QoS policies |
| Li et al. [24] | BlockCSDN:blockchain-based collaborativeintrusion detection insoftware-defined networking | Decentralized and tamper-proofrecord of network activity andimproved network security | High computational overheadand scalability issues |
| Yang et al. [25] | Advances in resource allocationin network function virtualization | Generalized and examined fourtypical resource allocation issuesfor QoS improvement and delaycalculation | The proposed solutions maynot be applicable to allNFV scenarios |
| Xu et al. [26] | Hybrid cloud computing:state-of-the-art, challenges,and future directions | Improves the security, privacy,and performance of hybridcloud systems | Requires additional resources andexpertise to implement andmaintain |
| Basu et al. [27] | QoS-aware dynamic networkslicing and VNF embeddingin softwarized 5G networks | Offers significant benefits interms of energy-efficientservice delivery, low latency,and optimized network efficiency | The MILP-based optimizationapproach may pose computationalchallenges in larger networkscenarios, and the approachmay require further validationin real-world deployments |
| Kim and Kim [28] | VNF placement methodbased on VNF Characteristics | Efficient VNF placement usinginformation about the resources of eachnode, which can lead to improvednetwork performance and resourceutilization | Increased complexity in termsof resource monitoring andupdating, as well as potentialscalability issues if thenumber of nodes and VNFsincrease significantly |
| Taniguchfi and Shinomiya [29] | A method of service functionchain configuration to minimizecomputing and network resourcesfor VNF failures | Reduces the computing resourcesrequired for SFC configurationcompared to previous studies,which can lead to cost savingsfor network operators | The proposed method maynot be suitable for alltypes of virtualized networks,and further research isneeded to evaluate itseffectiveness in different contexts |
| Yao et al. [30] | Anomaly-based approach forIoT | This approach improves the detectionaccuracy and reduces false positives.The main advantage of this approachis its ability to detect both knownand unknown attacks | Potential for higher resourceconsumption due to running multipledetection methods simultaneously |
| Zheng et al. [31] | Network firewall for cybersecurity in an IoT environment | The approach improves securityand reduces the potential for falsepositives. The main advantage of thisapproach is its ability to adaptto changing network conditions | The potential for higher resourceconsumption due to continuousanalysis and rule updates |
| Our Work | VNFSDN | Improved network performance andscalability and increased networkefficiency | Increased complexity andmanagement overhead due to theneed for specialized skills andtools to manage the virtualizednetwork functions |
| Approaches | Response Time | Packet Loss Rate | Network Availability | Traffic Management Time | Threat Detection Rate |
|---|---|---|---|---|---|
| (FSIDS) [11] | 0.46 (ms) | 5.0% | 93.31% | 47.2% | 80.23% |
| DeepVulSeeker [12] | 0.09 (ms) | 2.5% | 99.63% | 30.0% | 90.05% |
| (HADIDS) [26] | 0.28 (ms) | 3.0% | 99.01% | 33.01% | 81.0% |
| (DINF) [30] | 0.328 (ms) | 3.5% | 98.72% | 37.6% | 82.62% |
| Proposed VNFSDN | 0.08 (ms) | 2.0% | 99.5% | 27.4% | 99.36% |
| Approaches | MD Accuracy 1% | MD Accuracy 2% | MD Accuracy 5% | MD Accuracy 10% |
|---|---|---|---|---|
| (FSIDS) [11] | 97.32% | 96.88% | 94.49% | 93.41% |
| DeepVulSeeker [12] | 97.88% | 97.62% | 96.89% | 96.28% |
| (HADIDS) [26] | 97.45% | 96.74% | 94.71% | 94.19% |
| (DINF) [30] | 97.45% | 96.74% | 95.78% | 93.61% |
| Proposed VNFSDN | 99.77% | 99.57% | 99.36% | 99.22% |
Disclaimer/Publisher’s Note: The statements, opinions and data contained in all publications are solely those of the individual author(s) and contributor(s) and not of MDPI and/or the editor(s). MDPI and/or the editor(s) disclaim responsibility for any injury to people or property resulting from any ideas, methods, instructions or products referred to in the content. |
© 2023 by the authors. Licensee MDPI, Basel, Switzerland. This article is an open access article distributed under the terms and conditions of the Creative Commons Attribution (CC BY) license (https://creativecommons.org/licenses/by/4.0/).
Share and Cite
Razaque, A.; Yoo, J.; Bektemyssova, G.; Alshammari, M.; Chinibayeva, T.T.; Amanzholova, S.; Alotaibi, A.; Umutkulov, D. Efficient Internet-of-Things Cyberattack Depletion Using Blockchain-Enabled Software-Defined Networking and 6G Network Technology. Sensors 2023, 23, 9690. https://doi.org/10.3390/s23249690
Razaque A, Yoo J, Bektemyssova G, Alshammari M, Chinibayeva TT, Amanzholova S, Alotaibi A, Umutkulov D. Efficient Internet-of-Things Cyberattack Depletion Using Blockchain-Enabled Software-Defined Networking and 6G Network Technology. Sensors. 2023; 23(24):9690. https://doi.org/10.3390/s23249690
Chicago/Turabian StyleRazaque, Abdul, Joon Yoo, Gulnara Bektemyssova, Majid Alshammari, Tolganay T. Chinibayeva, Saule Amanzholova, Aziz Alotaibi, and Dauren Umutkulov. 2023. "Efficient Internet-of-Things Cyberattack Depletion Using Blockchain-Enabled Software-Defined Networking and 6G Network Technology" Sensors 23, no. 24: 9690. https://doi.org/10.3390/s23249690
APA StyleRazaque, A., Yoo, J., Bektemyssova, G., Alshammari, M., Chinibayeva, T. T., Amanzholova, S., Alotaibi, A., & Umutkulov, D. (2023). Efficient Internet-of-Things Cyberattack Depletion Using Blockchain-Enabled Software-Defined Networking and 6G Network Technology. Sensors, 23(24), 9690. https://doi.org/10.3390/s23249690


