

Objective Measurement of Posture and Movement in Young Children Using Wearable Sensors and Customised Mathematical Approaches: A Systematic Review

 , , ,
, , ,  , , and
Abstract
:1. Introduction
- How has young children’s posture and movement been objectively classified and measured using accelerometry and machine learning or other non-machine learning algorithm-based methods?
- What is the degree of accuracy of systems developed for the measurement of young children’s posture and movement using machine learning models, or other non-machine learning algorithm-based methods applied to accelerometry data?
2. Materials and Methods
2.1. Search Strategy
2.2. Eligibility Criteria
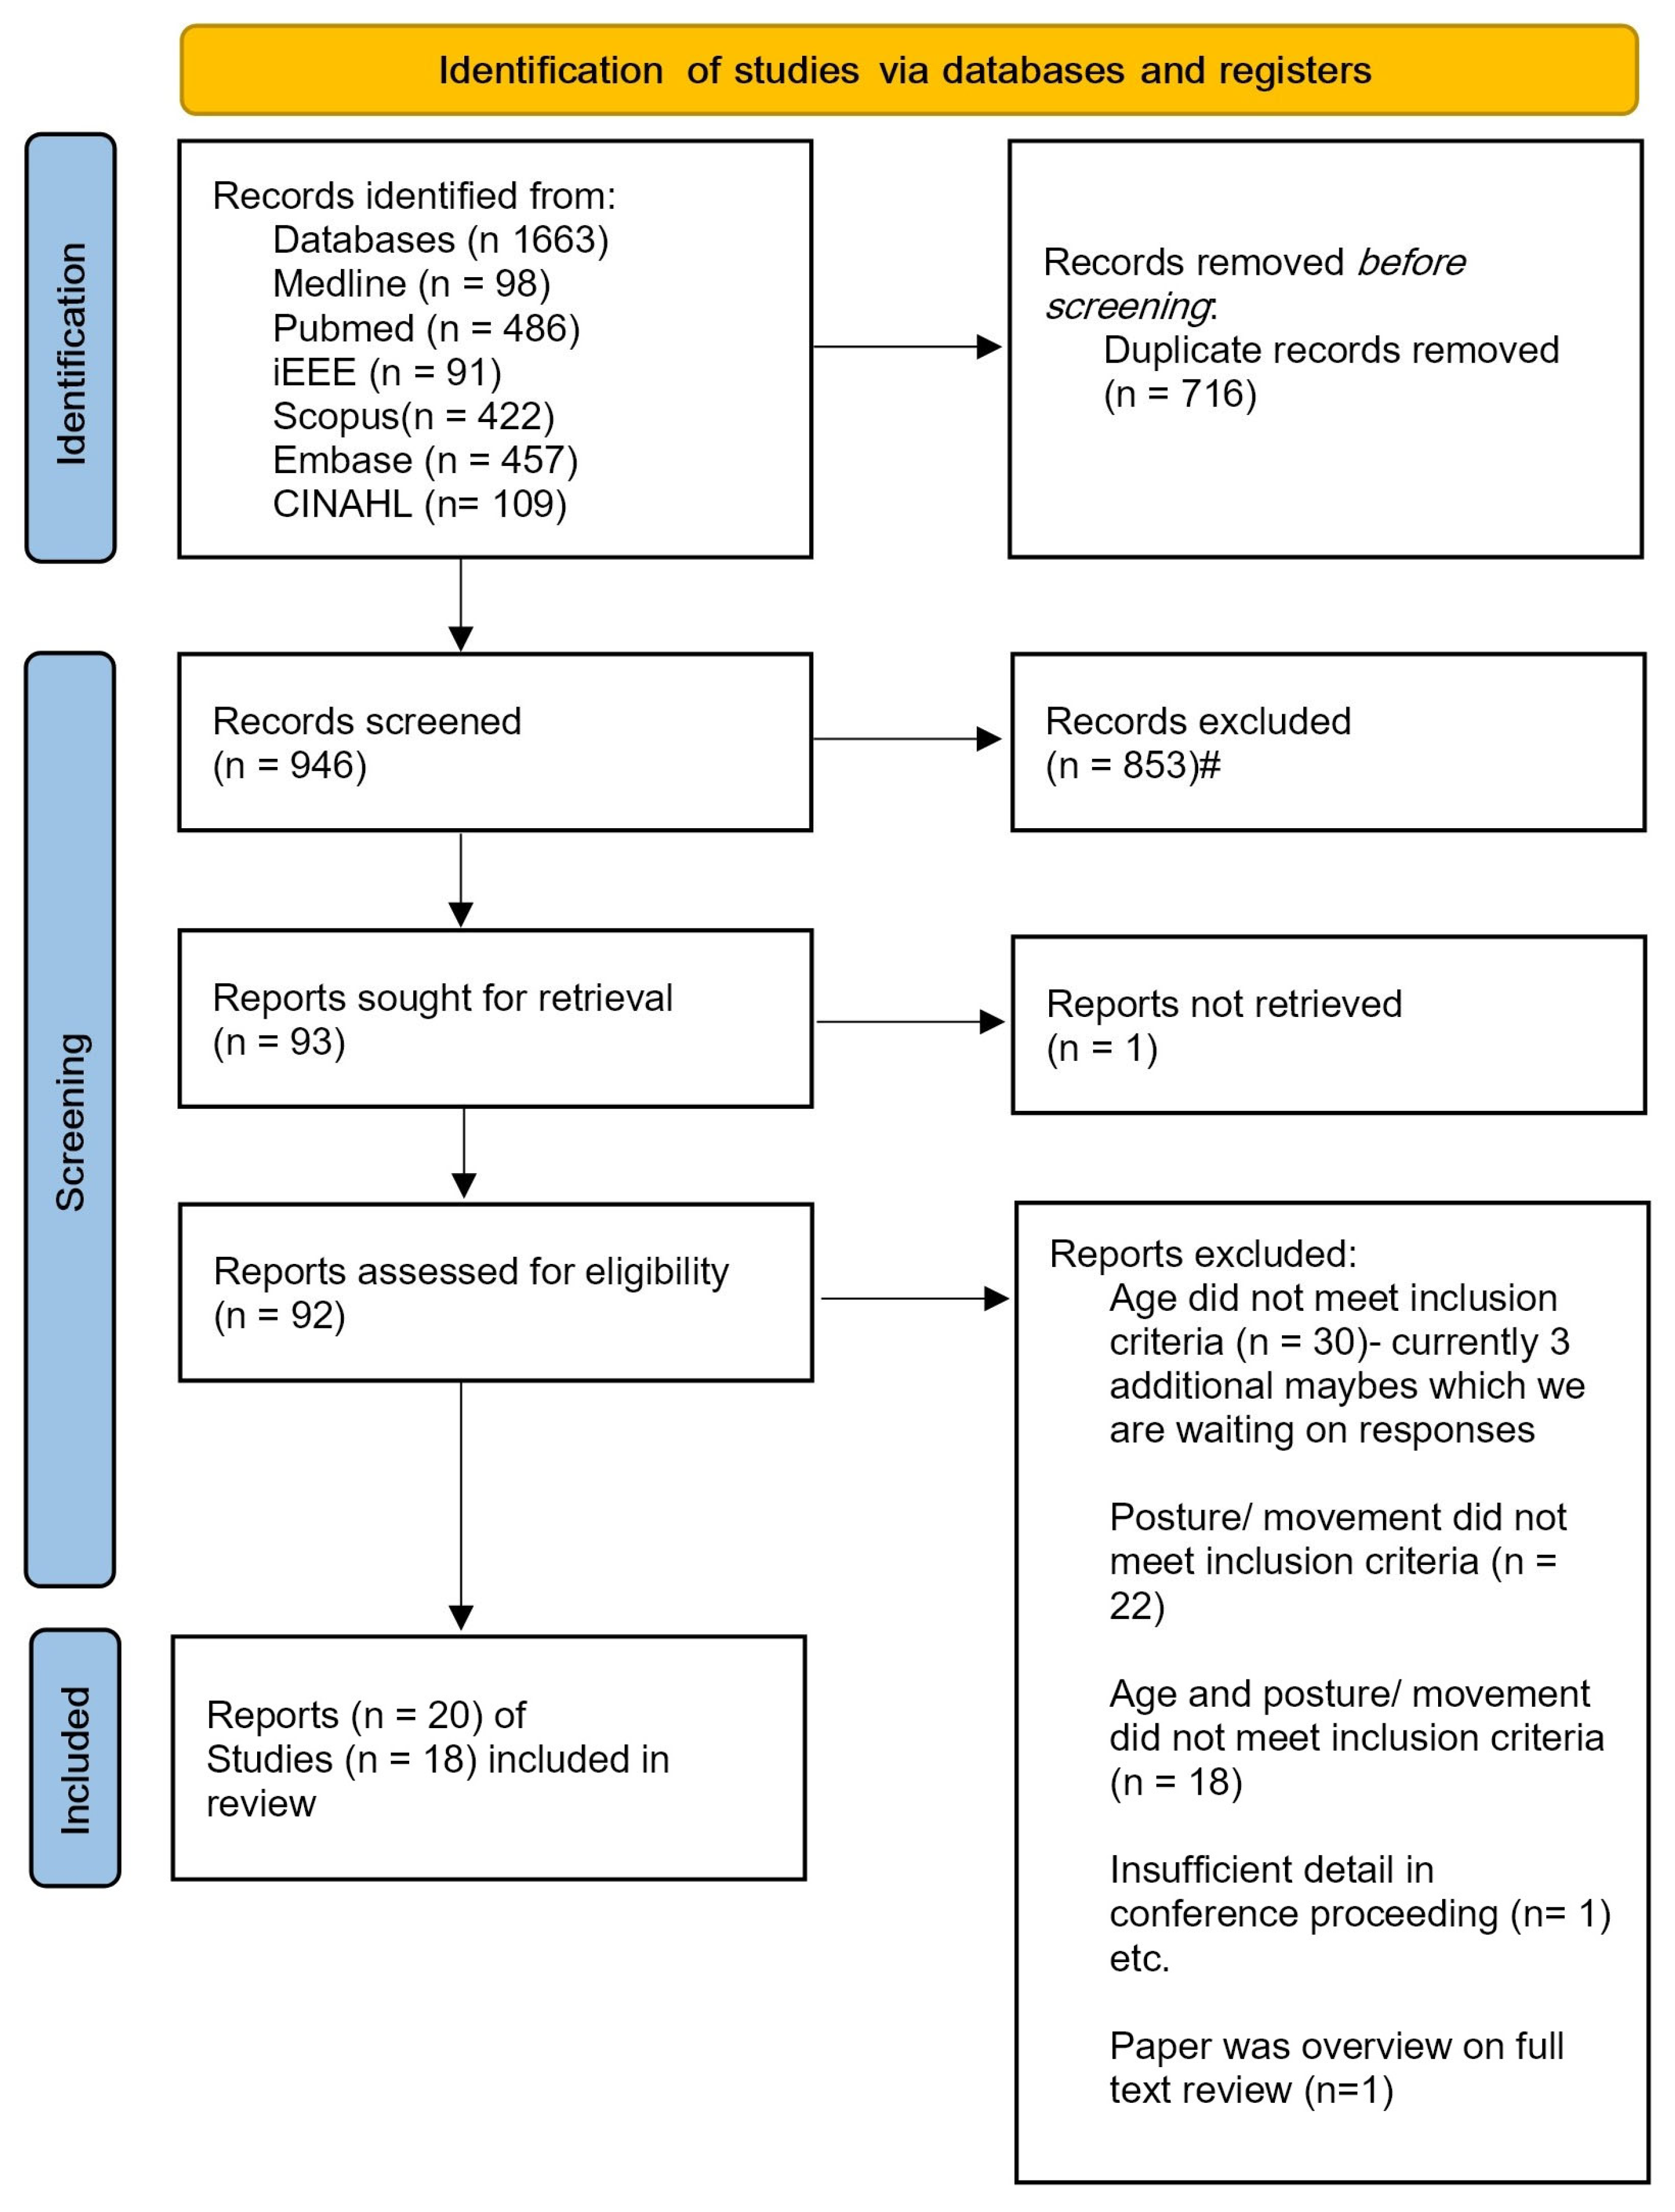
2.3. Screening for Relevant Studies to Include in the Review
2.4. Quality Assessment of Individual Studies Included in the Review
2.5. Data Extraction and Synthesis of Individual Studies Included in the Review
3. Results
3.1. Quality Assessment

| Author, Date | General Design Items | Number of Good or Adequate (out of 8) | |||||||||
|---|---|---|---|---|---|---|---|---|---|---|---|
| 1 | 2 | 3 | 4 | 5 | 6 | 7 | 8 | 9 | 10 | ||
| Parkka, 2010 [21] | A | G | A | D | A | I | I | I | 4 | ||
| Boughorbel, 2011 [22] | I | A | D | D | I | I | I | I | 1 | ||
| Trost, 2012 [23] | G | G | G | G | G | A | A | G | 8 | ||
| Suzuki, 2012 [24] | D | A | G | G | G | I | I | I | 4 | ||
| Nam, 2013 [25] | D | A | G | G | G | I | I | I | 4 | ||
| Zhao, 2013 [26] | A | G | G | A | A | G | I | A | 7 | ||
| Goto, 2013 [27] | A | G | G | G | G | D | I | I | 5 | ||
| Hagenbuchner, 2015 [28] | A | G | G | G | G | G | G | A | 8 | ||
| Hegde, 2018 [29] | G | G | G | G | A | A | I | A | 7 | ||
| Trost, 2018 [30] | A | G | G | G | G | G | G | A | 8 | ||
| Hewitt, 2019 [19] | G | G | A | G | G | G | G | G | 8 | ||
| Li, 2019 [31] | D | A | G | G | G | I | I | I | 4 | ||
| Kwon, 2019 [32] | A | A | D | A | A | G | G | A | 7 | ||
| Ahmadi and Brooks, 2020 [33] | A | G | NA | NA | I | A | G | A | 5 | ||
| Ahmadi and Pavey, 2020 [34] | A | G | G | G | A | A | G | A | 8 | ||
| Airaksinen, 2020 [35] | A | G | G | G | G | G | A | I | 7 | ||
| Jun, 2020 [36] | D | I | D | G | I | I | I | A | 2 | ||
| Franchak, 2021 [37] | G | G | G | G | G | G | G | A | 8 | ||
| Airaksinen, 2022 [38] | A | G | G | A | G | G | A | A | 8 | ||
| Madej, 2022 [20] | D | G | I | I | A | D | I | I | 2 | ||
| Number of studies that scored G or A (out of 20) | 14 | 19 | 15 | 16 | 17 | 12 | 10 | 12 | |||
| Author, Date | Criterion Items | Number of Good or Adequate (out of 5) | |||||
|---|---|---|---|---|---|---|---|
| 1 | 2 | 3 | 4 | 5 | 6 | ||
| Parkka, 2010 [21] | I | I | I | G | I | 1 | |
| Boughorbel, 2011 [22] | D | I | I | G | I | 1 | |
| Trost, 2012 [23] | I | G | I | I | I | 1 | |
| Suzuki, 2012 [24] | A | I | A | I | I | 2 | |
| Nam, 2013 [25] | D | I | A | A | I | 2 | |
| Zhao, 2013 [26] | A | G | G | G | I | 4 | |
| Goto, 2013 [27] | A | A | A | I | I | 3 | |
| Hagenbuchner, 2015 [28] | I | A | I | G | I | 2 | |
| Hegde, 2018 [29] | I | A | I | G | I | 2 | |
| Trost, 2018 [30] | I | A | I | G | I | 2 | |
| Hewitt, 2019 [19] | G | G | G | G | G | 5 | |
| Li, 2019 [31] | I | A | A | G | A | 4 | |
| Kwon, 2019 [32] | G | G | G | I | G | 4 | |
| Ahmadi and Brookes, 2020 [33] | G | G | G | G | I | 4 | |
| Ahmadi and Pavey, 2020 [34] | G | G | G | G | I | 4 | |
| Airaksinen, 2020 [35] | G | G | G | G | I | 4 | |
| Jun, 2020 [36] | A | A | G | G | I | 4 | |
| Franchak, 2021 [37] | G | A | G | G | G | 5 | |
| Airaksinen, 2022 [38] | G | G | G | G | G | 5 | |
| Madej, 2022 [20] | I | I | D | I | I | 0 | |
| Number of studies that scored G or A (out of 20) | 11 | 15 | 13 | 15 | 5 | ||
3.2. Study Design
| Author, Date | Participants (n, Age, Sex, Clinical or Typically Developing Population, How Recruited, Country where Study Completed) | Study Aim | Sensor Information (Number of Sensors (Company Name), Hardware Type, Hardware Specifications, Sampling Rate, Sensor Location) | Specific Postures and Movements Identified | Data Collection Procedure and Environment |
|---|---|---|---|---|---|
| Parkka, 2010 [21] | n = 7, 4–37 years old (one 4-year-old child), sex not reported, clinical/TD not reported, how recruited not reported, Finland. | To evaluate an activity recognition algorithm based on a decision tree classifier to automatically recognise physical activities on a portable device online, and a personalization algorithm to assist in monitoring an individual’s physical activity habits. | 4 sensors (Nokia). Hardware included: 3D accelerometer, sampled at 50 Hz, mounted on bilateral ankles and wrists. | Six activities: lying, sitting, standing, walking, bicycling, running. | Standardised tasks; volunteers performed 5 min of each activity, no detail of data collection environment. |
| Boughorbel, 2011 [22] | n = 1, 2 years old, sex not reported, clinical/TD not reported, how recruited not reported, Netherlands. | To apply automatic recognition of child activities with two targeted applications: real-time automatic recognition of acute child safety (e.g., fall detection and stair climbing) and long-term activity recognition and logging to track child development and prevent child obesity. | 1 sensor. Hardware included: tri-axial accelerometer, tri-axial gyroscope, air pressure, sampled at 50 Hz, placed in back trouser pocket. | Seven activities: walking, lying down, running, climbing stairs, falling, other. | Free play; 30 min total, indoors “normal activity” suggesting home environment. |
| Trost, 2012 [23] | n = 100, 5–15 years old, evenly distributed across age range and approximately equal male and female (no specific details reported), clinical/TD not reported, how recruited not reported, Australia. | To develop and test neural networks to predict children’s activity type and physical activity energy expenditure. | 1 sensor (Actigraph GT1M), Hardware included: an accelerometer, magnitude range 0.05–2.0 g. sampled at 30 Hz. Indirect calorimetry using Oxycon Mobile. Mounted on waist at mid-axilla line at the level of the iliac crest. | 12 activities classified into five distinct physical activity types: sedentary (lying down, handwriting, computer game); walking (comfortable overground walk, brisk overground walk, brisk treadmill walk); running (overground run/jog); light-intensity household activities or games (floor sweep, laundry task, throw and catch); moderate-to-vigorous-intensity games or sport (aerobic dance, basketball). | Standardised tasks; Collected the 12 activity trials over two laboratory visits scheduled in a 2-week period. Each activity trial 5 min, except lying down, which was 10 min. Utilised 2 min of data from middle of trial for each activity for model development |
| Suzuki, 2012 [24] | n = 6, 3–5 years old, all female, clinical/TD not reported, how recruited not reported, Japan. | To evaluate the accuracy of one arm accelerometer for activity recognition, the difference in accuracy between child and adult, and whether SOM has advantages over other classifiers. | 1 sensor (Angel band). Hardware included: accelerometer, EMG, temperature, RFID, microphone. The accelerometer was a 3-axis Wireless Tech sensor magnitude range ±17 g, sampled at 100 Hz. Mounted on upper arm. | Seven activities: standing, walking, running, sitting, sleeping (lying), climb up, and climb down. | Standardised tasks, each activity performed for at least 15 s. ~4 min for each participant. Unclear environment. |
| Nam, 2013 [25] | n = 3, 16–20 months old, all male, TD, how recruited not reported, Korea. | To describe and evaluate an activity recognition system using a single 3-axis accelerometer and a barometric sensor worn on the waist of the body. | 1 sensor (SkyeModule M1-mini). Hardware included: a 3-axis accelerometer, one air pressure sensor and one near-field sensor RFID. Accelerometer magnitude range, ±2 g, sampled at 95 Hz. Mounted on the hip. | 11 activities: wiggling, rolling, standing still, standing up, sitting down, walking, toddling, crawling, climbing up, climbing down, stopping. | Standardised tasks. Participant performed 1–2 s trial for each of 11 activities. Single home living room and kitchen environment. |
| Zhao, 2013 [26] | n = 69, 3–5 years old, ‘balanced age and gender’, TD with 20% classified as overweight/obese, recruitment reported, USA. | To develop and compare multinomial logistic regression and SVM classification of physical activities among preschool children using triaxial accelerometry data. | 1 sensor (ActiGraph GT3x+) Hardware type: accelerometer, magnitude range ±6 g, sampled at 30 Hz. Mounted on right hip. | 12 activities: Sleep, watch TV, seated colouring at desk, seated video games, seated floor puzzles, play toy kitchen/blocks, ball toss and quick walking, standing active video game, dance following video instructor, aerobics following video instructor, running in place on game mat. Reclassified into six activities: sleep, rest reclining, quiet sitting play, low active play standing, moderately active play standing, very active play standing. | Standardised tasks. Children wore the sensor one full day (9 a.m.–4 p.m.) and performed a series of activities in a set order, each for 10 min to 2 h duration with some free-time light activities in between. |
| Goto, 2013 [27] | n = 10, 3–5 years old, sex not stated, clinical/TD not reported, recruited via childcare centre, Japan. | To develop and evaluate a single arm sensor and SOM system to classify infant activities. | 1 sensor (Wireless-T), Hardware: 3-axis accelerometer magnitude range 17 g, sampled at 100 Hz. Mounted on upper arm. | Seven activities subcategorised into two classes: dynamic activities (walking, running, playing) and static activities (sleeping, eating, hand motion, sitting). | Duration not stated. Some scenarios required of child e.g., sitting reading book and playing a puzzle. |
| Hagenbuchner, 2015 [28] | n = 11, 3–6 years old, 45% male, clinical/TD not reported, reports 9.1% were overweight, word-of-mouth recruitment, Australia. | To evaluate conventional feed-forward artificial neural network with more advanced deep learning-inspired neural network for predicting physical activity types in preschool children. | 1 sensor (Actigraph GT3x+), Hardware type: accelerometer, magnitude range ±6 g, sampled at 100 Hz. Mounted on hip. | Five classes: sedentary, light activities/games, moderate-to-vigorous activities, walking, running. | Standardised tasks. 12 structured activity trials (e.g., watching TV, doing collage, playing active game) for 4–5 min each over two lab sessions within a three-week period. First visit: watching television, sitting on the floor reading, standing making a collage on a wall, walking, playing an active game, and completing an obstacle course. Second visit: sitting on a chair, playing a computer tablet game, sitting on floor playing quietly with toys, treasure hunt, cleaning up toys, bicycle riding, and running. |
| Hegde, 2018 [29] | n = 21, 11 typically developing children (mean age = 6.6 ± 1.5 years), 55% male, 10 children with cerebral palsy (mean age 6.2 ± 1.5 years), 60% male, recruitment unclear, USA. | To develop a wearable sensor system for combined activity and gait monitoring in children with cerebral palsy. | 6 sensors, Hardware types: 1 3-D accelerometer and 5 Force Sensitive Resistor (FSR) sensors (intelink), sampled at 400 Hz. FSR sensors in insole. Accelerometer mounted on back of heel of shoe within a plastic enclosure. | Four classes (each with different conditions): sitting (on child chair, on adult chair, on parent’s lap, on floor playing with toys); standing (standing still, standing while playing with toys, standing while being dressed); walk (slow walk, fast walk, run, each also completed on GAITRITE). | Standardised tasks in a laboratory. Each condition completed for 2 min. When child walked on GAITRite, it was for the span of the GAITRite mat. |
| Trost, 2018 [30] | n = 11, 3–6 years old, 45% male, clinical/TD not stated—however, states that 9.1% were overweight, word-of-mouth recruitment, Australia. | To develop, test, and compare human activity recognition algorithms trained on raw accelerometer signal from wrist, hip and the combination of wrist and hip in preschool-aged children. Evaluated conventional physical activity cut-point methods to activity class recognition models. | 2 sensors (Actigraph GT3x+), Hardware type: accelerometers, magnitude range ±6 g, sampled at 100 Hz. Mounted on hip and non-dominant wrist. | Five classes: sedentary, light activities/games, moderate-to-vigorous activities, walking, and running. | 12 structured activity trials, identical Hagenbuchner, 2015. |
| Hewitt, 2019 [19] | n = 32, 4–25 weeks, 59% male, recruited from early childhood nurse and advertisements around university. Unclear if typically developing. Referred to as “sample of convenience”, Australia. | To test the practicality of using accelerometer-based devices on an infant’s body to objectively measure tummy time and test the accuracy of manufacturers algorithm or cut points for predicting posture. | 4 wearable sensors (Actigraph, GENEActive, MonBaby); Hardware type: accelerometers, 2 sampled at 30 Hz, 1 at 6.25 Hz. Mounted on right hip and ankle, and chest. | Three classes consisting of 12 positions: Prone floor positions (prone-on-floor attempt 1 and 2); non-prone positions (supine, left-side lie, right-side lie, cradle hold, reclined in car seat, upright against parents shoulder while parent is standing, supported sitting on lap of parent, reclined in pram); prone supported positions (being held while infant is on tummy (carer sitting or standing)); prone but lying on parent’s chest who was reclined on bean bag. | Standardised tasks. 1 h testing, testing session video recorded. Infant placed in each position by parent for 3 min. |
| Li, 2019 [31] | n = 16, age 5–15 years old, sex not stated, clinical/TD likely asthmatic, unclear recruitment, however, reference dataset, BREATHE cohort, USA. Final data n = 14 (as two had substantial missing data). | To develop a sensor-based integrated health monitoring system for studying paediatric asthma–specifically monitoring physical activity. To compare greedy Gaussian segmentation (GGS) with a standard fixed-size window/sliding-window approach using data from 2 HAR studies (one adult, one child) of different durations and sensor locations (just one for children). | 1 sensor (Motorola Moto 360); Hardware type; 3-axis accelerometer and gyroscope, sampled at 10 Hz. Mounted on wrist. | Five activities: standing; sitting; lying; walking; stairs; running | Standardised tasks. 10 min for each activity, except 5 min for running. Location not stated. Randomly divided participants’ activity sessions (10 min long) into 10 subsessions. Randomly shuffled all subsessions. |
| Kwon, 2019 [32] | n = 24, 13–35 months old (‘50% one year olds’), 50% girls, recruited among visitors to a commercial indoor playroom, clinical/TD not stated, children had to be able to independently walk, USA. Final data n = 21. | To describe raw accelerometer and activity count for nine activities; to evaluate the use of ML to separate ‘being carried’ from ambulatory behaviours, and to evaluate the use of ML to separate ‘being carried’ from crawling. | 2 sensors (Actigraph GTxX-BT) Hardware type: accelerometer, magnitude range ±6 g, sampled at 30 Hz. Mounted on hip and non-dominant wrist (left when non-dominant was unknown). | Nine classes: run, walk, crawl, climb, ride-on-toy, stand, sit, stroller/wagon, and carried. | Standardised tasks performed in a commercial playroom from where participants were recruited—familiar environment. Caregiver encouraged child to do the nine behaviours e.g., kitchen play for standing, block play for sitting. Mean 15 min (range 8–25 min) data per child. Mean accelerometer data per behaviour/child was 6–14 s. First and last s of activity not used. Average of 15 min of data per participant, range of 8–25 min. |
| Ahmadi and Brookes, 2020 [33] | n = 31, 3–5 years old, mean age 4.0 ± 0.9 years, 22 male, clinical/TD not stated, mainly word of mouth/local recruitment, Australia. | To evaluate the classification accuracy in free-living conditions of an existing laboratory-developed ML system for preschoolers. | 1 sensor (Actigraph GT3x) Hardware type: accelerometer, magnitude range ±6 g, sampled at 100 Hz. Mounted on hip and non-dominant wrist. | Five classes: sedentary, light activities and games, moderate-to-vigorous activities and games, walk, run. | Free play. 20 min free play in home or park chosen by parent, some age-appropriate toys provided, no prompting for activities performed. |
| Ahmadi and Pavey, 2020 [34] | Identical to Ahmadi and Brookes, 2020. | To evaluate ML developed on free-living data, using 1–15 s windows (1, 5, 10, 15 s), lagged and lead frames, and based on multiple sensors. | Identical to Ahmadi and Brookes, 2020. | Identical to Ahmadi and Brookes, 2020. | Identical to Ahmadi and Brookes, 2020. |
| Airaksinen, 2020 [35] | n = 24, 7 months old (range 4.5–7.7 months, mean age 6.7 months ±0.84; 9 male), TD, recruited via larger ongoing research project, Finland. Final data n = 22. | To develop a wearable sensor suit-based system to assess infant movements as early indicator of neurocognitive disorders. | 4 sensors; Hardware: triaxial accelerometer and gyroscope (Movesense IMU), Sampled at 52 Hz, Mounted on upper arms and legs. | Iteratively developed five posture categories: prone, supine, side left, side right, crawl position. Eight movement categories: macro still, turn left, turn right, pivot left, pivot right, crawl proto, crawl commando, crawl 4 limbs (crawl 4 limbs omitted as only one recording utilised category). | Standardised tasks. In clinic-like settings for 30–60 min. Physiotherapist encouraged a range of postures and movements by play without touching infant. Movements collected while infant was placed on a foam mattress. Mean 29 min of data collection (range 9–40 min). Total of 12.1 h recorded. |
| Jun, 2020 [36] | n = 10, 2–720 days old, 7 male, potentially some clinical population as authors refer to “newborn’s physical condition and other medical devices attached”, recruitment strategy unclear, Korea. | To develop a method which can classify activity types from sensor signals, whether subjects are asleep, how strong movements show, and whether external forces affect them. | 1 sensor; Hardware type; triaxial accelerometer and thermometer, sampled at 40 Hz. Mounted to clothing on “upper chest area”—any area of the chest and above clothes without giving precise position and clothes condition. | Three levels of classification: sleeping/non-sleeping; sleeping/active movement/external force movement; and sleeping/strong movement (struggling or crying in agony)/weak movement (awake and moving in comfortable state)/external force movement. | Unlcear activities. No detail on what specific activities the newborn performed. Video lengths ranged from 5–150 min in duration (700 min total). Some participants did not include both sleep and awake states. |
| Franchak, 2021 [37] | Laboratory study: N = 15, 6–18 months old, eight female, TD unclear, recruited via social media advertisements and local community recruitment events, USA. Home data collection case study: N = 2, 10.5–11 months old, sex unclear. Likely from the lab study; however, unclear in reporting. Note neither infant could walk independently; however, both could stand, cruise along furniture, and walk while supported with a push toy or caregiver assistance. | To develop and validate a classification system using infant-worn inertial sensors to classify typical postures and movements in an infant’s day, to assist with monitoring infant movement behaviours in the home environment. Aimed to assess whether the method could accurately detect individual differences in how much time infants spend in different postures, to characterise everyday movement experiences and their potential for developmental impact. | Laboratory study: 3 sensors (MetamotionR IMU); accelerometer and gyroscope, sampled at 50 Hz. Mounted on right hip, thigh, and ankle. Home data collection case study: four Biostamp IMUs (accelerometer and gyrosocope) Sampled at 62.5 Hz, embedded in pair of customized infant leggings–placed bilateral hip and ankle. | Five body positions: supine (lying on back), prone (lying flat on stomach or in crawling position), sitting (sitting on a surface with or without support from caregiver, the highchair, or on caregiver’s lap), upright (standing, walking, or cruising along furniture), held by caregiver (carried in caregiver’s arms, excluding times they were seated on caregiver’s lap). | Standardised tasks in a laboratory: 10 activities (assisted or unassisted)—standing upright, walking, crawling, sitting on the floor, lying supine, lying prone, held by a stationary caregiver, held by a caregiver walking in place, sitting restrained in a highchair. Completed each activity for 1 min, total session lasting 10 min, followed by free play to allow for spontaneous body positions. Standardised tasks in the home environment: Experimenter guided caregiver via phone through a set of procedures to elicit different body positions—tasks the same as the laboratory tasks, completed each activity 1 min, followed by 10 min of free play. Following free play, infant and caregiver went about day as normal wearing IMUs for approx. 8 h—video recording was for up to 180 min during this time. |
| Airaksinen, 2022 [38] | n = 59, 4.5–19.5 months old, sex not stated, n = 38 neurodevelopment low-risk term born, n = 10 mild prenatal asphyxia, n = 11 prematurity, 4 later found to have neurodevelopmental condition (left out of some modelling), recruited from hospital, Finland. | To develop a wearable sensor suit-based system to assess infant movements, across infant milestones from lying to walking as early indicator of neurocognitive disorders | Identical to Airaksinen 2020. | Iterative developed posture/movement matrix of five different postures with four movement conditions for each posture: postures (supine, prone, crawl, sitting, standing) and movements (still, proto, elementary, fluent, other, carrying). | Free play at home (n = 40) or home like clinic (n = 24). Average data 67 min (range 18–199 min) total recording time 71 h and 30 min. Children encouraged to free play with little adult interference, differences in environment/play opportunities. Participants collected at home instructed to play for at least 1 h. |
| Madej, 2022 [20] | n = 10, 4–40 years old (mean 24 years ± 14 years), 7 men, unclear if clinical/TD, unclear recruitment, Poland. | To determine whether there is a difference in physical activity assessment between wrist-worn sensor on the dominant and non-dominant arm and between lower back and hip-worn sensor. | 2 sensors (Mbient Lab Meta-motion IMU’s). Hardware type: accelerometer, gyroscope and magnetometer. Accelerometer range was ±16 g at 100 Hz, magnetometer range as ±1300 uT at 25 Hz and gyroscope was ±2000 st/s. The 4 sensors were mounted on both wrists, lower back, and hip on dominant hand side (upper limb collected separately to low back and hip). | Nine activities: jumping, rotating, running, walking, walking on tiptoe, clapping hands, standing still, sitting still, and dancing. | Standardised tasks. All activities performed for 15 s with 5 s standing between and done twice—once with two wrist sensors and once with two lower-body sensors. 10 s of each activity was used for analysis. |
3.2.1. Participants
3.2.2. Aims
3.2.3. Sensor Information (Type, Sampling Rate, Number of Sensors, Locations)
3.2.4. Postures and Movements Measured
3.2.5. Data Collection Methods
3.3. Classification Model Development
| Author, Date | Approach | Window Details (Size, Overlapping or Non-Overlapping) | Feature Extraction | Machine Learning Method Used |
|---|---|---|---|---|
| Parkka, 2010 [21] | Non-ML | Non-overlapping 5 s windows | Four features obtained: intensity of highest peak in power spectral density; average signal; signal spectral entropy; and signal variance. Only ankle accelerometer vertical axis data used for computing feature signals. | N/A |
| Boughorbel, 2011 [22] | ML | Windows size not specified. | Four first-order (vector magnitude of accel, vector mag of gyro, normalised Z of accel, measured air pressure) and for each of these, five second-order features calculated (moving average, moving variance, moving RMS 0.1–2 Hz, moving RMS 2–4 Hz moving average slope) i.e., 20 s-order | Linear (LDA), Quadratic (QDA), and AdaBoost classifiers. |
| Trost, 2012 [23] | ML | Sequence of non-overlapping windows of 10,15, 20, 30, and 60 s duration | Six features obtained: 10th, 25th, 50th, 75th, and 90th percentiles of second-by-second counts and the lag one autocorrelation. | Feed-forward neural network with a single hidden layer. |
| Suzuki, 2012 [24] | ML | Features extracted by moving windows with 50% overlap (window size not specified). | Five features: mean, standard deviation, energy, correlation, frequency domain entropy. | J48, Naïve Bayes, NBTree, Random Forest, RandomTree, REPTree, and self-organizing map (SOM). |
| Nam, 2013 [25] | ML | Window size of 256 with overlapping at 128 at 95 Hz. | Features obtained for x, y, z, and derived horizontal and vertical traces. Five time domain and two frequency domain features extracted for each. | Naïve Bayes, Bayes Net, Support Vector Machine, k-Nearest Neighbour, J48 Decision Tree, Decision Table, Multilayer Perceptron, Logistic Regression. |
| Zhao, 2013 [26] | ML | Non-overlapping windows of 60 s. | Counts in x, y, and z, vector magnitude, position, steps, lag/lead values. | k-means used to identify clusters of activities—used as evidence to recategorize the data; MLR and SVM used to classify; 58 classifier models built. Models including and not including sleep. |
| Goto, 2013 [27] | ML | Moving window 50% overlap (although window size not specified). | Two-stage process. Phase 1 determined if static or dynamic, using standard deviation and energy of each 3-axis. In phase 2, classified for static (sleeping, eating, hand motion, sitting) and dynamic (walking, running, playing) by adding movement of gradient to features. | Self-Organising Map (SOM) used for both phases. |
| Hagenbuchner, 2015 [28] | ML | Non-overlapping window sizes of 10, 15, 20, 30 and 60 s. | Same features as Trost 2012 study. | Multi-layer Perceptron Network (MLP), Self-Organising Map (SOM), and third employed SOM as first layer followed by MLP. |
| Hegde, 2018 [29] | ML | Non-overlapping window size of 2 s. | 12 features extracted: six from each sensor: mean of sum of all five pressure sensor data from shoe (P_Sum), standard deviation of P_Sum, mean of resultant acceleration, standard deviation of resultant acceleration, number of mean crossings of P_Sum, number of mean crossings of resultant acceleration. | Multinomial Logistic Discrimination. |
| Trost, 2018 [30] | ML | Non-overlapping 15 s windows. | 18 time and frequency features extracted: mean, SD, minimum, maximum, interquartile range, percentiles (10th, 25th, 50th, 75th, 95th), coefficient of variation, signal sum, signal power, peak-to-peak amplitude, median crossings, dominant frequency between 0.25 and 5.0 Hz, magnitude of dominant frequency between 0.25 and 5.0 Hz, and signal entropy between 0.25 and 5.0 Hz. | Random Forest and Support Vector Machine each used for hip, wrist, and hip and wrist (total of six classifiers). |
| Hewitt, 2019 [19] | Non-ML | Window size of 1 s for Actigraph and GENEactiv and of 1/(5–7) s for MonBaby. | Actigraph: custom built Excel macro designed by Actigraph. Used specified X and Y-axis cut points hip Actigraph: X-axis > 0.7 g and Y-axis > −0.1 g for prone on floor; x axis > 0.7 g and Y-axis < −0.1 g for prone supported. For Actigraph ankle X and Z-axis cut points used; X-axis > 0.35 g and Z-axis > −0.45 g for prone. GENEActiv: algorithm developed by Activinsights Ltd.—formed by classifying each position for a scatter plot with rotation on the X-axis and elevation on the Y-axis MonBaby: 360-degree angle determined from X, Y, and Z-axes, 360-degree angles less than 134 degrees classified as non-prone. Prone on floor and prone supported positions were determined using Z-axis cut point of <−0.10 g. | N/A |
| Li, 2019 [31] | ML | Greedy Gaussian segmentation (GGS) compared to fixed-size non-overlapping windows of 0.2 s, 0.8 s, 3 s, 8 s, for HARuS data set, and 12 s and 40 s added for BREATHE. | 168 features: Six statistics (arithmetic mean, SD, median absolute deviation, minimum, maximum, and entropy) on 14 signals and on both the time and frequency domains (6 × 14 × 2 = 168). | XGBoost. SVM and Random Forests were also trained but only presented in supplementary material. |
| Kwon, 2019 [32] | ML | Segmented accelerometry into non-overlapping windows of 5 s. Only windows with single behaviour included. | Activity counts from accelerometer vertical, horizontal, perpendicular axis and vector magnitude, 30 time-domain (e.g., mean, SD, skewness) and 48 frequency-domain features (from FFT) were extracted. | Used Random Forest but only to differentiate between “carried” and “ambulation”. |
| Ahmadi and Brookes, 2020 [33] | ML | Non-overlapping sliding window of 15 s and considered ML including and not including mixed windows. | Same 18 features as Trost, 2018. | Used earlier Trost Random Forest and SVM models to test their efficacy on free-living behaviours. |
| Ahmadi and Pavey, 2020 [34] | ML | Non-overlapping windows of 1, 5, 10, 15 s. Mixed/not mixed activities. | Two sets of features were extracted: Base features (same 18 time- and frequency-domain features as prior work) and base plus temporal features (considering preceding and following windows, i.e., lead and lag, resulting in 5 additional features). | Random Forest. |
| Airaksinen, 2020 [35] | ML | Data windowed into 120-sample frames (2.3 s at 52 Hz) with 50% overlap between subsequent windows. | Two approaches compared, only first used features. 336 features extracted, with 14 features (variance, max amplitude, min amplitude, signal magnitude area, energy, interquartile range, skewness, kurtosis, largest frequency component, weighted average frequency, frequency skewness, and frequency kurtosis) for each of 24 data channels. | First was a Support Vector Machine. Second was a convolutional neural network with 3 stages—(1) sensor module to extract low-level features, (2) sensor fusion model for combining sensor features into common high-level features, (3) time series model for temporal modelling of high-level features. |
| Jun, 2020 [36] | ML | 160 elements, each length 3. Uses sliding windows of 40 elements, which corresponds to 1 s long. Two consecutive have 75% in common. Some data preprocessing but note, is essentially feeding sensor data into model. | N/A | Unsupervised deep learning. Model divided into autoencoder and k-means clustering algorithms. The first finds a minimal space that can reproduce signal. This minimal space is then clustered. |
| Franchak, 2021 [37] | ML | Overlapping moving windows of 4 s extracted every 1 s. Excluded windows where <75% single position. | 204 features extracted. Ten summary statistics for each combination of 3 sensor locations, 2 sensor signals, and 3 axes, resulting in 180 features: mean, standard deviation, skew, kurtosis, minimum, maximum, 25th percentile, 75th percentile, and sum. Sum and magnitude of movement across axes within each sensor. Correlations and difference scores between each pair of axes within a sensor and between each pair of sensors for a given axis. | Random Forest. |
| Airaksinen, 2022 [38] | ML | Same overlapping window as previous work, i.e., data windowed into 120-sample frames (2.3 s at 52 Hz) with 50% overlap between subsequent windows. | N/A | Similar CNN model as one used in Airaksinen 2020. |
| Madej, 2022 [20] | Non-ML | Features calculated for each accelerometer measurement. | 35 features extracted (mean, SD, skewness, kurtosis, energy, activity, mobility, complexity, and spectral purity index for each axis, 3 correlations between axes and the mean over 3 axes of mean, SD, skewness, kurtosis, energy) | N/A |
3.4. Model Accuracy
| Author, Date | Gold Standard Used for Comparison in Development (Including Inter-Coder Reliability Testing) | Validation Approach Used | Assessment of Accuracy | Accuracy of the System |
|---|---|---|---|---|
| Parkka, 2010 [21] | No detail provided. | No separate testing data set. Leave-one-subject-out (LOSO) cross-validation. | Confusion matrix. | Without personalisation: overall accuracy 86.6%, walking only accurately recognised 48% of the time. With personalisation: overall accuracy 95%. Model performance consistently poorer on single 4-years-old participant (74% accuracy). |
| Boughorbel, 2011 [22] | Synchronised video ‘manually annotated’. | Data from single child randomly split into training and test data sets (size not specified). 3-fold validation was employed. | Not stated. | Using first-order features, mean accuracy was 38 ± 1.5%. Using second order 97.8 ± 0.2%, using only accelerometer data 79.9 ± 1.5% (full confusion matrix provided). |
| Trost, 2012 [23] | No detail provided. | Data randomly divided into training, validation, and test sets of approximately the same size. 10 such random splits were performed. | Confusion matrix (proportion of time segments correct identified). | Walking 92–94% accuracy (accuracy increased with increase in window size). Running 74–79% accuracy (accuracy increased with increasing window size). Running trials most commonly misclassified as walking. If running and walking combined into “locomotion”, 96% accuracy. |
| Suzuki, 2012 [24] | Voice recording during data collection. | No separate testing/training data sets. Three validations undertaken against child and adult group. Self-validation trained by either child or adult data. K-fold cross-validation trained by same group data. Test data validation using other group data. | Only overall accuracies reported, not posture/movement specific. No confusion matrices presented. | Self-validation: Child 88 (REPT)-100% (SOM, RF, RT) Adult 93 (REPT)-100% (SOM, RF, RT) Cross-validation: Child 36 (REPT)-71% (RF) Adult 50 (REPT)-76% (RF) Test: Child 31 (NBT)-45% (C4.5) Adult 40 (C4.5)-50% (REPT) |
| Nam, 2013 [25] | Simultaneously video recorded and later annotated. | 1538 samples were collected from one baby as training data, other samples collected were used as test data set. 10-fold cross-validation. Precision, Recall, F measure reported. Accuracy for each movement reported. Confusion matrices for each approach reported. | Recognition accuracy reported for 8 different methods; however, how accuracy is calculated not specified—likely from confusion matrix. | Best performing: 95% for KNN and Decision Tree. Precision and recall: MLP kNN and Decision tree > 94%. Barometer data reduces false alarms for climbing up and down. |
| Zhao, 2013 [26] | Staff minute-to-minute observation while children in room. | No separate testing/training datasets; 10-fold cross-validation. Reported error rates as measure of accuracy. Confusion matrix reported. | Error rate: Number of observations that had been incorrectly classified in activity divided by number of observations of given activity. | Overall error rate with sleep: MLR ~30%; SVM ~26%. Without sleep: SVM 21%; ‘overall’ 16%. Similar activities with close rankings more difficult to classify than dissimilar activities. |
| Goto, 2013 [27] | Video recorded of child doing activities and synchronised to accel data. Types of activities discriminated by checking the time of acceleration data and video recorded activity. | No separate testing/training data sets; 10-fold cross-validation. Reported classification accuracy. | Not stated. | Mean 65% with range of 47% (eating) to 99% (sleeping). |
| Hagenbuchner, 2015 [28] | Not stated. | No separate testing/training data sets. LOSO cross-validation. | Confusion matrix. | 60 s window: SOM 54%; MLP 70%; DLEN 83%. 30 s window: SOM 53%; MLP 64%; DLEN: 76%. 10 s window: SOM 52%; MLP 61%; DLEN 72%. |
| Hegde, 2018 [29] | Smartshoe data was manually annotated, labelling the type, start, and end of each activity. No detail of what was the gold standard reference informing this. | No separate testing/training data sets. LOSO cross-validation. | Confusion matrix. | Typically developing children average accuracy 96.2%. Children with cerebral palsy average accuracy 95.3%. |
| Trost, 2018 [30] | No mention of gold standard; however, also compared to accelerometer cut-point methods (separate analysis). | No separate testing/training data sets. LOSO cross-validation. | Overall recognition accuracy (% of 15 s time windows correctly classified), agreement between predicted and observed class label evaluated by calculating weighted kappa coefficients. Compared to cut-point methods using sensitivity and specificity | Mean overall accuracy for Random Forest: Hip 80%; Wrist 78%; Combined 82%. Mean overall accuracy for SVM: Hip 81%; Wrist 80%; Combined 85%. New classifiers outperformed traditional cut-point methods for classifying PA levels. |
| Hewitt, 2019 [19] | Direct observation captured on video recording of whole session. Single observer coded each second of video. One randomly selected video analyzed by four observers to test interrater reliability (97.5%). | Not ML, so no testing set needed. Time spent in each position class was evaluated for each device against gold standard to determine percentage accuracy. | Based on number of seconds recorded compared to direct observations. | GENEActive: Prone on floor 95.4%; non-prone 98%; prone supported 52.2%. Actigraph Hip: prone on floor 90%; non-prone 99.9%; prone supported 63.6%. Actigraph Ankle: prone on floor 87.9%; non-prone 96.3%; prone supported 53.3%. MonBaby: prone on floor 79.2%; non-prone 99.9%; prone supported 66.1%. |
| Li, 2019 [31] | Not stated. | Multiple data sets tested but each divided into ~90% for training and ~10% holdout testing. Confusion matrix with precision and recall reported. | Not stated. | Overall average recall when using GGS was 73%. Overall averaged precision when using GGS was 86%. Instantaneous accuracy from XGBoost using GGS was 79.4%. Highest fixed-size window accuracy was 72.7%. |
| Kwon, 2019 [32] | GoPro video recorded. Three coders independently coded first four participants using draft coding scheme; after discussion and revision, two coders independently coded rest with 96% concordance. Accel and video synched using visual inspection of active/still. | No separate testing/training data sets; 10-fold cross-validation used to identify hyperparameters. LOSO cross-validation used to evaluate classifier performance. | Not explicitly stated and not reported for each PAM. No confusion matrix. | Carried vs. ambulation classification 89% from hip. No full confusion matrix reported. Only accelerometer descriptives for each behaviour and hip and wrist reported. |
| Ahmadi and Brookes, 2020 [33] | GoPro HERO 5 video of session, human-coded in two stages: (1) Five classes (sed, light/games, mv/games, walk, run) (2) 23 activity types (e.g., sit still, sit with upper limb movement). Some activities only performed by one participant, but classes performed by at least 28. Dual coding of five participants gave intraclass correlation coefficient for activity type of 0.912 and 0.927 for activity type. | Model already developed, therefore classification was based on testing the accuracy of the model derived from lab data on field data. Overall accuracy, unweighted kappa, only done for classes. Confusion matrix for class and specific activities. | Confusion matrix. | Overall wrist RF 59% and SVM 59%, fair agreement (kappa = 0.37). Poor at walk SVM 12% RF 15%; however, improved to 44% and 46%, respectively, when windows with multiple classes were removed. Overall hip RF 69% and SVM 66%, moderate agreement (0.45–0.48). Also poor at walk SVM 9% and RF 11%; however, improved to 29% and 33% when windows with multiple classes were removed. Erist reduced ~20% from lab study and hip ~15%. |
| Ahmadi and Pavey, 2020 [34] | Same as Ahmadi and Brooks, 2020. Cohen’s unweighted kappa statistic for activity class was 0.86, again taken from two researchers independently coding five randomly selected videos. | No separate testing/training data sets. LOSO cross-validation; 3 × 2 × 4 repeated measures ANOVA used to examine effects of sensor placement, feature set (base vs. temporal features), and window size on F scores. | F-scores were used to assess the accuracy of each model. Confusion matrices. | F scores for best-performing wrist and hip model were 81% and 86%, respectively. Shorter windows decreased accuracy. Lag/lead did improve accuracy for models trained on wrist data on 1, 5 and 10 s windows, and combined hip and wrist for 1 s windows, but not for any other models. Multiple sensors and feature fusion did not improve accuracy. Hip better than Wrist. F scores: Wrist 62–77%; Lag/lead 69–81%; Hip 71–84%; Lag/lead 76–86%; Both 72–84%; Lag/lead 77–86%. |
| Airaksinen, 2020 [35] | Video by Gopro (n = 14) or iPhone (n = 10). Independently annotated by three researchers. Interrater agreement tested with Fleiss kappa score, yielding 0.923 for posture and 0.580 for movement. Note, developed a novel iterative annotation refinement (IAR) method to resolve ambiguities in the training data by combining human- and machine-generated labels in a probabilistic fashion during model development. | No separate testing/training data sets. LOSO cross-validation. | Confusion matrices. | Classification accuracies of posture generally comparable between CNN and SVM. CNN better performance with several movement categories (CNN 5–10% better performing based on F score). For frames where all three humans rated the same (accuracy): posture 99% and movement 91%. For all frames (accuracy): posture 98% and movement 82%. Two-sensor data (1 arm, 1 leg) similar accuracy to four-sensor data but single sensor significantly worse (two-sensor posture 94%, movement 78%, four-sensor posture 95%, movement 79%, one-arm-only posture 71%, movement 70%, one-leg-only posture 90%, movement 68%). ML comparable to human consistency. |
| Jun, 2020 [36] | Video recorded during data collection using webcam connected to data acquisition computer at 30 fps and time-synchronised with sensor data. Used for ground truth reference. Coded by two independent coders and results subsequently compared to adjust different labels after consultation. Used iterative annotation refinement to fix the often-substantial interrater disagreements | Model trained on one participant (125 min video and sensor signals). Chose not to train on random selection of data from all subjects, stating there was a high probability that activities with low frequency, such as movement by external force, would not be included in training data. Data for remaining nine subjects used to test data. Reported F1 score, precision, and recall and balanced accuracy for each activity. | Recall, balanced accuracy. | Overall balanced accuracy 96%, ranges from 95–97%. |
| Franchak, 2021 [37] | In laboratory study, video recorded via handheld camcorder. Each video coded in its entirety by two coders; interrater reliability determined as overall agreement 97.6% and kappa of 0.966. Home data collection case study used 360-degree camera coded by single coder using same categories as laboratory study. | Individual model trained on 60% of data from individual and tested on remaining 40%. Group model LOSO cross-validation. Report classification accuracy. For home data collection case study, data from guided session combined and split into training and testing sets (60/40). | Sensitivity (i.e., proportion of actual occurrences that were correctly predicted). For home-based data collection case study. Predicted positions from ML model to actual coded positions in testing data, as well as prevalence, sensitivity, and positive predictive value for each body position. Correlations between actual and predicted positions for all available data. | Individual models: overall accuracy averaged 97.9% (SD 2.37%). Group model: overall accuracy averaged 93.2% (SD 0.053%). Home-based data collection case study: overall accuracy 85.2–86.6%. All available data correlations r = 0.911–0.976. |
| Airaksinen, 2022 [38] | Video 18–74 min in only n = 41 infants. Annotated by two (n = 9) or three (n = 32) independent researchers. Fleiss Kappa interrater reliability of 0.95 of postures and 0.6 of movements. Also used previously developed iterative annotation refinement (IAR) method to resolve ambiguities in the training data by combining human- and machine-generated labels in a probabilistic fashion. | No separate testing/training data sets. A number of classification activities reported which used either 10-fold or LOSO cross-validation. | Confusion matrices. | Active carrying vs. not 97%, carrying vs. not 99%. Posture overall kappa 0.93. Movement overall kappa not given, but kappa for each posture and movement shown in a figure. |
| Madej, 2022 [20] | Manually labelled offline (not explicitly stated what was used as the reference). | Mean activity vector distance used to conclude whether the constructed feature vector allowed the authors to distinguish between the analysed activities. Euclidean distance was averaged over subjects for each sensor separately, then for all sensors in selected IMU and configuration. | Not stated. | Best result accelerometer and magnetometer on non-dominant arm (trace of minimum distances matrix = 8), worst was gyroscope on lower back and magnetometer on hip (trace = 4). Conclude no differences between wrists, nor between low back and hip. |
| Range across Papers (n = Sum of Sample across Studies) | Parkka 2010, [21] n = 2, (4–8 Years) * | Boughorbel 2011, [22] n = 1, (2 Years) | Trost 2012, [23] n = 100 (5–15 Years) | Nam 2013, [25] n = 3 (16–20 Months) | Zhao 2013, [26] n = 69 (3–5 Years) | Goto 2013, [27] n = 10 (3–5 Years) | Hagenbuchner 2015, [28] n = 11, (PreSchool) | Hegde 2018, n = 21, [29] (Healthy Children) | Trost 2018, [30] n = 11 (3–6 Years) | Ahmadi and Brooks [33] 2020, n = 31 (3–5 Years) | Ahmadi and Pavey 2020, [34] n = 31, (3–5 Years) | Airaksinen 2020, [35] n = 22 (7 Months Old) | Franchak 2021, [37] n = 15 (6–18 Months) | Airaksinen 2022, [38] n = 59 (7 Months Old) | |
|---|---|---|---|---|---|---|---|---|---|---|---|---|---|---|---|
| Posture/Movement | |||||||||||||||
| Walk | 9–99% (n = 191) | 70–88% | 93% | 92–94% | 81–97% | 58% | 36–73% | 97–99% | 61–63% | 9–46% | 65–81% | ||||
| Run | 18–100% (n = 166) | 77–99% | 97 | 75–79% | 69% | 18–73% | 68–75% | 66–100% | 68–88% | ||||||
| Intensity classification | 51–89% (n = 153) | 58–98% | 51–91% | 69–93% | 57–84% | 68–93% | |||||||||
| Lying prone | 67–98% (n = 96) | 98% | 67% | 98% | |||||||||||
| Lying Supine | 87–97% (n = 96) | 97% | 97% | 87% | |||||||||||
| Stand | 66–100% (n = 86) | 74–95% | 100% | 66–98% | 90–92% | 96% | |||||||||
| Carrying | 45–99% (n = 84) | 45% | 97–99% | ||||||||||||
| Pivot | 62–66% (n = 81) | 63–66% | 62% | ||||||||||||
| Crawl | 65–84% (n = 81) | 65 | 84% | ||||||||||||
| Side lie | 77–81% (n = 81) | 77–81% | 78% | ||||||||||||
| Sit | 53–100% (n = 69) | 74–95% | 78–96% | 74% | 53% | 95–99% | 88% | 93% | |||||||
| Rolling | 65–99% (n = 62) | 94–99% | 64% | ||||||||||||
| Crawl position | 77–100% (n = 25) | 77–100% | 88% | ||||||||||||
| Still | 85% (n = 22) | 85% | |||||||||||||
| Turn | 58% (n = 22) | 58% | |||||||||||||
| Crawl commando | 60% (n = 22) | 60% | |||||||||||||
| Lying–position differentiation | 95–100% (n = 3) | 74–95% | 95% | ||||||||||||
| Climb | 55–96% (n = 3) | 55–96% | |||||||||||||
| Climb stairs | 99% (n = 1) | 99% | |||||||||||||
| Falling | 100% (n = 1) | 100% |
4. Discussion
4.1. Posture and Movement
4.2. Participant Sample
4.3. Study Type/Development Approach
4.4. Hardware
4.5. Software
4.6. Validation Approach and Accuracy
4.7. Strengths and Weaknesses
4.8. Implications
5. Conclusions
Author Contributions
Funding
Institutional Review Board Statement
Data Availability Statement
Conflicts of Interest
Appendix A
| CONCEPT 1 | CONCEPT 2 | CONCEPT 3 | CONCEPT 4 | |
|---|---|---|---|---|
| Key Terms | acceleromet* OR actigraph* OR “wearable sensor*” OR imu OR “inertial measurement unit*” OR “inertial sensor*” OR sensor OR “inertial motion unit*” OR “inertial movement unit*” | movement* OR postur* OR biomechanic* OR “bio-mechanic*” OR activit* OR “physical activit*” OR sit* OR lie OR lying OR walk* OR run* | child* OR infant* OR baby or babies OR toddler* OR preschool* OR “pre-school*” | “machine learn*” OR “transfer learn*” OR “activity recognition” OR HAR OR “deep learning” OR “hierarchical learning” OR algorithm |
| key terms (8 wildcards, 50 terms) | accelerometer OR accelerometry actigraph OR actigraphy “wearable sensor*” OR imu OR “inertial measurement unit*” OR “inertial sensor*” OR sensor OR “inertial motion unit*” OR “inertial movement unit*” | movement OR posture OR biomechanic* OR activity OR activities “physical activit*” OR sit OR lie OR walk OR run | Child OR infant OR baby OR toddler OR preschool OR “pre-school” | “machine learn” OR “transfer learn” OR “activity recognition” OR HAR OR “deep learning” OR “hierarchical learning” OR algorithm |
| Subject Headings | ||||
| Medline (MESH) | Accelerometry/or Actigraphy/ | Movement/ Motor Activity/ exp Posture/ Biomechanical Phenomena/ Physical Activity | Child, Preschool/ exp Infant/ | exp Machine Learning/ Algorithms |
| Pubmed | Accelerometry/or Actigraphy/ | Movement Posture Motor Activity Biomechanical Phenomena Sedentary Behaviour | Child, Preschool/ exp Infant/ | Machine learning algorithms |
| Embase | Accelerometer/accelerometry, actimetry, actigraph/inertial sensor sensor/ | Movement (physiology)/body position/biomechanics/motor activity, physical activity | Infant, preschool child, child toddler | Machine Learning Artificial intelligence Algorithm Deep Learning |
| IEEE | No subject headings | |||
| Scopus | No subject headings | |||
| CINAHL | Accelerometry OR Actigraphy OR Wearable Sensors | motor activity OR physical activity OR human activities | Infant, Newborn OR Child, preschool | Artificial Intelligence Machine Learning Deep learning |
References
- WHO Multicentre Growth Reference Study Group. WHO Motor Development Study: Windows of achievement for six gross motor development milestones. Acta Pædiatrica 2006, 450, 86–95. [Google Scholar] [CrossRef]
- Robinson, L.E.; Stodden, D.F.; Barnett, L.M.; Lopes, V.P.; Logan, S.W.; Rodrigues, L.P.; D’Hondt, E. Motor competence and its effect on positive developmental trajectories of health. Sports Med. 2015, 45, 1273–1284. [Google Scholar] [CrossRef] [PubMed]
- Karras, H.C.; Morin, D.N.; Gill, K.; Izadi-Najafabadi, S.; Zwicker, J.G. Health-related quality of life of children with developmental coordination disorder. Res. Dev. Disabil. 2019, 84, 85–95. [Google Scholar] [CrossRef] [PubMed]
- Stodden, D.F.; Goodway, J.D.; Langendorfer, S.J.; Roberton, M.A.; Rudisill, M.E.; Garcia, C.; Garcia, L.E. A developmental perspective on the role of motor skill competence in physical activity: An emergent relationship. Quest 2008, 60, 290–306. [Google Scholar] [CrossRef]
- Arts, J.; Gubbels, J.S.; Verhoeff, A.P.; Chinapaw, M.J.M.; Lettink, A.; Altenburg, T.M. A systematic review of proxy-report questionnaires assessing physical activity, sedentary behavior and/or sleep in young children (aged 0–5 years). Int. J. Behav. Nutr. Phys. Act. 2022, 19, 18. [Google Scholar] [CrossRef] [PubMed]
- Cox, M.F.; Petrucci, G.J.; Marcotte, R.T.; Masteller, B.R.; Staudenmayer, J.; Freedson, P.S.; Sirard, J.R. A novel video-based direct observation system for assessing physical activity and dedentary behavior in children and young adults. J. Meas. Phys. Behav. 2020, 3, 50–57. [Google Scholar] [CrossRef]
- Pate, R.R.; O’Neill, J.R.; Mitchell, J. Measurement of physical activity in preschool children. Med. Sci. Sports Exerc. 2010, 42, 508–512. [Google Scholar] [CrossRef]
- Bruijns, B.A.; Truelove, S.; Johnson, A.M.; Gilliland, J.; Tucker, P. Infants’ and toddlers’ physical activity and sedentary time as measured by accelerometry: A systematic review and meta-analysis. Int. J. Behav. Nutr. Phys. Act. 2020, 17, 14. [Google Scholar] [CrossRef]
- Romanzini, M.; Petroski, E.L.; Reichert, F.F. Accelerometers thresholds to estimate physical activity intensity in children and adolescents: A systematic review. Braz. J. Kinanthropometry Hum. Perform. 2012, 14, 101–113. [Google Scholar] [CrossRef]
- Skotte, J.; Korshoj, M.; Kristiansen, J.; Hanisch, C.; Holtermann, A. Detection of physical activity types using triaxial accelerometers. J. Phys. Act. Health 2014, 11, 76–84. [Google Scholar] [CrossRef]
- Phillips, S.M.; Summerbell, C.; Hobbs, M.; Hesketh, K.R.; Saxena, S.; Muir, C.; Hillier-Brown, F.C. A systematic review of the validity, reliability, and feasibility of measurement tools used to assess the physical activity and sedentary behaviour of pre-school aged children. Int. J. Behav. Nutr. Phys. Act. 2021, 18, 141. [Google Scholar] [CrossRef] [PubMed]
- Janssen, X.; Cliff, D.P. Issues related to measuring and interpreting objectively measured sedentary behavior data. Meas. Phys. Educ. Exerc. Sci. 2015, 19, 116–124. [Google Scholar] [CrossRef]
- Bulling, A.; Blanke, U.; Schiele, B. A tutorial on human activity recognition using body-worn inertial sensors. ACM Comput. Surv. 2014, 46, 33. [Google Scholar] [CrossRef]
- Narayanan, A.; Desai, F.; Stewart, T.; Duncan, S.; Mackay, L. Application of raw accelerometer data and machine-learning techniques to characterize human movement behavior: A systematic scoping review. J. Phys. Act. Health 2020, 17, 360–383. [Google Scholar] [CrossRef] [PubMed]
- Cust, E.E.; Sweeting, A.J.; Ball, K.; Robertson, S. Machine and deep learning for sport-specific movement recognition: A systematic review of model development and performance. J. Sports Sci. 2019, 37, 568–600. [Google Scholar] [CrossRef] [PubMed]
- Rast, F.M.; Labruyère, R. Systematic review on the application of wearable inertial sensors to quantify everyday life motor activity in people with mobility impairments. J. NeuroEng. Rehabil. 2020, 17, 148. [Google Scholar] [CrossRef] [PubMed]
- Chai, K.E.K.; Lines, R.L.J.; Gucciardi, D.F.; Ng, L. Research Screener: A machine learning tool to semi-automate abstract screening for systematic reviews. Syst. Rev. 2021, 10, 93. [Google Scholar] [CrossRef]
- Mokkink, L.B.; Terwee, C.B.; Patrick, D.L.; Alonso, J.; Stratford, P.W.; Knol, D.L.; Bouter, L.M.; de Vet, H.C.W. The COSMIN study reached international consensus on taxonomy, terminology, and definitions of measurement properties for health-related patient-reported outcomes. J. Clin. Epidemiol. 2010, 63, 737–745. [Google Scholar] [CrossRef]
- Hewitt, L.; Stanley, R.M.; Cliff, D.; Okely, A.D. Objective measurement of tummy time in infants (0–6 months): A validation study. PLoS ONE 2019, 14, e0210977. [Google Scholar] [CrossRef]
- Madej, M.; Ruminski, J. Optimal Placement of IMU Sensor for the Detection of Children Activity. In Proceedings of the International Conference on Human System Interaction, HSI, Melbourne, VIC, Australia, 28–31 July 2022. [Google Scholar]
- Parkka, J.; Cluitmans, L.; Ermes, M. Personalization algorithm for real-time activity recognition using PDA, wireless motion bands, and binary decision tree. IEEE Trans. Inf. Technol. Biomed. 2010, 14, 1211–1215. [Google Scholar] [CrossRef]
- Boughorbel, S.; Breebaart, J.; Bruekers, F.; Flinsenberg, I.; Ten Kate, W. Child-Activity Recognition from Multi-Sensor Data. In Proceedings of the ACM International Conference Proceeding Series, Eindhoven, The Netherlands, 24–27 August 2010. [Google Scholar]
- Trost, S.G.; Wong, W.K.; Pfeiffer, K.A.; Zheng, Y. Artificial neural networks to predict activity type and energy expenditure in youth. Med. Sci. Sports Exerc. 2012, 44, 1801–1809. [Google Scholar] [CrossRef] [PubMed]
- Suzuki, S.; Mitsukura, Y.; Igarashi, H.; Kobayashi, H.; Harashima, F. Activity Recognition for Children Using Self-Organizing Map. In Proceedings of the 2012 IEEE RO-MAN: The 21st IEEE International Symposium on Robot and Human Interactive Communication, Paris, France, 9–13 September 2012; pp. 653–658. [Google Scholar]
- Nam, Y.; Park, J.W. Physical activity recognition using a single triaxial accelerometer and a barometric sensor for baby and child care in a home environment. J. Ambient. Intell. Smart Environ. 2013, 5, 381–402. [Google Scholar] [CrossRef]
- Zhao, W.; Adolph, A.L.; Puyau, M.R.; Vohra, F.A.; Butte, N.F.; Zakeri, I.F. Support vector machines classifiers of physical activities in preschoolers. Physiol. Rep. 2013, 1, e00006. [Google Scholar] [CrossRef] [PubMed]
- Goto, J.; Kidokoro, T.; Ogura, T.; Suzuki, S. Activity Recognition System for Watching over Infant Children. In Proceedings of the 2013 IEEE RO-MAN, Gyeongju, Republic of Korea, 26–29 August 2013; pp. 473–477. [Google Scholar]
- Hagenbuchner, M.; Cliff, D.P.; Trost, S.G.; Van Tuc, N.; Peoples, G.E. Prediction of activity type in preschool children using machine learning techniques. J. Sci. Med. Sport 2015, 18, 426–431. [Google Scholar] [CrossRef] [PubMed]
- Hegde, N.; Zhang, T.; Uswatte, G.; Taub, E.; Barman, J.; McKay, S.; Taylor, A.; Morris, D.M.; Griffin, A.; Sazonov, E.S. The Pediatric SmartShoe: Wearable sensor system for ambulatory monitoring of physical activity and gait. IEEE Trans. Neural Syst. Rehabil. Eng. 2018, 26, 477–486. [Google Scholar] [CrossRef] [PubMed]
- Trost, S.G.; Cliff, D.P.; Ahmadi, M.N.; Tuc, N.V.; Hagenbuchner, M. Sensor-enabled activity class recognition in preschoolers: Hip versus wrist Data. Med. Sci. Sports Exerc. 2018, 50, 634–641. [Google Scholar] [CrossRef] [PubMed]
- Li, K.; Habre, R.; Deng, H.; Urman, R.; Morrison, J.; Gilliland, F.D.; Ambite, J.L.; Stripelis, D.; Chiang, Y.Y.; Lin, Y.; et al. Applying multivariate segmentation methods to human activity recognition from wearable sensors’ data. JMIR mHealth uHealth 2019, 7, e11201. [Google Scholar] [CrossRef] [PubMed]
- Kwon, S.; Zavos, P.; Nickele, K.; Sugianto, A.; Albert, M.V. Hip and wrist-worn accelerometer data analysis for toddler activities. Int. J. Environ. Res. Public Health 2019, 16, 21. [Google Scholar] [CrossRef]
- Ahmadi, M.N.; Brookes, D.; Chowdhury, A.; Pavey, T.; Trost, S.G. Free-living evaluation of laboratory-based sctivity vlassifiers in preschoolers. Med. Sci. Sports Exerc. 2020, 52, 1227–1234. [Google Scholar] [CrossRef]
- Ahmadi, M.N.; Pavey, T.G.; Trost, S.G. Machine learning models for classifying physical activity in free-living preschool children. Sensors 2020, 20, 5. [Google Scholar] [CrossRef]
- Airaksinen, M.; Rasanen, O.; Ilen, E.; Hayrinen, T.; Kivi, A.; Marchi, V.; Gallen, A.; Blom, S.; Varhe, A.; Kaartinen, N.; et al. Automatic posture and movement tracking of infants with wearable movement sensors. Sci. Rep. 2020, 10, 169. [Google Scholar] [CrossRef] [PubMed]
- Jun, K.; Choi, S. Unsupervised end-to-end deep model for newborn and infant activity recognition. Sensors 2020, 20, 12. [Google Scholar] [CrossRef] [PubMed]
- Franchak, J.M.; Scott, V.; Luo, C. A contactless method for measuring full-day, naturalistic motor behavior using wearable inertial sensors. Front. Psychol. 2021, 12, 701343. [Google Scholar] [CrossRef] [PubMed]
- Airaksinen, M.; Gallen, A.; Kivi, A.; Vijayakrishnan, P.; Hayrinen, T.; Ilen, E.; Rasanen, O.; Haataja, L.M.; Vanhatalo, S. Intelligent wearable allows out-of-the-lab tracking of developing motor abilities in infants. Commun. Med. 2022, 2, 69. [Google Scholar] [CrossRef] [PubMed]
- Lim, J.; Kim, J.S.; Park, S.; Lee, O.; So, W.Y. Relationship of physical activity and sedentary time with metabolic health in children and ddolescents measured by accelerometer: A narrative review. Healthcare 2021, 9, 709. [Google Scholar] [CrossRef] [PubMed]
- Ahmadi, M.N.; O’Neil, M.E.; Baque, E.; Boyd, R.N.; Trost, S.G. Machine learning to quantify physical activity in children with cerebral palsy: Comparison of group, group-personalized, and fully-personalized activity classification models. Sensors 2020, 20, 17. [Google Scholar] [CrossRef] [PubMed]
- Hendry, D.; Chai, K.; Campbell, A.; Hopper, L.; O’Sullivan, P.; Straker, L. Development of a human activity recognition system for ballet tasks. Sports Med. Open 2020, 6, 10. [Google Scholar] [CrossRef]

Disclaimer/Publisher’s Note: The statements, opinions and data contained in all publications are solely those of the individual author(s) and contributor(s) and not of MDPI and/or the editor(s). MDPI and/or the editor(s) disclaim responsibility for any injury to people or property resulting from any ideas, methods, instructions or products referred to in the content. |
© 2023 by the authors. Licensee MDPI, Basel, Switzerland. This article is an open access article distributed under the terms and conditions of the Creative Commons Attribution (CC BY) license (https://creativecommons.org/licenses/by/4.0/).
Share and Cite
Hendry, D.; Rohl, A.L.; Rasmussen, C.L.; Zabatiero, J.; Cliff, D.P.; Smith, S.S.; Mackenzie, J.; Pattinson, C.L.; Straker, L.; Campbell, A. Objective Measurement of Posture and Movement in Young Children Using Wearable Sensors and Customised Mathematical Approaches: A Systematic Review. Sensors 2023, 23, 9661. https://doi.org/10.3390/s23249661
Hendry D, Rohl AL, Rasmussen CL, Zabatiero J, Cliff DP, Smith SS, Mackenzie J, Pattinson CL, Straker L, Campbell A. Objective Measurement of Posture and Movement in Young Children Using Wearable Sensors and Customised Mathematical Approaches: A Systematic Review. Sensors. 2023; 23(24):9661. https://doi.org/10.3390/s23249661
Chicago/Turabian StyleHendry, Danica, Andrew L. Rohl, Charlotte Lund Rasmussen, Juliana Zabatiero, Dylan P. Cliff, Simon S. Smith, Janelle Mackenzie, Cassandra L. Pattinson, Leon Straker, and Amity Campbell. 2023. "Objective Measurement of Posture and Movement in Young Children Using Wearable Sensors and Customised Mathematical Approaches: A Systematic Review" Sensors 23, no. 24: 9661. https://doi.org/10.3390/s23249661
APA StyleHendry, D., Rohl, A. L., Rasmussen, C. L., Zabatiero, J., Cliff, D. P., Smith, S. S., Mackenzie, J., Pattinson, C. L., Straker, L., & Campbell, A. (2023). Objective Measurement of Posture and Movement in Young Children Using Wearable Sensors and Customised Mathematical Approaches: A Systematic Review. Sensors, 23(24), 9661. https://doi.org/10.3390/s23249661