
Performance Analysis of the Spanish Men’s Top and Second Professional Football Division Teams during Eight Consecutive Seasons


Abstract
:1. Introduction
2. Materials and Methods
2.1. Sample
2.2. Variables
2.3. Procedures
2.4. Statistical Analysis
3. Results
4. Discussion
5. Limitations
6. Conclusions
Author Contributions
Funding
Institutional Review Board Statement
Informed Consent Statement
Data Availability Statement
Conflicts of Interest
References
- Rein, R.; Memmert, D. Big Data and Tactical Analysis in Elite Soccer: Future Challenges and Opportunities for Sports Science. Springerplus 2016, 5, 1410. [Google Scholar] [CrossRef] [PubMed]
- Low, B.; Coutinho, D.; Gonçalves, B.; Rein, R.; Memmert, D.; Sampaio, J. A Systematic Review of Collective Tactical Behaviours in Football Using Positional Data. Sports Med. 2020, 50, 343–385. [Google Scholar] [CrossRef] [PubMed]
- Rico-González, M.; Los Arcos, A.; Nakamura, F.Y.; Moura, F.A.; Pino-Ortega, J. The Use of Technology and Sampling Frequency to Measure Variables of Tactical Positioning in Team Sports: A Systematic Review. Res. Sports Med. 2020, 28, 279–292. [Google Scholar] [CrossRef] [PubMed]
- Rico-González, M.; Los Arcos, A.; Rojas-Valverde, D.; Clemente, F.M.; Pino-Ortega, J. A Survey to Assess the Quality of the Data Obtained by Radio-Frequency Technologies and Microelectromechanical Systems to Measure External Workload and Collective Behavior Variables in Team Sports. Sensors 2020, 20, 2271. [Google Scholar] [CrossRef]
- Sarmento, H.; Marcelino, R.; Anguera, M.T.; Campaniço, J.; Matos, N.; Leitão, J.C. Match Analysis in Football: A Systematic Review. J. Sports Sci. 2014, 32, 1831–1843. [Google Scholar] [CrossRef]
- Allen, T.; Taberner, M.; Zhilkin, M.; Rhodes, D. Running More than before? The Evolution of Running Load Demands in the English Premier League. Int. J. Sports Sci. Coach. 2023, 1–9. [Google Scholar] [CrossRef]
- Barnes, C.; Archer, D.T.; Hogg, B.; Bush, M.; Bradley, P.S. The Evolution of Physical and Technical Performance Parameters in the English Premier League. Int. J. Sports Med. 2014, 35, 1095–1100. [Google Scholar] [CrossRef]
- Bradley, P.S.; Archer, D.T.; Hogg, B.; Schuth, G.; Bush, M.; Carling, C.; Barnes, C. Tier-Specific Evolution of Match Performance Characteristics in the English Premier League: It’s Getting Tougher at the Top. J. Sports Sci. 2016, 34, 980–987. [Google Scholar] [CrossRef]
- Bush, M.; Barnes, C.; Archer, D.T.; Hogg, B.; Bradley, P.S. Evolution of Match Performance Parameters for Various Playing Positions in the English Premier League. Hum. Mov. Sci. 2015, 39, 1–11. [Google Scholar] [CrossRef]
- Konefał, M.; Chmura, P.; Zając, T.; Chmura, J.; Kowalczuk, E.; Andrzejewski, M. Evolution of Technical Activity in Various Playing Positions, in Relation to Match Outcomes in Professional Soccer. Biol. Sport 2019, 36, 181–189. [Google Scholar] [CrossRef]
- Lago-Peñas, C.; Lorenzo-Martinez, M.; López-Del Campo, R.; Resta, R.; Rey, E. Evolution of Physical and Technical Parameters in the Spanish LaLiga 2012–2019. Sci. Med. Footb. 2022, 7, 41–46. [Google Scholar] [CrossRef] [PubMed]
- Mićović, B.; Leontijević, B.; Dopsaj, M.; Janković, A.; Milanović, Z.; García-Ramos, A. The Qatar 2022 World Cup Warm-up: Football Goal-Scoring Evolution in the Last 14 FIFA World Cups (1966–2018). Front. Psychol. 2023, 13, 954876. [Google Scholar] [CrossRef] [PubMed]
- Pons, E.; Ponce-Bordón, J.C.; Díaz-García, J.; López-Del Campo, R.; Resta, R.; Peirau, X.; García-Calvo, T. A Longitudinal Exploration of Match Running Performance during a Football Match in the Spanish La Liga: A Four-Season Study. Int. J. Environ. Res. Public Health 2021, 18, 1133. [Google Scholar] [CrossRef] [PubMed]
- Wallace, J.L.; Norton, K.I. Evolution of World Cup Soccer Final Games 1966–2010: Game Structure, Speed and Play Patterns. J. Sci. Med. Sport 2014, 17, 223–228. [Google Scholar] [CrossRef]
- Liu, H.; Hopkins, W.; Gómez-Ruano, M.A.; Molinuevo, J.S. Inter-Operator Reliability of Live Football Match Statistics from OPTA Sportsdata. Int. J. Perform. Anal. Sport 2013, 13, 803–821. [Google Scholar] [CrossRef]
- Linke, D.; Link, D.; Lames, M. Football-Specific Validity of TRACAB’s Optical Video Tracking Systems. PLoS ONE 2020, 15, e0230179. [Google Scholar] [CrossRef]
- The Jamovi Project. Jamovi, version 2.4. Computer Software. Jamovi: Sydney, Australia, 2023.
- Akaike, H. A New Look at the Statistical Model Identification. IEEE Trans. Autom. Control 1974, 19, 716–723. [Google Scholar] [CrossRef]
- Field, A. Discovering Statistics Using SPSS, 3rd ed.; SAGE Publications Ltd.: London, UK, 2009. [Google Scholar]
- Nakagawa, S.; Schielzeth, H. A General and Simple Method for Obtaining R2 from Generalized Linear Mixed-Effects Models. Methods Ecol. Evol. 2013, 4, 133–142. [Google Scholar] [CrossRef]
- Castellano, J.; Casamichana, D. What Are the Differences between First and Second Divisions of Spanish Football Teams? Int. J. Perform. Anal. Sport 2015, 15, 135–146. [Google Scholar] [CrossRef]
- Fernández-Navarro, J.; Fradua, L.; Zubillaga, A.; Ford, P.R.; McRobert, A.P. Attacking and Defensive Styles of Play in Soccer: Analysis of Spanish and English Elite Teams. J. Sports Sci. 2016, 34, 2195–2204. [Google Scholar] [CrossRef]
- Bradley, P.S.; Carling, C.; Gómez-Díaz, A.; Hood, P.; Barnes, C.; Ade, J.; Boddy, M.; Krustrup, P.; Mohr, M. Match Performance and Physical Capacity of Players in the Top Three Competitive Standards of English Professional Soccer. Hum. Mov. Sci. 2013, 32, 808–821. [Google Scholar] [CrossRef] [PubMed]
- Lago-Peñas, C.; Lago-Ballesteros, J.; Dellal, A.; Gómez-López, M.T. Game-Related Statistics That Discriminated Winning, Drawing and Losing Teams from the Spanish Soccer League. J. Sports Sci. Med. 2010, 9, 288–293. [Google Scholar] [CrossRef] [PubMed]
- Lago-Peñas, C.; Lago-Ballesteros, J.; Rey, E. Differences in Performance Indicators between Winning and Losing Teams in the UEFA Champions League. J. Hum. Kinet. 2011, 27, 135–146. [Google Scholar] [CrossRef]
- Moura, F.A.; Martins, L.E.B.; Cunha, S.A. Analysis of Football Game-Related Statistics Using Multivariate Techniques. J. Sports Sci. 2014, 32, 1881–1887. [Google Scholar] [CrossRef] [PubMed]
- Castellano, J. Relación Entre Indicadores de Rendimiento y El Éxito En El Fútbol Profesional. Rev. Iberoam. Psicol. Ejerc. Deporte 2018, 13, 41–49. [Google Scholar]
- Li, P.; Zhong, S.; Chmura, P.; Liu, H. Match Performance of Football Teams in Different Competition Phases: Analysis on the Data of Eight Consecutive Seasons in the Chinese Super League. Front. Psychol. 2023, 13, 1069082. [Google Scholar] [CrossRef]
- Castellano, J.; Errekagorri, I.; Los Arcos, A.; Casamichana, D.; Martín-Garcia, A.; Clemente, F.M.; López-Del Campo, R.; Resta, R.; Echeazarra, I. Tell Me How and Where You Play Football and I’ll Tell You How Much You Have to Run. Biol. Sport 2022, 39, 607–614. [Google Scholar] [CrossRef]
- Dellal, A.; Chamari, K.; Wong, D.P.; Ahmaidi, S.; Keller, D.; Barros, R.; Bisciotti, G.N.; Carling, C. Comparison of Physical and Technical Performance in European Soccer Match-Play: FA Premier League and La Liga. Eur. J. Sport Sci. 2011, 11, 51–59. [Google Scholar] [CrossRef]
- Gómez-Ruano, M.A.; Lago-Peñas, C.; Gómez-López, M.T.; Jimenez, S.; Leicht, A.S. Impact of Elite Soccer Coaching Change on Team Performance According to Coach- and Club-Related Variables. Biol. Sport 2021, 38, 603–608. [Google Scholar] [CrossRef]
- O’Donoghue, P. Interacting Performances Theory. Int. J. Perform. Anal. Sport 2009, 9, 26–46. [Google Scholar] [CrossRef]
- Sarmento, H.; Figueiredo, A.J.; Lago-Peñas, C.; Milanovic, Z.; Barbosa, A.; Tadeu, P.; Bradley, P.S. Influence of Tactical and Situational Variables on Offensive Sequences during Elite Football Matches. J. Strength Cond. Res. 2018, 32, 2331–2339. [Google Scholar] [CrossRef] [PubMed]


| Dimensions | Variables | Definitions |
|---|---|---|
| Technical–Tactical | Passes | An intentionally played ball from one player to another with any part of the body that is allowed in the laws of the game. To calculate this variable, the total number of successful and unsuccessful passes made by the team per match is considered. |
| Successful Passes | A successful pass is one that reaches its recipient. To calculate this variable, the total number of successful exchanges of the ball between two players of the same team per match is considered. | |
| Crosses | Any ball sent into the rival team’s penalty box from a wide position. To calculate this variable, the total number of successful and unsuccessful Crosses made by the team per match is considered. | |
| Shots | An attempt to score a goal is made with any part of the body that is allowed in the laws of the game, either on or off the goal. To calculate this variable, the total number of shots made by the team per match is considered. | |
| Set Piece | Goals | Total number of goals scored by the team per match. |
| Corners | A kick that is performed on a set piece from the corner of the field of play nearest to where the ball went out. To calculate this variable, the total number of corners taken by the team per match is considered. | |
| Fouls | Any infringement that is penalised as foul play by the referee. To calculate this variable, the total number of fouls received by the team per match is considered. | |
| Collective Tactical Behaviour | Width | Mean team width per match, considered as the distance (in m) between the two furthest-apart players of the same team across the width of the pitch. To calculate this variable, the time in which the ball is out of play and the goalkeeper’s activity is excluded. |
| Length | Mean team length per match, considered as the distance (in m) between the two furthest-apart players of the same team along the length of the pitch. To calculate this variable, the time in which the ball is out of play and the goalkeeper’s activity is excluded. | |
| Height | Mean team defence depth per match, considered as the distance (in m) between the furthest back player and the goal line he is defending. To calculate this variable, the time in which the ball is out of play and the goalkeeper’s activity is excluded. | |
| GkDef | Mean distance (in m) from the goalkeeper to the nearest defender of the same team per match. To calculate this variable, the time in which the ball is out of play is excluded. | |
| Physical | TD | Total distance covered (in m) by all the team’s players that participated in the match, including the goalkeeper’s activity. |
| Passes | Successful Passes | Crosses | Shots | ||||||||||
|---|---|---|---|---|---|---|---|---|---|---|---|---|---|
| LaLiga1 | Fixed Effects | Estimate | SE | p | Estimate | SE | p | Estimate | SE | p | Estimate | SE | p |
| Intercept | 473.602 | 6.612 | <0.001 | 359.966 | 7.122 | <0.001 | 19.795 | 0.272 | <0.001 | 12.392 | 0.169 | <0.001 | |
| 2012–2013 - 2011–2012 | −8.417 | 26.439 | 0.751 | −4.479 | 28.481 | 0.875 | 0.396 | 1.085 | 0.716 | −0.010 | 0.677 | 0.988 | |
| 2013–2014 - 2011–2012 | −16.667 | 26.480 | 0.530 | −8.931 | 28.519 | 0.755 | 0.649 | 1.093 | 0.553 | −0.686 | 0.680 | 0.315 | |
| 2014–2015 - 2011–2012 | −19.928 | 26.441 | 0.452 | −15.075 | 28.483 | 0.597 | 0.681 | 1.086 | 0.532 | −1.327 | 0.677 | 0.052 | |
| 2015–2016 - 2011–2012 | −4.502 | 26.433 | 0.865 | 0.930 | 28.476 | 0.974 | −1.608 | 1.084 | 0.140 | −1.228 | 0.676 | 0.071 | |
| 2016–2017 - 2011–2012 | 3.168 | 26.435 | 0.905 | 13.961 | 28.477 | 0.625 | −2.720 | 1.085 | 0.013 | −1.092 | 0.676 | 0.108 | |
| 2017–2018 - 2011–2012 | 4.818 | 26.456 | 0.856 | 19.915 | 28.497 | 0.486 | −2.907 | 1.089 | 0.008 | −1.040 | 0.679 | 0.127 | |
| 2018–2019 - 2011–2012 | −8.205 | 26.437 | 0.757 | 6.801 | 28.479 | 0.812 | −2.348 | 1.085 | 0.032 | −1.004 | 0.676 | 0.140 | |
| Random Effects | SD | Variance | ICC | SD | Variance | ICC | SD | Variance | ICC | SD | Variance | ICC | |
| Team | 82.297 | 6772.867 | 0.474 | 88.898 | 7902.914 | 0.522 | 3.130 | 9.800 | 0.125 | 1.994 | 3.977 | 0.160 | |
| Residual | 86.745 | 7524.762 | 85.054 | 7234.107 | 8.289 | 68.712 | 4.569 | 20.880 | |||||
| Marginal R2/Conditional R2 | 0.005/0.467 | 0.008/0.526 | 0.027/0.148 | 0.010/0.168 | |||||||||
| LaLiga2 | Fixed Effects | Estimate | SE | p | Estimate | SE | p | Estimate | SE | p | Estimate | SE | p |
| Intercept | 445.255 | 3.805 | <0.001 | 323.227 | 4.197 | <0.001 | 19.631 | 0.215 | <0.001 | 11.605 | 0.113 | <0.001 | |
| 2012–2013 - 2011–2012 | −21.909 | 15.344 | 0.155 | −13.436 | 16.907 | 0.428 | −0.173 | 0.876 | 0.843 | 0.161 | 0.459 | 0.726 | |
| 2013–2014 - 2011–2012 | −16.308 | 15.256 | 0.287 | −12.058 | 16.819 | 0.474 | 0.925 | 0.869 | 0.289 | −0.312 | 0.455 | 0.494 | |
| 2014–2015 - 2011–2012 | −33.205 | 15.253 | 0.031 | −35.293 | 16.816 | 0.037 | 0.373 | 0.868 | 0.668 | −0.619 | 0.455 | 0.176 | |
| 2015–2016 - 2011–2012 | −37.535 | 15.225 | 0.015 | −41.131 | 16.791 | 0.015 | 1.095 | 0.864 | 0.207 | −0.658 | 0.452 | 0.148 | |
| 2016–2017 - 2011–2012 | −32.181 | 15.185 | 0.036 | −30.524 | 16.754 | 0.070 | −0.456 | 0.857 | 0.596 | −0.728 | 0.448 | 0.107 | |
| 2017–2018 - 2011–2012 | −31.649 | 15.142 | 0.038 | −22.756 | 16.716 | 0.175 | −0.569 | 0.850 | 0.504 | −0.268 | 0.445 | 0.547 | |
| 2018–2019 - 2011–2012 | −30.408 | 15.152 | 0.046 | −19.636 | 16.725 | 0.242 | −1.213 | 0.852 | 0.156 | −0.326 | 0.446 | 0.465 | |
| Random Effects | SD | Variance | ICC | SD | Variance | ICC | SD | Variance | ICC | SD | Variance | ICC | |
| Team | 48.274 | 2330.387 | 0.279 | 53.688 | 2882.391 | 0.325 | 2.457 | 6.036 | 0.090 | 1.267 | 1.605 | 0.081 | |
| Residual | 77.583 | 6019.187 | 77.372 | 5986.445 | 7.817 | 61.098 | 4.273 | 18.256 | |||||
| Marginal R2/Conditional R2 | 0.015/0.290 | 0.017/0.336 | 0.008/0.097 | 0.004/0.085 | |||||||||
| All seasons | Fixed Effects | Estimate | SE | p | Estimate | SE | p | Estimate | SE | p | Estimate | SE | p |
| Intercept | 459.380 | 3.705 | <0.001 | 341.562 | 4.024 | <0.001 | 19.696 | 0.180 | <0.001 | 11.988 | 0.101 | <0.001 | |
| LaLiga2 - LaLiga1 | −28.445 | 7.411 | <0.001 | −36.810 | 8.048 | <0.001 | −0.189 | 0.361 | 0.600 | −0.808 | 0.202 | <0.001 | |
| Random Effects | SD | Variance | ICC | SD | Variance | ICC | SD | Variance | ICC | SD | Variance | ICC | |
| Team | 66.182 | 4380.008 | 0.393 | 72.182 | 5210.253 | 0.441 | 2.972 | 8.833 | 0.120 | 1.676 | 2.808 | 0.126 | |
| Residual | 82.298 | 6772.938 | 81.308 | 6611.072 | 8.056 | 64.900 | 4.423 | 19.564 | |||||
| Marginal R2/Conditional R2 | 0.018/0.404 | 0.028/0.456 | 0.000/0.120 | 0.007/0.132 | |||||||||
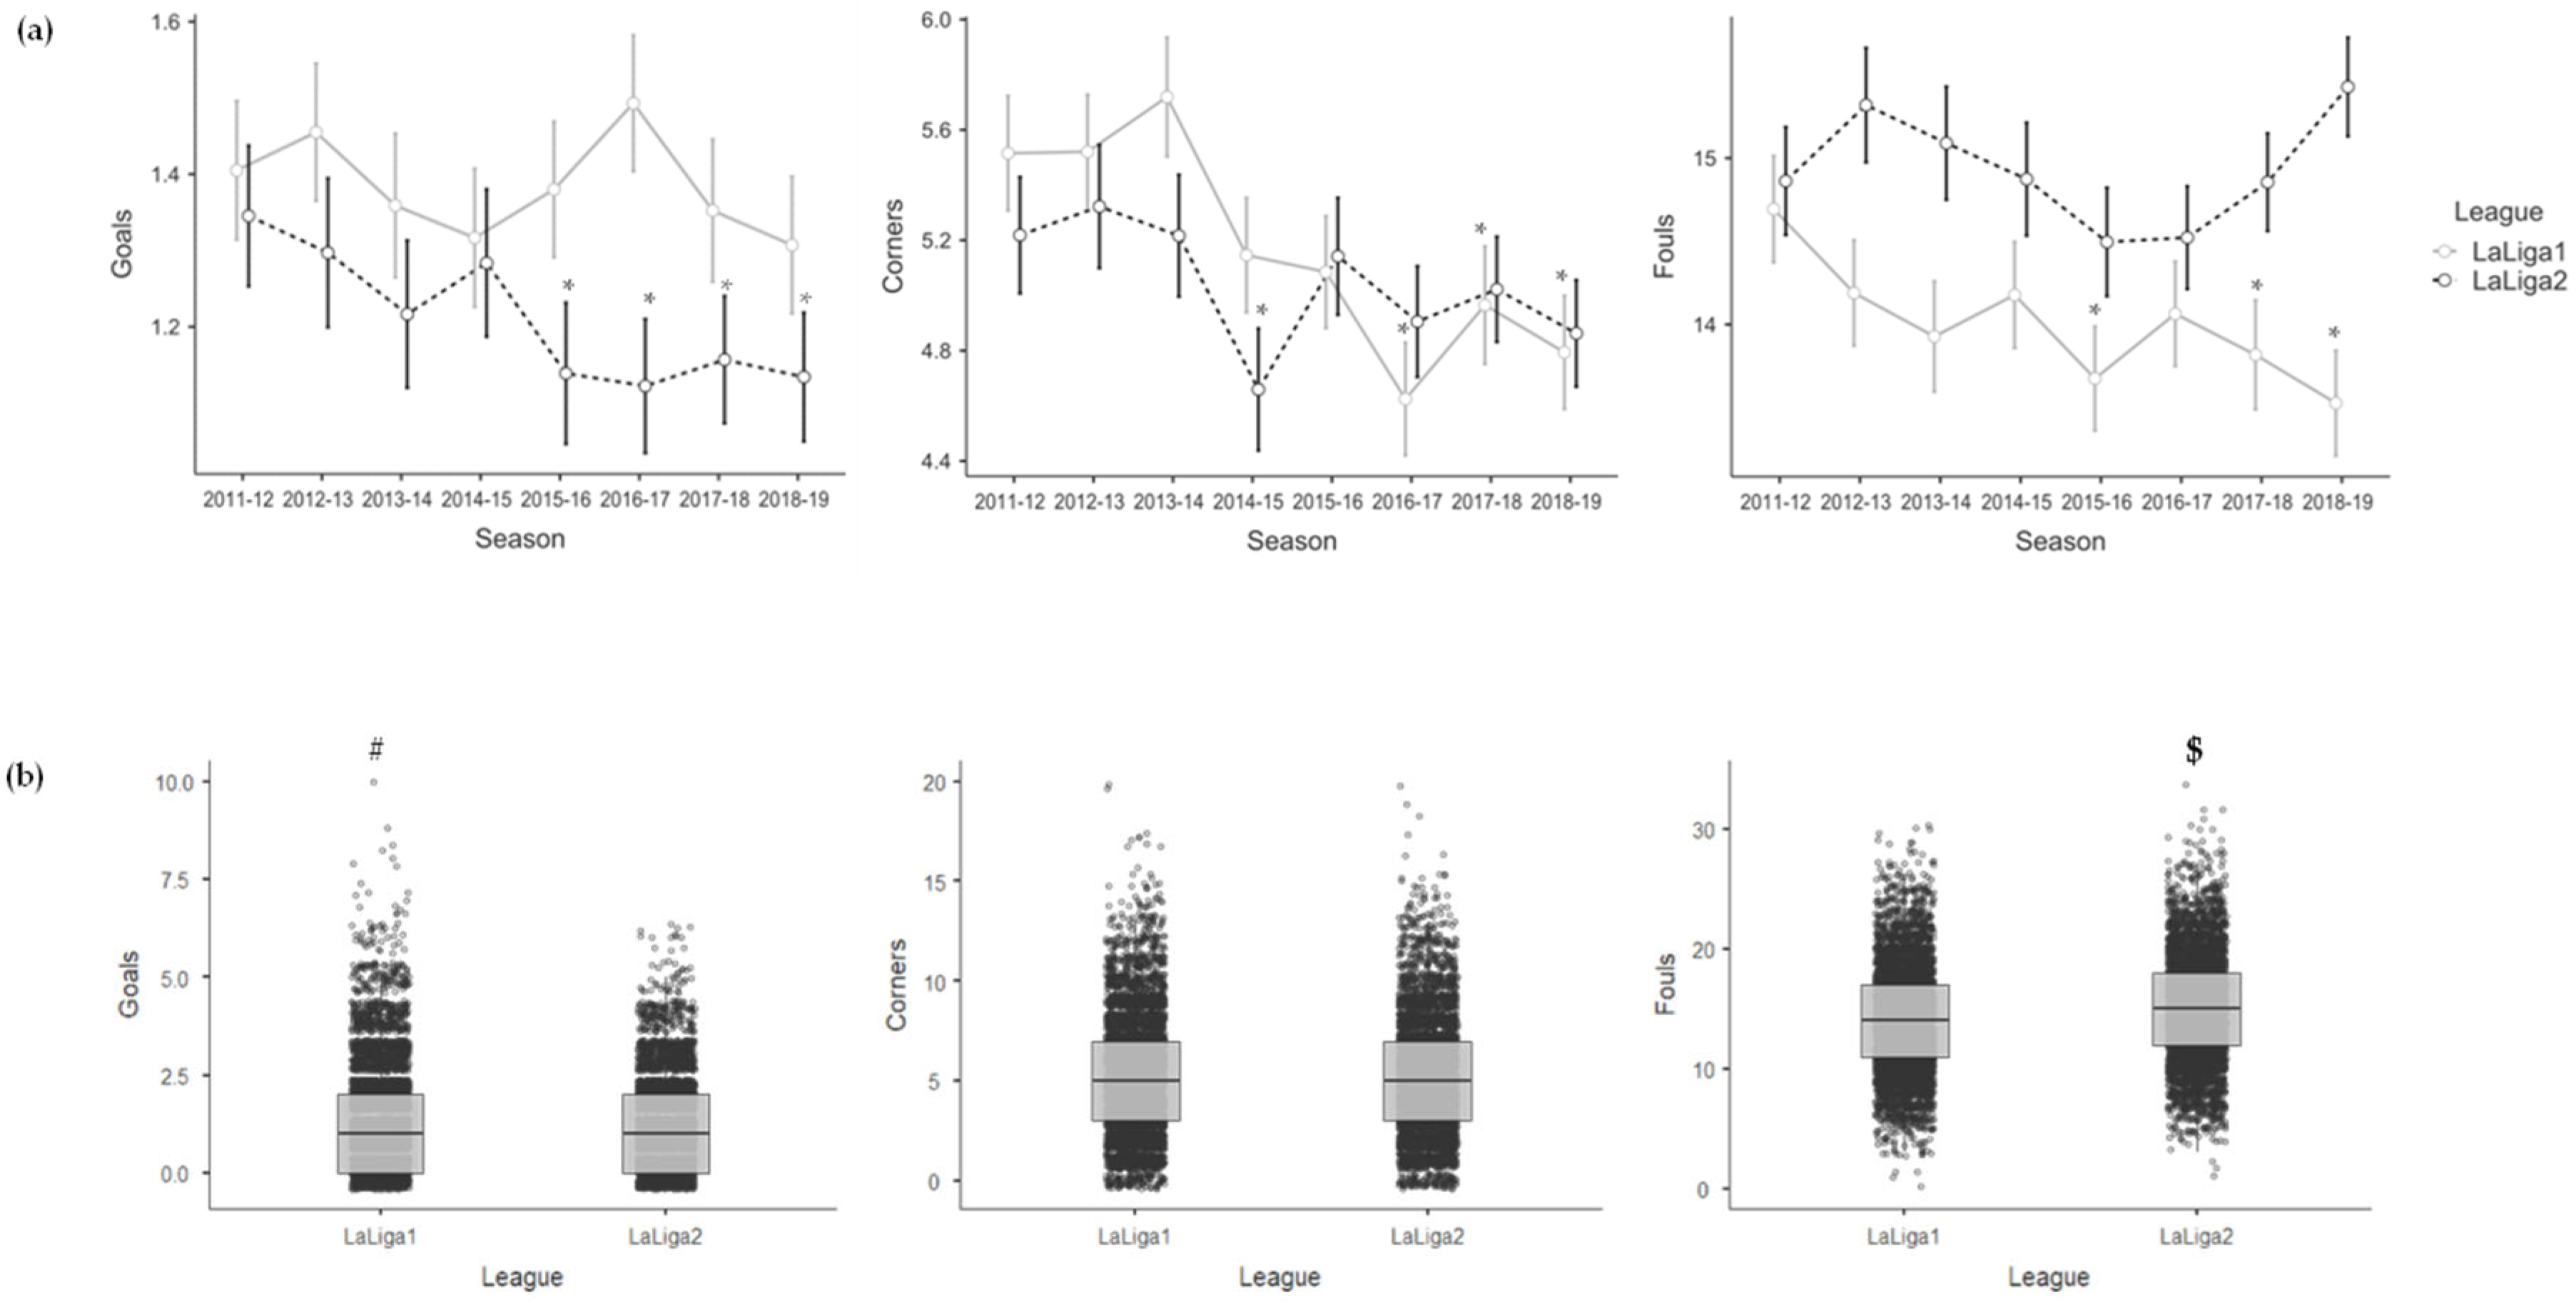
| Goals | Corners | Fouls | ||||||||
|---|---|---|---|---|---|---|---|---|---|---|
| LaLiga1 | Fixed Effects | Estimate | SE | p | Estimate | SE | p | Estimate | SE | p |
| Intercept | 1.383 | 0.046 | <0.001 | 5.168 | 0.068 | <0.001 | 14.016 | 0.106 | <0.001 | |
| 2012–2013 - 2011–2012 | 0.043 | 0.182 | 0.812 | 0.017 | 0.271 | 0.950 | −0.495 | 0.422 | 0.242 | |
| 2013–2014 - 2011–2012 | −0.046 | 0.183 | 0.801 | 0.177 | 0.274 | 0.519 | −0.736 | 0.426 | 0.086 | |
| 2014–2015 - 2011–2012 | −0.086 | 0.182 | 0.638 | −0.368 | 0.271 | 0.177 | −0.514 | 0.422 | 0.225 | |
| 2015–2016 - 2011–2012 | −0.020 | 0.182 | 0.914 | −0.424 | 0.270 | 0.119 | −1.019 | 0.421 | 0.017 | |
| 2016–2017 - 2011–2012 | 0.085 | 0.182 | 0.640 | −0.886 | 0.270 | 0.001 | −0.632 | 0.421 | 0.135 | |
| 2017–2018 - 2011–2012 | −0.034 | 0.183 | 0.852 | −0.560 | 0.272 | 0.042 | −0.859 | 0.424 | 0.044 | |
| 2018–2019 - 2011–2012 | −0.095 | 0.182 | 0.602 | −0.721 | 0.271 | 0.009 | −1.160 | 0.421 | 0.007 | |
| Random Effects | SD | Variance | ICC | SD | Variance | ICC | SD | Variance | ICC | |
| Team | 0.538 | 0.290 | 0.166 | 0.718 | 0.516 | 0.064 | 1.135 | 1.287 | 0.070 | |
| Residual | 1.209 | 1.461 | 2.745 | 7.534 | 4.128 | 17.037 | ||||
| Marginal R2/Conditional R2 | 0.002/0.167 | 0.015/0.078 | 0.006/0.076 | |||||||
| LaLiga2 | Fixed Effects | Estimate | SE | p | Estimate | SE | p | Estimate | SE | p |
| Intercept | 1.203 | 0.020 | <0.001 | 5.021 | 0.049 | <0.001 | 14.900 | 0.095 | <0.001 | |
| 2012–2013 - 2011–2012 | −0.060 | 0.081 | 0.459 | 0.090 | 0.200 | 0.654 | 0.516 | 0.386 | 0.183 | |
| 2013–2014 - 2011–2012 | −0.135 | 0.080 | 0.095 | −0.015 | 0.198 | 0.941 | 0.227 | 0.383 | 0.553 | |
| 2014–2015 - 2011–2012 | −0.061 | 0.080 | 0.444 | −0.562 | 0.198 | 0.005 | 0.080 | 0.383 | 0.836 | |
| 2015–2016 - 2011–2012 | −0.210 | 0.079 | 0.009 | −0.070 | 0.196 | 0.723 | −0.343 | 0.380 | 0.367 | |
| 2016–2017 - 2011–2012 | −0.225 | 0.078 | 0.004 | −0.306 | 0.193 | 0.114 | −0.338 | 0.375 | 0.370 | |
| 2017–2018 - 2011–2012 | −0.181 | 0.077 | 0.019 | −0.166 | 0.189 | 0.383 | 0.051 | 0.371 | 0.890 | |
| 2018–2019 - 2011–2012 | −0.207 | 0.077 | 0.008 | −0.338 | 0.190 | 0.078 | 0.637 | 0.372 | 0.089 | |
| Random Effects | SD | Variance | ICC | SD | Variance | ICC | SD | Variance | ICC | |
| Team | 0.167 | 0.028 | 0.023 | 0.413 | 0.171 | 0.023 | 0.986 | 0.972 | 0.052 | |
| Residual | 1.097 | 1.203 | 2.711 | 7.347 | 4.191 | 17.565 | ||||
| Marginal R2/Conditional R2 | 0.005/0.028 | 0.005/0.028 | 0.006/0.058 | |||||||
| All seasons | Fixed Effects | Estimate | SE | p | Estimate | SE | p | Estimate | SE | p |
| Intercept | 1.286 | 0.024 | <0.001 | 5.084 | 0.044 | <0.001 | 14.455 | 0.072 | <0.001 | |
| LaLiga2 - LaLiga1 | −0.195 | 0.048 | <0.001 | −0.164 | 0.088 | 0.063 | 0.880 | 0.143 | <0.001 | |
| Random Effects | SD | Variance | ICC | SD | Variance | ICC | SD | Variance | ICC | |
| Team | 0.393 | 0.155 | 0.104 | 0.641 | 0.411 | 0.052 | 1.082 | 1.171 | 0.063 | |
| Residual | 1.154 | 1.332 | 2.727 | 7.435 | 4.159 | 17.300 | ||||
| Marginal R2/Conditional R2 | 0.006/0.110 | 0.001/0.053 | 0.010/0.073 | |||||||
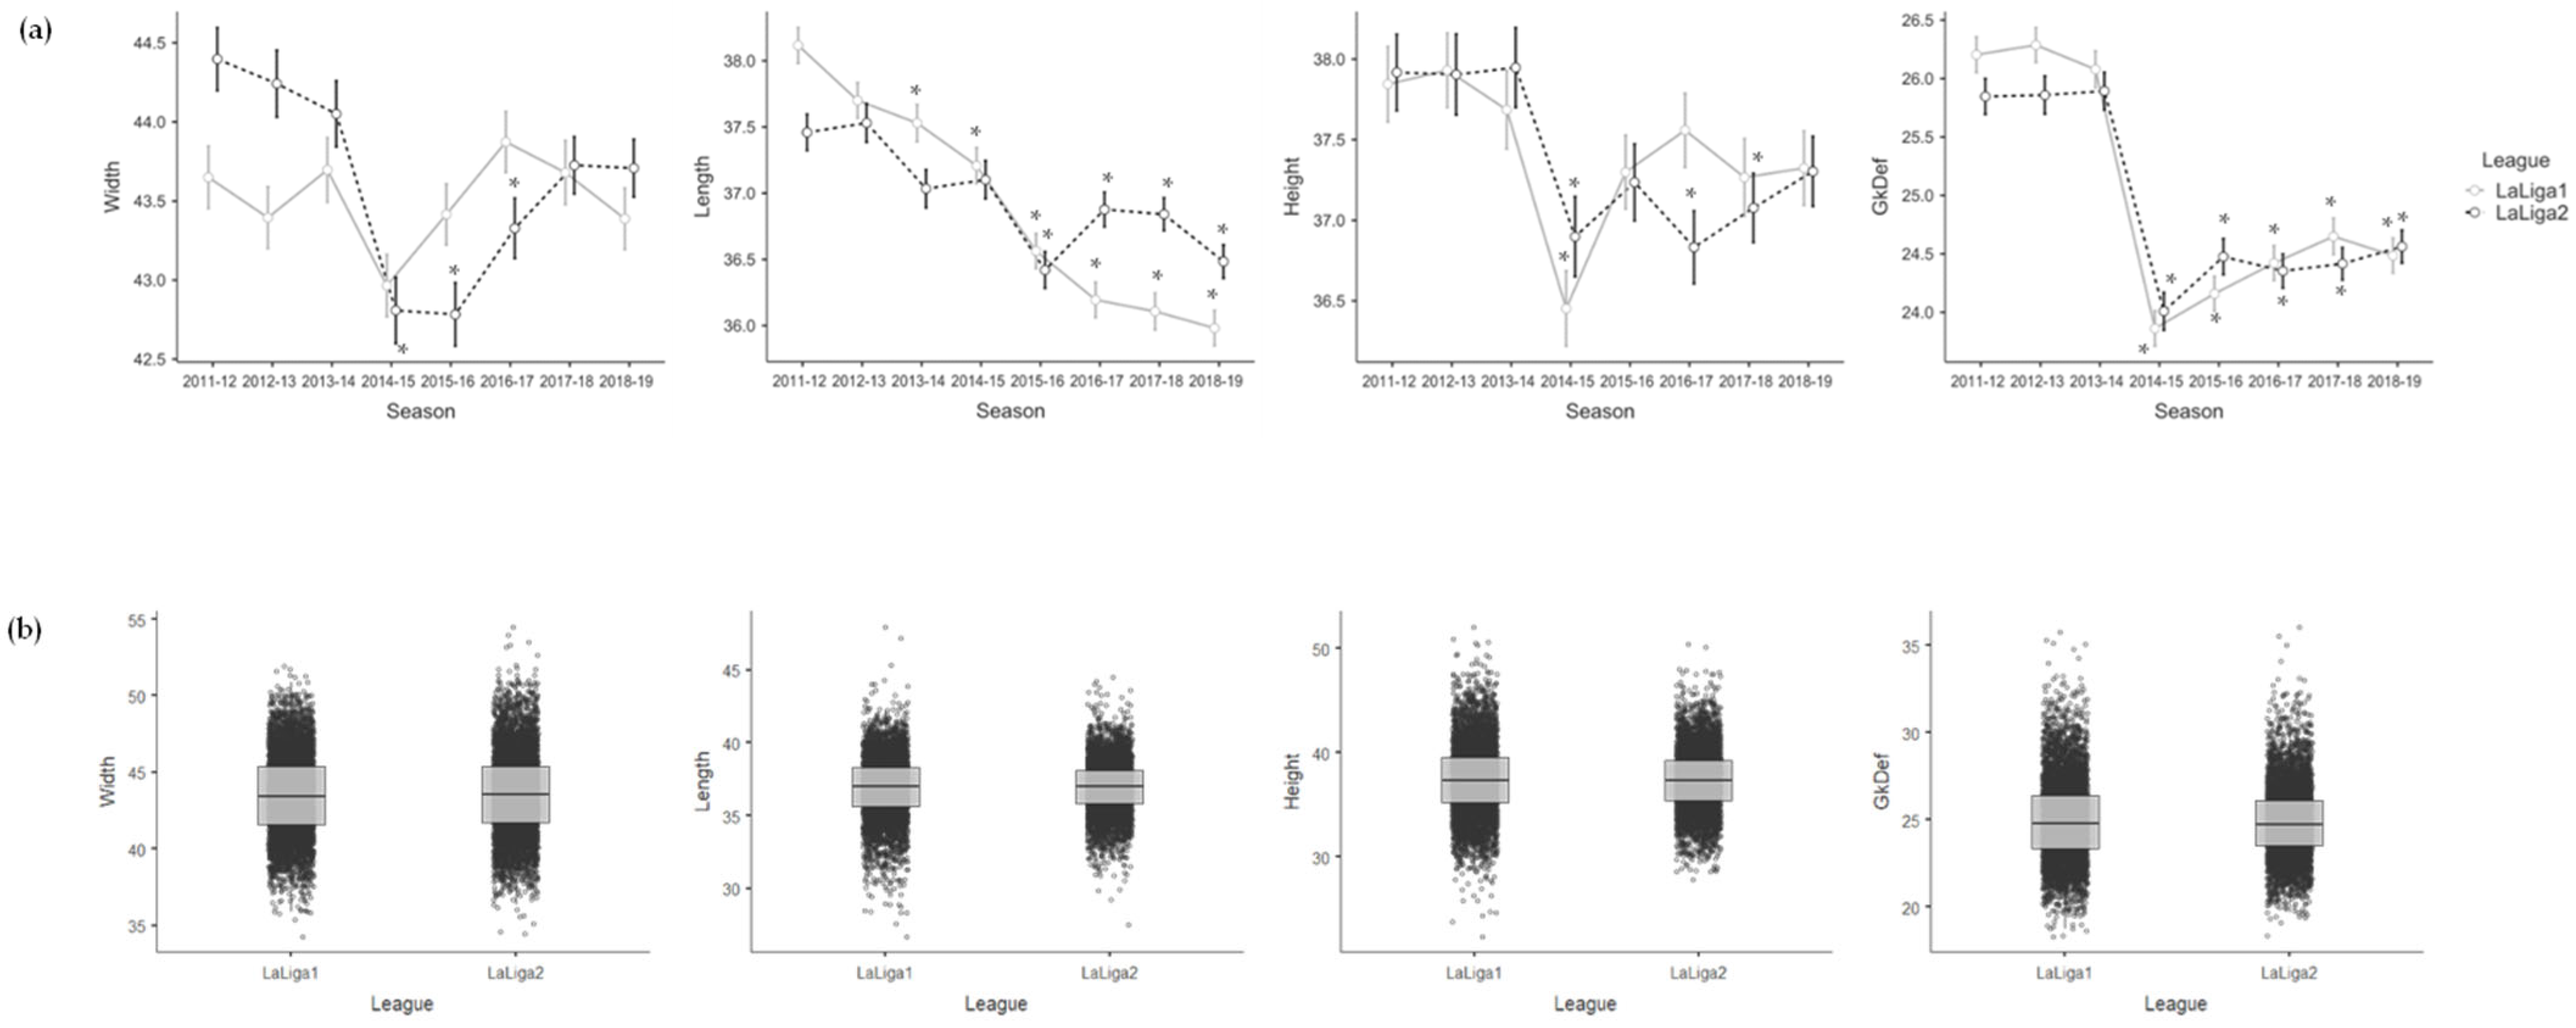
| Width | Length | Height | GkDef | ||||||||||
|---|---|---|---|---|---|---|---|---|---|---|---|---|---|
| LaLiga1 | Fixed Effects | Estimate | SE | p | Estimate | SE | p | Estimate | SE | p | Estimate | SE | p |
| Intercept | 43.510 | 0.136 | <0.001 | 36.923 | 0.079 | <0.001 | 37.424 | 0.135 | <0.001 | 25.008 | 0.106 | <0.001 | |
| 2012–2013 - 2011–2012 | −0.269 | 0.545 | 0.622 | −0.413 | 0.316 | 0.194 | 0.104 | 0.541 | 0.848 | 0.070 | 0.423 | 0.868 | |
| 2013–2014 - 2011–2012 | 0.028 | 0.546 | 0.959 | −0.629 | 0.317 | 0.049 | −0.114 | 0.543 | 0.833 | −0.144 | 0.424 | 0.735 | |
| 2014–2015 - 2011–2012 | −0.662 | 0.545 | 0.226 | −0.895 | 0.316 | 0.005 | −1.390 | 0.541 | 0.011 | −2.339 | 0.423 | <0.001 | |
| 2015–2016 - 2011–2012 | −0.220 | 0.545 | 0.688 | −1.544 | 0.316 | <0.001 | −0.526 | 0.540 | 0.332 | −2.047 | 0.423 | <0.001 | |
| 2016–2017 - 2011–2012 | 0.221 | 0.545 | 0.686 | −1.919 | 0.316 | <0.001 | −0.285 | 0.540 | 0.598 | −1.790 | 0.423 | <0.001 | |
| 2017–2018 - 2011–2012 | 0.092 | 0.546 | 0.867 | −1.954 | 0.317 | <0.001 | −0.569 | 0.542 | 0.295 | −1.565 | 0.423 | <0.001 | |
| 2018–2019 - 2011–2012 | −0.238 | 0.545 | 0.663 | −2.122 | 0.316 | <0.001 | −0.521 | 0.540 | 0.337 | −1.728 | 0.423 | <0.001 | |
| Random Effects | SD | Variance | ICC | SD | Variance | ICC | SD | Variance | ICC | SD | Variance | ICC | |
| Team | 1.689 | 2.852 | 0.404 | 0.960 | 0.921 | 0.251 | 1.633 | 2.666 | 0.231 | 1.305 | 1.702 | 0.366 | |
| Residual | 2.053 | 4.214 | 1.659 | 2.753 | 2.977 | 8.864 | 1.716 | 2.946 | |||||
| Marginal R2/Conditional R2 | 0.009/0.409 | 0.134/0.351 | 0.017/0.244 | 0.157/0.466 | |||||||||
| LaLiga2 | Fixed Effects | Estimate | SE | p | Estimate | SE | p | Estimate | SE | p | Estimate | SE | p |
| Intercept | 43.534 | 0.123 | <0.001 | 36.922 | 0.067 | <0.001 | 37.326 | 0.096 | <0.001 | 24.885 | 0.087 | <0.001 | |
| 2012–2013 - 2011–2012 | −0.114 | 0.495 | 0.817 | 0.016 | 0.270 | 0.952 | −0.037 | 0.387 | 0.923 | −0.014 | 0.350 | 0.968 | |
| 2013–2014 - 2011–2012 | −0.240 | 0.492 | 0.627 | −0.401 | 0.268 | 0.136 | −0.016 | 0.384 | 0.967 | 0.121 | 0.348 | 0.729 | |
| 2014–2015 - 2011–2012 | −1.557 | 0.492 | 0.002 | −0.391 | 0.268 | 0.146 | −1.017 | 0.384 | 0.009 | −1.655 | 0.348 | <0.001 | |
| 2015–2016 - 2011–2012 | −1.557 | 0.492 | 0.002 | −0.977 | 0.267 | <0.001 | −0.664 | 0.383 | 0.085 | −1.229 | 0.348 | <0.001 | |
| 2016–2017 - 2011–2012 | −0.951 | 0.491 | 0.054 | −0.523 | 0.267 | 0.051 | −1.070 | 0.381 | 0.006 | −1.392 | 0.347 | <0.001 | |
| 2017–2018 - 2011–2012 | −0.459 | 0.489 | 0.349 | −0.555 | 0.266 | 0.038 | −0.761 | 0.379 | 0.047 | −1.298 | 0.346 | <0.001 | |
| 2018–2019 - 2011–2012 | −0.484 | 0.490 | 0.324 | −0.915 | 0.266 | <0.001 | −0.599 | 0.380 | 0.117 | −1.162 | 0.347 | <0.001 | |
| Random Effects | SD | Variance | ICC | SD | Variance | ICC | SD | Variance | ICC | SD | Variance | ICC | |
| Team | 1.576 | 2.484 | 0.344 | 0.839 | 0.705 | 0.237 | 1.167 | 1.363 | 0.165 | 1.114 | 1.240 | 0.333 | |
| Residual | 2.178 | 4.744 | 1.506 | 2.268 | 2.629 | 6.910 | 1.576 | 2.484 | |||||
| Marginal R2/Conditional R2 | 0.041/0.371 | 0.037/0.265 | 0.020/0.181 | 0.106/0.403 | |||||||||
| All seasons | Fixed Effects | Estimate | SE | p | Estimate | SE | p | Estimate | SE | p | Estimate | SE | p |
| Intercept | 43.521 | 0.093 | <0.001 | 36.919 | 0.060 | <0.001 | 37.371 | 0.084 | <0.001 | 24.944 | 0.080 | <0.001 | |
| LaLiga2 - LaLiga1 | 0.023 | 0.186 | 0.902 | −0.005 | 0.119 | 0.967 | −0.105 | 0.167 | 0.530 | −0.126 | 0.160 | 0.430 | |
| Random Effects | SD | Variance | ICC | SD | Variance | ICC | SD | Variance | ICC | SD | Variance | ICC | |
| Team | 1.659 | 2.753 | 0.381 | 1.053 | 1.109 | 0.306 | 1.444 | 2.085 | 0.209 | 1.435 | 2.060 | 0.431 | |
| Residual | 2.116 | 4.478 | 1.585 | 2.511 | 2.809 | 7.889 | 1.648 | 2.716 | |||||
| Marginal R2/Conditional R2 | 0.000/0.381 | 0.000/0.306 | 0.000/0.209 | 0.001/0.432 | |||||||||
| TD | ||||
|---|---|---|---|---|
| LaLiga1 | Fixed Effects | Estimate | SE | p |
| Intercept | 109,899.711 | 198.923 | <0.001 | |
| 2012–2013 - 2011–2012 | −595.480 | 795.136 | 0.455 | |
| 2013–2014 - 2011–2012 | −1040.822 | 797.418 | 0.194 | |
| 2014–2015 - 2011–2012 | −3160.020 | 795.275 | <0.001 | |
| 2015–2016 - 2011–2012 | −2057.377 | 794.793 | 0.011 | |
| 2016–2017 - 2011–2012 | −2273.371 | 794.905 | 0.005 | |
| 2017–2018 - 2011–2012 | −2227.386 | 796.154 | 0.006 | |
| 2018–2019 - 2011–2012 | −2882.185 | 795.086 | <0.001 | |
| Random Effects | SD | Variance | ICC | |
| Team | 2437.959 | 5,943,646.440 | 0.312 | |
| Residual | 3623.584 | 13,130,363.010 | ||
| Marginal R2/Conditional R2 | 0.054/0.349 | |||
| LaLiga2 | Fixed Effects | Estimate | SE | p |
| Intercept | 109,215.122 | 162.056 | <0.001 | |
| 2012–2013 - 2011–2012 | −873.847 | 654.515 | 0.184 | |
| 2013–2014 - 2011–2012 | −1206.071 | 650.338 | 0.065 | |
| 2014–2015 - 2011–2012 | −3214.570 | 650.183 | <0.001 | |
| 2015–2016 - 2011–2012 | −3387.602 | 648.641 | <0.001 | |
| 2016–2017 - 2011–2012 | −4099.113 | 646.466 | <0.001 | |
| 2017–2018 - 2011–2012 | −3278.626 | 644.275 | <0.001 | |
| 2018–2019 - 2011–2012 | −4262.594 | 644.702 | <0.001 | |
| Random Effects | SD | Variance | ICC | |
| Team | 2028.913 | 4,116,489.842 | 0.226 | |
| Residual | 3750.620 | 14,067,152.080 | ||
| Marginal R2/Conditional R2 | 0.110/0.311 | |||
| All seasons | Fixed Effects | Estimate | SE | p |
| Intercept | 109,549.497 | 143.778 | <0.001 | |
| LaLiga2 - LaLiga1 | −698.705 | 287.555 | 0.016 | |
| Random Effects | SD | Variance | ICC | |
| Team | 2546.513 | 6,484,726.698 | 0.323 | |
| Residual | 3687.301 | 13,596,189.014 | ||
| Marginal R2/Conditional R2 | 0.006/0.327 | |||
Disclaimer/Publisher’s Note: The statements, opinions and data contained in all publications are solely those of the individual author(s) and contributor(s) and not of MDPI and/or the editor(s). MDPI and/or the editor(s) disclaim responsibility for any injury to people or property resulting from any ideas, methods, instructions or products referred to in the content. |
© 2023 by the authors. Licensee MDPI, Basel, Switzerland. This article is an open access article distributed under the terms and conditions of the Creative Commons Attribution (CC BY) license (https://creativecommons.org/licenses/by/4.0/).
Share and Cite
Errekagorri, I.; López del Campo, R.; Resta, R.; Castellano, J. Performance Analysis of the Spanish Men’s Top and Second Professional Football Division Teams during Eight Consecutive Seasons. Sensors 2023, 23, 9115. https://doi.org/10.3390/s23229115
Errekagorri I, López del Campo R, Resta R, Castellano J. Performance Analysis of the Spanish Men’s Top and Second Professional Football Division Teams during Eight Consecutive Seasons. Sensors. 2023; 23(22):9115. https://doi.org/10.3390/s23229115
Chicago/Turabian StyleErrekagorri, Ibai, Roberto López del Campo, Ricardo Resta, and Julen Castellano. 2023. "Performance Analysis of the Spanish Men’s Top and Second Professional Football Division Teams during Eight Consecutive Seasons" Sensors 23, no. 22: 9115. https://doi.org/10.3390/s23229115
APA StyleErrekagorri, I., López del Campo, R., Resta, R., & Castellano, J. (2023). Performance Analysis of the Spanish Men’s Top and Second Professional Football Division Teams during Eight Consecutive Seasons. Sensors, 23(22), 9115. https://doi.org/10.3390/s23229115