
Laboratory Assessment of an In-Place Inclinometer Chain for Structural and Geotechnical Monitoring

Abstract
:1. Introduction
2. Material
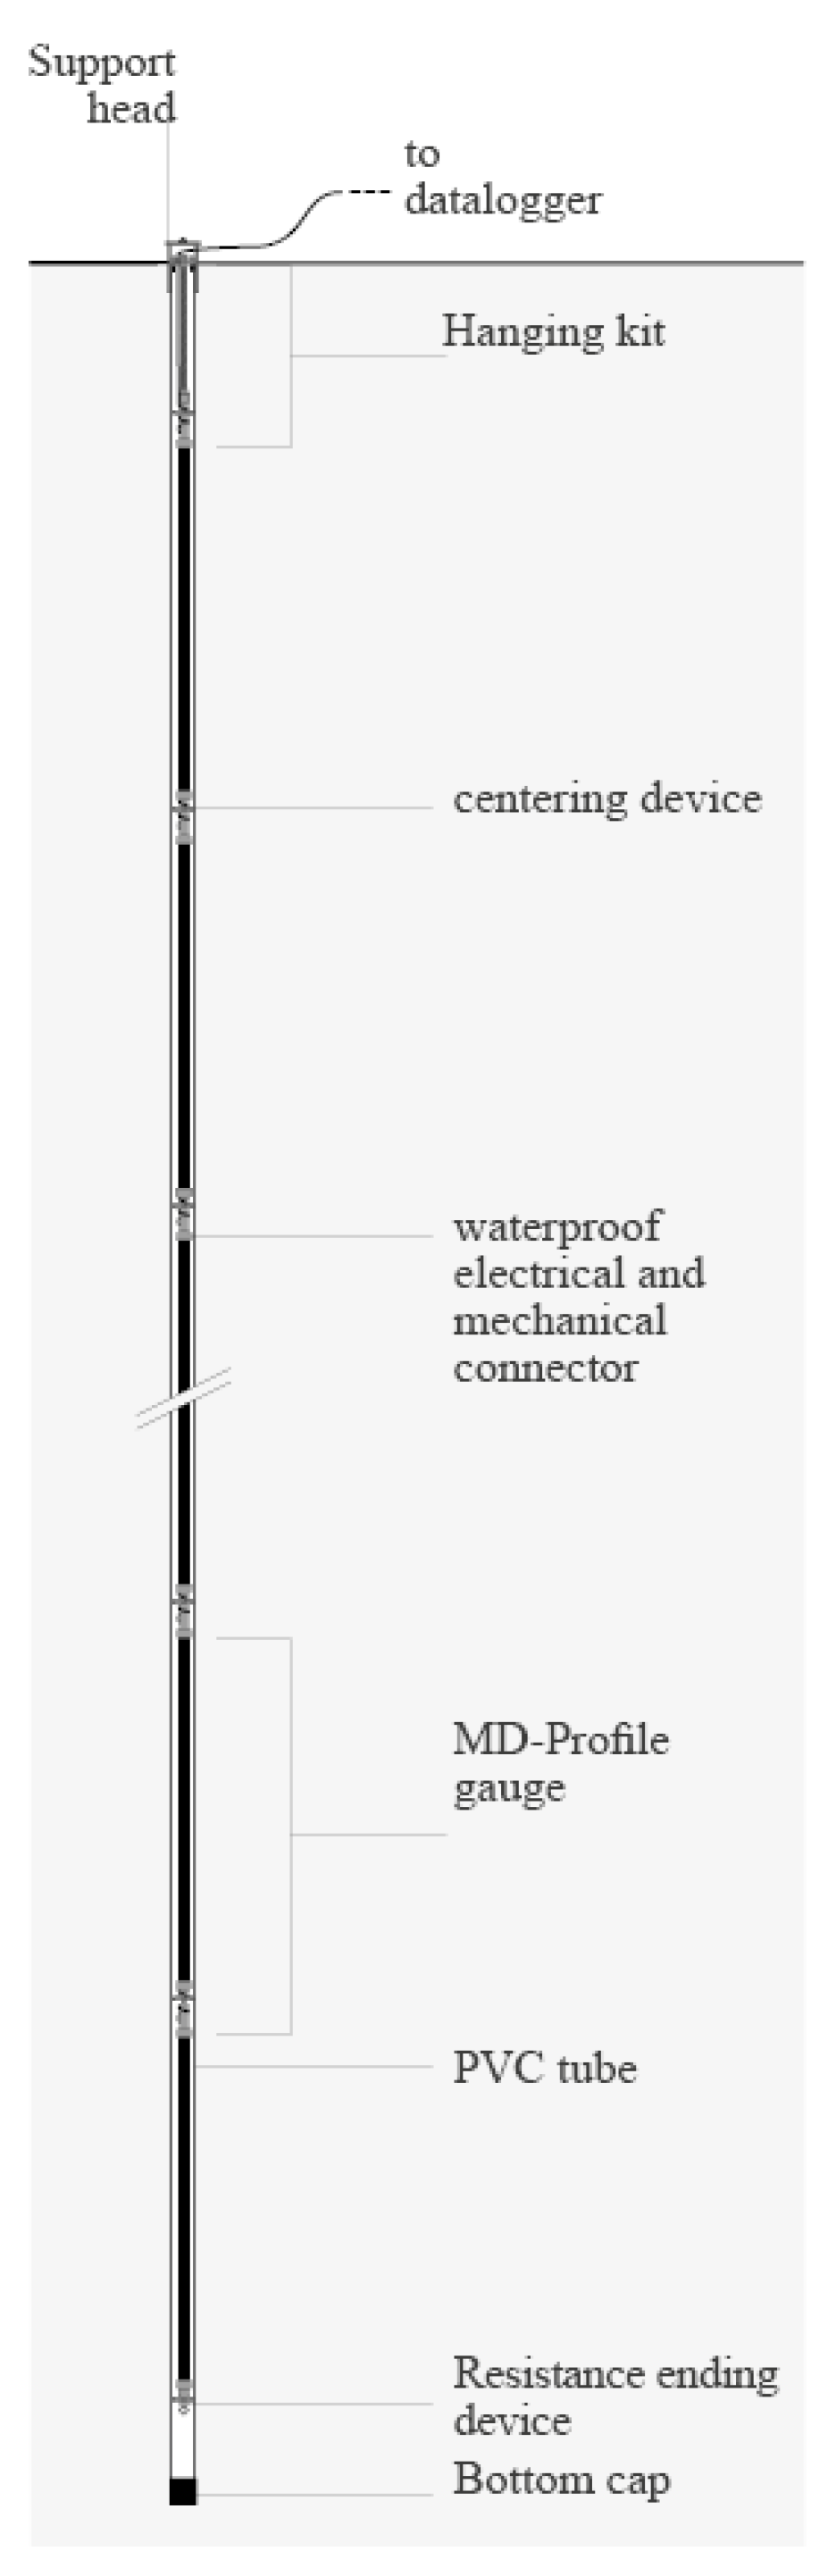
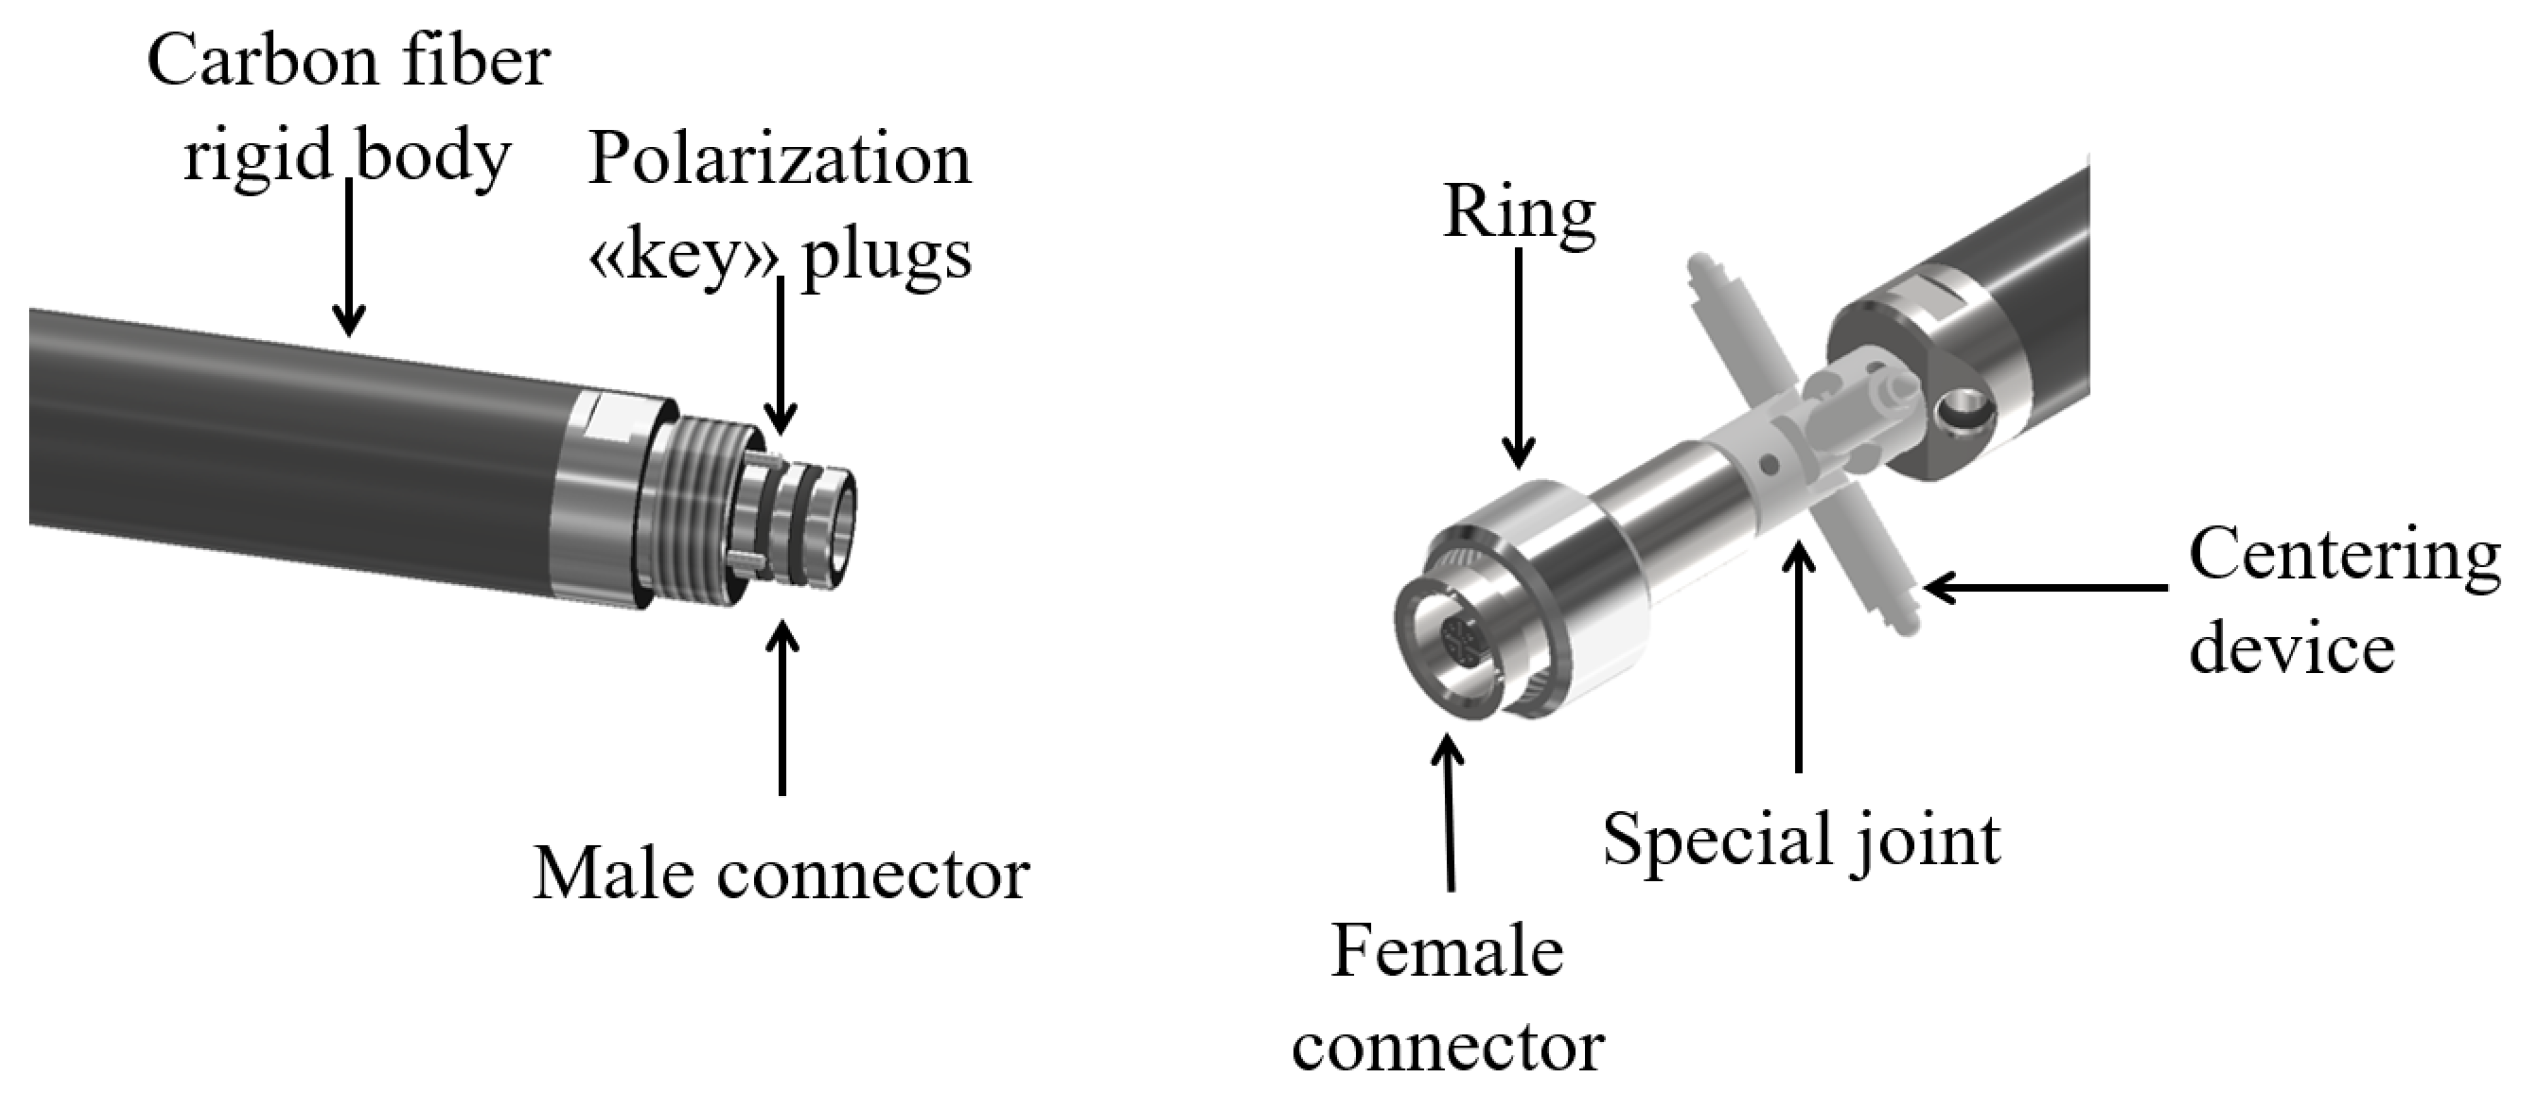
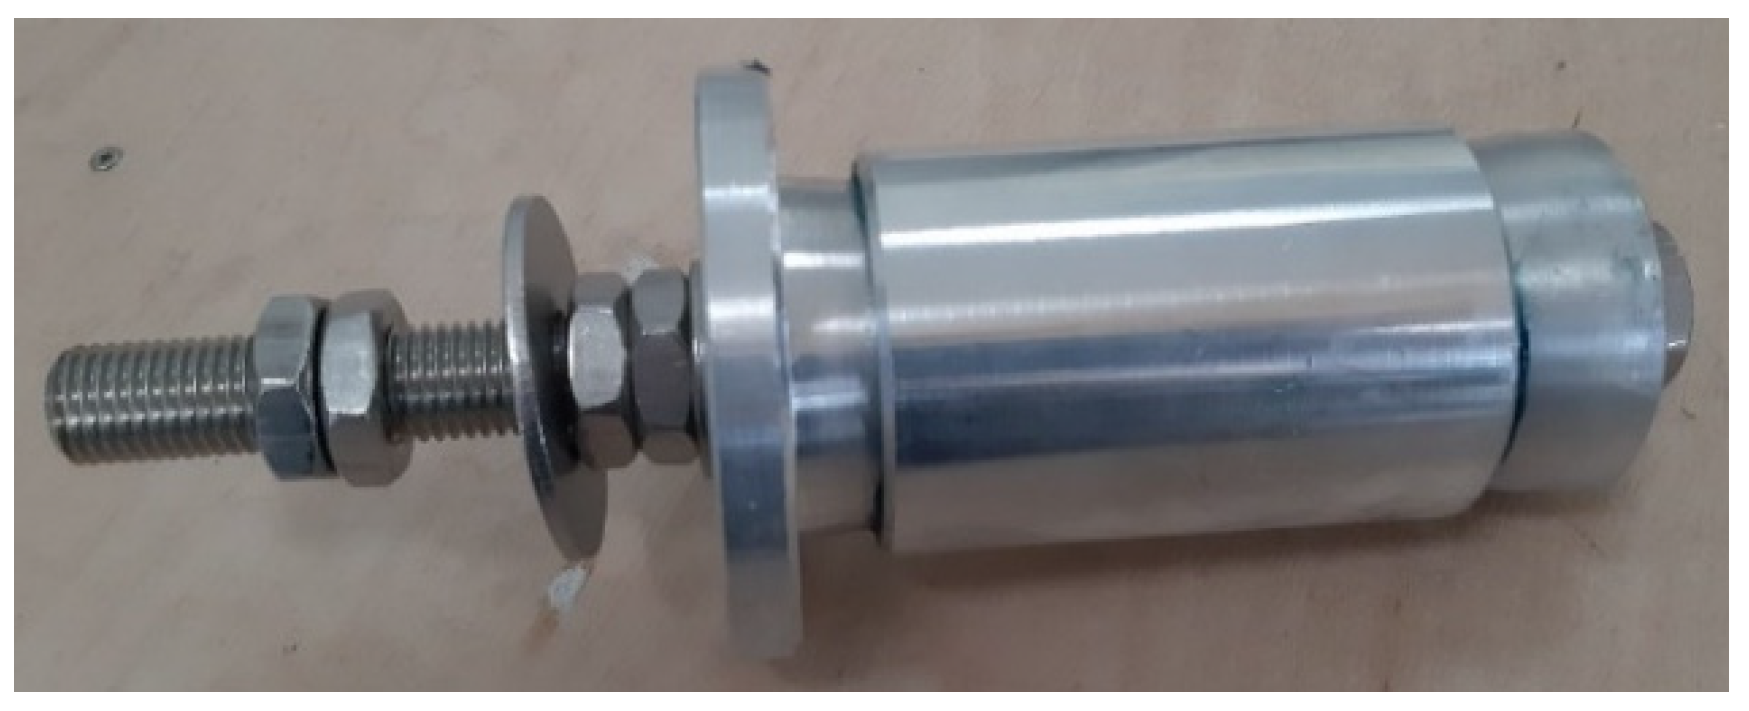
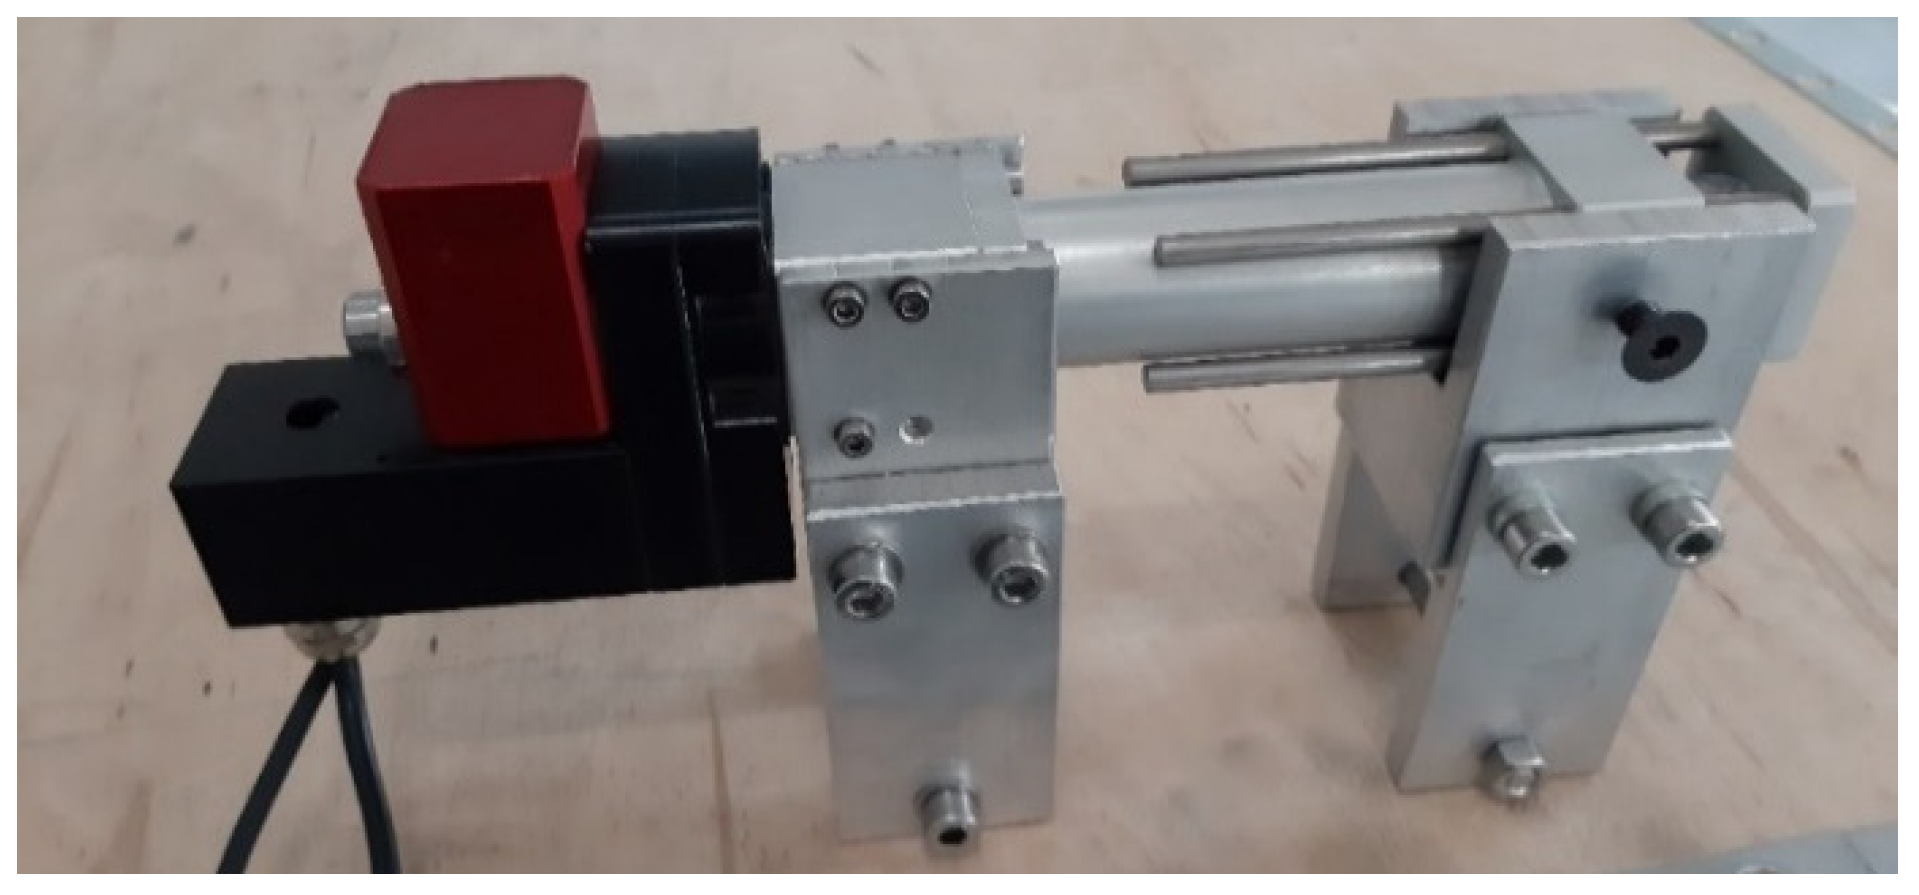
2.1. Mechanical Components
2.2. Electronic Components
3. Calibration Methods
3.1. Calibration of the Inclinometric Sensor
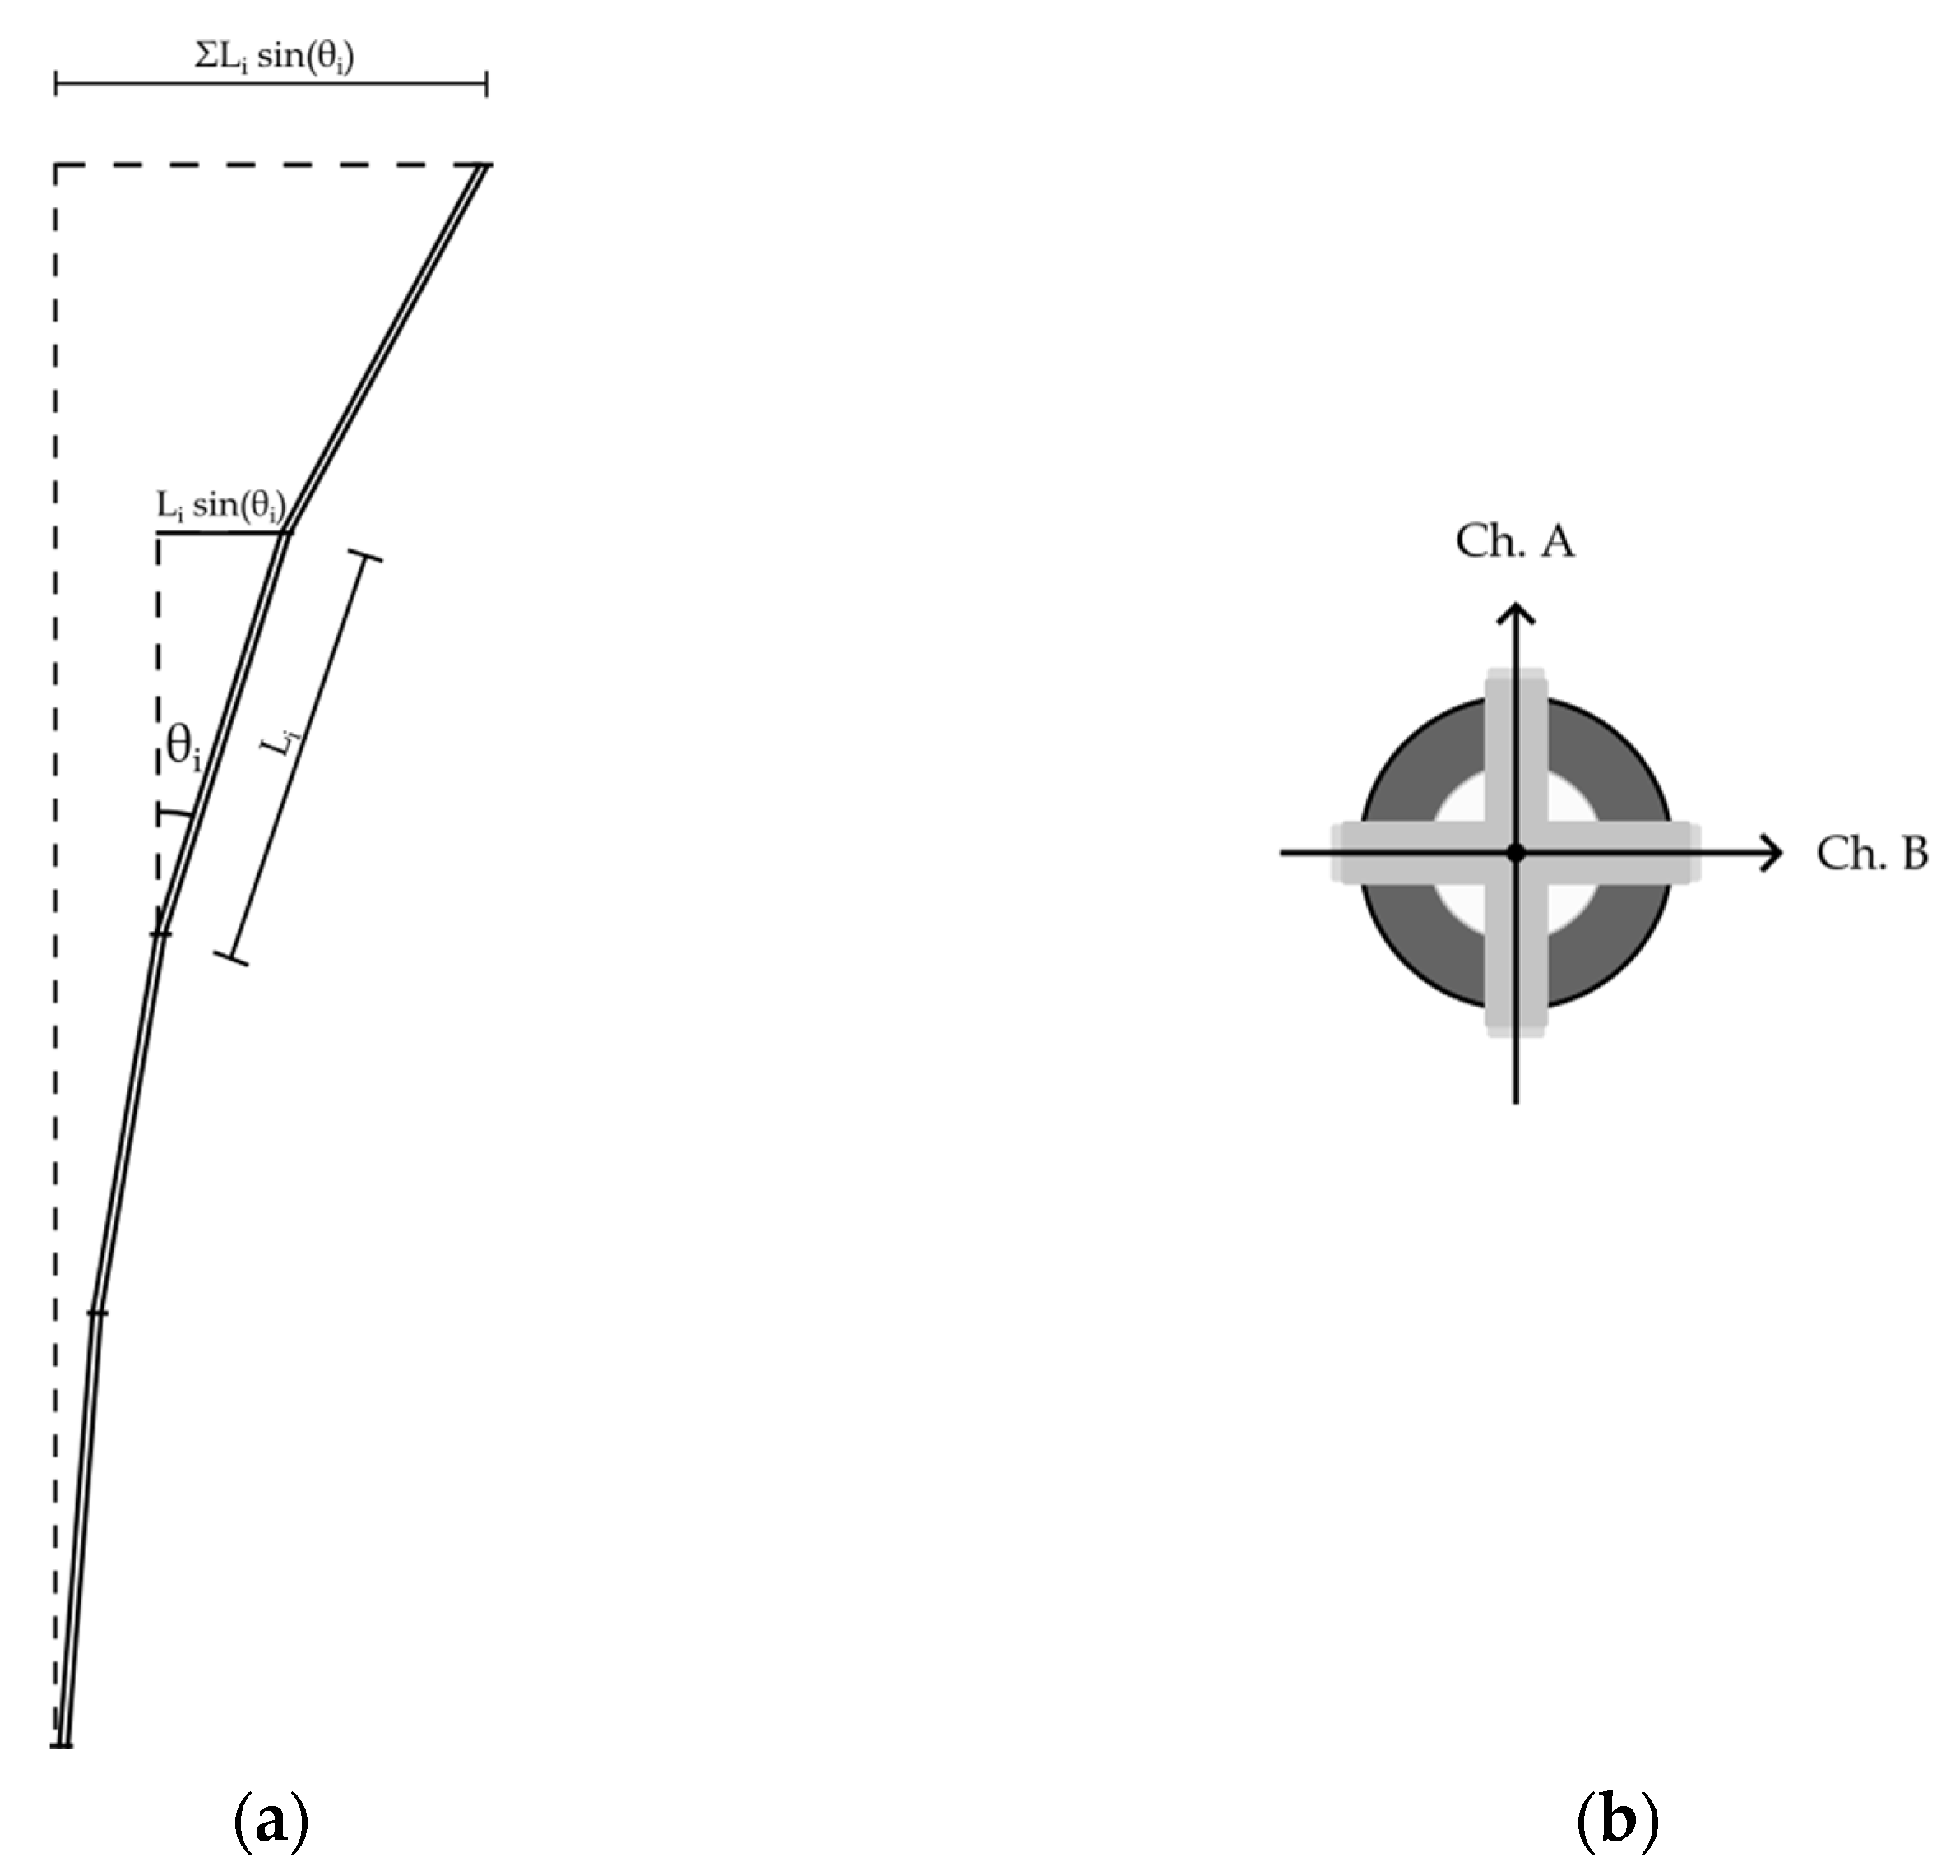
3.2. Calibration of the Inclinometric Chain
- The interaction with the inclinometric casing must be punctual.
- The chain must be a kinematic mechanism completely free of inflections.
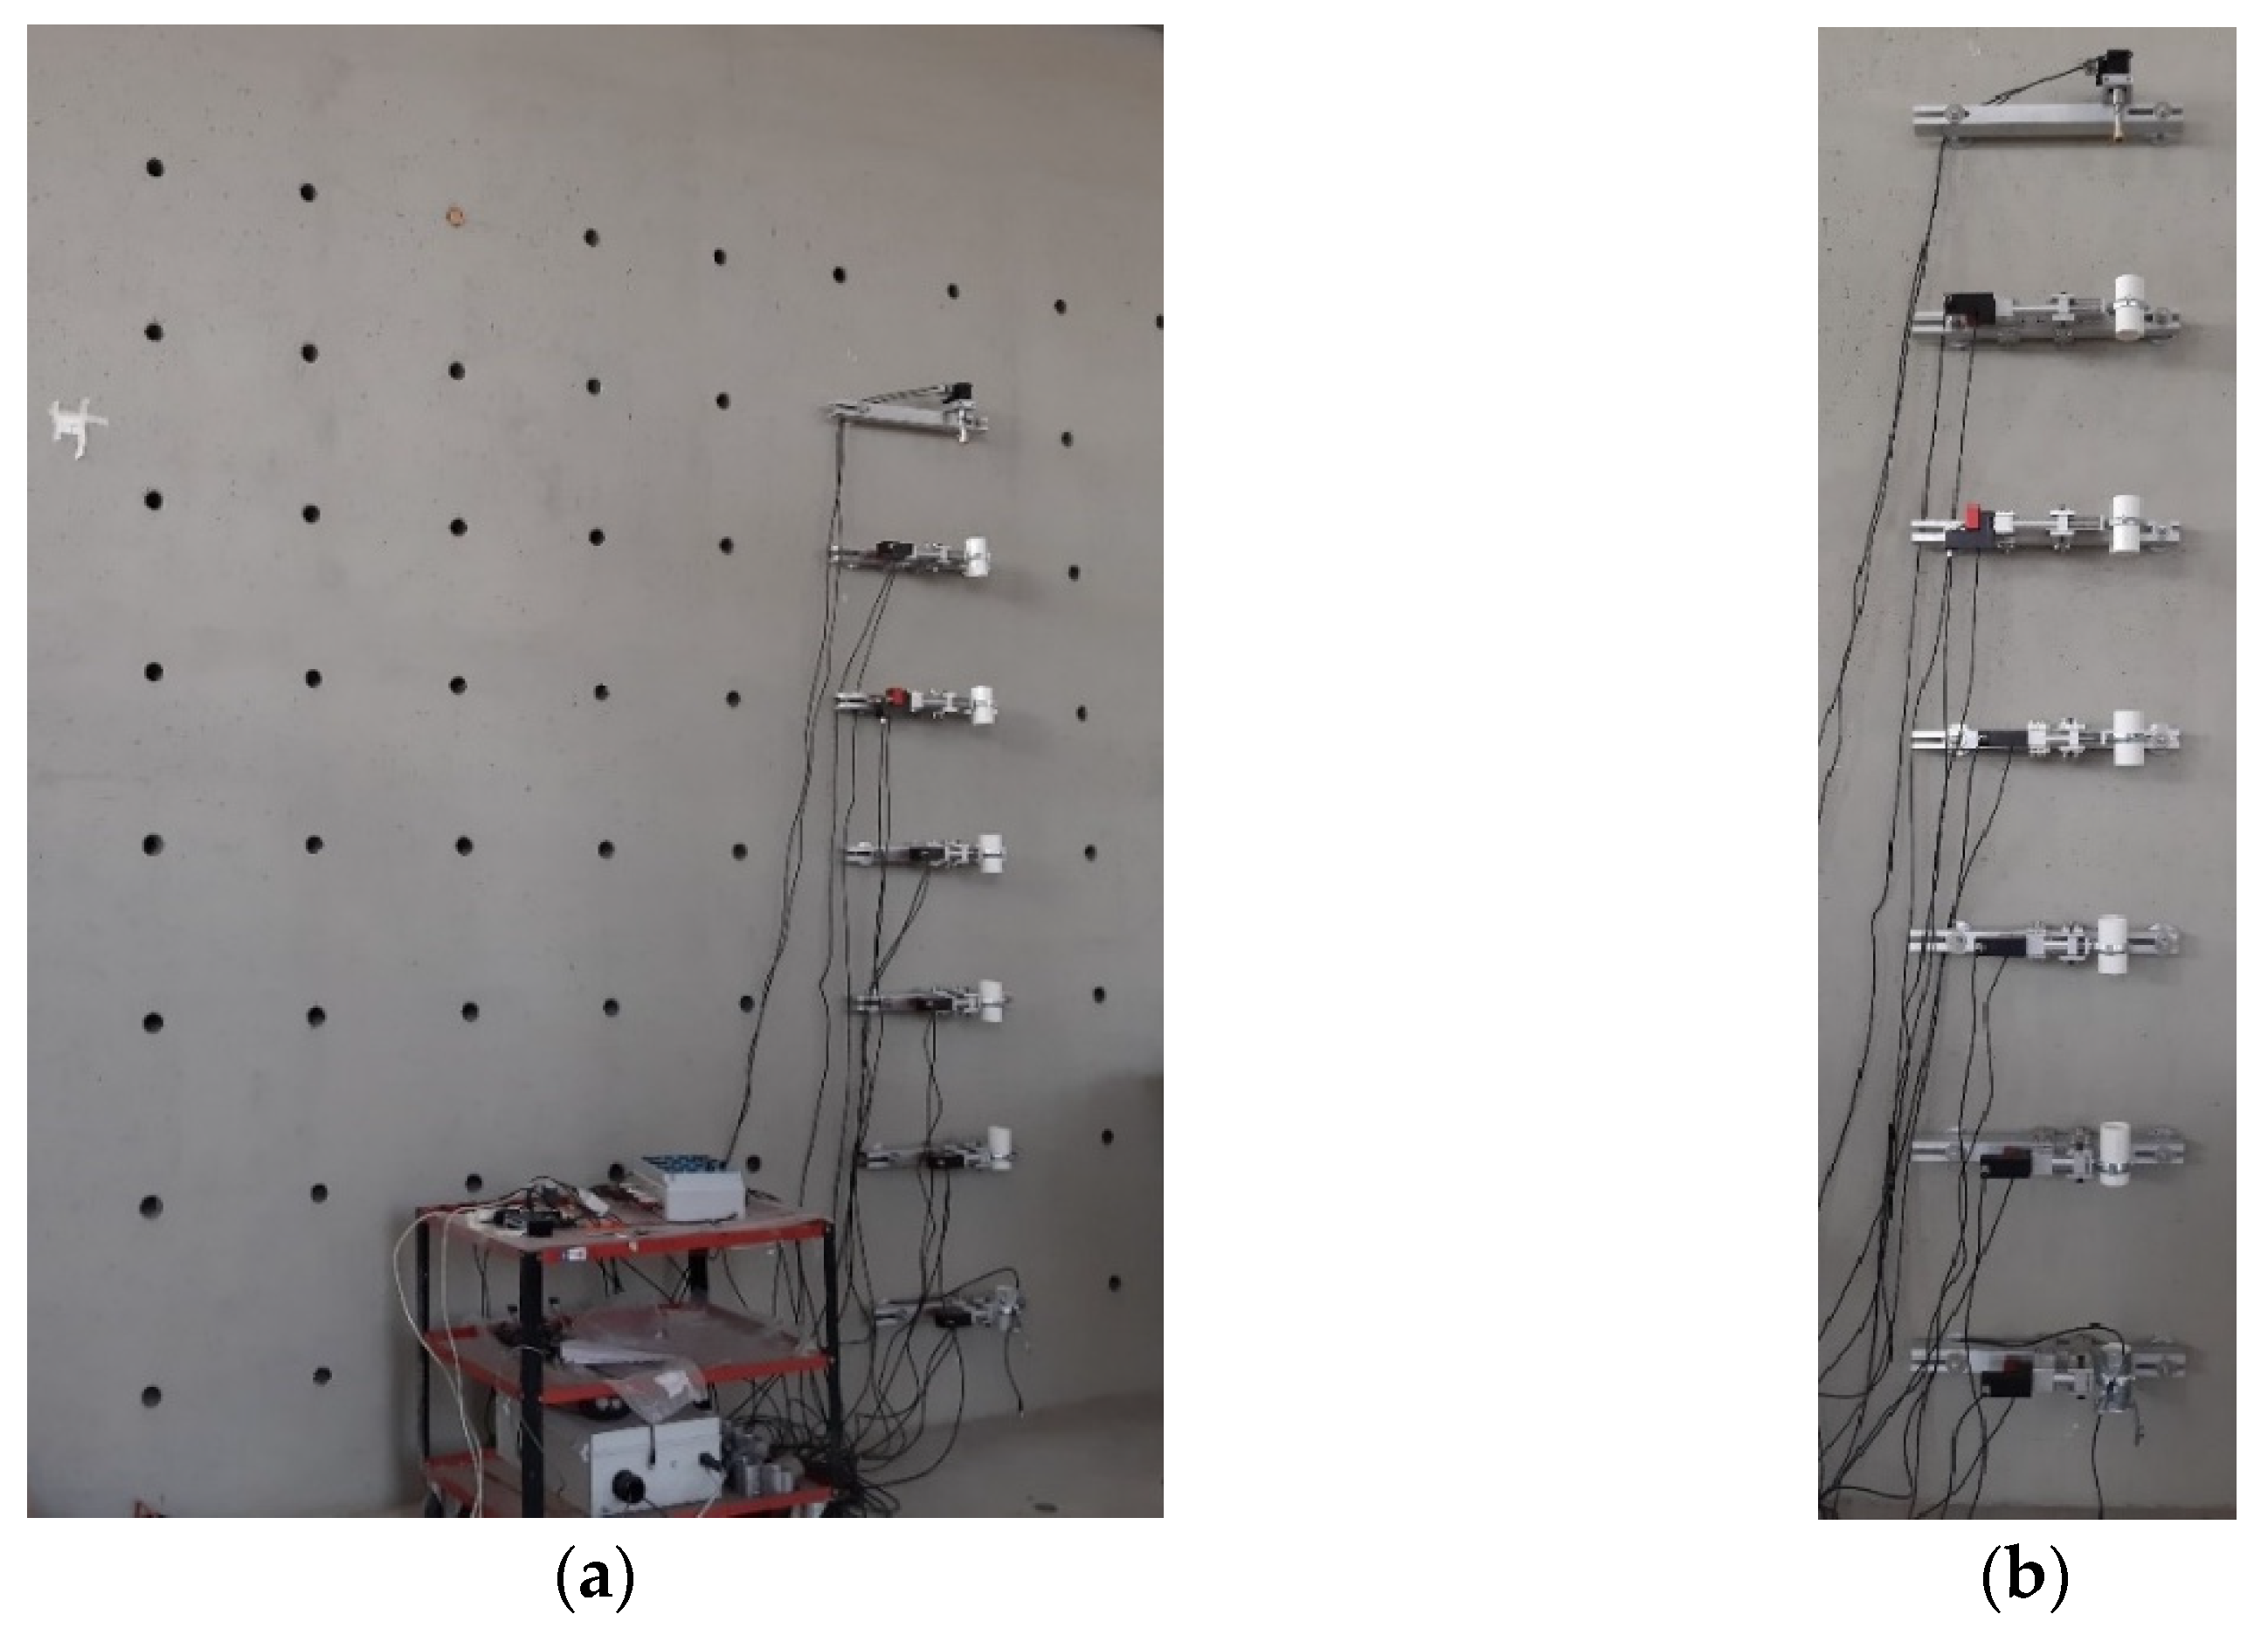
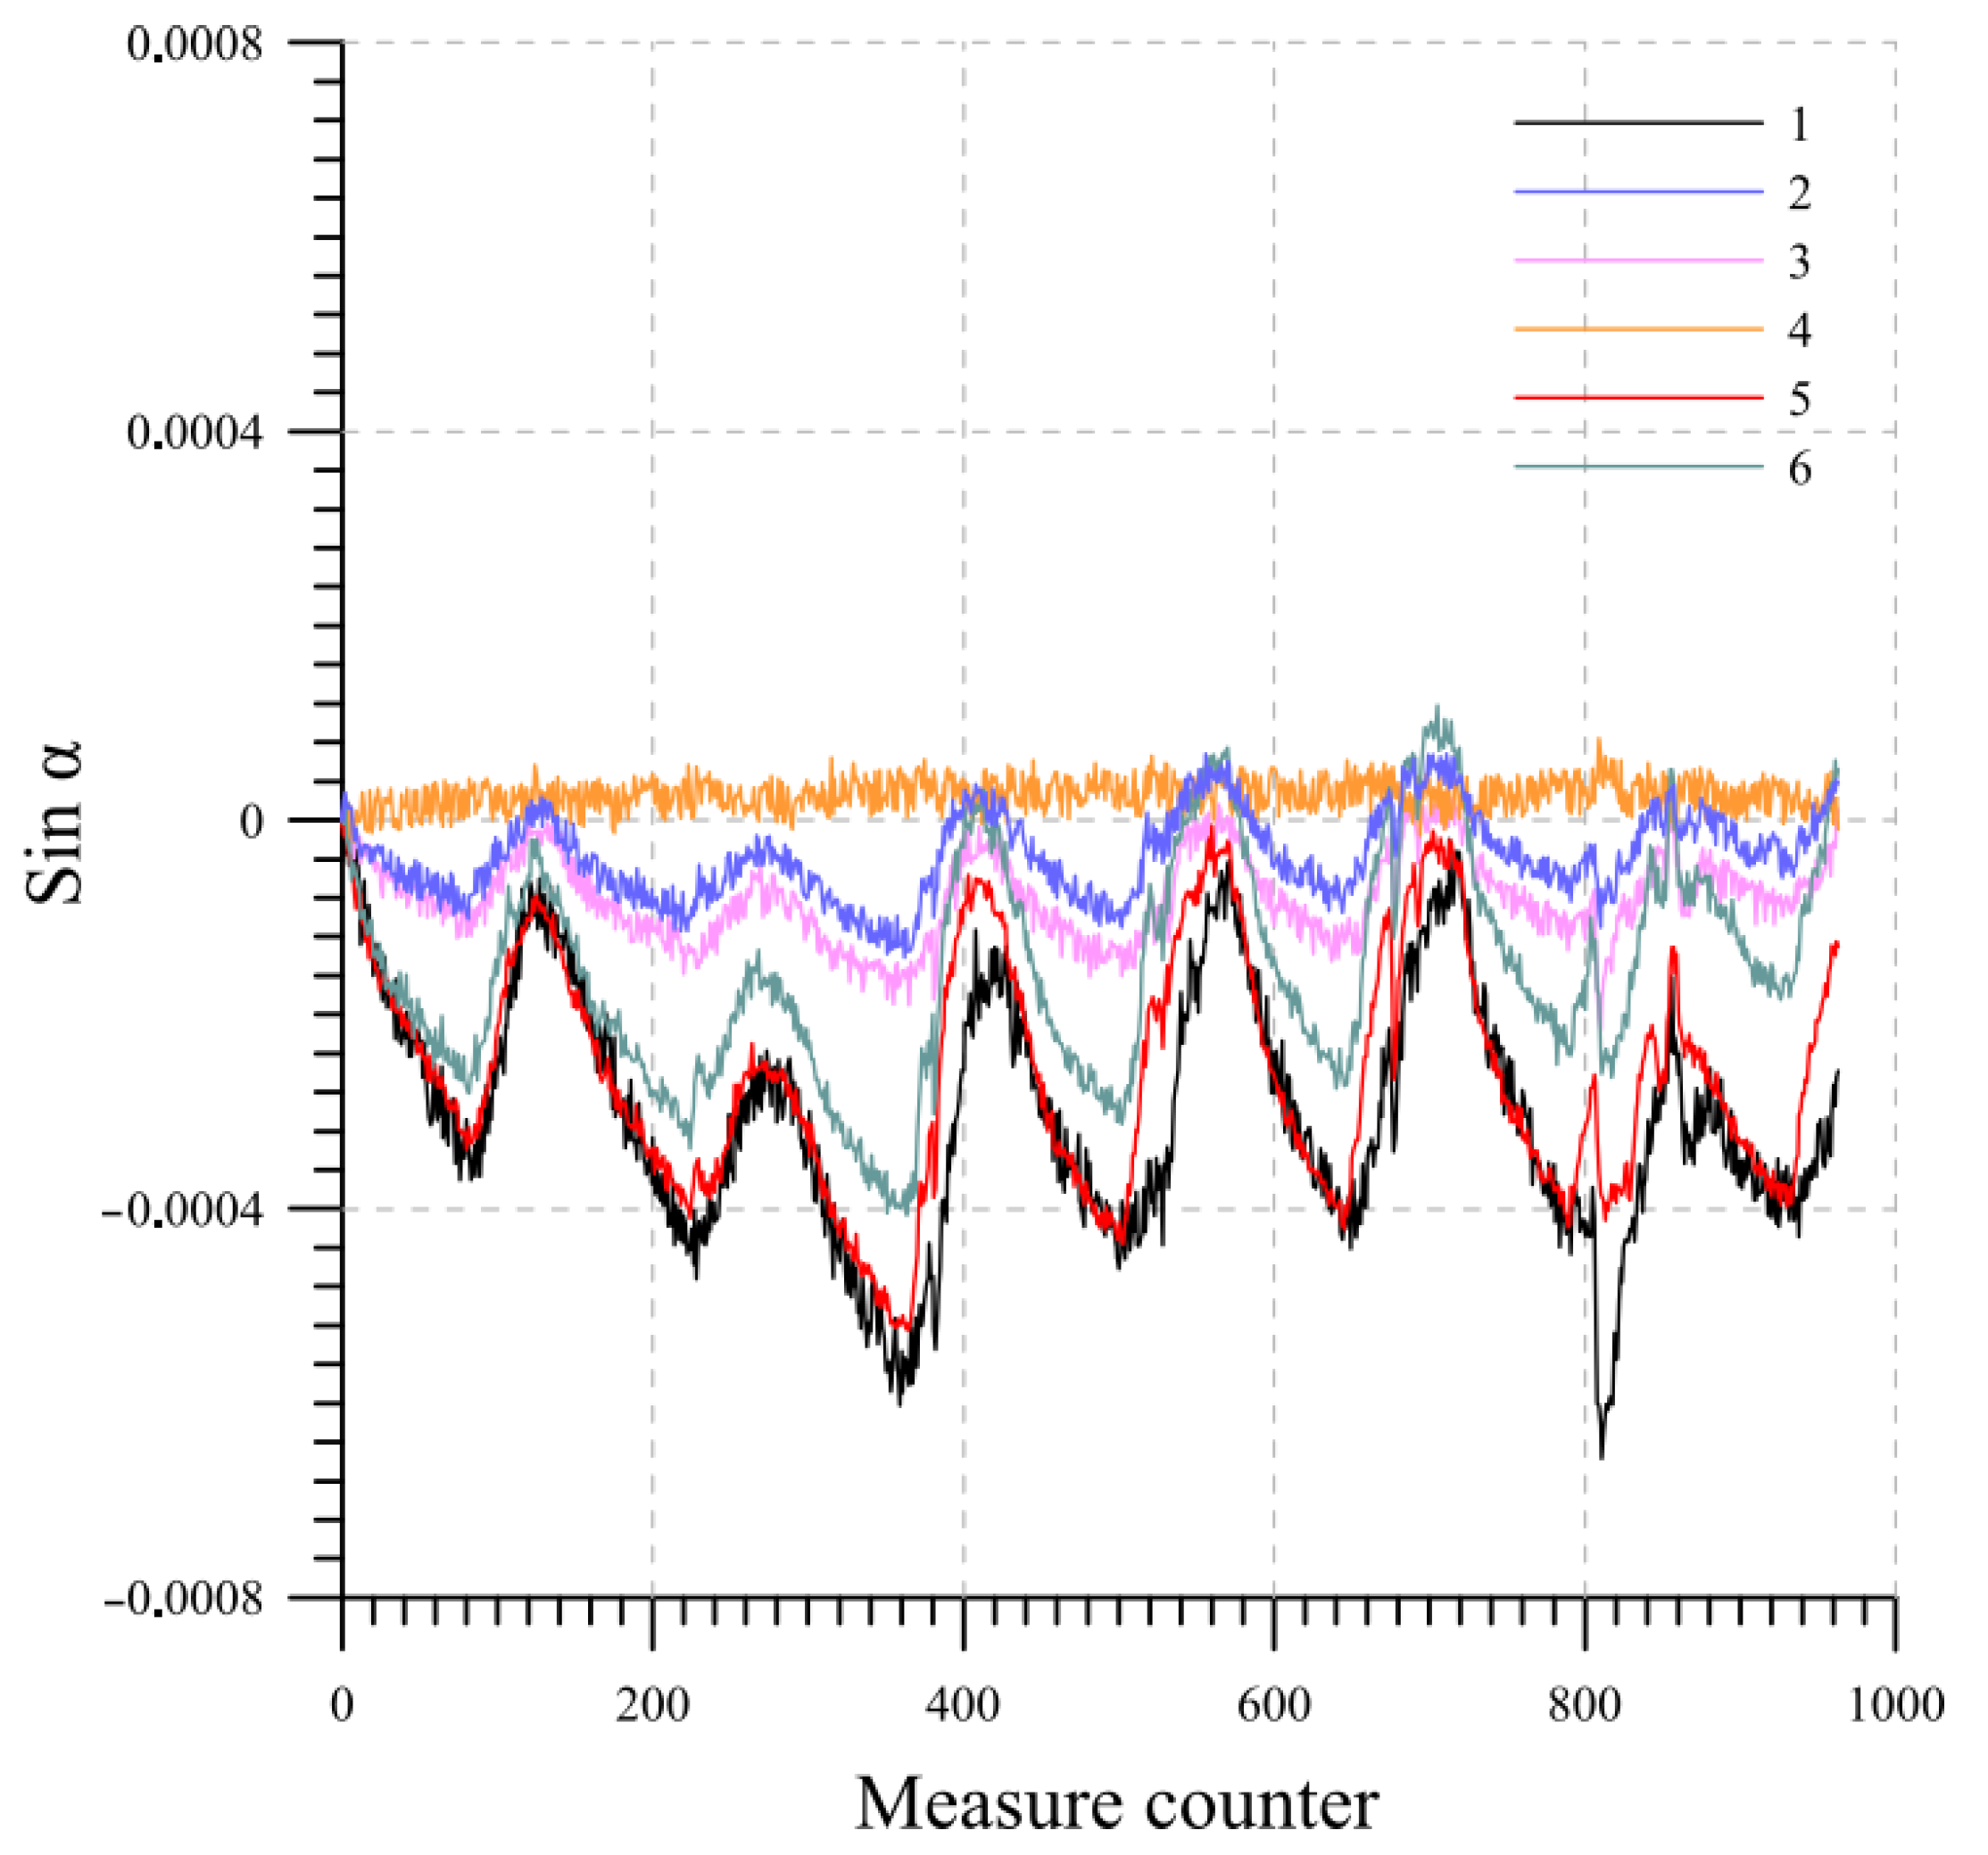
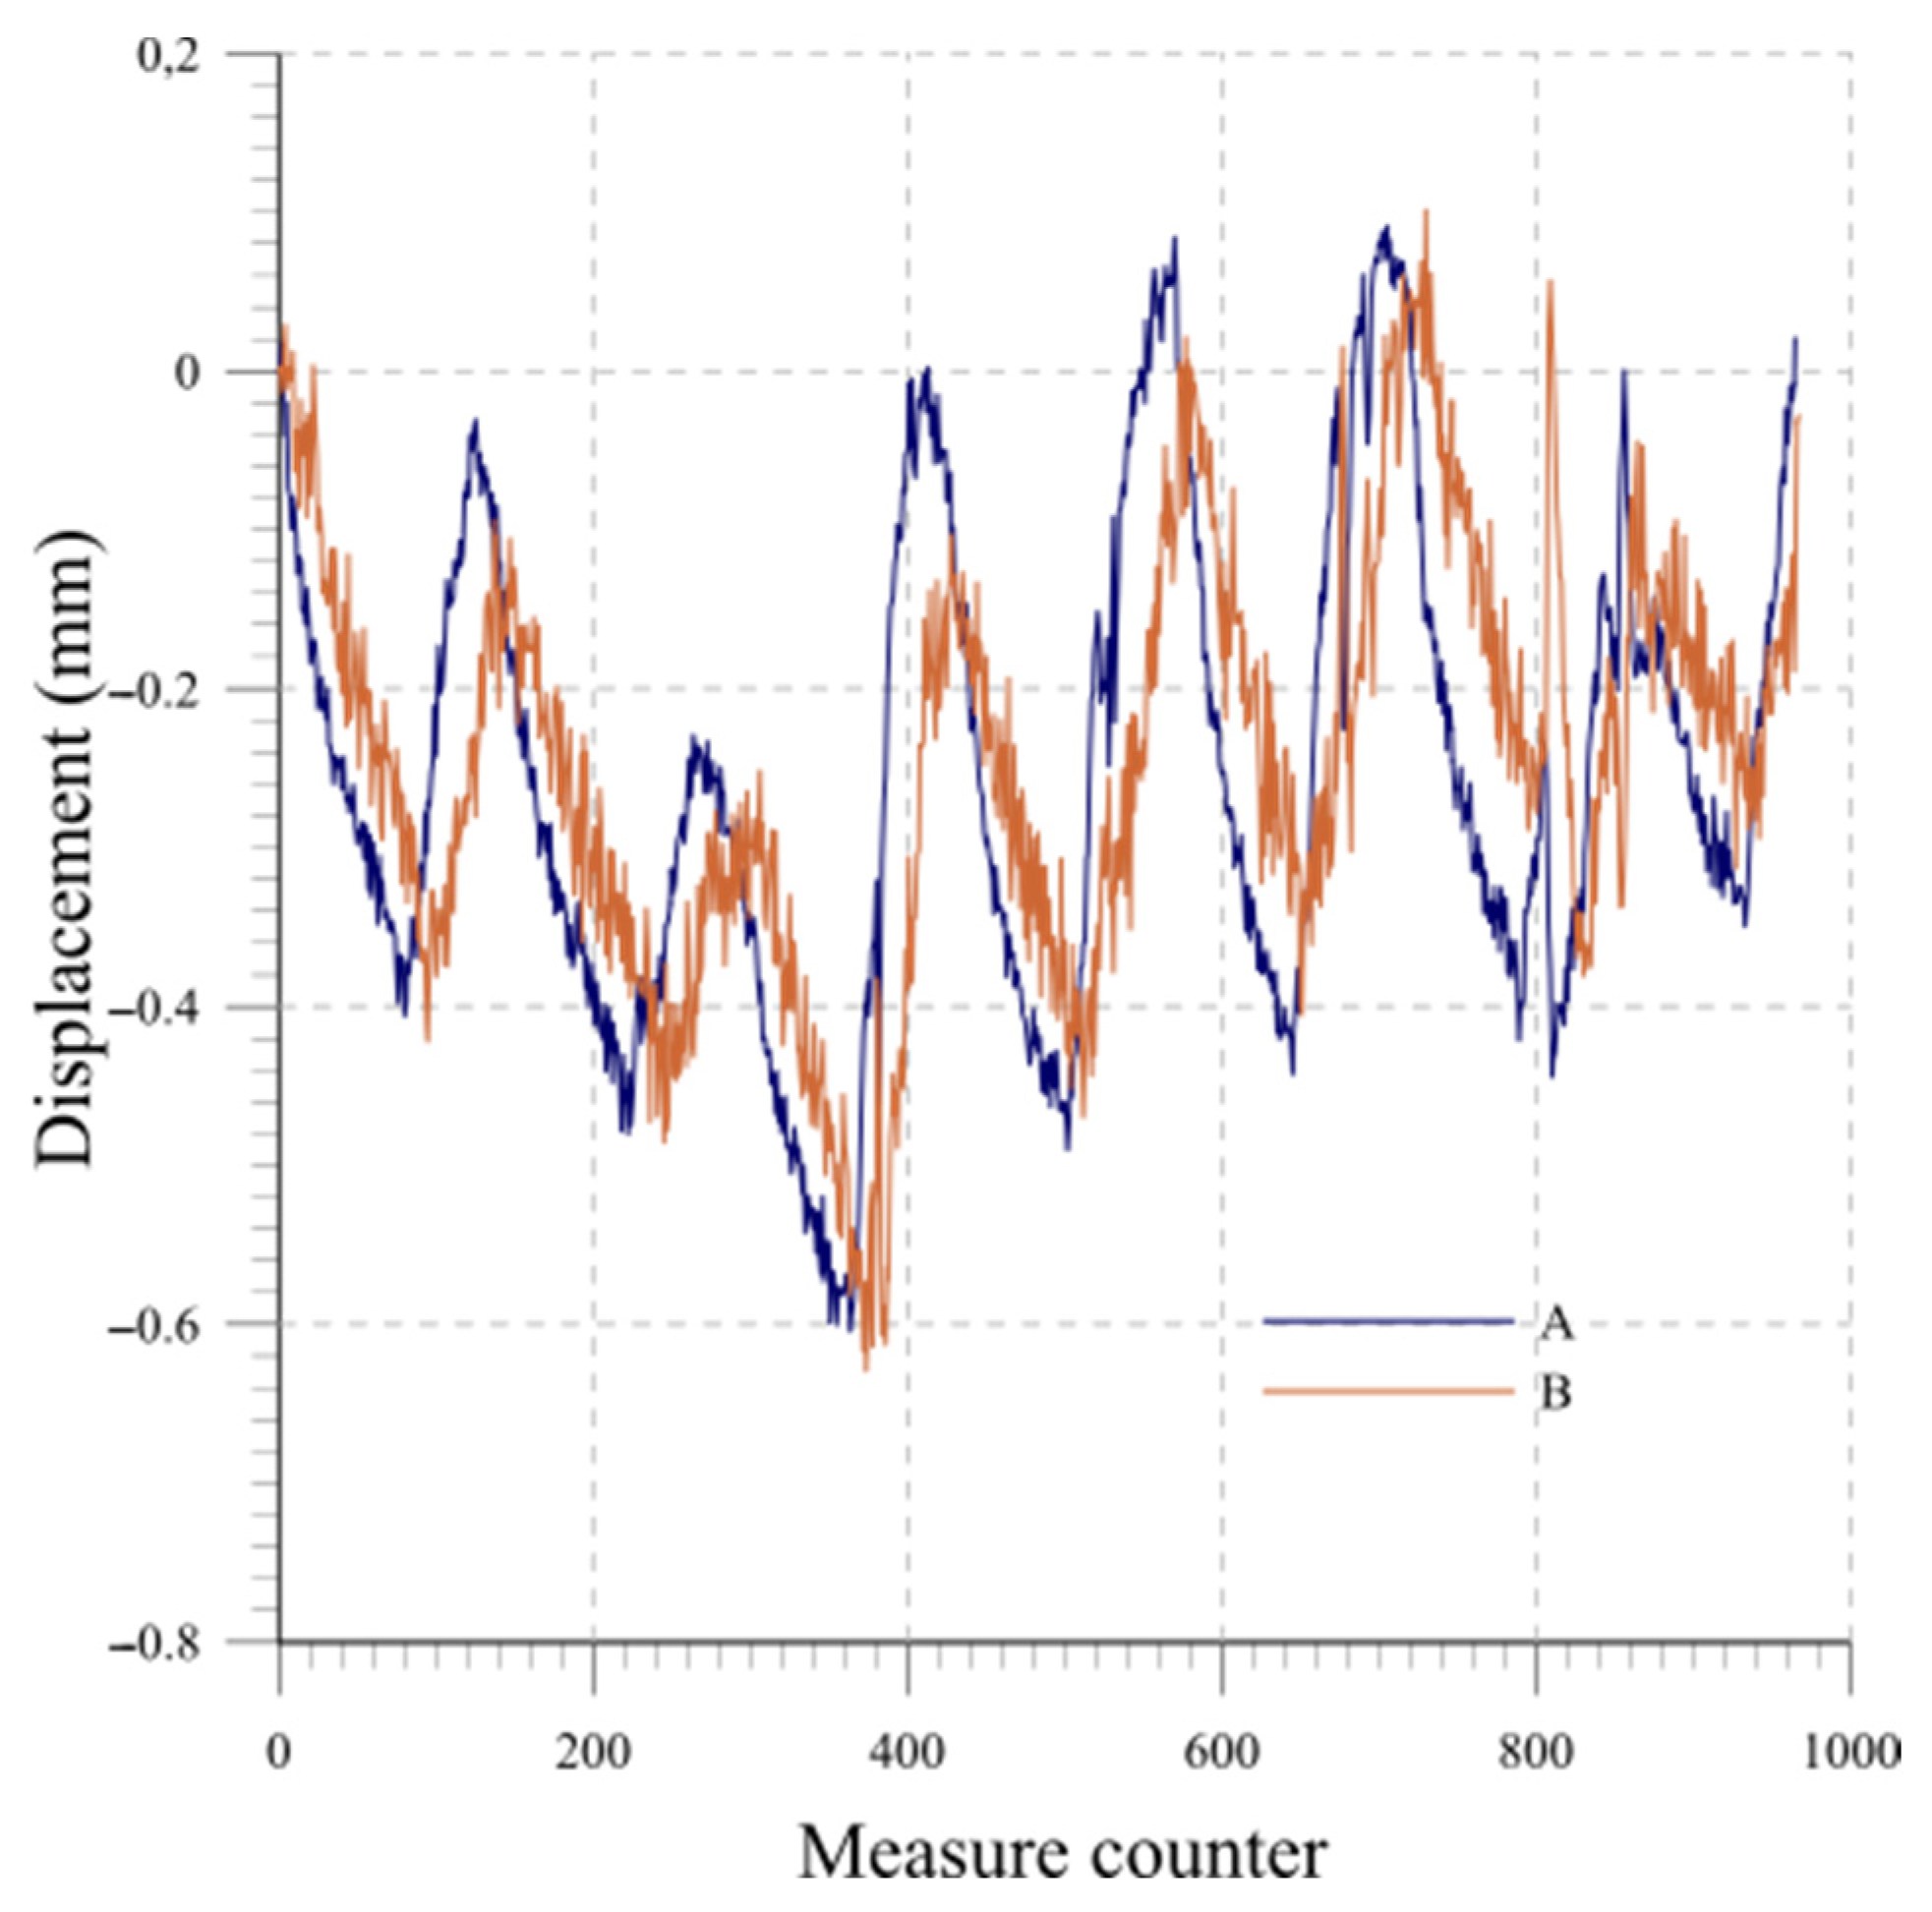
- Lab 1: Stability tests on a system chain composed of several probes are performed. The vertical and quasi-vertical configurations have been investigated with chains composed of three to six beams. Presence of drift errors as well as temperature effects on the measures while the instrument is in rest position are investigated.
- Lab 2: The performances of a single beam are investigated. The displacement is imposed on the second extremity of the last beam of the chain. Repeatability is evaluated.
- Lab 3: The performances of the measuring system under the imposed displacement of a node connecting two beams are investigated. This test replicates a net rupture within a structural element such as a fracture. Repeatability is evaluated.
- Lab 4: The performances of the measuring system under the imposed translation of two beams are investigated. This test replicates a discontinuity within a structural element or within soil. Repeatability is evaluated.
- Lab 5: The performances of the measuring system under imposed displacement of the entire chain along a parabolic profile are investigated. This test replicates the deflection of a retaining wall. Repeatability is evaluated.
4. Results
4.1. Inclinometer Sensor Calibration
- -
- Measuring range (bi-axial): ±30° (other ranges available under request)
- -
- Resolution: 0.0002°
- -
- Repeatability: <±0.008°
- -
- Accuracy (Maximum Permitted Error): <±0.025% F.S. (<±0.015°)
- -
- Offset temperature dependency: <±0.01°/°C
4.2. Lab 1
4.3. Lab 2
4.4. Lab 3
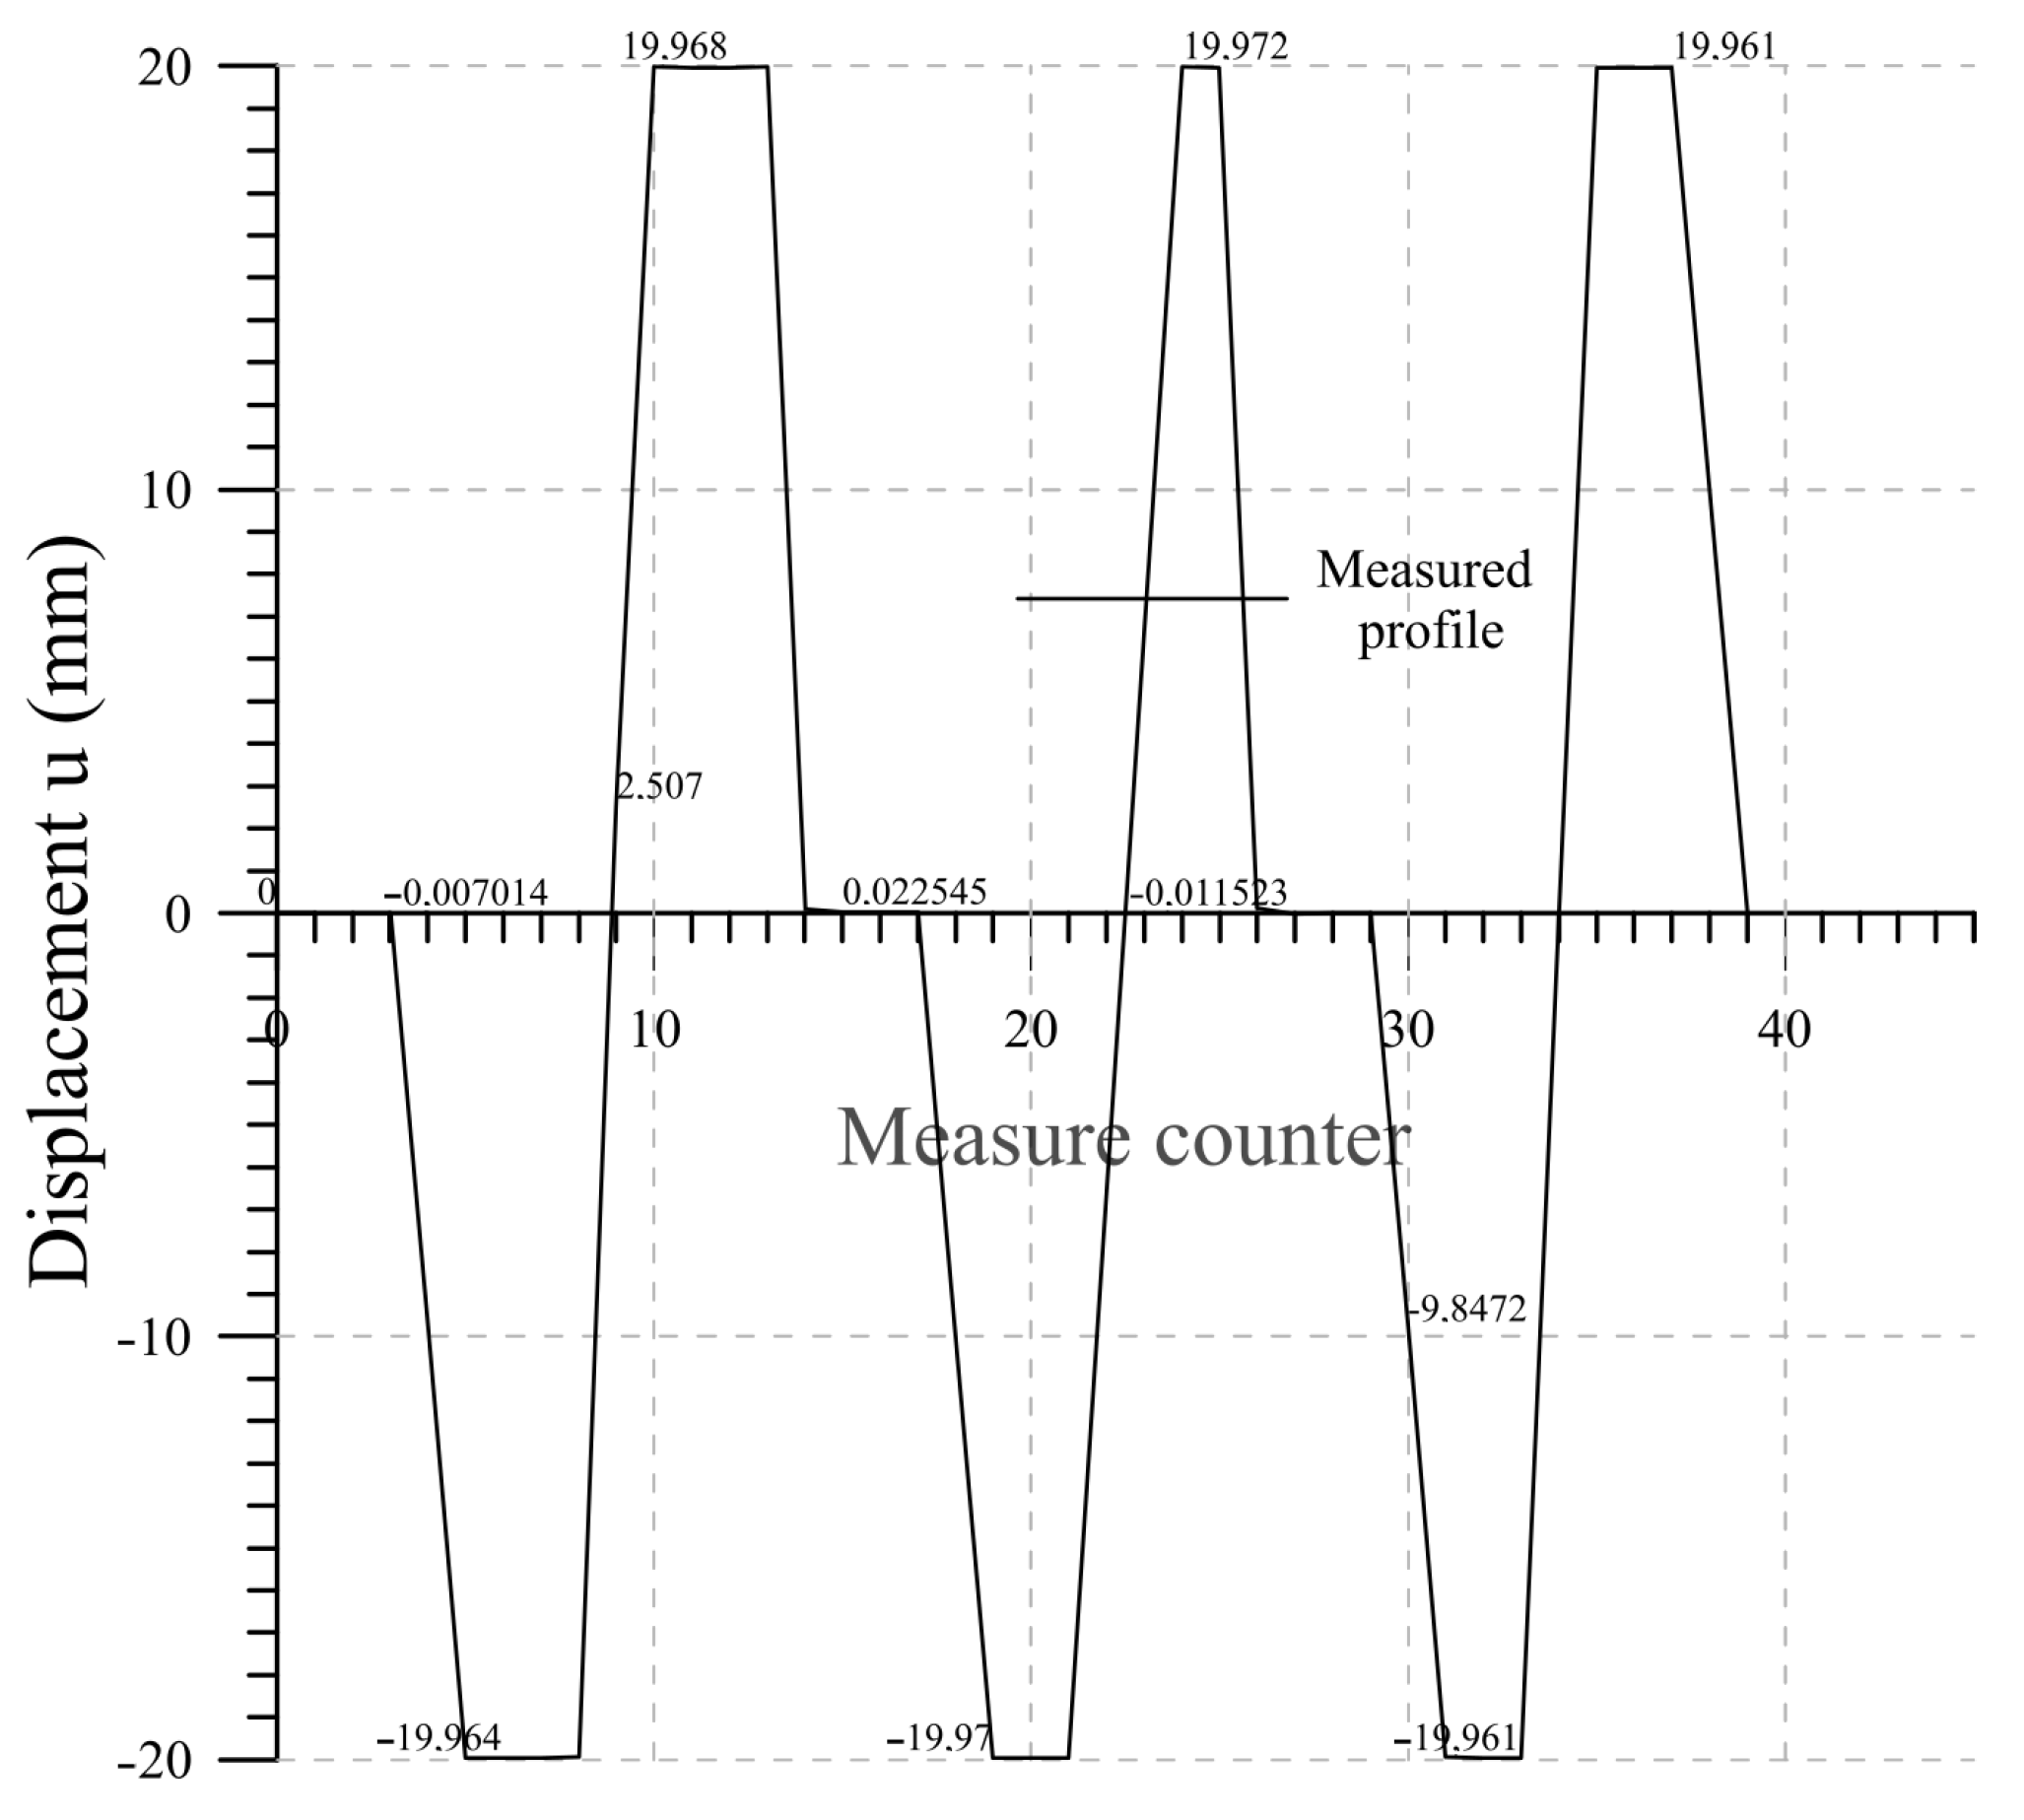
4.5. Lab 4
4.6. Lab 5
5. Discussion
- Measure range: maximum value of the imposed displacement;
- Max absolute error: maximum error recorded in the entire chain;
- Max repeatability error: maximum repeatability error recorded in the entire chain obtained in 10 measures;
- Disturbance of static beams: maximum ghost measure detected by beams in static condition (that should measure null displacement);
- Absolute error on cumulative displacement: maximum error on cumulative displacement.
6. Conclusions
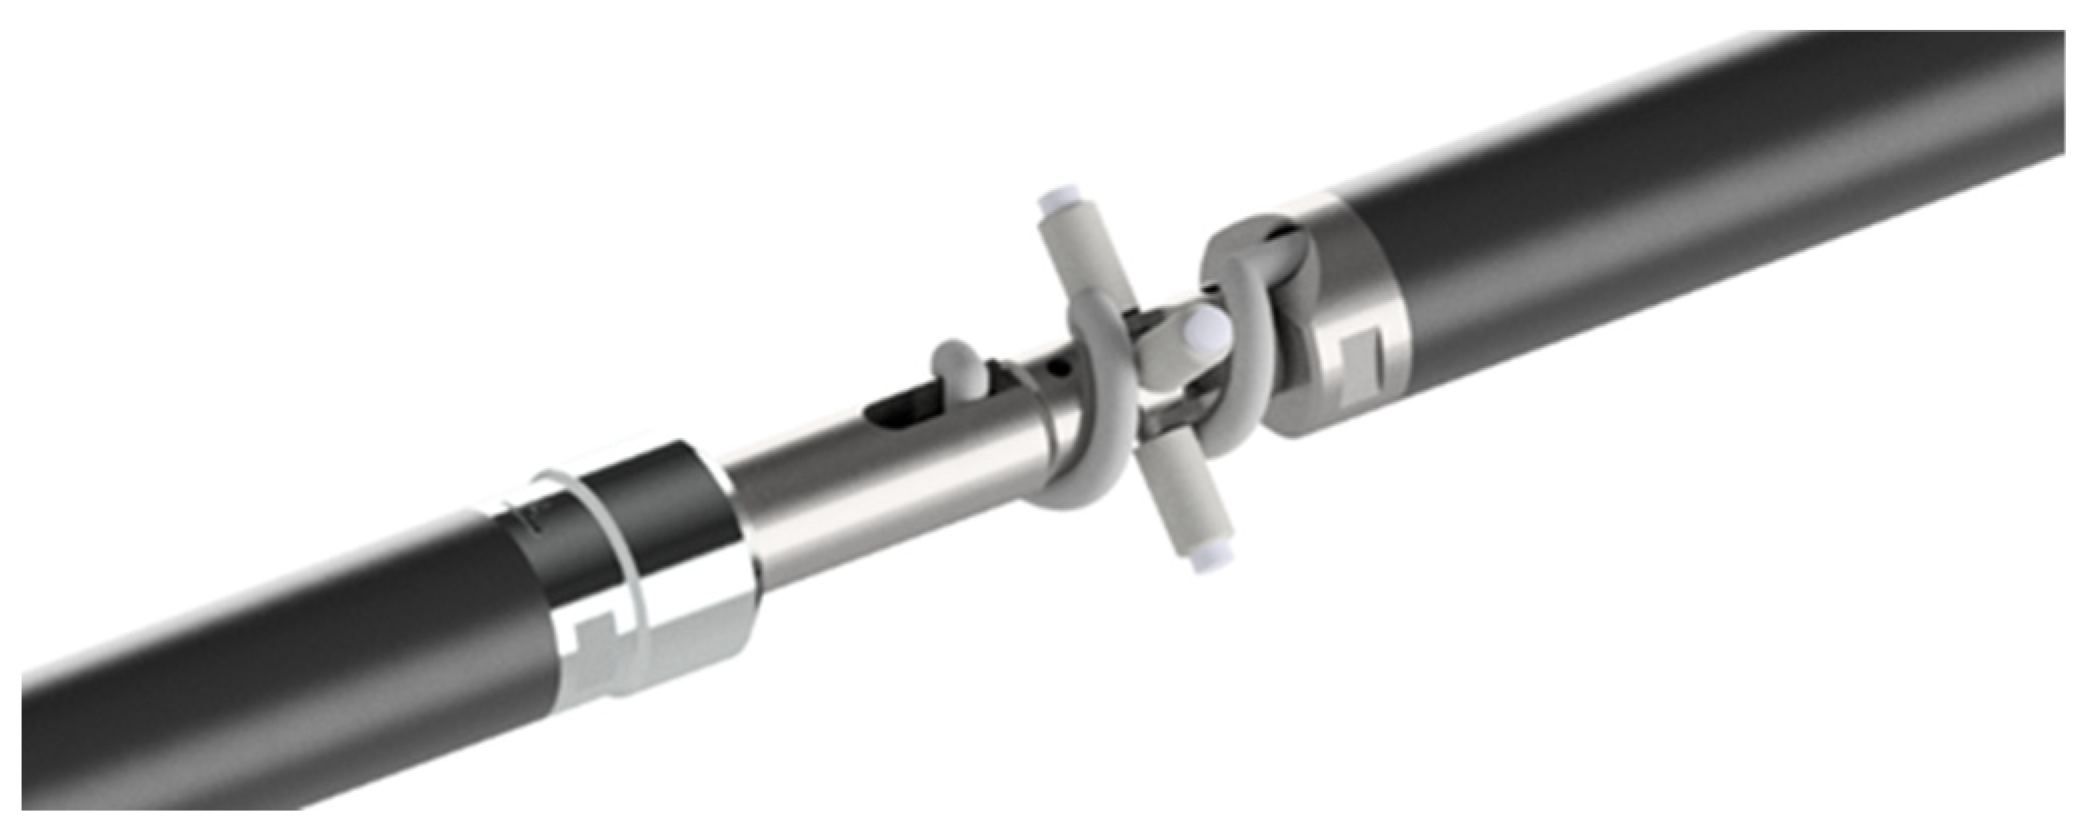
- The probes are connected by Cardan joints that allow relative rotations without altering the orientation of the inclinometer chain;
- The centering device allows the probe to remain in the center of the tube;
- The centering device creates a perfect kinematic chain in which the hinges are exactly positioned at the ends of the beams and the interaction between the beams and the tube coincides with the hinges;
- It is possible to use the system in tubes with or without grooves as no preferred measuring orientation is present.
Author Contributions
Funding
Data Availability Statement
Conflicts of Interest
References
- Dunnicliff, J. Geotechnical Instrumentation for Monitoring Field Performance; John Wiley & Sons, Inc.: Hoboken, NJ, USA, 1994. [Google Scholar]
- Uhlemann, S.; Smith, A.; Chambers, J.; Dixon, N.; Dijkstra, T.; Haslam, E.; Meldrum, P.; Merritt, A.; Gunn, D.; Mackay, J. Assessment of Ground-Based Monitoring Techniques Applied to Landslide Investigations. Geomorphology 2016, 253, 438–451. [Google Scholar] [CrossRef]
- Auflič, M.J.; Herrera, G.; Mateos, R.M.; Poyiadji, E.; Quental, L.; Severine, B.; Peternel, T.; Podolszki, L.; Calcaterra, S.; Kociu, A.; et al. Landslide Monitoring Techniques in the Geological Surveys of Europe. Landslides 2023, 20, 951–965. [Google Scholar] [CrossRef]
- Malet, J.-P.; Maquaire, O.; Calais, E. The Use of Global Positioning System Techniques for the Continuous Monitoring of Landslides: Application to the Super-Sauze Earthf Low (Alpes-de-Haute-Provence, France). Geomorphology 2002, 43, 33–54. [Google Scholar] [CrossRef]
- Salvini, R.; Vanneschi, C.; Lanciano, C.; Maseroli, R. Ground Displacements Estimation through GNSS and Geometric Leveling: A Geological Interpretation of the 2016–2017 Seismic Sequence in Central Italy. Geosciences 2022, 12, 167. [Google Scholar] [CrossRef]
- Allasia, P.; Godone, D.; Giordan, D.; Guenzi, D.; Lollino, G. Advances on Measuring Deep-Seated Ground Deformations Using Robotized Inclinometer System. Sensors 2020, 20, 3769. [Google Scholar] [CrossRef]
- Bordoni, M.; Vivaldi, V.; Bonì, R.; Spanò, S.; Tararbra, M.; Lanteri, L.; Parnigoni, M.; Grossi, A.; Figini, S.; Meisina, C. A Methodology for the Analysis of Continuous Time-Series of Automatic Inclinometers for Slow-Moving Landslides Monitoring in Piemonte Region, Northern Italy. Nat. Hazards 2023, 115, 1115–1142. [Google Scholar] [CrossRef]
- Ha, D.W.; Kim, J.M.; Kim, Y.; Park, H.S. Development and Application of a Wireless MEMS-Based Borehole Inclinometer for Automated Measurement of Ground Movement. Autom. Constr. 2018, 87, 49–59. [Google Scholar] [CrossRef]
- Szczerbowski, Z.; Niedbalski, Z. The Application of a Sonic Probe Extensometer for the Detection of Rock Salt Flow Field in Underground Convergence Monitoring. Sensors 2021, 21, 5562. [Google Scholar] [CrossRef]
- García, A.; Hördt, A.; Fabian, M. Landslide Monitoring with High Resolution Tilt Measurements at the Dollendorfer Hardt Landslide, Germany. Geomorphology 2010, 120, 16–25. [Google Scholar] [CrossRef]
- Corsini, A.; Pasuto, A.; Soldati, M.; Zannoni, A. Field Monitoring of the Corvara Landslide (Dolomites, Italy) and Its Relevance for Hazard Assessment. Geomorphology 2005, 66, 149–165. [Google Scholar] [CrossRef]
- Brückl, E.; Brunner, F.K.; Lang, E.; Mertl, S.; Müller, M.; Stary, U. The Gradenbach Observatory-Monitoring Deep-Seated Gravitational Slope Deformation by Geodetic, Hydrological, and Seismological Methods. Landslides 2013, 10, 815–829. [Google Scholar] [CrossRef]
- Iskander, M. Geotechnical Underground Sensing and Monitoring. In Underground Sensing: Monitoring and Hazard Detection for Environment and Infrastructure; Elsevier Inc.: Amsterdam, The Netherlands, 2018; pp. 141–202. ISBN 9780128031544. [Google Scholar]
- Bednarski, Ł.; Sieńko, R.; Kanty, P.; Howiacki, T. New Hydraulic Sensor for Distributed and Automated Displacement Measurements with Temperature Compensation System. Sensors 2021, 21, 4678. [Google Scholar] [CrossRef] [PubMed]
- Ha, D.W.; Park, H.S.; Choi, S.W.; Kim, Y. A Wireless MEMS-Based Inclinometer Sensor Node for Structural Health Monitoring. Sensors 2013, 13, 16090–16104. [Google Scholar] [CrossRef]
- Mohamad, H.; Beddelee, A.A.A.M.; Ghazali, M.F.; Lee, H.E.; Chaiyasarn, K.; Nasir, M.Y.M. Distributed Fibre Optic Inclinometer with Cloud-Based Monitoring System. Eng. Sci. Technol. Int. J. 2023, 41, 101406. [Google Scholar] [CrossRef]
- Bednarski, Ł.; Milewski, S.; Sieńko, R. Determination of Vertical and Horizontal Soil Displacements in Automated Measuring on the Basis of Angular Measurements. Tech. Trans. 2014, 6-B, 3–13. [Google Scholar]
- Stark, T.D.; Choi, H. Slope Inclinometers for Landslides. Landslides 2008, 5, 339–350. [Google Scholar] [CrossRef]
- Han, H.; Shi, B.; Yang, Y.; Zhang, L.; Huang, X.; Wei, G.; Zheng, X. A Continuous Tilt Sensor Based on UWFBG Technology for Landslide Real-Time Monitoring. IEEE Sens. J. 2023, 23, 1157–1165. [Google Scholar] [CrossRef]
- Ruzza, G.; Guerriero, L.; Revellino, P.; Guadagno, F.M. A Multi-Module Fixed Inclinometer for Continuous Monitoring of Landslides: Design, Development, and Laboratory Testing. Sensors 2020, 20, 3318. [Google Scholar] [CrossRef]
- Maheshwari, M.; Yang, Y.; Upadrashta, D.; Chaturvedi, T. A Rotation Independent In-Place Inclinometer/Tilt Sensor Based on Fiber Bragg Grating. IEEE Trans. Instrum. Meas. 2019, 68, 2943–2953. [Google Scholar] [CrossRef]
- Manicke, H.; Dewar, D. Performance Review of Slope Inclinometers in a Pipeline Geohazard Management Program. In Proceeding of the GeoCalgary 2022, Vancouver, BC, Canada, 2–5 October 2022. [Google Scholar]
- SISGEO Company. Available online: https://www.sisgeo.com/ (accessed on 16 March 2023).
- GEOSENSE Company. Available online: https://www.geosense.co.uk/ (accessed on 16 March 2023).
- SignalQuest Company. Available online: https://signalquest.com/ (accessed on 16 March 2023).
- Measurand Company. Available online: https://measurand.com/ (accessed on 16 March 2023).
- Soil Instruments Company. Available online: https://www.soilinstruments.com/ (accessed on 16 March 2023).
- Pei, H.; Cui, P.; Yin, J.; Zhu, H.; Chen, X.; Pei, L.; Xu, D. Monitoring and Warning of Landslides and Debris Flows Using an Optical Fiber Sensor Technology. J. Mt. Sci. 2011, 8, 728–738. [Google Scholar] [CrossRef]
- Samuelsson, O.; Lindblom, E.U.; Björk, A.; Carlsson, B. To Calibrate or Not to Calibrate, That Is the Question. Water Res. 2023, 229, 119338. [Google Scholar] [CrossRef] [PubMed]
- Bednarski, Ł.; Sieńko, R.; Grygierek, M.; Howiacki, T. New Distributed Fibre Optic 3dsensor with Thermal Self-Compensation System: Design, Research and Field Proof Application inside Geotechnical Structure. Sensors 2021, 21, 5089. [Google Scholar] [CrossRef] [PubMed]
- “SISGEO Company” MD-Profile System. Available online: https://www.sisgeo.com/it/prodotti/inclinometri-e-tiltmetri/item/md-profile-system.html (accessed on 17 July 2023).
- “SISGEO Company” OMNIAlog Datalogger. Available online: https://www.sisgeo.com/products/readout-units-and-dataloggers/item/omnialog-datalogger.html (accessed on 17 July 2023).
- Yang, C.C.; Hsu, Y.L. A Review of Accelerometry-Based Wearable Motion Detectors for Physical Activity Monitoring. Sensors 2010, 10, 7772–7788. [Google Scholar] [CrossRef] [PubMed]
- ISO 10012:2003; Measurement Management Systems—Requirements for Measurement Processes and Measuring Equipment. ISO: Geneva, Switzerland, 2003.
- FIAMA Company. Available online: https://www.fiama.it/ (accessed on 18 July 2023).
- ISO 18674-3:2017; Geotechnical Investigation and Testing—Geotechnical Monitoring by Field Instrumentation—Part 3: Measurement of Displacements across a Line: Inclinometers. ISO: Geneva, Switzerland, 2017.


| Activity | Goal | Scheme | Imposed Displacement |
|---|---|---|---|
| Lab 1 | Determination of presence of drift in the measurements in rest conditions after installation |  | U = 0 mm, α = 0 mm |
| Lab 2 | Determination of the performance of a single beam |  | U = ±40 mm, α = ±4.5885° |
| Lab 3 | Determination of the performance of the chain under imposed displacement of a node connecting two beams (fracture simulation) |  | U = ±8, 12, 16, 20, 24, 28, 32, 36, 40 mm |
| Lab 4 | Determination of the performance of the chain under imposed translation of two beams (discontinuity simulation) | 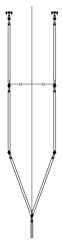 | U = ±8, 12, 16, 20, 24, 28, 32, 36, 40 mm |
| Lab 5 | Determination of the performance of the chain under imposed displacement of the entire chain along parabolic profile (wall deflection) | 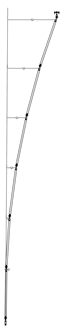 | U = ±40 mm at the top |
| Ch. A | ||
|---|---|---|
| Imposed Value [sin(α)] | Pre-Calibration [sin(α)] | Post-Calibration [sin(α)] |
| 0.498826 | 0.462448 | 0.498822 |
| 0.340494 | 0.308479 | 0.340494 |
| 0.171797 | 0.145000 | 0.171787 |
| −0.001974 | −0.022876 | −0.001979 |
| −0.175698 | −0.190273 | −0.175694 |
| −0.344155 | −0.352245 | −0.34417 |
| −0.502041 | −0.503681 | −0.502046 |
| −0.501978 | −0.503609 | −0.50197 |
| −0.343707 | −0.351799 | −0.343705 |
| −0.174904 | −0.1895031 | −0.174894 |
| −0.000913 | −0.021847 | −0.000912 |
| 0.172825 | 0.146008 | 0.172828 |
| 0.341354 | 0.309319 | 0.341359 |
| 0.499126 | 0.462745 | 0.499128 |
| MRE [%FS] | 0.6435% | 0.0021% |
| Measures (mm) | Mean (mm) | St. Dev | |||||||||
|---|---|---|---|---|---|---|---|---|---|---|---|
| 40.035 | 40.043 | 40.033 | 40.047 | 40.049 | 40.041 | 40.032 | 40.039 | 40.023 | 40.047 | 40.036 | 0.0078 |
| Test | Range (mm) | Max Absolute Error (mm) | Repeatability (mm) | Disturbance of Static Beams (mm) | Absolute Error on Cumulative Displacement (mm) |
|---|---|---|---|---|---|
| Lab 1 | null | <0.0001 rad each beam | <0.0001 rad each beam | Not available | ±0.12 mm |
| Lab 2 | ±40 mm | ±0.1 mm | ±0.05 mm | ±0.05 mm | Not available |
| Lab 3 | ±20 mm | ±0.1 mm | ±0.05 mm | ±0.05 mm | ±0.05 mm |
| Lab 3 | ±40 mm | ±0.25 mm | ±0.1 mm | ±0.1 mm | ±0.1 mm |
| Lab 4 | ±20 mm | ±0.08 mm | ±0.04 mm | ±0.05 mm | ±0.08 mm |
| Lab 5 | ±20 mm | ±0.1 mm (cumulative displacement) | ±0.05 mm | Not available | ±0.1 mm |
| Lab 5 | ±40 mm | ±0.25 mm (cumulative displacement) | ±0.1 mm | Not available | ±0.25 mm |
Disclaimer/Publisher’s Note: The statements, opinions and data contained in all publications are solely those of the individual author(s) and contributor(s) and not of MDPI and/or the editor(s). MDPI and/or the editor(s) disclaim responsibility for any injury to people or property resulting from any ideas, methods, instructions or products referred to in the content. |
© 2023 by the authors. Licensee MDPI, Basel, Switzerland. This article is an open access article distributed under the terms and conditions of the Creative Commons Attribution (CC BY) license (https://creativecommons.org/licenses/by/4.0/).
Share and Cite
Freddi, F.; Mingazzi, L.; Pozzi, E.; Aresi, N. Laboratory Assessment of an In-Place Inclinometer Chain for Structural and Geotechnical Monitoring. Sensors 2023, 23, 8379. https://doi.org/10.3390/s23208379
Freddi F, Mingazzi L, Pozzi E, Aresi N. Laboratory Assessment of an In-Place Inclinometer Chain for Structural and Geotechnical Monitoring. Sensors. 2023; 23(20):8379. https://doi.org/10.3390/s23208379
Chicago/Turabian StyleFreddi, Francesco, Lorenzo Mingazzi, Emilio Pozzi, and Nicola Aresi. 2023. "Laboratory Assessment of an In-Place Inclinometer Chain for Structural and Geotechnical Monitoring" Sensors 23, no. 20: 8379. https://doi.org/10.3390/s23208379
APA StyleFreddi, F., Mingazzi, L., Pozzi, E., & Aresi, N. (2023). Laboratory Assessment of an In-Place Inclinometer Chain for Structural and Geotechnical Monitoring. Sensors, 23(20), 8379. https://doi.org/10.3390/s23208379