
Research on Guidance Methods of Digital Twin Robotic Arms Based on User Interaction Experience Quantification

Abstract
:1. Introduction
2. Research Status
2.1. Robotic Arms Based on Digital Twins
2.2. Digital Twin Interaction Design
2.3. Summary of Research Status
3. Completed Work
3.1. Theoretical Research
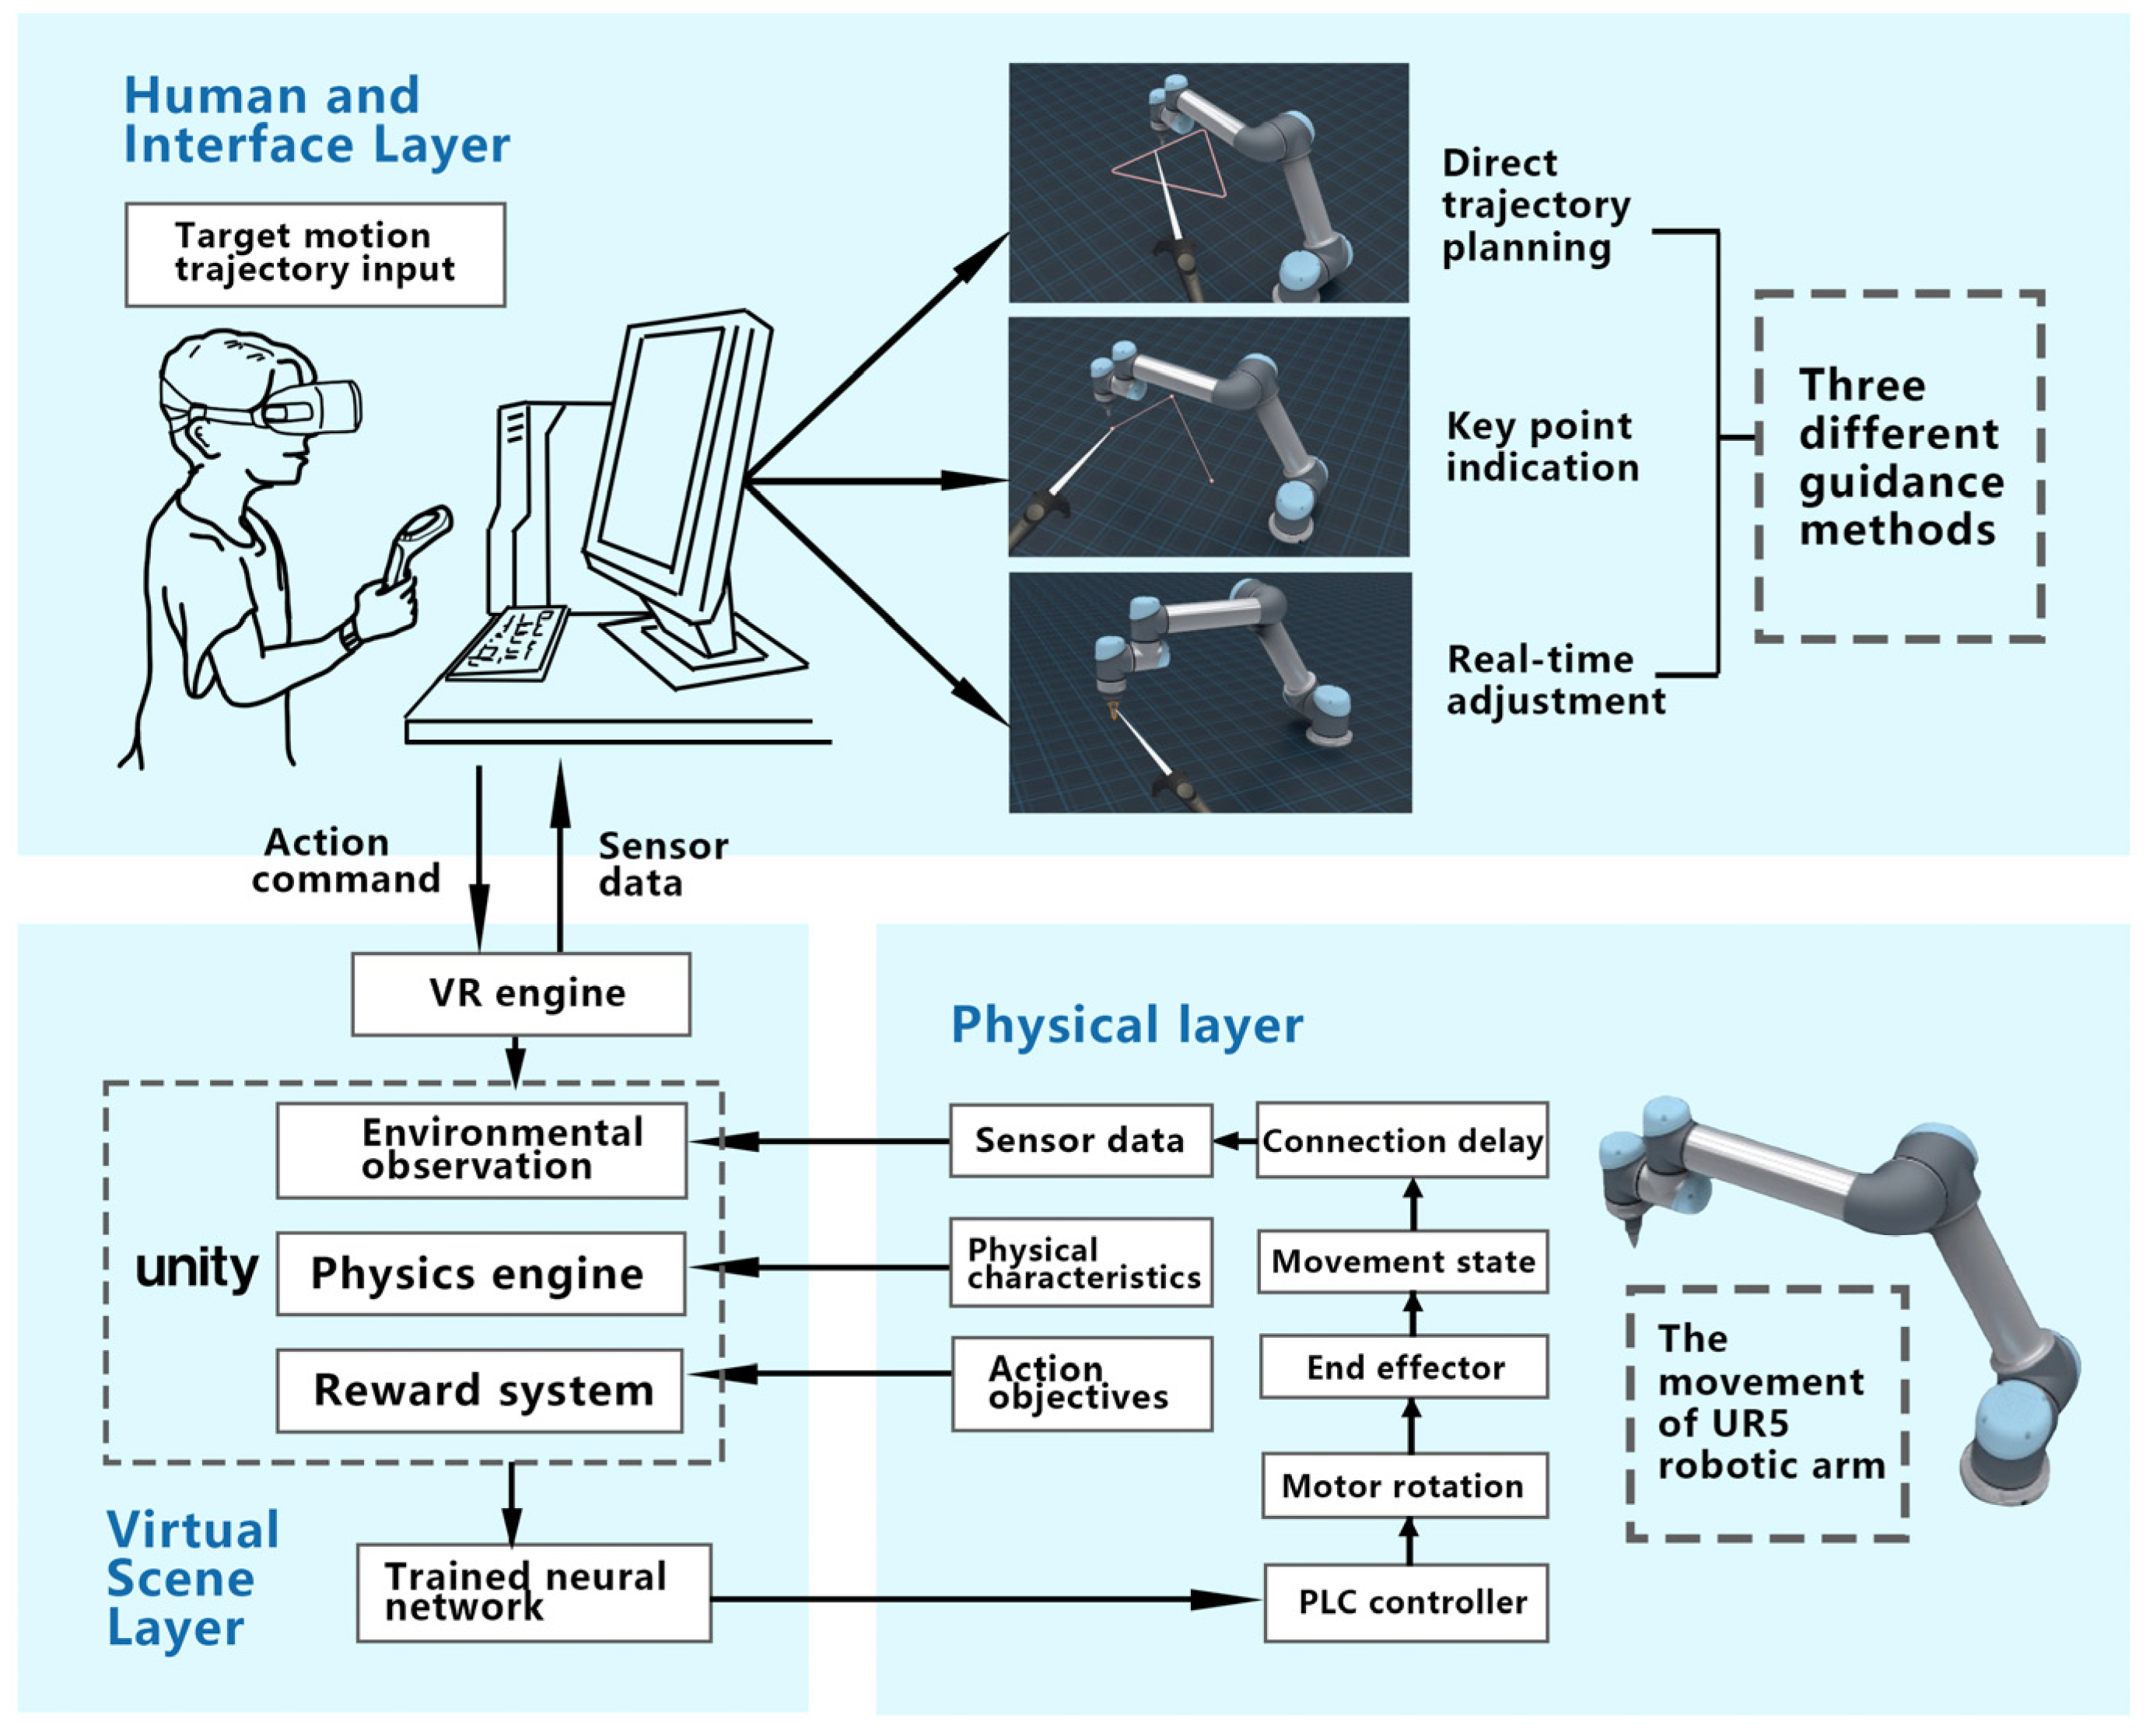
3.2. Task Execution Process of Digital Twin Robotic Arms
3.3. Research on User Demands
4. Research on Trajectory Planning Guidance Method for Digital Twin Robotic Arms
4.1. Experimental Purpose
4.2. Experimental Design
4.2.1. Experimental Variables
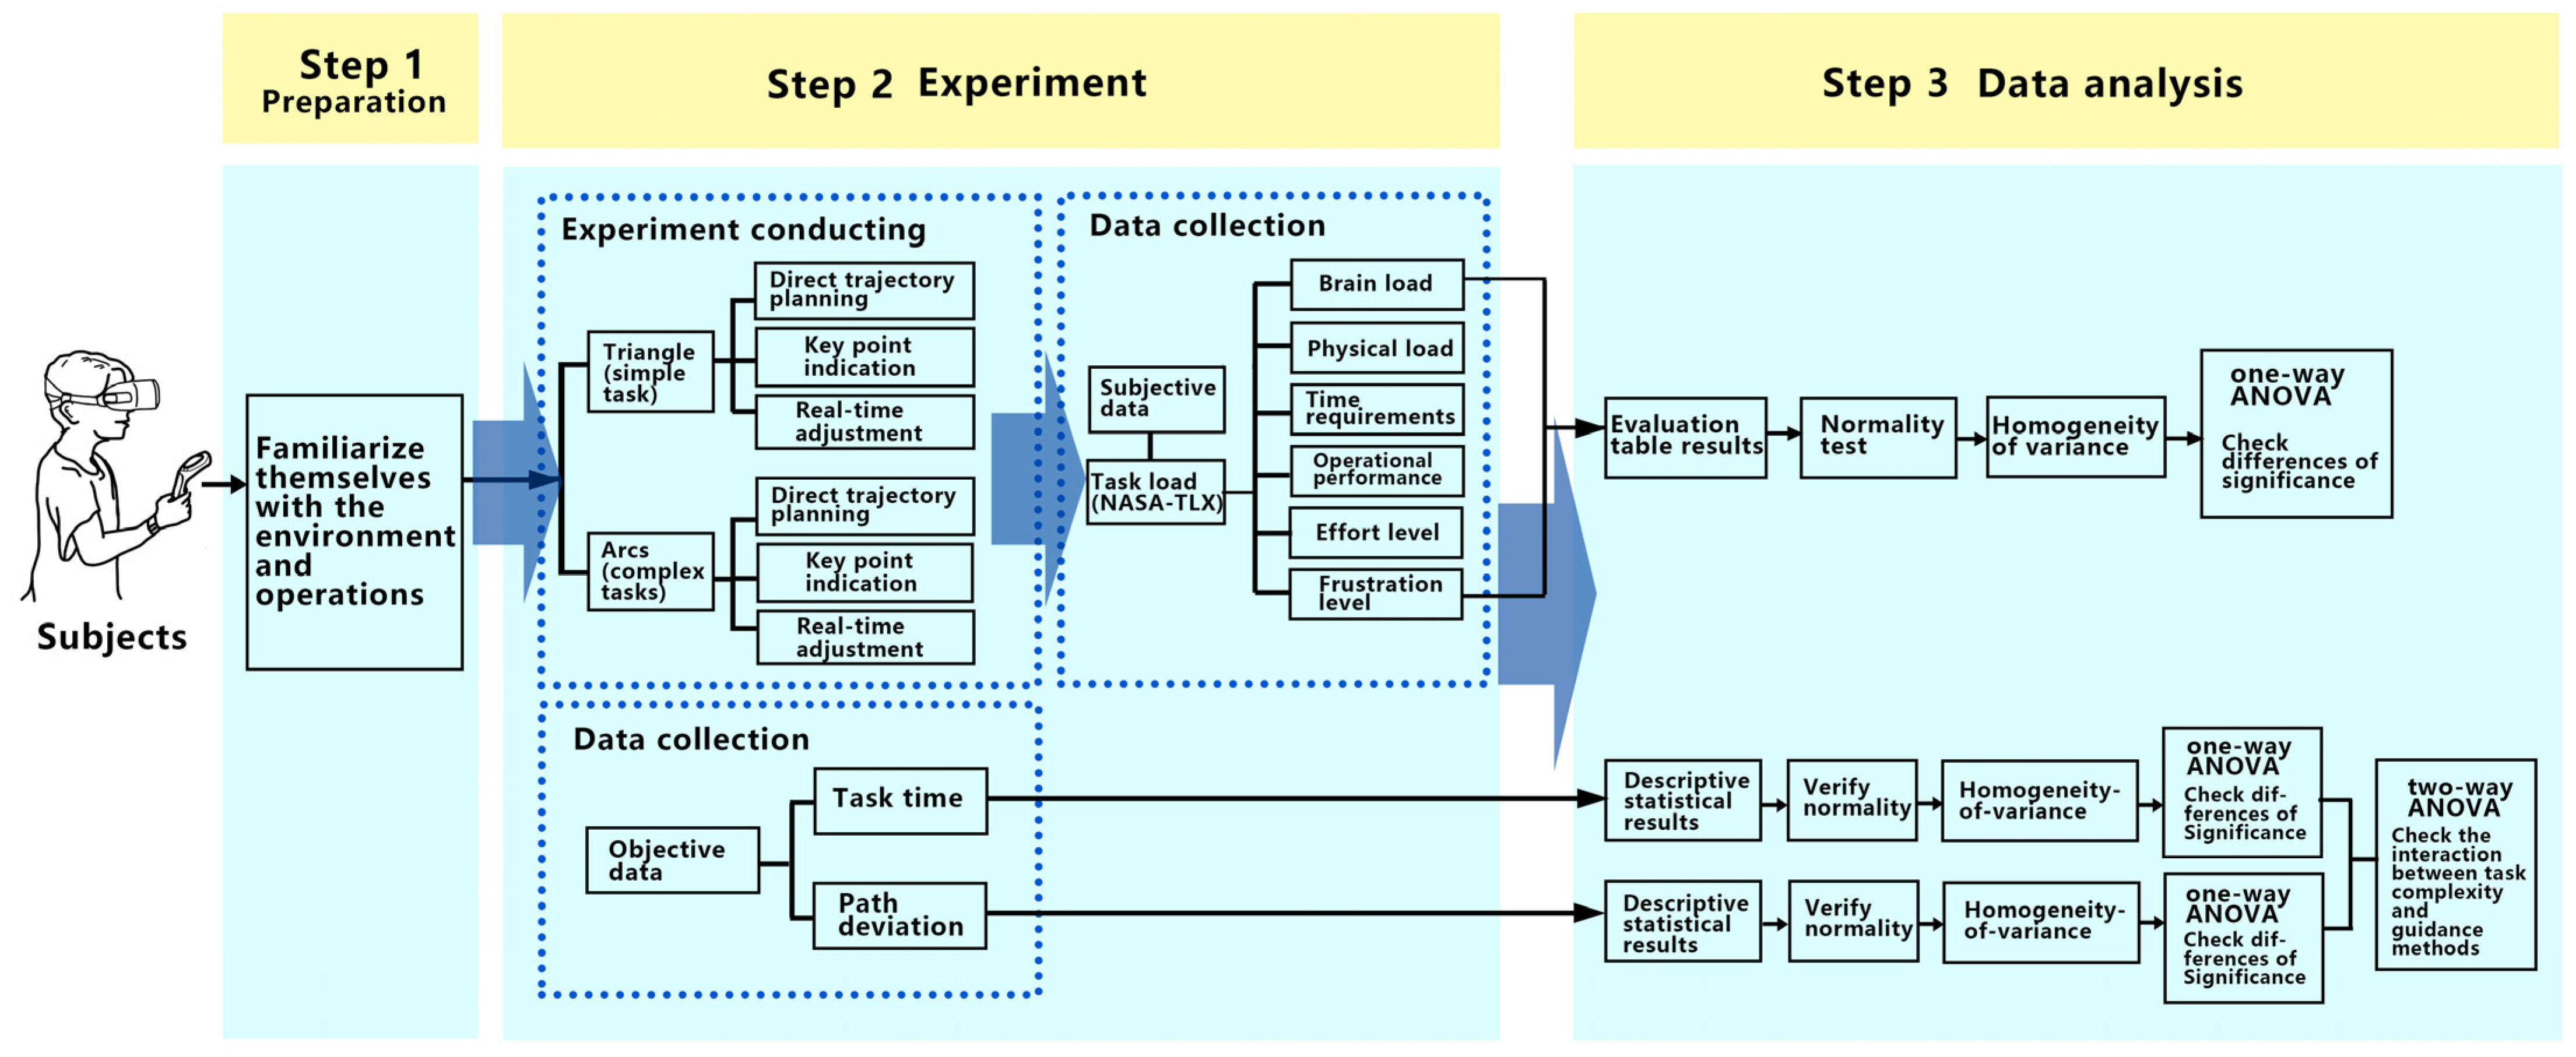
4.2.2. Experimental Process
4.2.3. Experimental Implementation
- Experimental Participants
- 2.
- Experimental Environment
- 3.
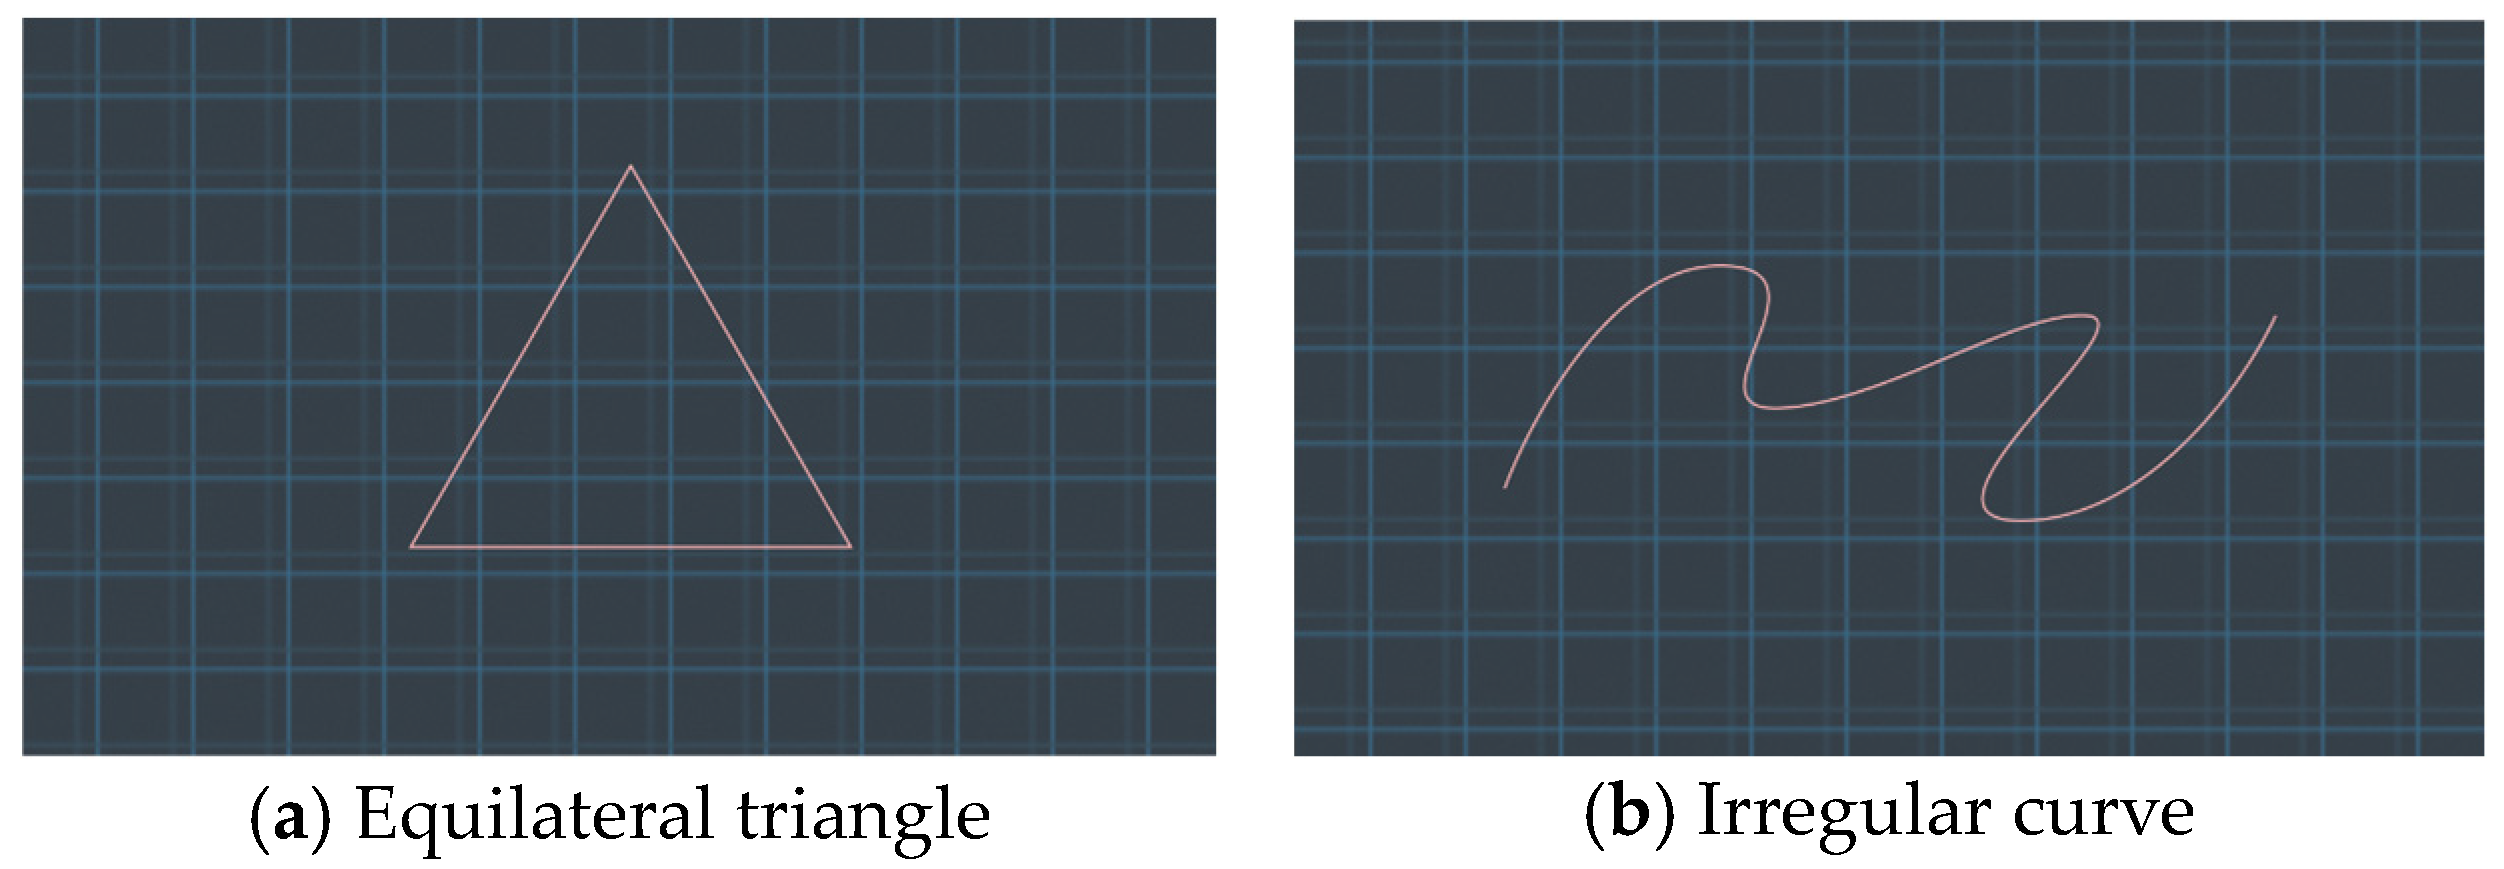
- Task Settings
- 4.
- Task Execution
4.3. Data Analysis
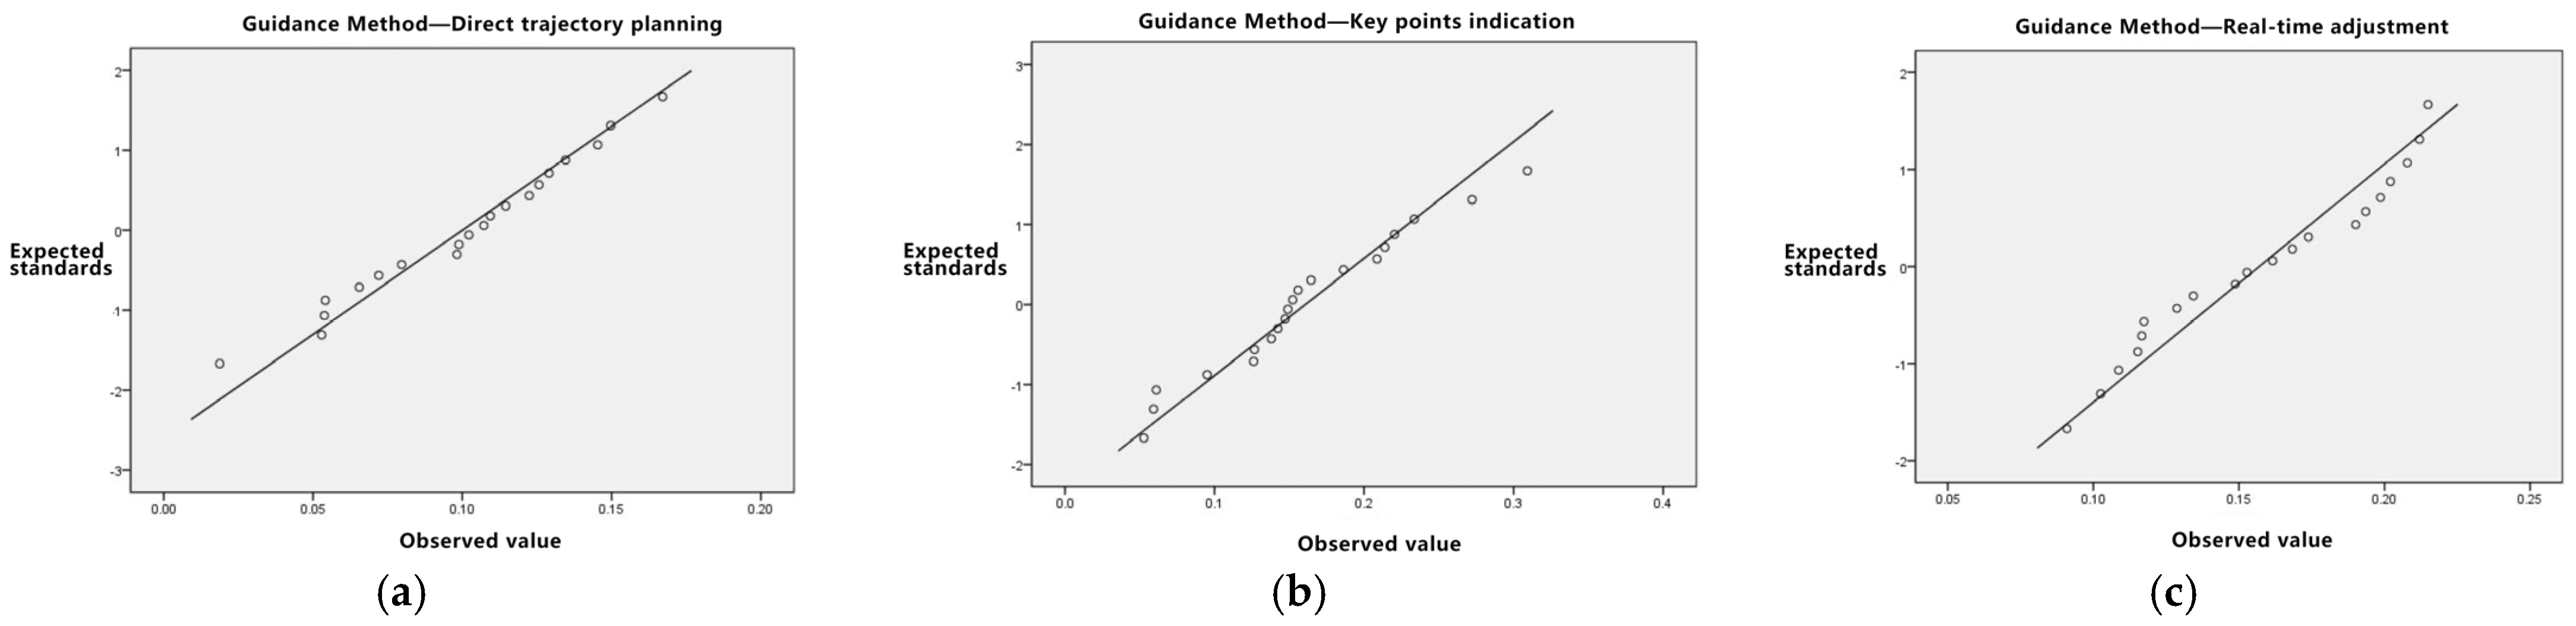
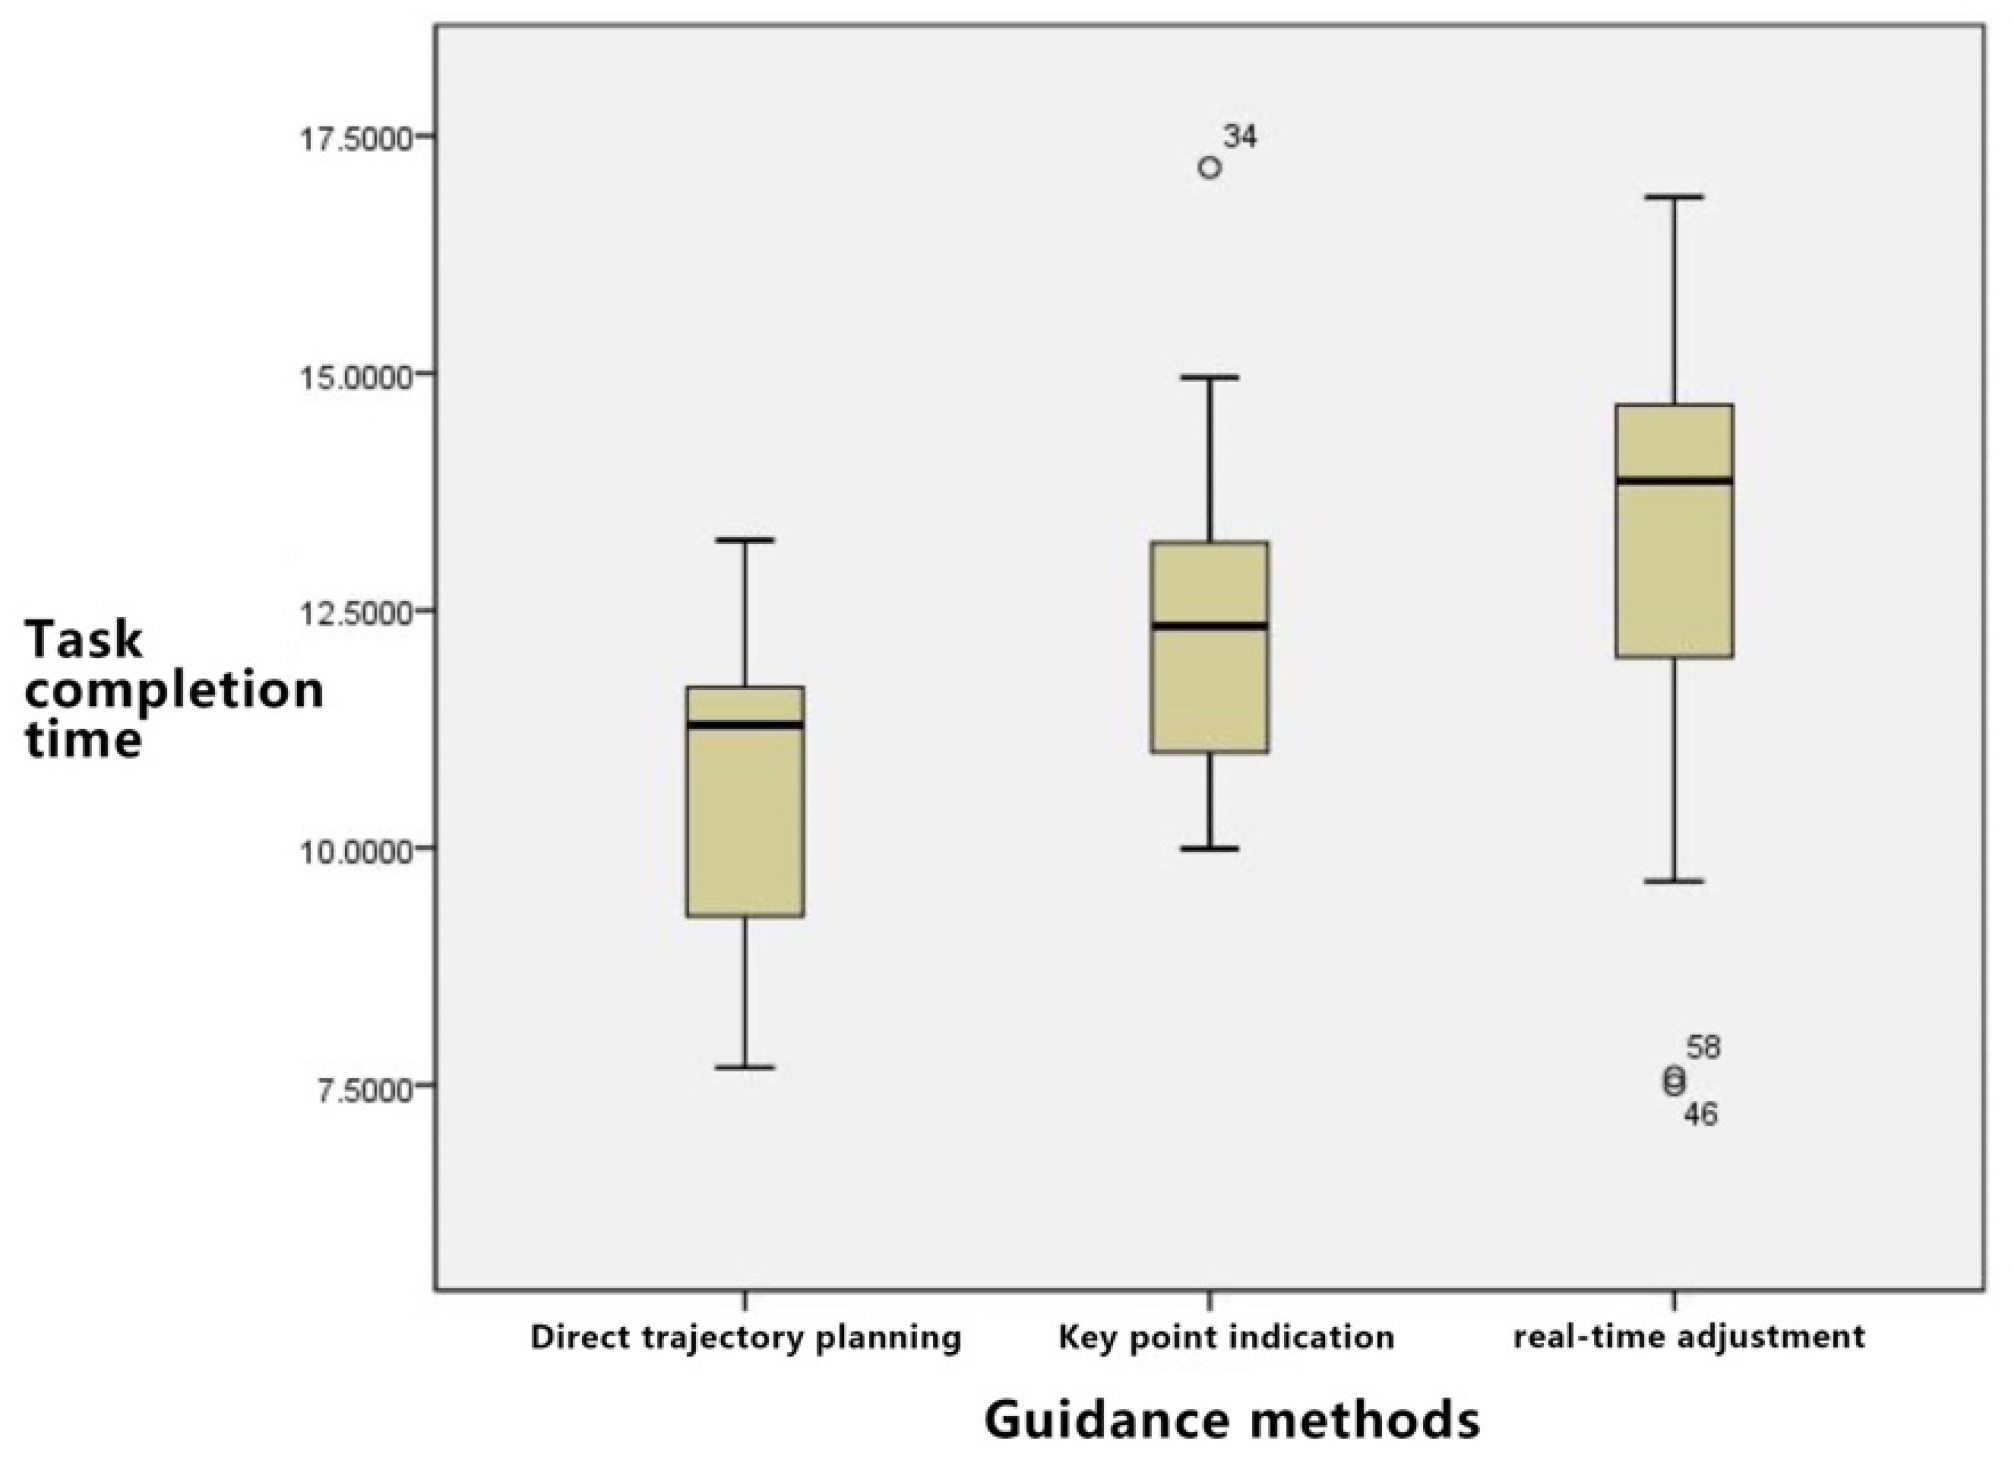
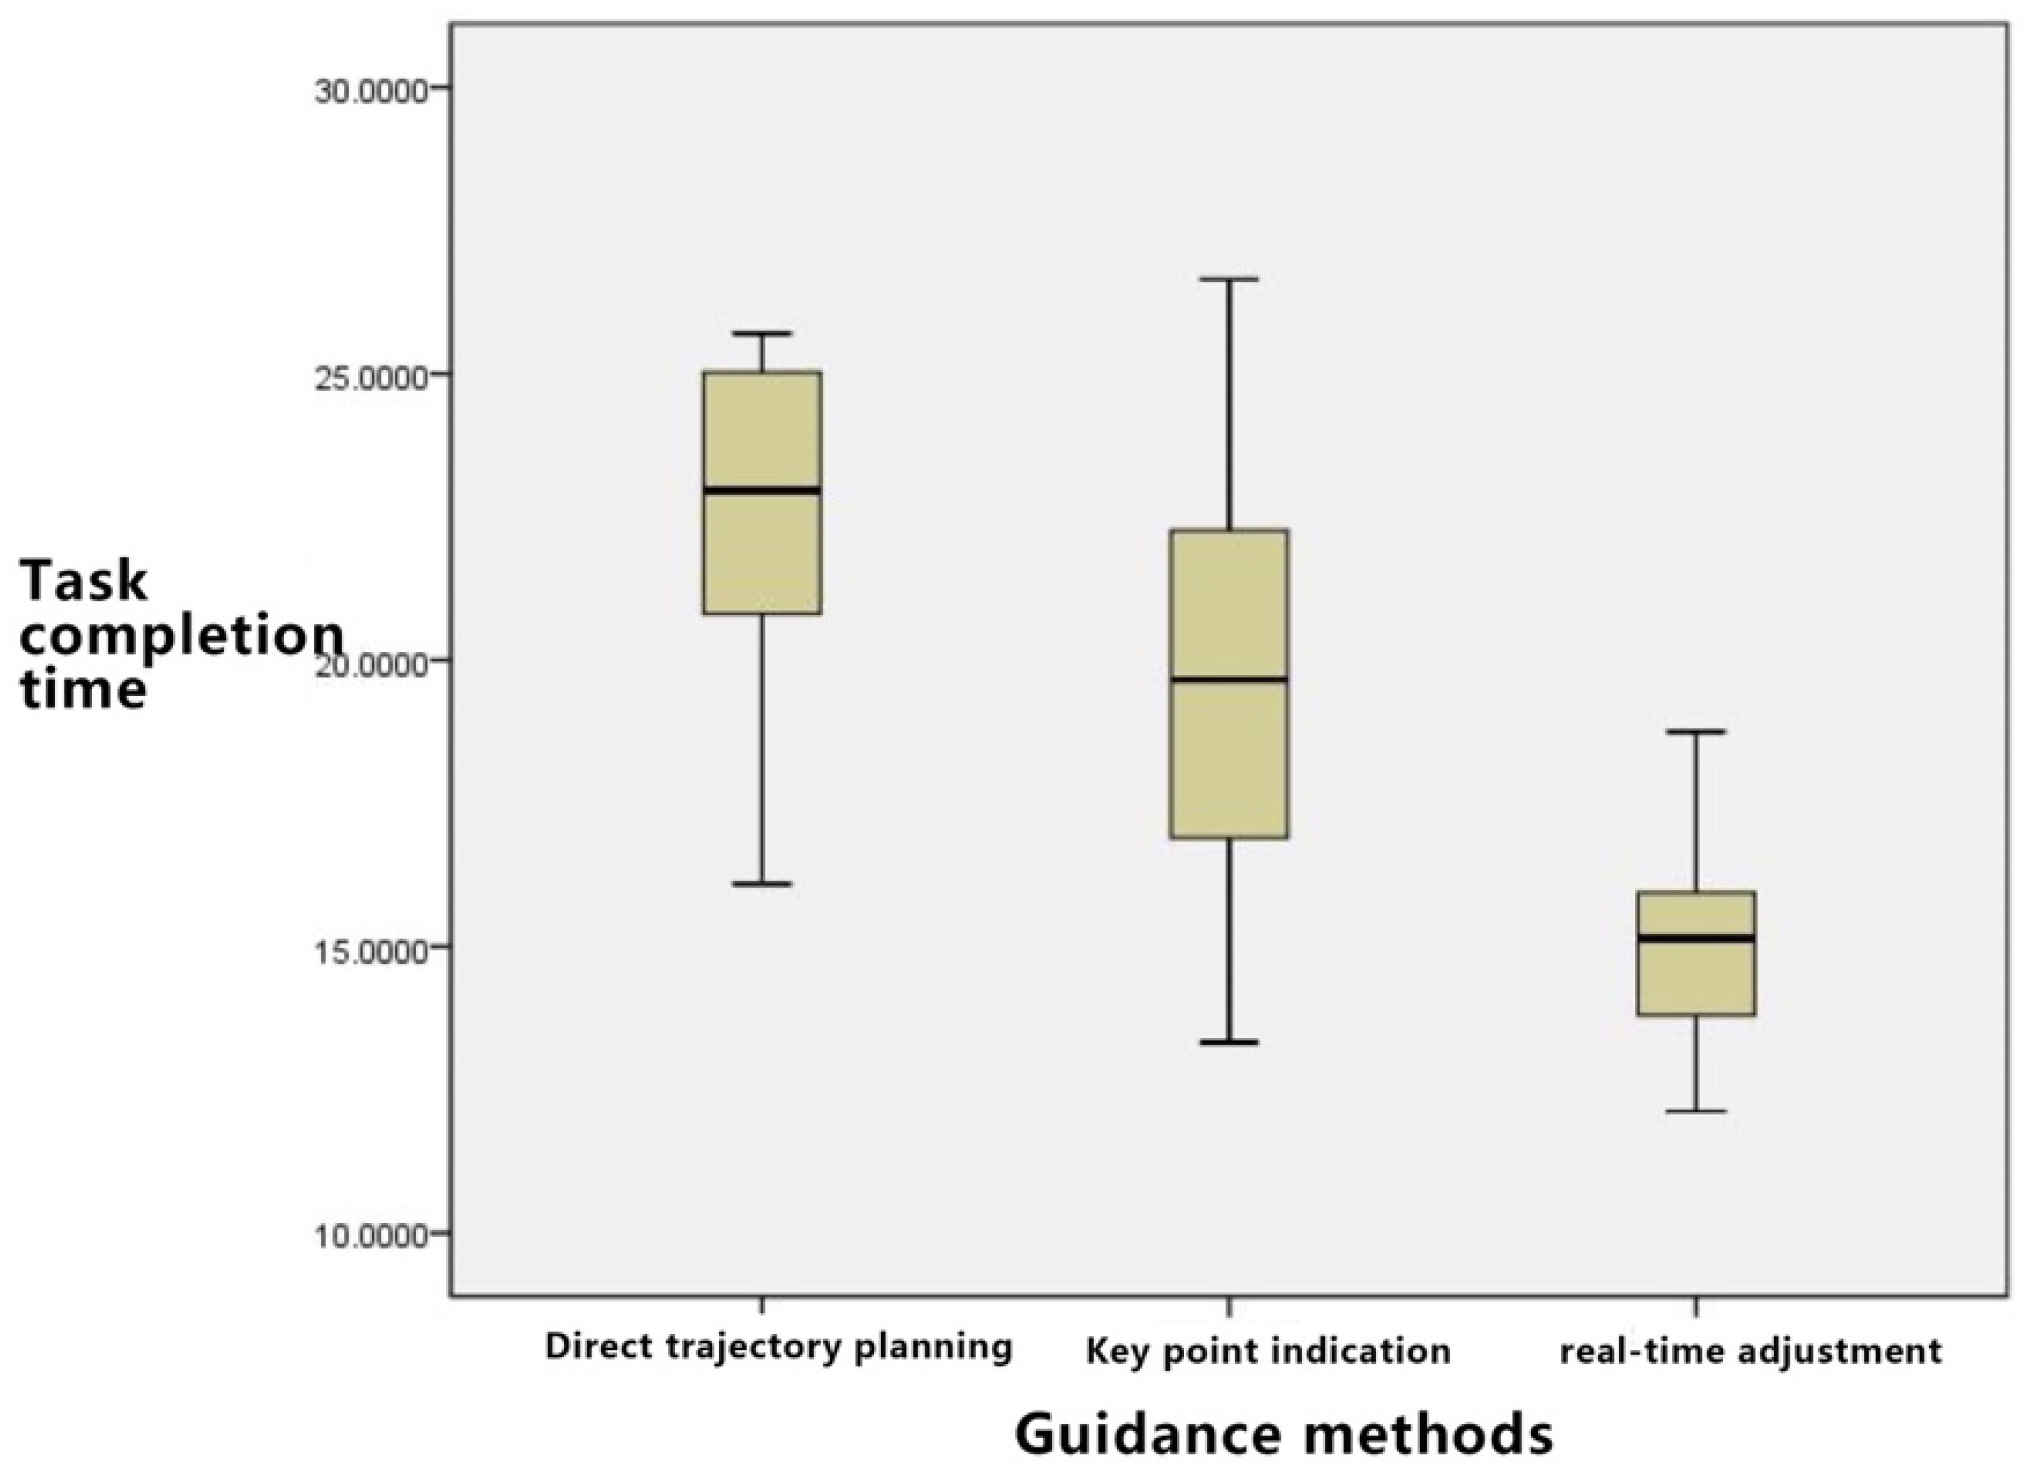
4.3.1. Objective Data
- Task Duration
- 2.
- Path Deviation
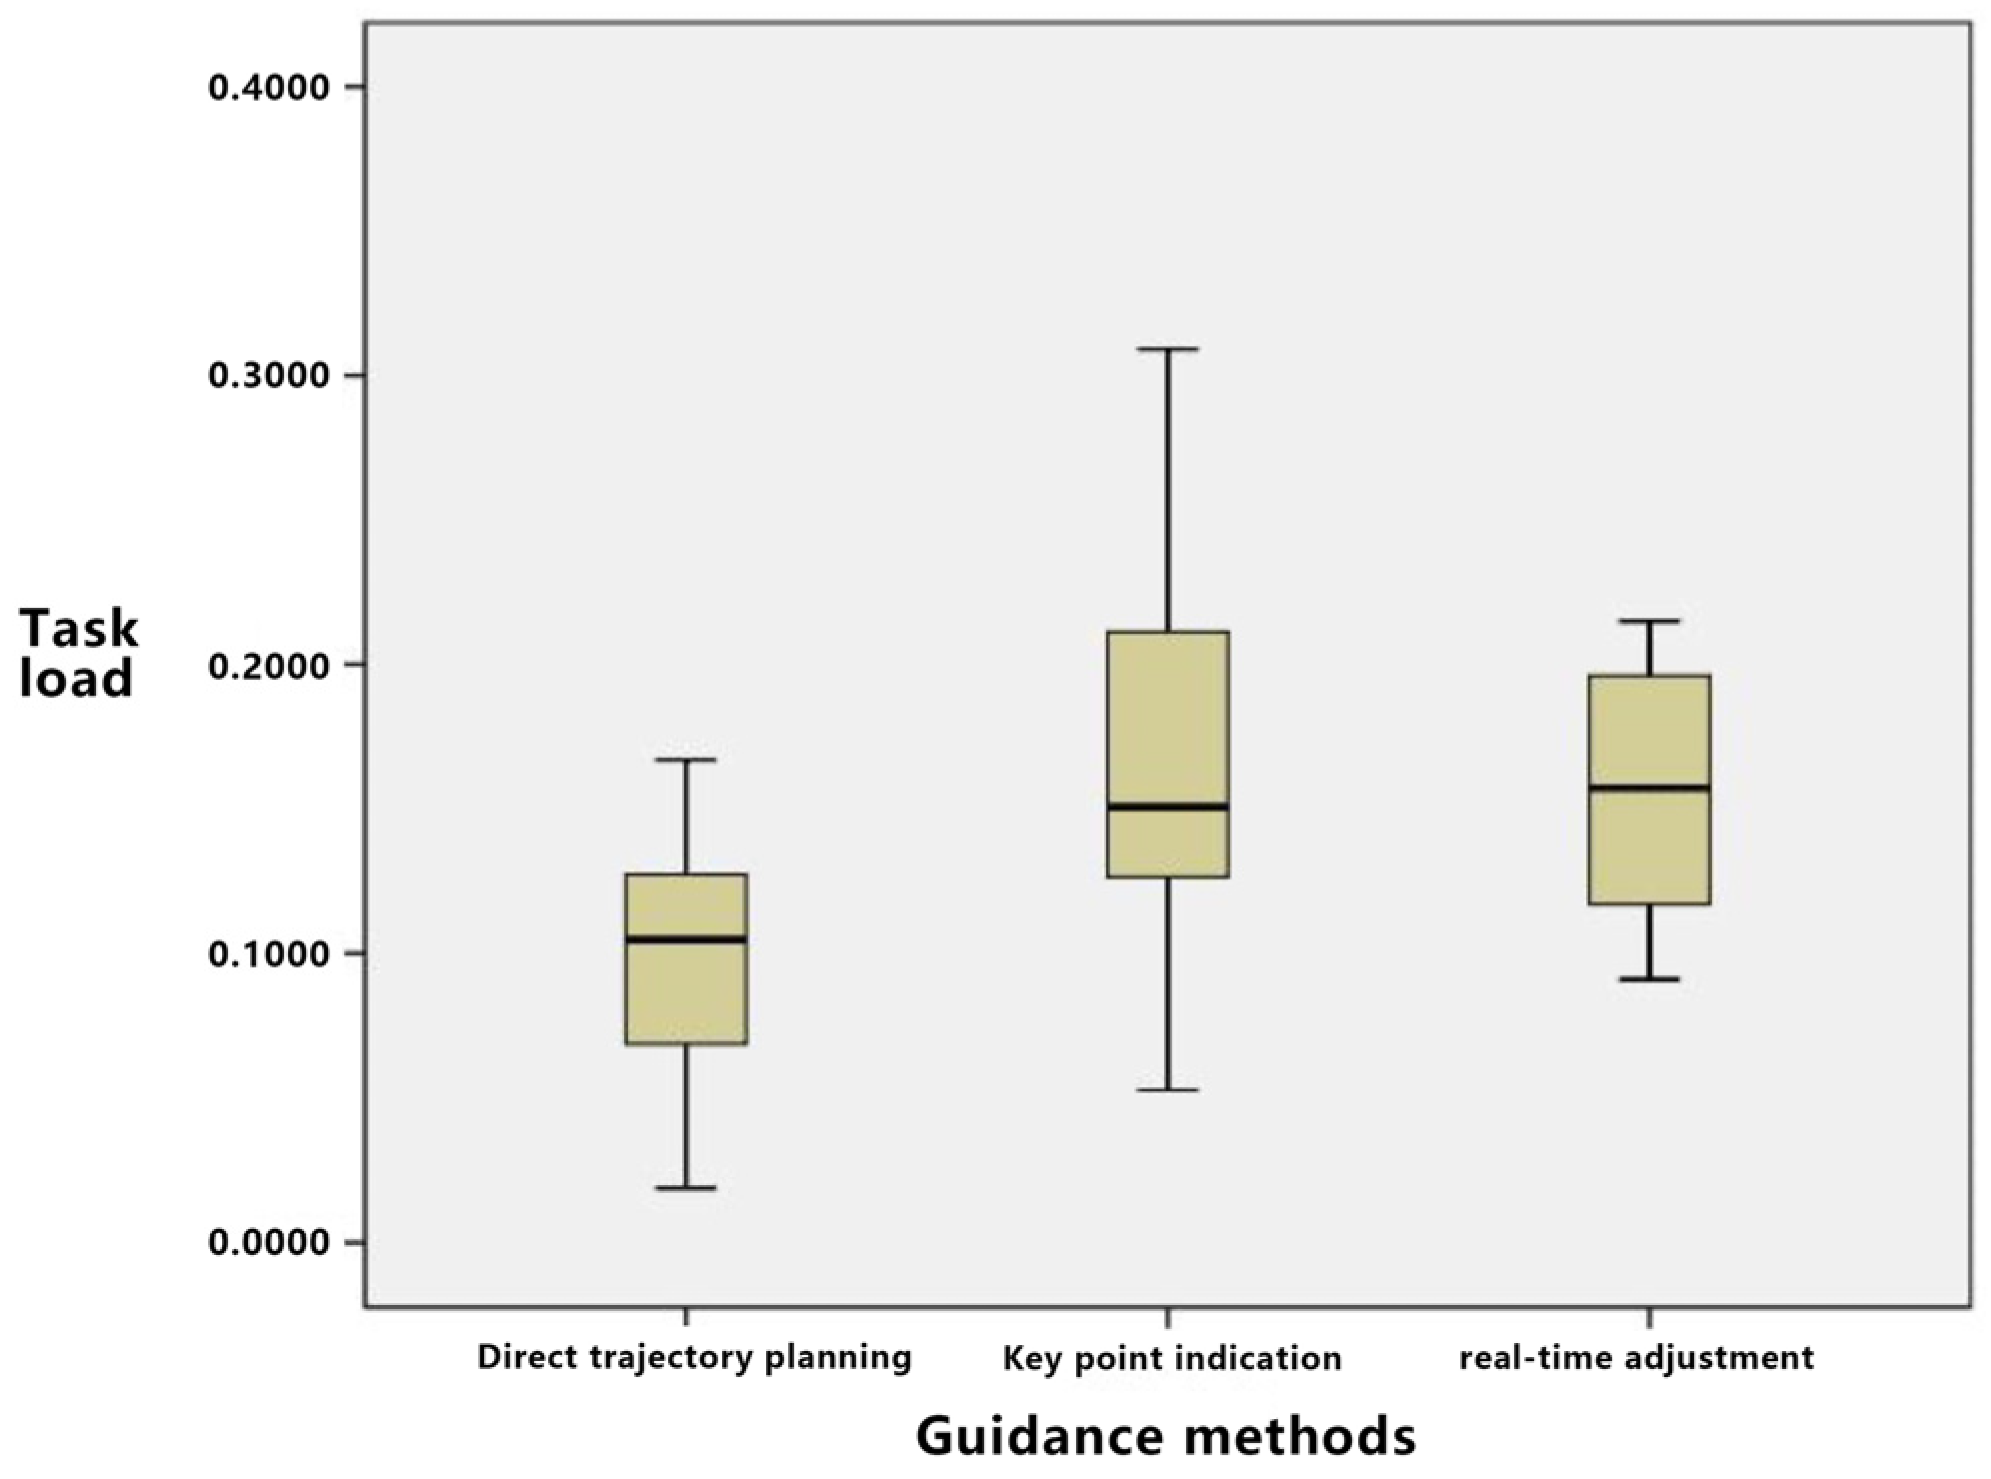
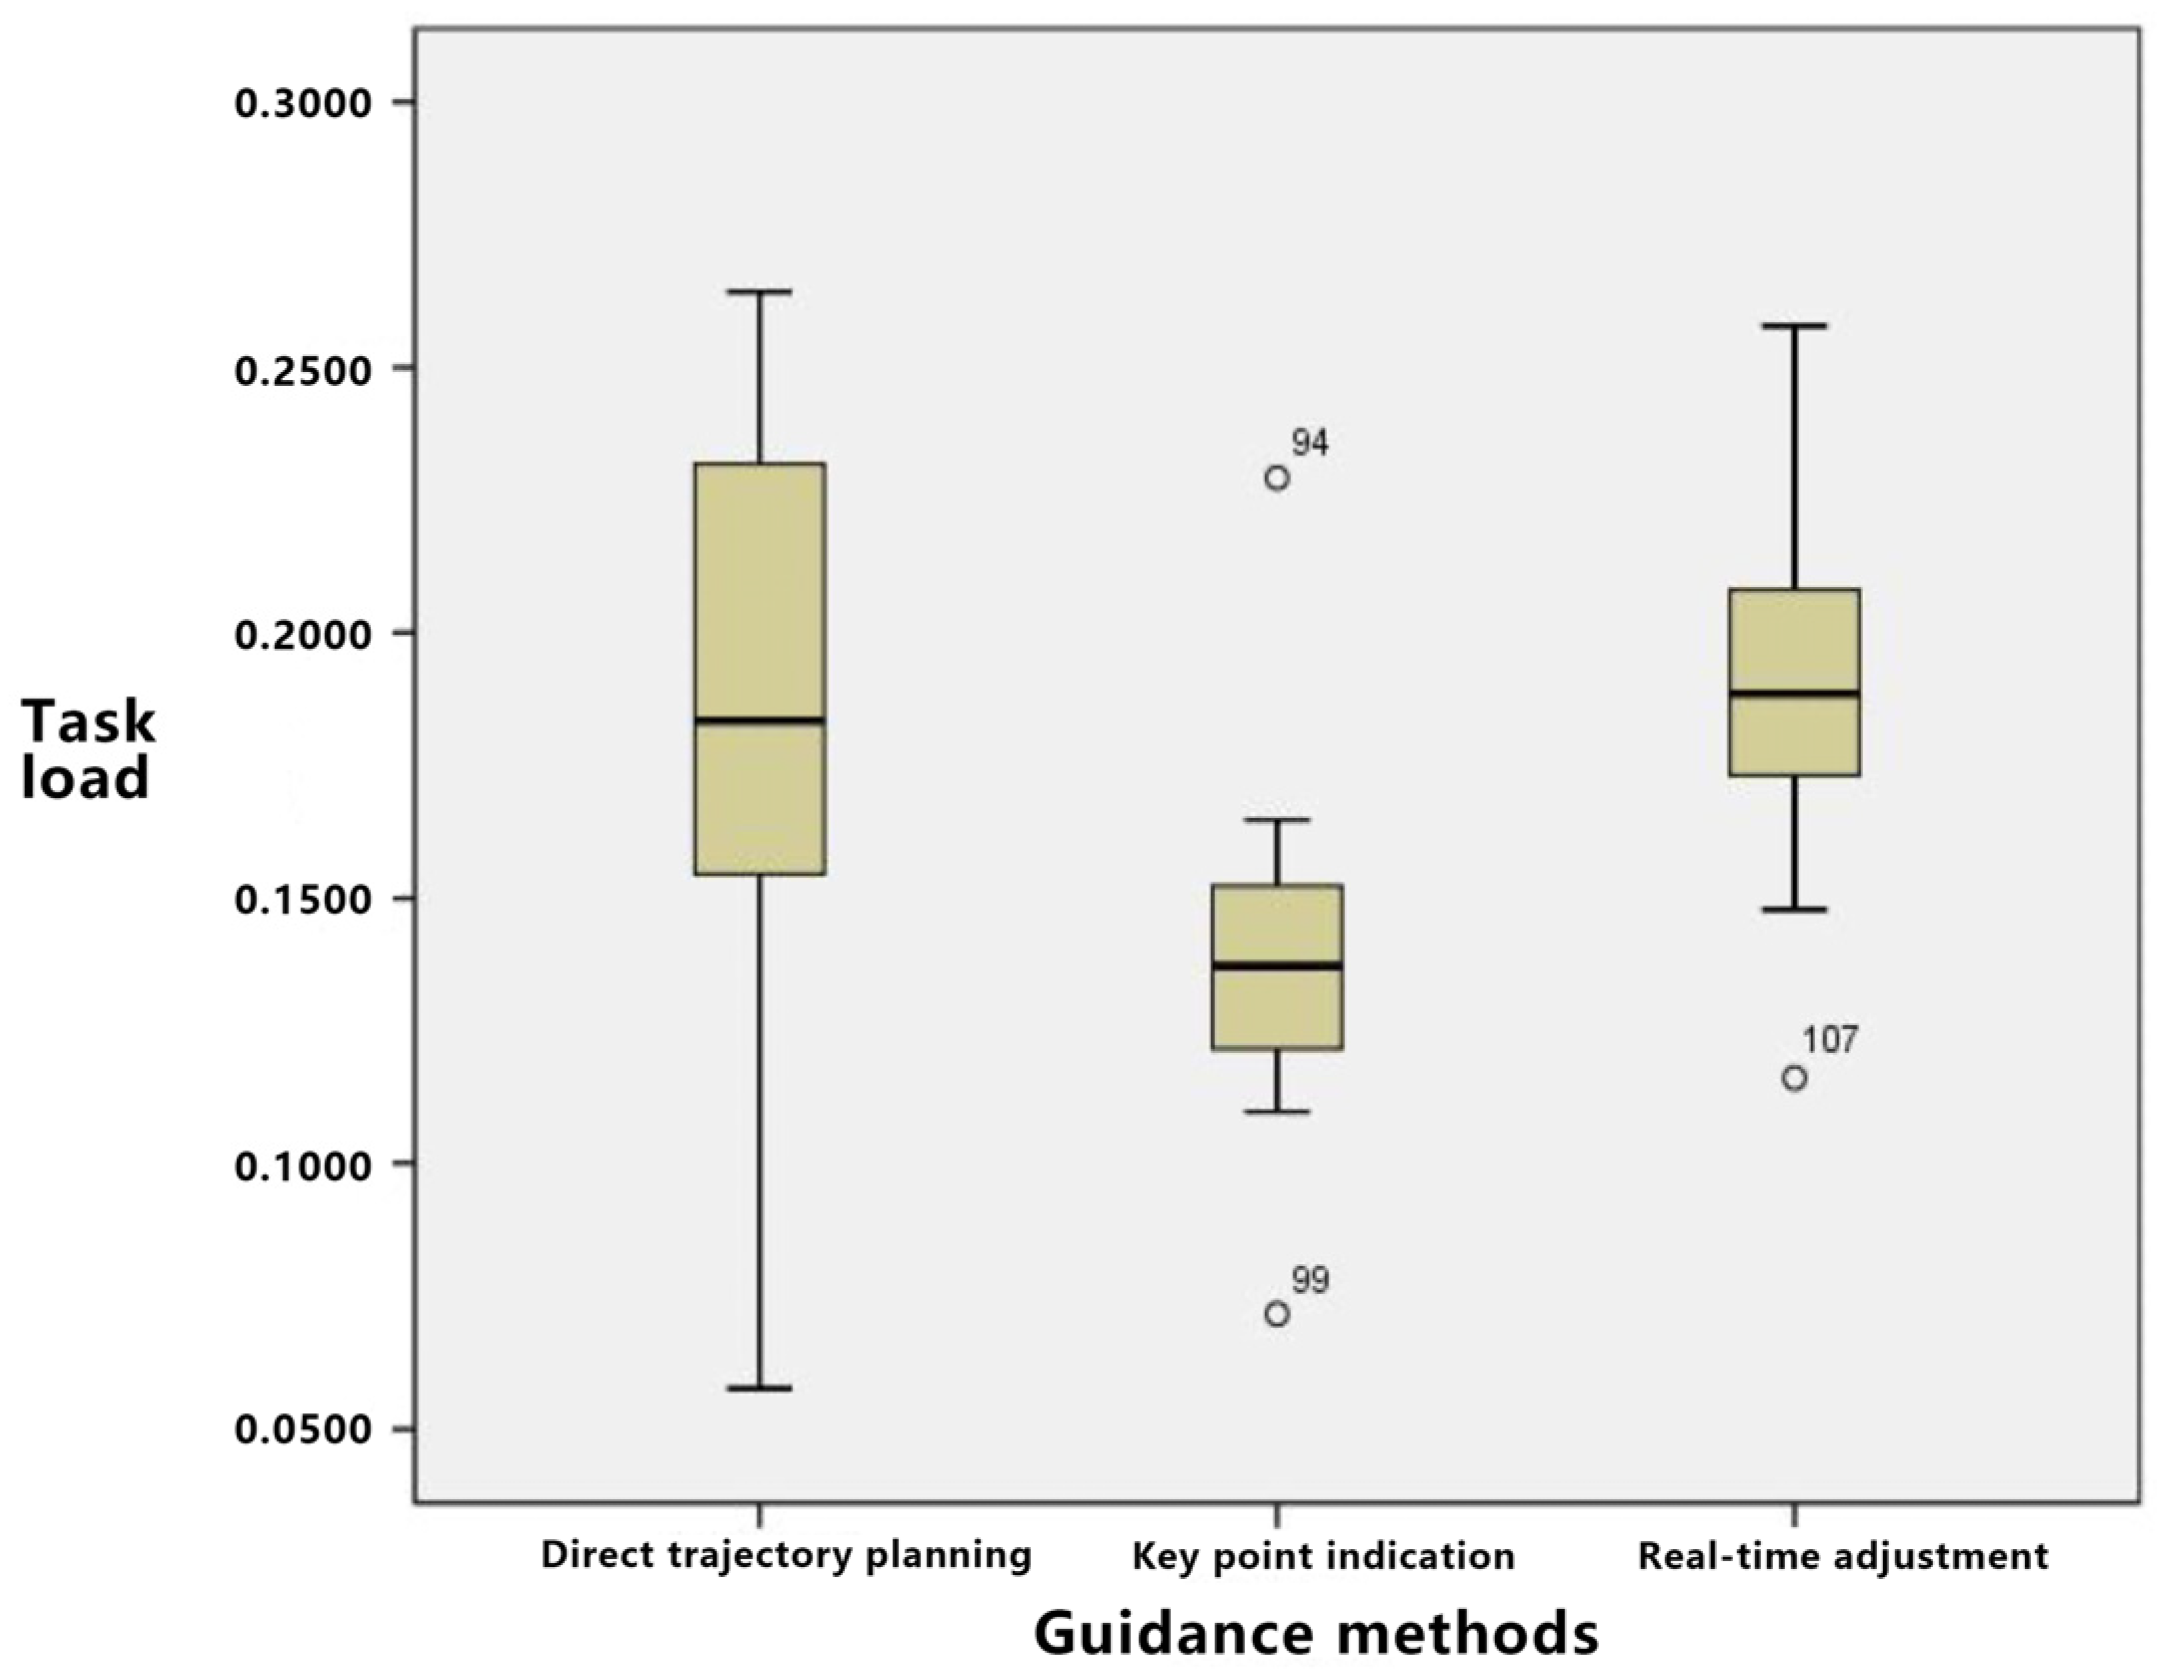
4.3.2. Subjective Data
4.4. Experimental Summary
5. Conclusions and Outlook
Author Contributions
Funding
Institutional Review Board Statement
Informed Consent Statement
Data Availability Statement
Acknowledgments
Conflicts of Interest
Appendix A

| I Really Like It | It Should Be | Indifferent | Settle for | I Really Do not Like It | |
|---|---|---|---|---|---|
| If the product has interactive interface representations for different tasks | ○ | ○ | ○ | ○ | ○ |
| If the product does not have interactive interface representations for different tasks | ○ | ○ | ○ | ○ | ○ |
| If the product has a reasonable interface layout | ○ | ○ | ○ | ○ | ○ |
| If the product does not have a reasonable interface layout | ○ | ○ | ○ | ○ | ○ |
| If the product has a robotic arm interactive guidance method | ○ | ○ | ○ | ○ | ○ |
| If the product does not have a robotic arm interactive guidance method | ○ | ○ | ○ | ○ | ○ |
| If the product has a reasonable form of robotic arm interaction feedback | ○ | ○ | ○ | ○ | ○ |
| If the product does not have a reasonable form of robotic arm interaction feedback | ○ | ○ | ○ | ○ | ○ |
| If the product has good interactive navigation | ○ | ○ | ○ | ○ | ○ |
| If the product does not have good interactive navigation | ○ | ○ | ○ | ○ | ○ |
| If the product has a good sensory experience | ○ | ○ | ○ | ○ | ○ |
| If the product does not have a good sensory experience | ○ | ○ | ○ | ○ | ○ |
| If the product has a visual presentation of information | ○ | ○ | ○ | ○ | ○ |
| If the product does not have a visual presentation of information | ○ | ○ | ○ | ○ | ○ |
| If the product has a reasonable information architecture | ○ | ○ | ○ | ○ | ○ |
| If the product does not have a reasonable information architecture | ○ | ○ | ○ | ○ | ○ |
| If the product has cognitive information management capabilities | ○ | ○ | ○ | ○ | ○ |
| If the product does not have cognitive information management functions | ○ | ○ | ○ | ○ | ○ |
Appendix B
| Levin Statistic | Number of Samples | Number of Variables | Significance | ||
|---|---|---|---|---|---|
| Path deviation | Based on mean | 2.942 | 2 | 57 | 0.061 |
| Based on median | 2.352 | 2 | 57 | 0.104 | |
| Based on median and adjusted degrees of freedom | 2.352 | 2 | 35.233 | 0.110 | |
| Based on trimmed mean | 2.764 | 2 | 57 | 0.071 | |
References
- Liu, Z.; Chen, W.; Yang, C.; Cheng, Q.; Zhao, Y. Intelligent manufacturing workshop dispatching cloud platform based on digital twins. Comput. Integr. Manuf. Syst. 2019, 6, 1444–1453. [Google Scholar]
- Maniscalco, U.; Storniolo, P.; Messina, A. Bidirectional Multi-modal Signs of Checking Human-Robot Engagement and Interaction. Int. J. Soc. Robot. 2022, 14, 1295–1309. [Google Scholar] [CrossRef]
- Feng, Z.; Xie, J.; Yan, Z.; Mei, Z.; Zheng, Z.; Li, T. An information processing method of software and hardware coupling for VR monitoring of hydraulic support groups. Multimed. Tools Appl. 2023, 82, 19067–19089. [Google Scholar] [CrossRef]
- Garg, G.; Kuts, V.; Anbarjafari, G. Digital Twin for FANUC Robots: Industrial Robot Programming and Simulation Using Virtual Reality. Sustainability 2021, 13, 10336. [Google Scholar] [CrossRef]
- Shamsuzzoha, A.; Toshev, R.; Vu Tuan, V.; Kankaanpaa, T. Digital factory–virtual reality environments for industrial training and maintenance. Interact. Learn. Environ. 2021, 29, 1339–1362. [Google Scholar] [CrossRef]
- Matulis, M.; Harvey, C. A robot arm digital twin utilising reinforcement learning. Comput. Graph. 2021, 95, 106–114. [Google Scholar] [CrossRef]
- Moi, T.; Cibicik, A.; Rølvåg, T. Digital twin based condition monitoring of a knuckle boom crane: An experimental study. Eng. Fail. Anal. 2020, 112, 104517. [Google Scholar] [CrossRef]
- Ardanza, A.; Moreno, A.; Segura, Á.; de la Cruz, M.; Aguinaga, D. Sustainable and flexible industrial human machine interfaces to support adaptable applications in the Industry 4.0 paradigm. Int. J. Prod. Res. 2019, 57, 4045–4059. [Google Scholar] [CrossRef]
- Cai, Y.; Wang, Y.; Burnett, M. Using augmented reality to build digital twin for reconfigurable additive manufacturing system. J. Manuf. Syst. 2020, 56, 598–604. [Google Scholar] [CrossRef]
- Zong, X. Design and Implementation of Workshop Job Simulation and Monitoring Based on Digital Twin. Master’s Thesis, Shenyang Institute of Computing Technology Chinese Academy of Sciences, Shenyang, China, 2021. [Google Scholar]
- Xiong, P.; Liao, J.; Zhou, M.; Song, A.; Liu, P. Deeply Supervised Subspace Learning for Cross-Modal Material Perception of Known and Unknown Objects. IEEE Trans. Ind. Inf. 2023, 19, 2259–2268. [Google Scholar] [CrossRef]
- Xiong, P.; Tong, X.; Liu, P.; Song, A.; Li, Z. Robotic Object Perception based on Multispectral Few-Shot Coupled Learning. IEEE Trans. Syst. Man Cybern. Syst. 2023. early access. [Google Scholar] [CrossRef]
- Xiong, P.; He, K.; Song, A.; Liu, P. Robotic haptic adjective perception based on coupled sparse coding. Sci. China Inf. Sci. 2023, 66, 129201. [Google Scholar] [CrossRef]
- Yigitbas, E.; Karakaya, K.; Jovanovikj, I.; Engels, G. Enhancing human-in-the-loop adaptive systems through digital twins and VR interfaces. In Proceedings of the 2021 International Symposium on Software Engineering for Adaptive and Self-Managing Systems (SEAMS), Madrid, Spain, 18–24 May 2021; pp. 30–40. [Google Scholar] [CrossRef]
- Lykke, J.R.; Olsen, A.B.; Berman, P.; Bærentzen, J.A.; Frisvad, J.R. Accounting for object weight in interaction design for virtual reality. J. WSCG 2019, 27, 131–140. [Google Scholar] [CrossRef]
- Kim, M.; Lee, J.; Jeon, C.; Kim, J. A study on interaction of gaze pointer-based user interface in mobile virtual reality environment. Symmetry 2017, 9, 189. [Google Scholar] [CrossRef]
- Bektaş, K.; Thrash, T.; van Raai, M.A.; Künzler, P.; Hahnloser, R. The systematic evaluation of an embodied control interface for virtual reality. PLoS ONE 2021, 16, e0259977. [Google Scholar] [CrossRef] [PubMed]
- Voigt-Antons, J.N.; Kojic, T.; Ali, D.; Möller, S. Influence of hand tracking as a way of interaction in virtual reality on user experience. In Proceedings of the 2020 Twelfth International Conference on Quality of Multimedia Experience (QoMEX), Athlone, Ireland, 26–28 May 2020; pp. 1–4. [Google Scholar] [CrossRef]
- Zhang, Z.; Huang, S.; Mao, X. A Definable Architecture Design Method of Command and Control Information System. In Proceedings of the 2021 33rd Chinese Control and Decision Conference (CCDC), Kunming, China, 22–24 May 2021; pp. 4475–4480. [Google Scholar] [CrossRef]
- Paraschivescu, A.O.; Cotîrleţ, A. Kano Model. Econ. Trans. Cognit. 2012, 15, 116–120. [Google Scholar]


| Numbers | Interaction Demands |
|---|---|
| 1 | Task-specific interaction interface presentation |
| 2 | Logical interface layout |
| 3 | Robotic arm interactive guidance method |
| 4 | Reasonable interaction feedback forms |
| 5 | Effective interactive navigation |
| 6 | Optimal sensory experience |
| 7 | Visual presentation of information |
| 8 | Structured information architecture |
| 9 | Cognitive information management functions |
| Demand Characteristic | Negative (If the Product Does not Meet the Required Characteristics, Your Evaluation Is) | |||||
|---|---|---|---|---|---|---|
| Scale | I really like it | It should be | Indifferent | Settle for | I really do not like it | |
| Positive (if the product has the required characteristics, your evaluation is) | I really like it | Q | A | A | A | O |
| It should be | R | I | I | I | M | |
| Indifferent | R | I | I | I | M | |
| Settle for | R | I | I | I | M | |
| I really don’t like it | R | R | R | R | Q | |
| Demands Characteristic | A (Attractive Quality) | O (One-Dimensional Quality) | M (Must-be Quality) | I (Indifferent Quality) | R (Reverse Quality) | Q (Questionable Quality) | The Attributes KANO Leans towards | Better Value | Worse Value |
|---|---|---|---|---|---|---|---|---|---|
| 1 | 0.36 | 0.21 | 0.27 | 0.08 | 0.05 | 0.03 | A | 0.61 | −0.21 |
| 2 | 0.23 | 0.46 | 0.13 | 0.09 | 0.04 | 0.05 | O | 0.75 | −0.73 |
| 3 | 0.12 | 0.30 | 0.48 | 0.10 | 0.00 | 0.00 | M | 0.42 | −0.65 |
| 4 | 0.13 | 0.24 | 0.36 | 0.18 | 0.05 | 0.04 | M | 0.41 | −0.56 |
| 5 | 0.48 | 0.21 | 0.15 | 0.09 | 0.03 | 0.04 | A | 0.73 | −0.22 |
| 6 | 0.38 | 0.16 | 0.20 | 0.18 | 0.04 | 0.04 | A | 0.57 | −0.37 |
| 7 | 0.09 | 0.54 | 0.27 | 0.10 | 0.00 | 0.00 | O | 0.63 | −0.71 |
| 8 | 0.12 | 0.52 | 0.20 | 0.09 | 0.03 | 0.04 | O | 0.68 | −0.61 |
| 9 | 0.05 | 0.23 | 0.50 | 0.13 | 0.04 | 0.05 | M | 0.32 | −0.75 |
| Mean Value | Standard Deviation | Standard Error | 95% Confidence Interval of the Mean | ||
|---|---|---|---|---|---|
| Lower Limit | Upper Limit | ||||
| Direct trajectory planning | 10.6387 | 1.9472 | 0.4359 | 9.7838 | 11.4936 |
| Key point indication | 11.8392 | 2.0459 | 0.4575 | 10.8946 | 12.7839 |
| Real-time adjustment | 13.1504 | 2.6433 | 0.5906 | 12.2065 | 14.0944 |
| Guidance Method | Kolmogorov–Smirnov Test | Shapiro–Wilk Test | |||||
|---|---|---|---|---|---|---|---|
| Statistics | Degree of freedom | Significance | Statistics | Degree of freedom | Significance | ||
| Task completion time | Direct trajectory planning | 0.218 | 20 | 0.014 | 0.920 | 20 | 0.100 |
| Key point indication | 0.139 | 20 | 0.200 * 1 | 0.938 | 20 | 0.219 | |
| Real-time adjustment | 0.218 | 20 | 0.014 | 0.903 | 20 | 0.048 | |
| Levin Statistic | Number of Samples | Number of Variables | Significance | ||
|---|---|---|---|---|---|
| Task completion time | Based on mean | 2.130 | 2 | 57 | 0.128 |
| Based on median | 0.975 | 2 | 57 | 0.383 | |
| Based on median and adjusted degrees of freedom | 0.975 | 2 | 42.142 | 0.385 | |
| Based on trimmed mean | 1.881 | 2 | 57 | 0.162 | |
| Source | Sum of Squares of Type III | Degree of Freedom | Mean Square | F | Significance |
|---|---|---|---|---|---|
| Calibration model | 73.414a | 2 | 36.707 | 8.319 | 0.001 |
| Intercept | 8769.751 | 1 | 8769.751 | 1987.587 | 0.000 |
| Guidance method | 73.414 | 2 | 36.707 | 8.319 | 0.001 |
| Error | 251.499 | 57 | 4.412 | ||
| Total | 9094.664 | 60 | |||
| Corrected total | 324.913 | 59 |
| Mean Value | Standard Deviation | Standard Error | 95% Confidence Interval of the Mean | ||
|---|---|---|---|---|---|
| Lower Limit | Upper Limit | ||||
| Direct trajectory planning | 22.3892 | 2.5294 | 1.1298 | 19.8789 | 24.8995 |
| Key point indication | 19.5934 | 3.6923 | 1.6517 | 16.8202 | 22.3666 |
| Real-time adjustment | 15.8468 | 2.1381 | 0.4789 | 14.9613 | 16.7322 |
| Guidance Method | Kolmogorov–Smirnov Test | Shapiro–Wilk Test | |||||
|---|---|---|---|---|---|---|---|
| Statistics | Degree of freedom | Significance | Statistics | Degree of freedom | Significance | ||
| Task completion time | Direct trajectory planning | 0.173 | 20 | 0.118 | 0.904 | 20 | 0.048 |
| Key point indication | 0.084 | 20 | 0.200 * 1 | 0.981 | 20 | 0.951 | |
| Real-time adjustment | 0.105 | 20 | 0.200 * 2 | 0.967 | 20 | 0.701 | |
| Statistics | Number of Samples | Number of Variables | Significance | |
|---|---|---|---|---|
| Welch | 57.969 | 2 | 35.212 | 0.000 |
| Source | Sum of Squares of Type III | Degree of Freedom | Mean Square | F | Significance |
|---|---|---|---|---|---|
| Guidance method | 134.925 | 2 | 67.463 | 10.942 | 0.000 |
| Task complexity | 1468.185 | 1 | 1468.185 | 238.125 | 0.000 |
| Inter-subject effects | 521.963 | 2 | 260.981 | 42.329 | 0.000 |
| Mean Value | Standard Deviation | Standard Error | 95% Confidence Interval of the Mean | ||
|---|---|---|---|---|---|
| Lower Limit | Upper Limit | ||||
| Direct trajectory planning | 0.1083 | 0.0420 | 0.0094 | 0.0972 | 0.1193 |
| Key point indication | 0.1375 | 0.0594 | 0.0133 | 0.1247 | 0.1503 |
| Real-time adjustment | 0.1596 | 0.0469 | 0.0105 | 0.1461 | 0.1731 |
| Sum of Squares | Degree of Freedom | Mean Square | F | Significance | |
|---|---|---|---|---|---|
| Inter-group | 583.474 | 2 | 291.737 | 36.840 | 0.000 |
| Intra-group | 451.379 | 57 | 7.919 | ||
| Total number | 1034.853 | 59 |
| Mean Value | Standard Deviation | Standard Error | 95% Confidence Interval of the Mean | ||
|---|---|---|---|---|---|
| Lower Limit | Upper Limit | ||||
| Direct trajectory planning | 0.2005 | 0.0570 | 0.0128 | 0.1761 | 0.2249 |
| Key point indication | 0.1507 | 0.0389 | 0.0087 | 0.1297 | 0.1717 |
| Real-time adjustment | 0.1849 | 0.0367 | 0.0082 | 0.1614 | 0.2085 |
| Sum of Squares | Degree of Freedom | Mean Square | F | Significance | |
|---|---|---|---|---|---|
| Inter-group | 583.474 | 2 | 291.737 | 36.840 | 0.000 |
| Intra-group | 451.379 | 57 | 7.919 | ||
| Total number | 1034.853 | 59 |
| Source | Sum of Squares of Type III | Degree of Freedom | Mean Square | F | Significance |
|---|---|---|---|---|---|
| Guidance method | 0.019 | 2 | 0.009 | 4.405 | 0.014 |
| Task complexity | 0.030 | 1 | 0.030 | 14.248 | 0.000 |
| Inter-subject effects | 0.061 | 2 | 0.030 | 14.277 | 0.000 |
| Brain Power | Physical Strength | Time | Operational Performance | Effort | Frustration Level | Task Load | |
|---|---|---|---|---|---|---|---|
| Guidance method | 38.35 | 32.80 | 42.65 | 40.25 | 42.45 | 45.15 | 40.2750 |
| Task complexity | 26.15 | 31.10 | 35.60 | 31.45 | 37.20 | 28.75 | 31.7083 |
| Guidance method Task complexity | 32.50 | 31.75 | 40.30 | 39.70 | 48.50 | 50.60 | 40.5583 |
| Guidance Method | Kolmogorov–Smirnov Test | Shapiro–Wilk Test | |||||
|---|---|---|---|---|---|---|---|
| Statistics | Degree of freedom | Significance | Statistics | Degree of freedom | Significance | ||
| Task load | Direct trajectory planning | 0.092 | 20 | 0.200 * 1 | 0.977 | 20 | 0.889 |
| Key point indication | 0.153 | 20 | 0.200 * 2 | 0.959 | 20 | 0.525 | |
| Real time adjustment | 0.249 | 20 | 0.002 | 0.846 | 20 | 0.005 | |
| Levin Statistic | Number of Samples | Number of Variables | Significance | ||
|---|---|---|---|---|---|
| Task load | Based on mean | 0.720 | 2 | 57 | 0.491 |
| Based on median | 0.335 | 2 | 57 | 0.716 | |
| Based on median and adjusted degrees of freedom | 0.335 | 2 | 47.772 | 0.717 | |
| Based on trimmed mean | 0.698 | 2 | 57 | 0.502 | |
| Sum of Squares | Degree of Freedom | Mean Square | F | Significance | |
|---|---|---|---|---|---|
| Inter-group | 743.464 | 2 | 371.732 | 122.020 | 0.000 |
| Intra-group | 173.650 | 57 | 3.046 | ||
| Total number | 917.114 | 59 |
Disclaimer/Publisher’s Note: The statements, opinions and data contained in all publications are solely those of the individual author(s) and contributor(s) and not of MDPI and/or the editor(s). MDPI and/or the editor(s) disclaim responsibility for any injury to people or property resulting from any ideas, methods, instructions or products referred to in the content. |
© 2023 by the authors. Licensee MDPI, Basel, Switzerland. This article is an open access article distributed under the terms and conditions of the Creative Commons Attribution (CC BY) license (https://creativecommons.org/licenses/by/4.0/).
Share and Cite
Wu, W.; Li, M.; Hu, J.; Zhu, S.; Xue, C. Research on Guidance Methods of Digital Twin Robotic Arms Based on User Interaction Experience Quantification. Sensors 2023, 23, 7602. https://doi.org/10.3390/s23177602
Wu W, Li M, Hu J, Zhu S, Xue C. Research on Guidance Methods of Digital Twin Robotic Arms Based on User Interaction Experience Quantification. Sensors. 2023; 23(17):7602. https://doi.org/10.3390/s23177602
Chicago/Turabian StyleWu, Wenyu, Mingrui Li, Jincheng Hu, Shuwei Zhu, and Chengqi Xue. 2023. "Research on Guidance Methods of Digital Twin Robotic Arms Based on User Interaction Experience Quantification" Sensors 23, no. 17: 7602. https://doi.org/10.3390/s23177602
APA StyleWu, W., Li, M., Hu, J., Zhu, S., & Xue, C. (2023). Research on Guidance Methods of Digital Twin Robotic Arms Based on User Interaction Experience Quantification. Sensors, 23(17), 7602. https://doi.org/10.3390/s23177602