
UR-Net: An Integrated ResUNet and Attention Based Image Enhancement and Classification Network for Stain-Free White Blood Cells


 , ,
, , 
Abstract
:1. Introduction
2. Related Works
2.1. Traditional Image Enhancement
2.2. CNN-Based Image Enhancement to Improve Human Perception
2.3. CNN-Based Image Enhancement to Improve Neural Network Classification Performance
3. Methods
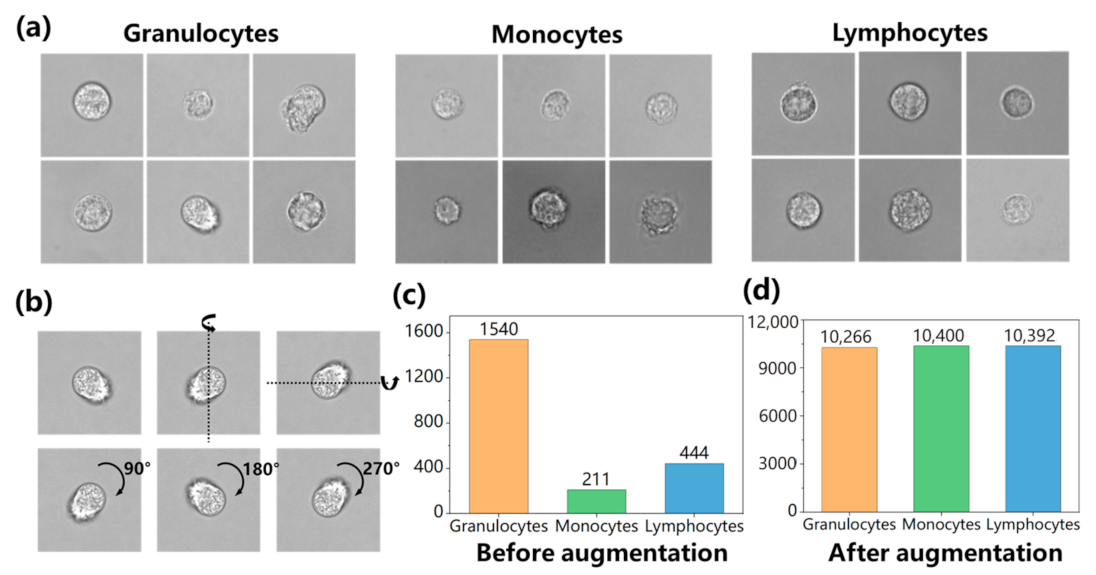
3.1. Dataset
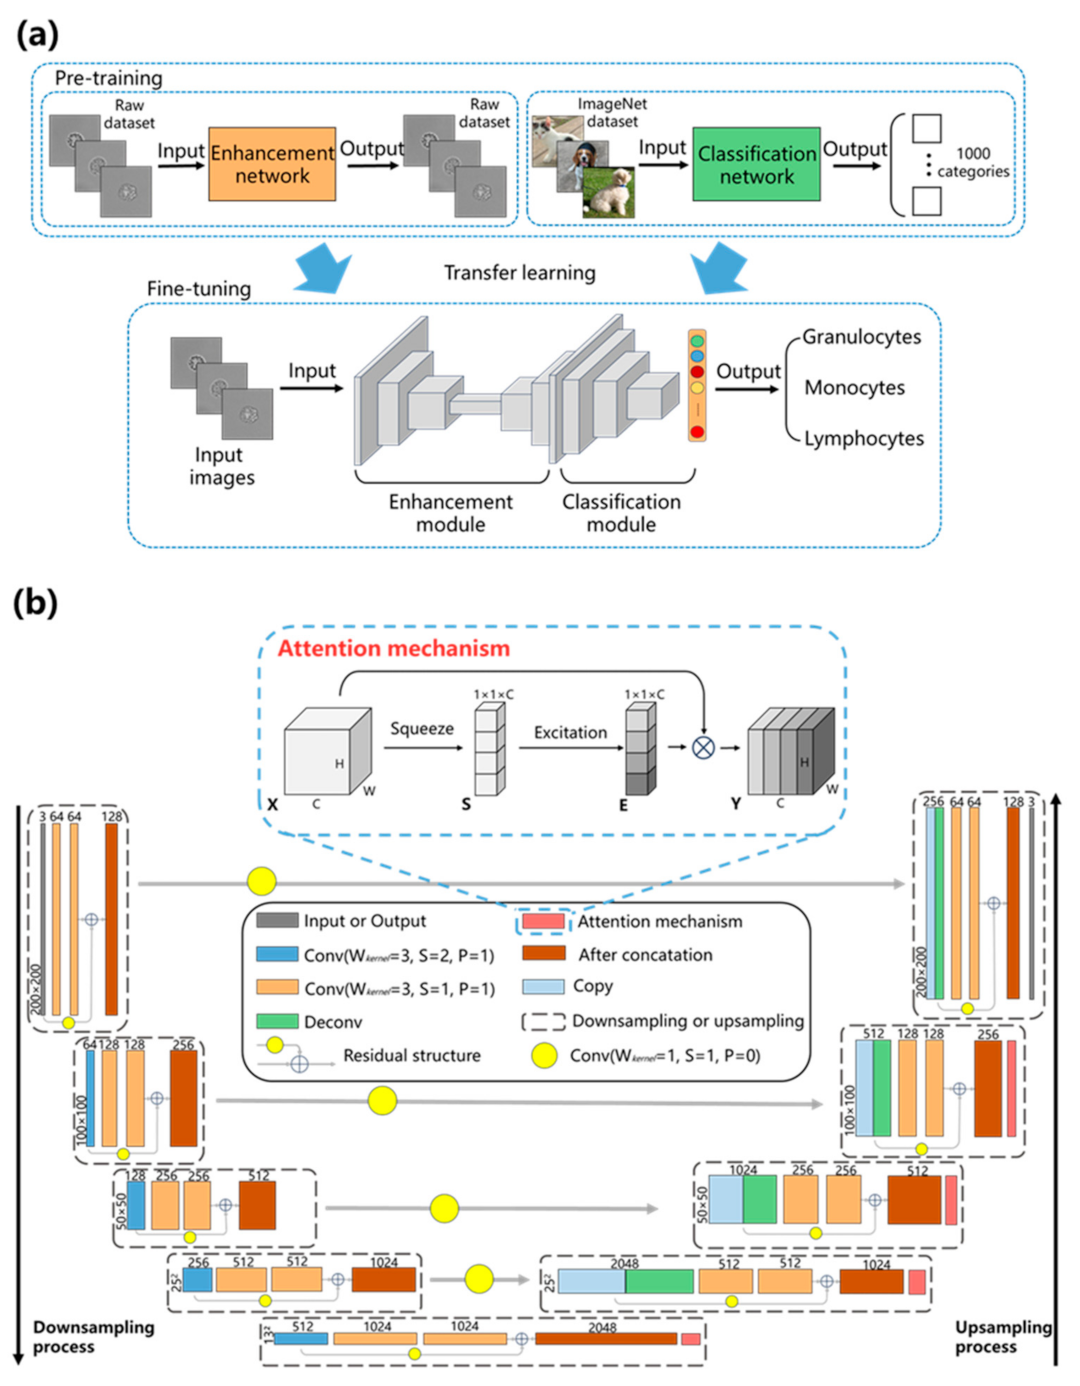
3.2. UR-Net
3.3. Training Process
4. Experimental Results and Discussion
5. Conclusions
Author Contributions
Funding
Institutional Review Board Statement
Informed Consent Statement
Data Availability Statement
Conflicts of Interest
References
- Huang, X.; Xu, D.; Chen, J.; Liu, J.; Li, Y.; Song, J.; Ma, X.; Guo, J. Smartphone-based analytical biosensors. Analyst 2018, 143, 5339–5351. [Google Scholar] [CrossRef] [PubMed]
- Young, I.T. The classification of white blood cells. IEEE Trans. Biomed. Eng. 1972, 19, 291–298. [Google Scholar] [CrossRef] [PubMed]
- Khobragade, S.; Mor, D.D.; Patil, C. Detection of leukemia in microscopic white blood cell images. In Proceedings of the 2015 International Conference on Information Processing (ICIP), Pune, India, 16–19 December 2015; pp. 435–440. [Google Scholar]
- Feng, F.; Sun, L.; Zheng, G.; Liu, S.; Liu, Z.; Xu, G.; Guo, M.; Lian, X.; Fan, D.; Zhang, H. Low lymphocyte-to-white blood cell ratio and high monocyte-to-white blood cell ratio predict poor prognosis in gastric cancer. Oncotarget 2017, 8, 5281–5291. [Google Scholar] [CrossRef] [PubMed]
- Ahmad, R.; Awais, M.; Kausar, N.; Akram, T. White Blood Cells Classification Using Entropy-Controlled Deep Features Optimization. Diagnostics 2023, 13, 352. [Google Scholar] [CrossRef] [PubMed]
- Froom, P.; Havis, R.; Barak, M. The rate of manual peripheral blood smear reviews in outpatients. Clin. Chem. Lab. Med. 2009, 47, 1401–1405. [Google Scholar] [CrossRef] [PubMed]
- Khan, S.; Sajjad, M.; Hussain, T.; Ullah, A.; Imran, A.S. A review on traditional machine learning and deep learning models for WBCs classification in blood smear images. IEEE Access 2020, 9, 10657–10673. [Google Scholar] [CrossRef]
- Al-Dulaimi, K.A.K.; Banks, J.; Chandran, V.; Tomeo-Reyes, I.; Nguyen Thanh, K. Classification of white blood cell types from microscope images: Techniques and challenges. Microsc. Sci. Last Approaches Educ. Programs Appl. Res. 2018, 17–25. [Google Scholar]
- Lippeveld, M.; Knill, C.; Ladlow, E.; Fuller, A.; Michaelis, L.J.; Saeys, Y.; Filby, A.; Peralta, D. Classification of Human White Blood Cells Using Machine Learning for Stain-Free Imaging Flow Cytometry. Cytom. A 2020, 97, 308–319. [Google Scholar] [CrossRef]
- Huang, X.; Jeon, H.; Liu, J.; Yao, J.; Wei, M.; Han, W.; Chen, J.; Sun, L.; Han, J. Deep-learning based label-free classification of activated and inactivated neutrophils for rapid immune state monitoring. Sensors 2021, 21, 512. [Google Scholar] [CrossRef]
- Casacio, C.A.; Madsen, L.S.; Terrasson, A.; Waleed, M.; Barnscheidt, K.; Hage, B.; Taylor, M.A.; Bowen, W.P. Quantum-enhanced nonlinear microscopy. Nature 2021, 594, 201–206. [Google Scholar] [CrossRef]
- Abdullah-Al-Wadud, M.; Kabir, M.H.; Dewan, M.A.A.; Chae, O. A dynamic histogram equalization for image contrast enhancement. IEEE Trans. Consum. Electron. 2007, 53, 593–600. [Google Scholar] [CrossRef]
- Sreemathy, J.; Arun, A.; Aruna, M.; Vigneshwaran, P. An optimal approach to detect retinal diseases by performing segmentation of retinal blood vessels using image processing. Soft Comput. 2023, 27, 10999–11011. [Google Scholar] [CrossRef]
- Engelberg, S. A more general approach to the filter sharpening technique of Kaiser and Hamming. IEEE Trans. Circuits Syst. II Express Briefs 2006, 53, 538–540. [Google Scholar] [CrossRef]
- Nasrollahi, K.; Moeslund, T.B. Super-resolution: A comprehensive survey. Mach. Vis. Appl. 2014, 25, 1423–1468. [Google Scholar] [CrossRef]
- Mukadam, S.B.; Patil, H.Y. Skin Cancer Classification Framework Using Enhanced Super Resolution Generative Adversarial Network and Custom Convolutional Neural Network. Appl. Sci. 2023, 13, 1210. [Google Scholar] [CrossRef]
- Ren, X.; Yang, W.; Cheng, W.H.; Liu, J. LR3M: Robust Low-Light Enhancement via Low-Rank Regularized Retinex Model. IEEE Trans Image Process 2020, 29, 5862–5876. [Google Scholar] [CrossRef]
- Adelmann, H.G. Butterworth equations for homomorphic filtering of images. Comput. Biol. Med. 1998, 28, 169–181. [Google Scholar] [CrossRef]
- Gilles, J.; Tran, G.; Osher, S. 2D Empirical Transforms. Wavelets, Ridgelets, and Curvelets Revisited. SIAM J. Imaging Sci. 2014, 7, 157–186. [Google Scholar] [CrossRef]
- Tulum, G. Novel radiomic features versus deep learning: Differentiating brain metastases from pathological lung cancer types in small datasets. Br. J. Radiol. 2023, 96, 1146. [Google Scholar] [CrossRef]
- Chakrabarti, A. A Neural Approach to Blind Motion Deblurring. arXiv 2016, arXiv:1603.04771. [Google Scholar]
- Chen, Q.; Xu, J.; Koltun, V. Fast image processing with fully-convolutional networks. In Proceedings of the IEEE International Conference on Computer Vision, Venice, Italy, 22–29 October 2017; pp. 2497–2506. [Google Scholar]
- Sharma, V.; Diba, A.; Neven, D.; Brown, M.S.; Gool, L.V.; Stiefelhagen, R. Classification-Driven Dynamic Image Enhancement. In Proceedings of the 2018 IEEE/CVF Conference on Computer Vision and Pattern Recognition, Salt Lake City, UT, USA, 18–23 June 2018; pp. 4033–4041. [Google Scholar]
- Xu, Z.W.; Ren, H.J.; Zhou, W.; Liu, Z.C. ISANET: Non-small cell lung cancer classification and detection based on CNN and attention mechanism. Biomed. Signal Process. Control 2022, 77, 103773. [Google Scholar] [CrossRef]
- Shahzad, A.; Raza, M.; Shah, J.H.; Sharif, M.; Nayak, R.S. Categorizing white blood cells by utilizing deep features of proposed 4B-AdditionNet-based CNN network with ant colony optimization. Complex Intell. Syst. 2021, 8, 3143–3159. [Google Scholar] [CrossRef]
- Pham, T.D. Kriging-Weighted Laplacian Kernels for Grayscale Image Sharpening. IEEE Access 2022, 10, 57094–57106. [Google Scholar] [CrossRef]
- Li, Z.; Zheng, J.; Zhu, Z.; Yao, W.; Wu, S. Weighted guided image filtering. IEEE Trans Image Process 2015, 24, 120–129. [Google Scholar] [CrossRef]
- Dong, W.; Zhang, L.; Lukac, R.; Shi, G. Sparse representation based image interpolation with nonlocal autoregressive modeling. IEEE Trans Image Process 2013, 22, 1382–1394. [Google Scholar] [CrossRef]
- Xu, K.; Gong, H.; Liu, F. Vehicle detection based on improved multitask cascaded convolutional neural network and mixed image enhancement. IET Image Process. 2020, 14, 4621–4632. [Google Scholar] [CrossRef]
- Khan, M.N.; Altalbe, A. Experimental evaluation of filters used for removing speckle noise and enhancing ultrasound image quality. Biomed. Signal Process. Control 2022, 73, 103399. [Google Scholar] [CrossRef]
- Cao, X.; Yao, J.; Fu, X.; Bi, H.; Hong, D. An enhanced 3-D discrete wavelet transform for hyperspectral image classification. IEEE Geosci. Remote Sens. Lett. 2020, 18, 1104–1108. [Google Scholar] [CrossRef]
- Huang, J.; Zhu, P.; Geng, M.; Ran, J.; Zhou, X.; Xing, C.; Wan, P.; Ji, X. Range scaling global u-net for perceptual image enhancement on mobile devices. In Proceedings of the European Conference on Computer Vision (ECCV) Workshops, Munich, Germany, 8–14 September 2018. [Google Scholar]
- Ignatov, A.; Kobyshev, N.; Timofte, R.; Vanhoey, K.; Van Gool, L. Dslr-quality photos on mobile devices with deep convolutional networks. In Proceedings of the IEEE International Conference on Computer Vision, Venice, Italy, 22–29 October 2017; pp. 3277–3285. [Google Scholar]
- Lore, K.G.; Akintayo, A.; Sarkar, S. LLNet: A deep autoencoder approach to natural low-light image enhancement. Pattern Recognit. 2017, 61, 650–662. [Google Scholar] [CrossRef]
- Su, Y.M.; Lian, Q.S.; Zhang, X.H.; Shi, B.S.; Fan, X.Y. Multi-scale Cross-path Concatenation Residual Network for Poisson denoising. IET Image Process. 2019, 13, 1295–1303. [Google Scholar] [CrossRef]
- Hoque, M.R.U.; Burks, R.; Kwan, C.; Li, J. Deep learning for remote sensing image super-resolution. In Proceedings of the 2019 IEEE 10th Annual Ubiquitous Computing, Electronics & Mobile Communication Conference (UEMCON), New York, NY, USA, 10–12 October 2019; pp. 286–292. [Google Scholar]
- Huang, W.F.; Liao, X.Y.; Zhu, L.; Wei, M.Q.; Wang, Q. Single-Image Super-Resolution Neural Network via Hybrid Multi-Scale Features. Mathematics 2022, 10, 653. [Google Scholar] [CrossRef]
- Dodge, S.; Karam, L. Understanding how image quality affects deep neural networks. In Proceedings of the 2016 Eighth International Conference on Quality of Multimedia Experience (QoMEX), Lisbon, Portugal, 6–8 June 2016; pp. 1–6. [Google Scholar]
- Ullman, S.; Assif, L.; Fetaya, E.; Harari, D. Atoms of recognition in human and computer vision. Proc. Natl. Acad. Sci. USA 2016, 113, 2744–2749. [Google Scholar] [CrossRef] [PubMed]
- Al Sobbahi, R.; Tekli, J. Low-Light Homomorphic Filtering Network for integrating image enhancement and classification. Signal Process. Image Commun. 2022, 100, 116527. [Google Scholar] [CrossRef]
- Hu, J.; Shen, L.; Sun, G. Squeeze-and-excitation networks. In Proceedings of the IEEE Conference on Computer Vision and Pattern Recognition, Salt Lake City, UT, USA, 18–22 June 2018; pp. 7132–7141. [Google Scholar]
- Deng, J.; Dong, W.; Socher, R.; Li, L.-J.; Li, K.; Fei-Fei, L. Imagenet: A large-scale hierarchical image database. In Proceedings of the 2009 IEEE Conference on Computer Vision and Pattern Recognition, Miami, FL, USA, 20–25 June 2009; pp. 248–255. [Google Scholar]
- Abhishek, A.; Jha, R.K.; Sinha, R.; Jha, K. Automated detection and classification of leukemia on a subject-independent test dataset using deep transfer learning supported by Grad-CAM visualization. Biomed. Signal Process. Control 2023, 83, 104722. [Google Scholar] [CrossRef]
- Jeon, H.; Wei, M.; Huang, X.; Yao, J.; Han, W.; Wang, R.; Xu, X.; Chen, J.; Sun, L.; Han, J. Rapid and Label-Free Classification of Blood Leukocytes for Immune State Monitoring. Anal. Chem. 2022, 94, 6394–6402. [Google Scholar] [CrossRef]


| Optimizer | Learning Rate | Momentum | Batch Size | Number of Epochs | Activation Function | |
|---|---|---|---|---|---|---|
| Pre-train | SGD-M | 10−4 | 0.9 | 32 | 100 | LeakyReLU |
| Train | SGD-M | 10−4 | 0.9 | 32 | 200 | ReLU |
| Model | Accuracy | Model | Accuracy | Model | Accuracy |
|---|---|---|---|---|---|
| UNet VGG16 | 78.01% | UNet++ VGG16 | 79.42% | ResUNet VGG16 | 79.46% |
| UNet MobileNetV2 | 78.14% | UNet++ MobileNetV2 | 79.32% | ResUNet MobileNetV2 | 79.28% |
| UNet DenseNet121 | 79.96% | UNet++ DenseNet121 | 81.62% | ResUNet DenseNet121 | 81.77% |
| UNetResNet101 | 80.60% | UNet++ ResNet101 | 81.43% | ResUNet ResNet101 | 81.78% |
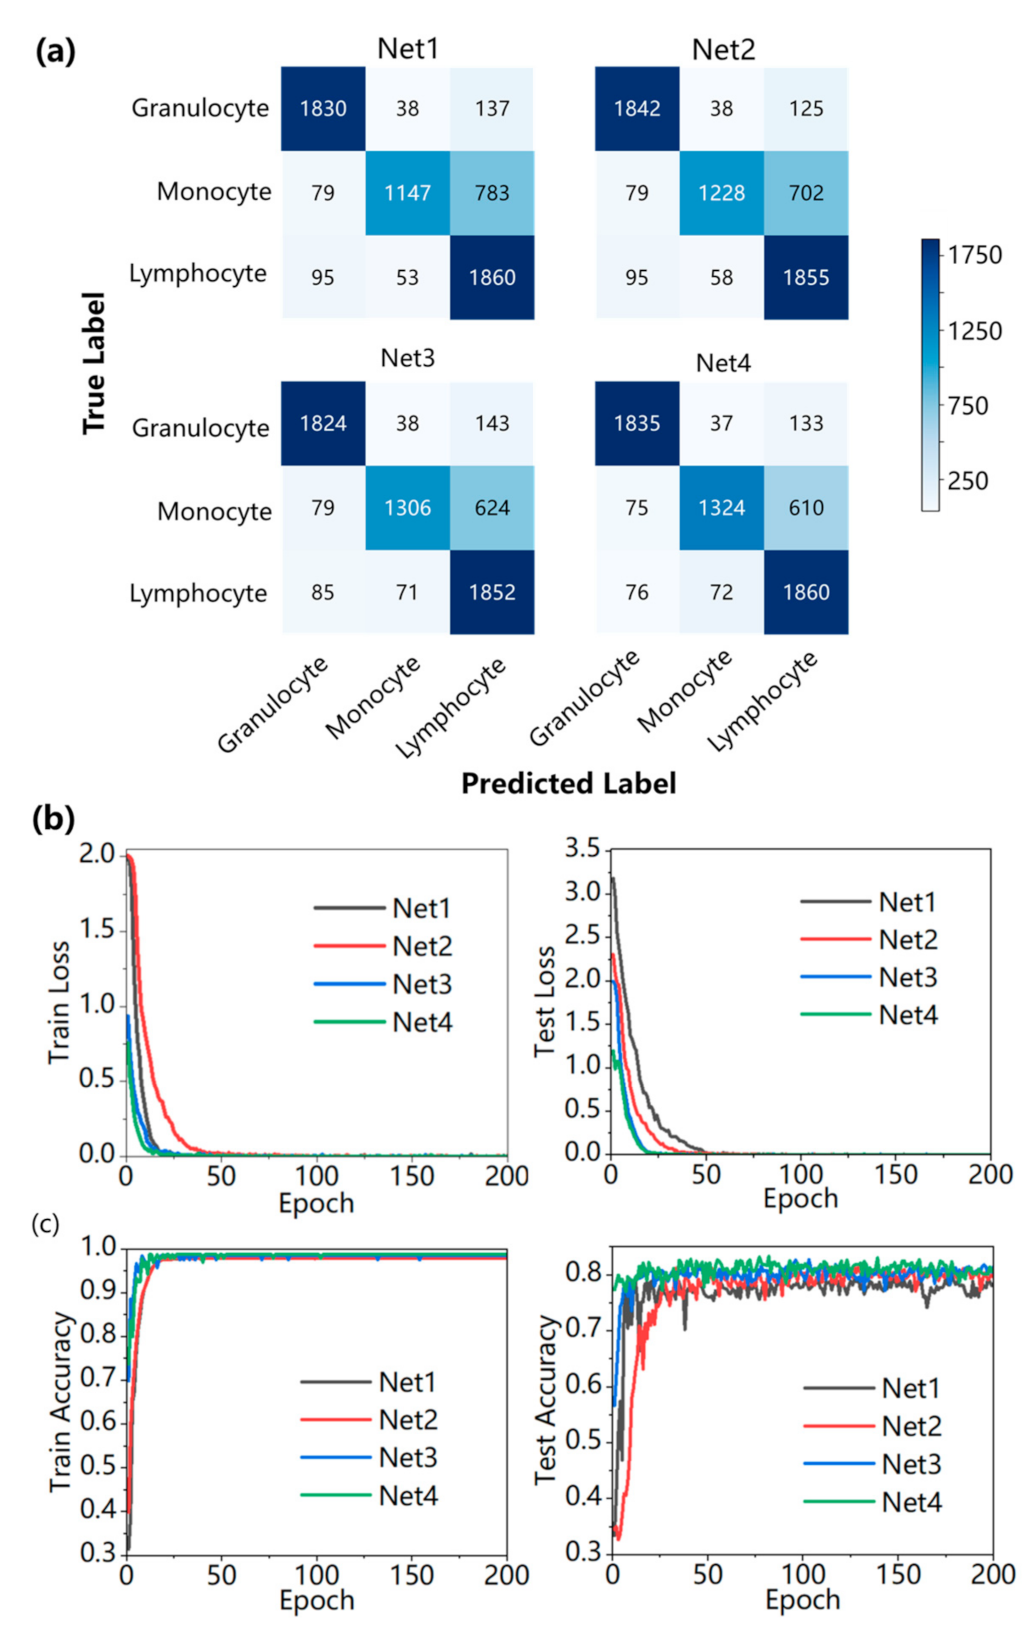
| Index | Types of WBC | Net1 | Net2 | Net3 | Net4 |
|---|---|---|---|---|---|
| Recall | Granulocyte | 91.27% | 91.87% | 90.97% | 91.52% |
| Monocyte | 57.09% | 61.13% | 65.01% | 65.90% | |
| Lymphocyte | 92.63% | 92.38% | 92.23% | 92.63% | |
| Average | 80.33% | 81.79% | 82.74% | 83.35% | |
| Precision | Granulocyte | 91.32% | 91.37% | 91.75% | 92.40% |
| Monocyte | 92.65% | 92.75% | 92.30% | 92.39% | |
| Lymphocyte | 66.91% | 69.17% | 70.71% | 71.46% | |
| Average | 83.63% | 84.43% | 84.92% | 85.42% | |
| F1 score | Granulocyte | 91.29% | 91.62% | 91.36% | 91.96% |
| Monocyte | 70.65% | 73.69% | 76.29% | 76.93% | |
| Lymphocyte | 77.70% | 79.10% | 80.05% | 80.68% | |
| Average | 79.88% | 81.47% | 82.57% | 83.19% | |
| Accuracy | Test accuracy | 80.32% | 81.78% | 82.73% | 83.34% |
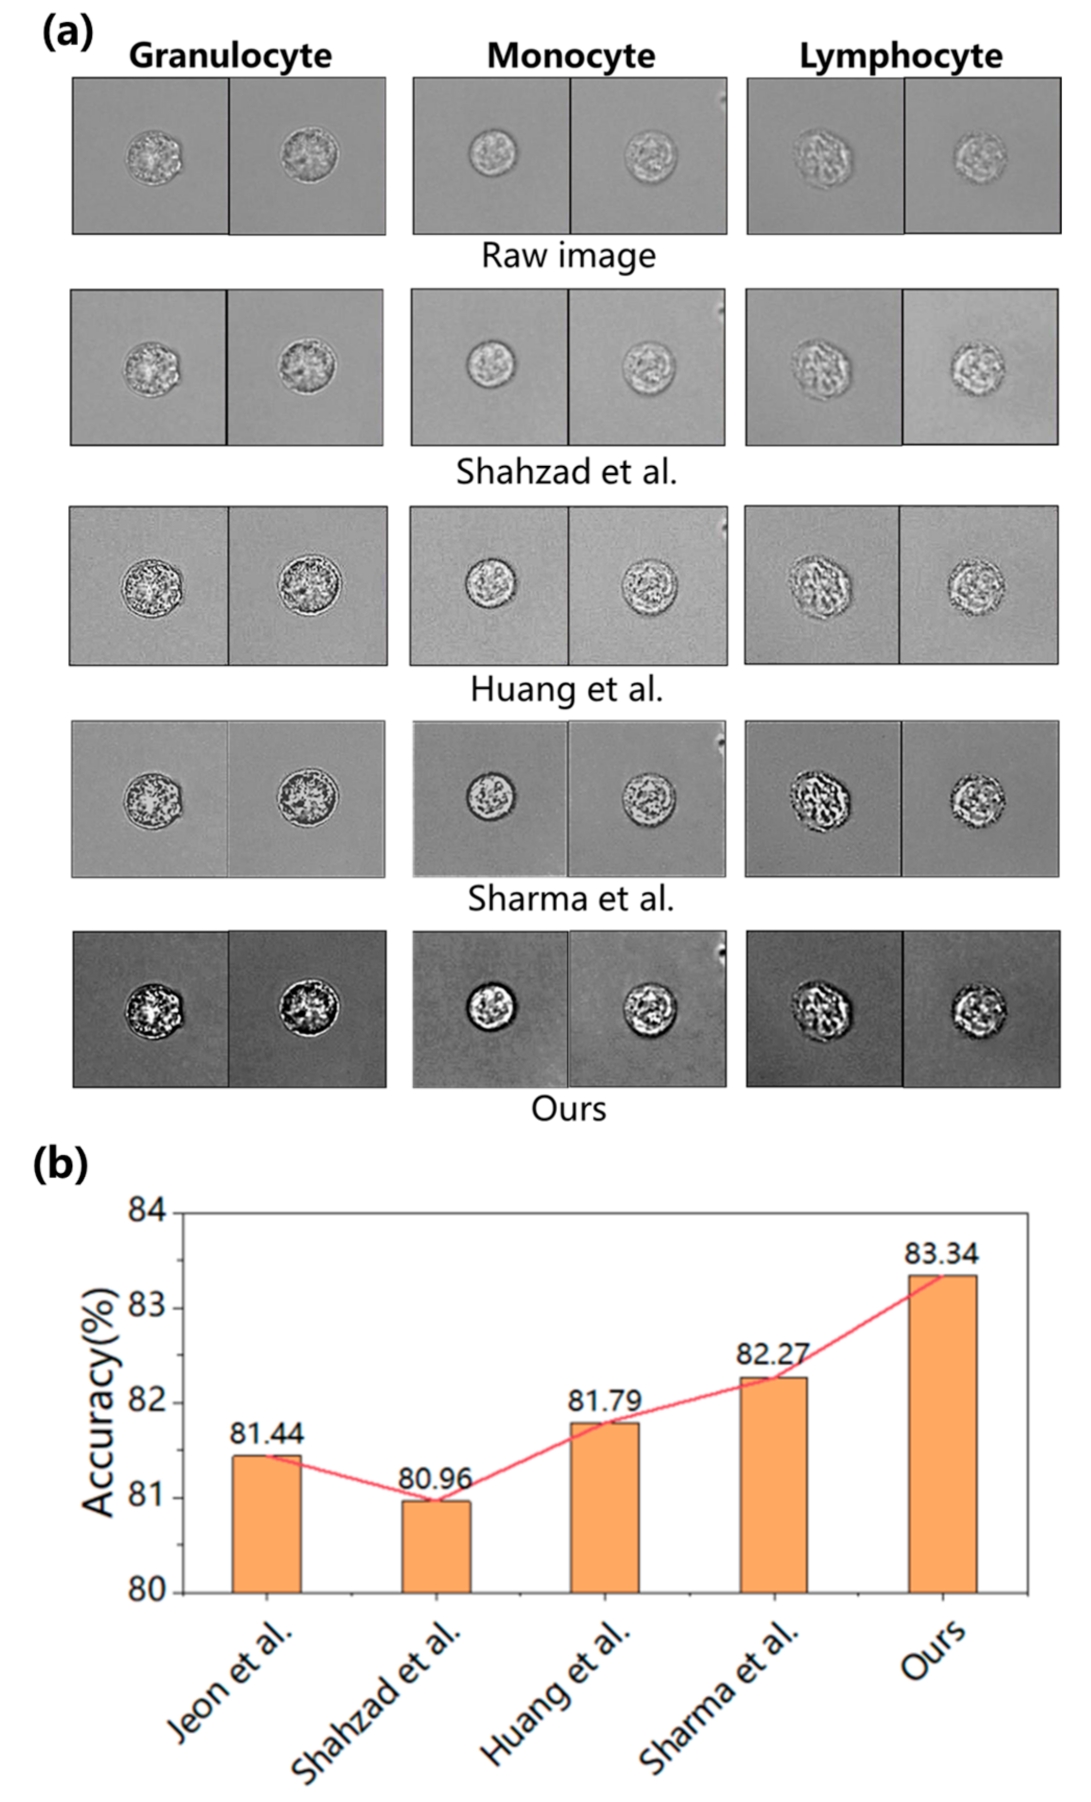
| Index | Types of WBC | Jeon et al. [44] | Shahzad et al. [25] | Huang et al. [32] | Sharma et al. [23] | Ours |
|---|---|---|---|---|---|---|
| Recall | Granulocyte | 92.77% | 93.57% | 93.77% | 91.72% | 91.52% |
| Monocyte | 59.48% | 56.10% | 63.07% | 64.56% | 65.90% | |
| Lymphocyte | 92.08% | 93.28% | 88.60% | 90.54% | 92.63% | |
| Average | 81.44% | 80.98% | 81.81% | 82.27% | 83.35% | |
| Precision | Granulocyte | 91.99% | 91.92% | 91.44% | 91.13% | 92.40% |
| Monocyte | 90.05% | 91.03% | 88.54% | 88.90% | 92.39% | |
| Lymphocyte | 69.17% | 68.28% | 70.18% | 71.43% | 71.46% | |
| Average | 83.74% | 83.74% | 83.39% | 83.82% | 85.42% | |
| F1 score | Granulocyte | 92.38% | 92.73% | 92.59% | 91.42% | 91.96% |
| Monocyte | 71.64% | 69.42% | 73.66% | 74.80% | 76.93% | |
| Lymphocyte | 79.00% | 78.85% | 78.32% | 79.86% | 80.68% | |
| Average | 81.01% | 80.33% | 81.52% | 82.03% | 83.19% | |
| Accuracy | Test accuracy | 81.44% | 80.96% | 81.79% | 82.27% | 83.34% |
Disclaimer/Publisher’s Note: The statements, opinions and data contained in all publications are solely those of the individual author(s) and contributor(s) and not of MDPI and/or the editor(s). MDPI and/or the editor(s) disclaim responsibility for any injury to people or property resulting from any ideas, methods, instructions or products referred to in the content. |
© 2023 by the authors. Licensee MDPI, Basel, Switzerland. This article is an open access article distributed under the terms and conditions of the Creative Commons Attribution (CC BY) license (https://creativecommons.org/licenses/by/4.0/).
Share and Cite
Zheng, S.; Huang, X.; Chen, J.; Lyu, Z.; Zheng, J.; Huang, J.; Gao, H.; Liu, S.; Sun, L. UR-Net: An Integrated ResUNet and Attention Based Image Enhancement and Classification Network for Stain-Free White Blood Cells. Sensors 2023, 23, 7605. https://doi.org/10.3390/s23177605
Zheng S, Huang X, Chen J, Lyu Z, Zheng J, Huang J, Gao H, Liu S, Sun L. UR-Net: An Integrated ResUNet and Attention Based Image Enhancement and Classification Network for Stain-Free White Blood Cells. Sensors. 2023; 23(17):7605. https://doi.org/10.3390/s23177605
Chicago/Turabian StyleZheng, Sikai, Xiwei Huang, Jin Chen, Zefei Lyu, Jingwen Zheng, Jiye Huang, Haijun Gao, Shan Liu, and Lingling Sun. 2023. "UR-Net: An Integrated ResUNet and Attention Based Image Enhancement and Classification Network for Stain-Free White Blood Cells" Sensors 23, no. 17: 7605. https://doi.org/10.3390/s23177605
APA StyleZheng, S., Huang, X., Chen, J., Lyu, Z., Zheng, J., Huang, J., Gao, H., Liu, S., & Sun, L. (2023). UR-Net: An Integrated ResUNet and Attention Based Image Enhancement and Classification Network for Stain-Free White Blood Cells. Sensors, 23(17), 7605. https://doi.org/10.3390/s23177605