
Acoustic Waves in Piezoelectric Layered Structure for Selective Detection of Liquid Viscosity

 ,
, 
 ,
,  ,
, 
Abstract
:1. Introduction
2. Materials and Methods
2.1. Theoretical Methods
2.2. Experimental Methods
3. Results and Discussion
4. Conclusions
Author Contributions
Funding
Institutional Review Board Statement
Informed Consent Statement
Data Availability Statement
Conflicts of Interest
References
- Joob, B.; Wiwanitkit, V. Blood viscosity of COVID-19 patient: A preliminary report. Am. J. Blood Res. 2021, 11, 93–95. [Google Scholar] [PubMed]
- Al-kuraishy, H.M.; Al-Gareeb, A.I.; Qusti, S.; Alshammari, E.M.; Atanu, F.O.; Batiha, G.E.-S. Arginine vasopressin and pathophysiology of COVID-19: An innovative perspective. Biomed. Pharmacother. 2021, 143, 112193. [Google Scholar] [CrossRef] [PubMed]
- Naghedi-Baghdar, H.; Nazari, S.-M.; Taghipour, A.; Nematy, M.; Shokri, S.; Mehri, M.-R.; Molkara, T.; Javan, R. Effect of diet on blood viscosity in healthy humans: A systematic review. Electron. Physician 2018, 10, 6563–6570. [Google Scholar] [CrossRef] [PubMed]
- Kora, E.P.; Latrille, E.; Souchon, I. Texture–flavor interactions in low fat stirred yogurt: How mechanical treatment, thickener concentration and aroma concentration affect perceived texture and flavor. J. Sens. Stud. 2003, 18, 367–390. [Google Scholar] [CrossRef]
- Markova, L.V.; Makarenko, V.M.; Kong, H.; Han, H.-G. Influence of viscosity modifiers on the rheological properties of synthetic oils. J. Frict. Wear 2014, 35, 351–358. [Google Scholar] [CrossRef]
- Song, S.; Chen, D.; Wang, H.; Guo, Q.; Yu, W. Shear mode bulk acoustic viscosity sensor for blood coagulation monitoring in oral anticoagulant therapy. J. Nanosci. Nanotechnol. 2018, 18, 8099–8104. [Google Scholar] [CrossRef]
- Ricco, A.J.; Martin, S.J. Acoustic wave viscosity sensor. Appl. Phys. Lett. 1987, 50, 1474–1476. [Google Scholar] [CrossRef]
- Guliy, O.I.; Zaitsev, B.D.; Teplykh, A.A.; Borodina, I.A. Diagnosis of viral particles by an acoustic system consisting of the piezoelectric resonator with a lateral exciting electric field and microbial cells as a sensor element. Biosens. Bioel. X 2022, 11, 100213. [Google Scholar] [CrossRef]
- Kondoh, J.; Nakayama, K.; Kuznetsova, I. Study of frequency dependence of shear horizontal surface acoustic wave sensor for engine oil measurements. Sens. Act. Phys. 2021, 325, 112503. [Google Scholar] [CrossRef]
- Prugne, C.; Van Est, J.; Cros, B.; Leveque, G.; Attal, J. Measurement of the viscosity of liquids by near-field acoustics. Meas. Sci. Technol. 1998, 9, 1894–1898. [Google Scholar] [CrossRef]
- Ballantine, D.S.; White, R.M.; Martin, S.J.; Ricco, A.J.; Zeller, E.T.; Frye, G.C.; Wohltjen, H. Acoustic Wave Sensors and Responses. In Acoustic Wave Sensors; Academic Press: San Diego, CA, USA, 1997. [Google Scholar] [CrossRef]
- Anisimkin, V.I.; Shamsutdinova, E.S.; Li, P.; Wang, B.; Zhu, F.; Qian, Z.; Kuznetsova, I. Selective detection of liquid viscosity using acoustic plate waves with in-plate polarization. Sensors 2022, 27, 2727. [Google Scholar] [CrossRef] [PubMed]
- Anisimkin, V.I.; Voronova, N.V. Acoustic properties of the film/plate layered structure. IEEE Trans. Ultras. Ferroel. Freq. Contr. 2011, 58, 578–584. [Google Scholar] [CrossRef] [PubMed]
- Verona, E.; Anisimkin, V.I.; Osipenko, V.A.; Voronova, N.V. Quasi longitudinal Lamb acoustic modes along ZnO/Si/ZnO structures. Ultrasonics 2017, 76, 227–233. [Google Scholar] [CrossRef] [PubMed]
- Anisimkin, V.I.; Verona, E.; Kuznetsova, A.S. Acoustic wave propagation along AlN on Bi12GeO20 structures. Ultrasonics 2019, 94, 314–318. [Google Scholar] [CrossRef]
- Anisimkin, V.I.; Verona, E.; Kuznetsova, A.S.; Osipenko, V.A. Acoustic wave propagation along piezoelectric plate coated with piezoelectric films. Phys. Acoust. 2019, 65, 171–177. [Google Scholar] [CrossRef]
- Caliendo, C.; Laidoudi, F. Experimental and theoretical study of multifrequency surface acoustic wave devices in a single Si/SiO2/ZnO piezoelectric structure. Sensors 2020, 20, 1380. [Google Scholar] [CrossRef]
- Kvashnin, G.M.; Sorokin, B.P.; Burkov, S.I. Study of propagation of microwave lamb waves in a piezoelectric layered structure. Acoust. Phys. 2021, 67, 590–596. [Google Scholar] [CrossRef]
- Yan, D.-J.; Chen, A.-L.; Wang, Y.-S.; Zhang, C.; Golub, M. In plane elastic wave propagation in nanoscale periodic layered piezoelectric structures. Int. J. Mech. Sci. 2018, 142–143, 276–288. [Google Scholar] [CrossRef]
- Anisimkin, V.I.; Voronova, N.V. Features of normal higher order acoustic wave generation in thin piezoelectric plates. Acoust. Phys. 2020, 66, 1–4. [Google Scholar] [CrossRef]
- Zhao, Z.; Qian, Z.; Yong, Y.-K. Frequency shift prediction of a shear mode multi-layered FBAR sensor in viscous media using transfer matrix method. Appl. Math. Model. 2021, 99, 555–565. [Google Scholar] [CrossRef]
- Pankaj, K.K.; Sahu, S.A.; Kumari, S. On the group velocity of Love-type waves in composite structure loaded with viscous fluid. Waves Random Complex Media 2022, 32, 541–556. [Google Scholar] [CrossRef]
- Yuan, L.; Du, J.; Ma, T.; Wang, J. Effects of viscous liquid on SH-SAW in layered magnetoelectric structures. Ultrasonics 2013, 53, 808–814. [Google Scholar] [CrossRef] [PubMed]
- Chen, X.; Liu, D. Analysis of viscosity sensitivity for liquid property detection applications based on SAW sensors. Mater. Sci. Eng. C 2010, 30, 1175–1182. [Google Scholar] [CrossRef]
- Caliendo, C.; Hamidullah, M. A theoretical study of Love wave sensors based on ZnO-glass layered structures for application to liquid environments. Biosensors 2016, 6, 59. [Google Scholar] [CrossRef]
- Caliendo, C.; Hamidullah, M.; Laidoudi, F. Amorphous SiC/c-ZnO-based quasi-Lamb mode sensor for liquid environments. Sensors 2017, 17, 1209. [Google Scholar] [CrossRef]
- Caliendo, C.; Hamidullah, M. Guided acoustic wave sensors for liquid environments. J. Phys. D Appl. Phys 2019, 52, 153001. [Google Scholar] [CrossRef]
- Chen, D.; Song, S.; Ma, J.; Zhang, Z.; Wang, P.; Liu, W.; Guo, Q. Micro-electromechanical film bulk acoustic sensor for plasma and whole blood coagulation monitoring. Biosens. Bioelect. 2017, 91, 465–471. [Google Scholar] [CrossRef]
- Borodina, I.A.; Zaitsev, B.D.; Teplykh, A.A. The influence of viscous and conducting liquid on the characteristics of the slot acoustic wave. Ultrasonics 2018, 82, 39–43. [Google Scholar] [CrossRef]
- Oyama, T.; Kondoh, j.; Shiokawa, S. Measurements of particles in liquid using surface acoustic wave sensors. In Proceedings of the 2004 IEEE International Frequency Control Symposium and Exposition, Montreal, QC, Canada, 23–27 August 2004; pp. 235–240. [Google Scholar]
- Anisimkin, I.V.; Anisimkin, V.I. Attenuation of acoustic normal modes in piezoelectric plates loaded by viscous liquids. IEEE Trans. Ultras. Ferroel. Freq. Contr. 2006, 53, 1487–1492. [Google Scholar] [CrossRef]
- Anisimkin, V.I.; Kuznetsova, I.E.; Kolesov, V.V.; Pyataikin, I.I.; Sorokin, V.V.; Skladnev, D.A. Plate acoustic wave sensor for detection of small amounts of bacterial cells in micro-litre liquid samples. Ultrasonics 2015, 62, 156–159. [Google Scholar] [CrossRef]
- Kuznetsova, I.E.; Zaitsev, B.D.; Seleznev, E.P.; Verona, E. Gasoline identifier based on SH0 plate acoustic waves. Ultrasonics 2016, 70, 34–37. [Google Scholar] [CrossRef] [PubMed]
- Anisimkin, V.I.; Kuznetsova, I.E. Selective surface acoustic waves detection of the temperature of a liquid microsample. J. Comm. Technol. Electr. 2019, 64, 823–826. [Google Scholar] [CrossRef]
- Smirnov, A.V.; Anisimkin, V.I.; Voronova, N.; Shamsutdinovs, E.S.; Li, P.; Ezzin, H.; Qian, Z.; Ma, T.; Kuznetsova, I.E. Multimode design and piezoelectric substrate anisotropy use to improve performance of acoustic liquid sensors. Sensors 2022, 22, 7231. [Google Scholar] [CrossRef]
- Adler, E.L.; Slaboszewicz, J.K.; Farnell, G.W.; Jen, C.K. PC Software for SAW Propagation in Anisotropic Multilayers. IEEE Trans. Ultras. Ferroel. Freq. Contr. 1990, 37, 215–223. [Google Scholar] [CrossRef] [PubMed]
- Kuznetsova, I.E.; Zaitsev, B.D.; Kuznetsova, A.S. Acoustic waves in structure ‘‘piezoelectric plate–polymeric nanocomposite film. Ultrasonics 2008, 48, 587–590. [Google Scholar] [CrossRef] [PubMed]
- Kuznetsova, I.E.; Zaitsev, B.D.; Joshi, S.G.; Teplykh, A. Effect of a liquid on the characteristics of antisymmetric lamb waves in thin piezoelectric plates. Acoust. Phys. 2007, 53, 557–563. [Google Scholar] [CrossRef]
- Zaitsev, B.D.; Kuznetsova, I.E.; Joshi, S.G.; Borodina, I.A. Acoustic waves in piezoelectric plates bordered with viscous and conductive liquids, Ultrasonics 2001, 39, 45–50. Ultrasonics 2001, 39, 45–50. [Google Scholar] [CrossRef]
- Slobodnik, A.J.; Conway, E.D.; Delmonico, R.T. Microwave Acoustic Handbook; AFPCRL198 TR-73–0597; Air Force Cambridge Research Laboratories: Bedford, MA, USA, 1973. [Google Scholar]
- Weast, R.C.; Astle, M.J. Chemical Rubber Company Handbook of Chemistry and Physics, 66th ed; Chemical Rubber: Boca Raton, FL, USA, 1985; pp. D232, D254. [Google Scholar]
- Murav’eva, O.V.; Murav’ev, V.V.; Zlobin, D.V.; Bogdan, O.P.; Syakterev, V.N.; Volkov, V.V. Technique and device for the experimental estimation of the acoustic impedance of viscoelastic medium. Devices Methods Meas. 2017, 8, 314–326. [Google Scholar] [CrossRef]


| AlN (ρ = 3260) | ||||||||||
| CE11 | CE12 | CE13 | CE33 | CE44 | CE66 | e15 | e31 | e33 | ε11/ε0 | ε33/ε0 |
| 345 | 125 | 120 | 395 | 118 | 110 | −0.48 | −0.58 | 1.55 | 8 | 9.5 |
| ZnO (ρ = 5665) | ||||||||||
| CE11 | CE12 | CE13 | CE33 | CE44 | CE66 | e15 | e31 | e33 | ε11/ε0 | ε33/ε0 |
| 209 | 120.5 | 104.6 | 210.6 | 42.3 | 44.55 | −0.48 | −0.573 | 1.321 | 7.57 | 9.03 |
| Si (ρ = 2330) | H2O (ρ = 997.299) | Glycerol (ρ = 1260) | ||||||||
| CE11 | CE12 | CE44 | ε11/ε0 | C11 | ε/ε0 | C11 | η11 | C44 | η44 | ε/ε0 |
| 166 | 63.9 | 79.6 | 10.62 | 2.25 | 80 | 2.81 | 118.6 | 1.2128 × 10⁻³ | 1.5 | 41.9 |
| No. | Layers (Thickness) (μm)/(μm), Frequency | H/λ | λ, μm | L, mm | vexp, m/s | , dB | dB | , dB/mm |
|---|---|---|---|---|---|---|---|---|
| 1 | IDT/AlN(1.8)/(111)Si (250) f = 67.94 MHz | 0.625 | 400 | 45 | 27,200 | 94 ± 0.1 | 8 ± 0.1 | 0.18 ± 0.002 |
| 2 | IDT/ZnO(0.4)/(100)Si (380)/ZnO(10) f = 34.6 MHz | 1.9 | 200 | 16 | 13,900 | 58 ± 0.1 | 7 ± 0.1 | 0.44 ± 0.006 |
| 3 | IDT/ZnO(10)/(100) Si(380) f = 43.46 MHz | 1.9 | 200 | 16 | 8700 | 67 ± 0.1 | 12.7 ± 0.1 | 0.8 ± 0.006 |
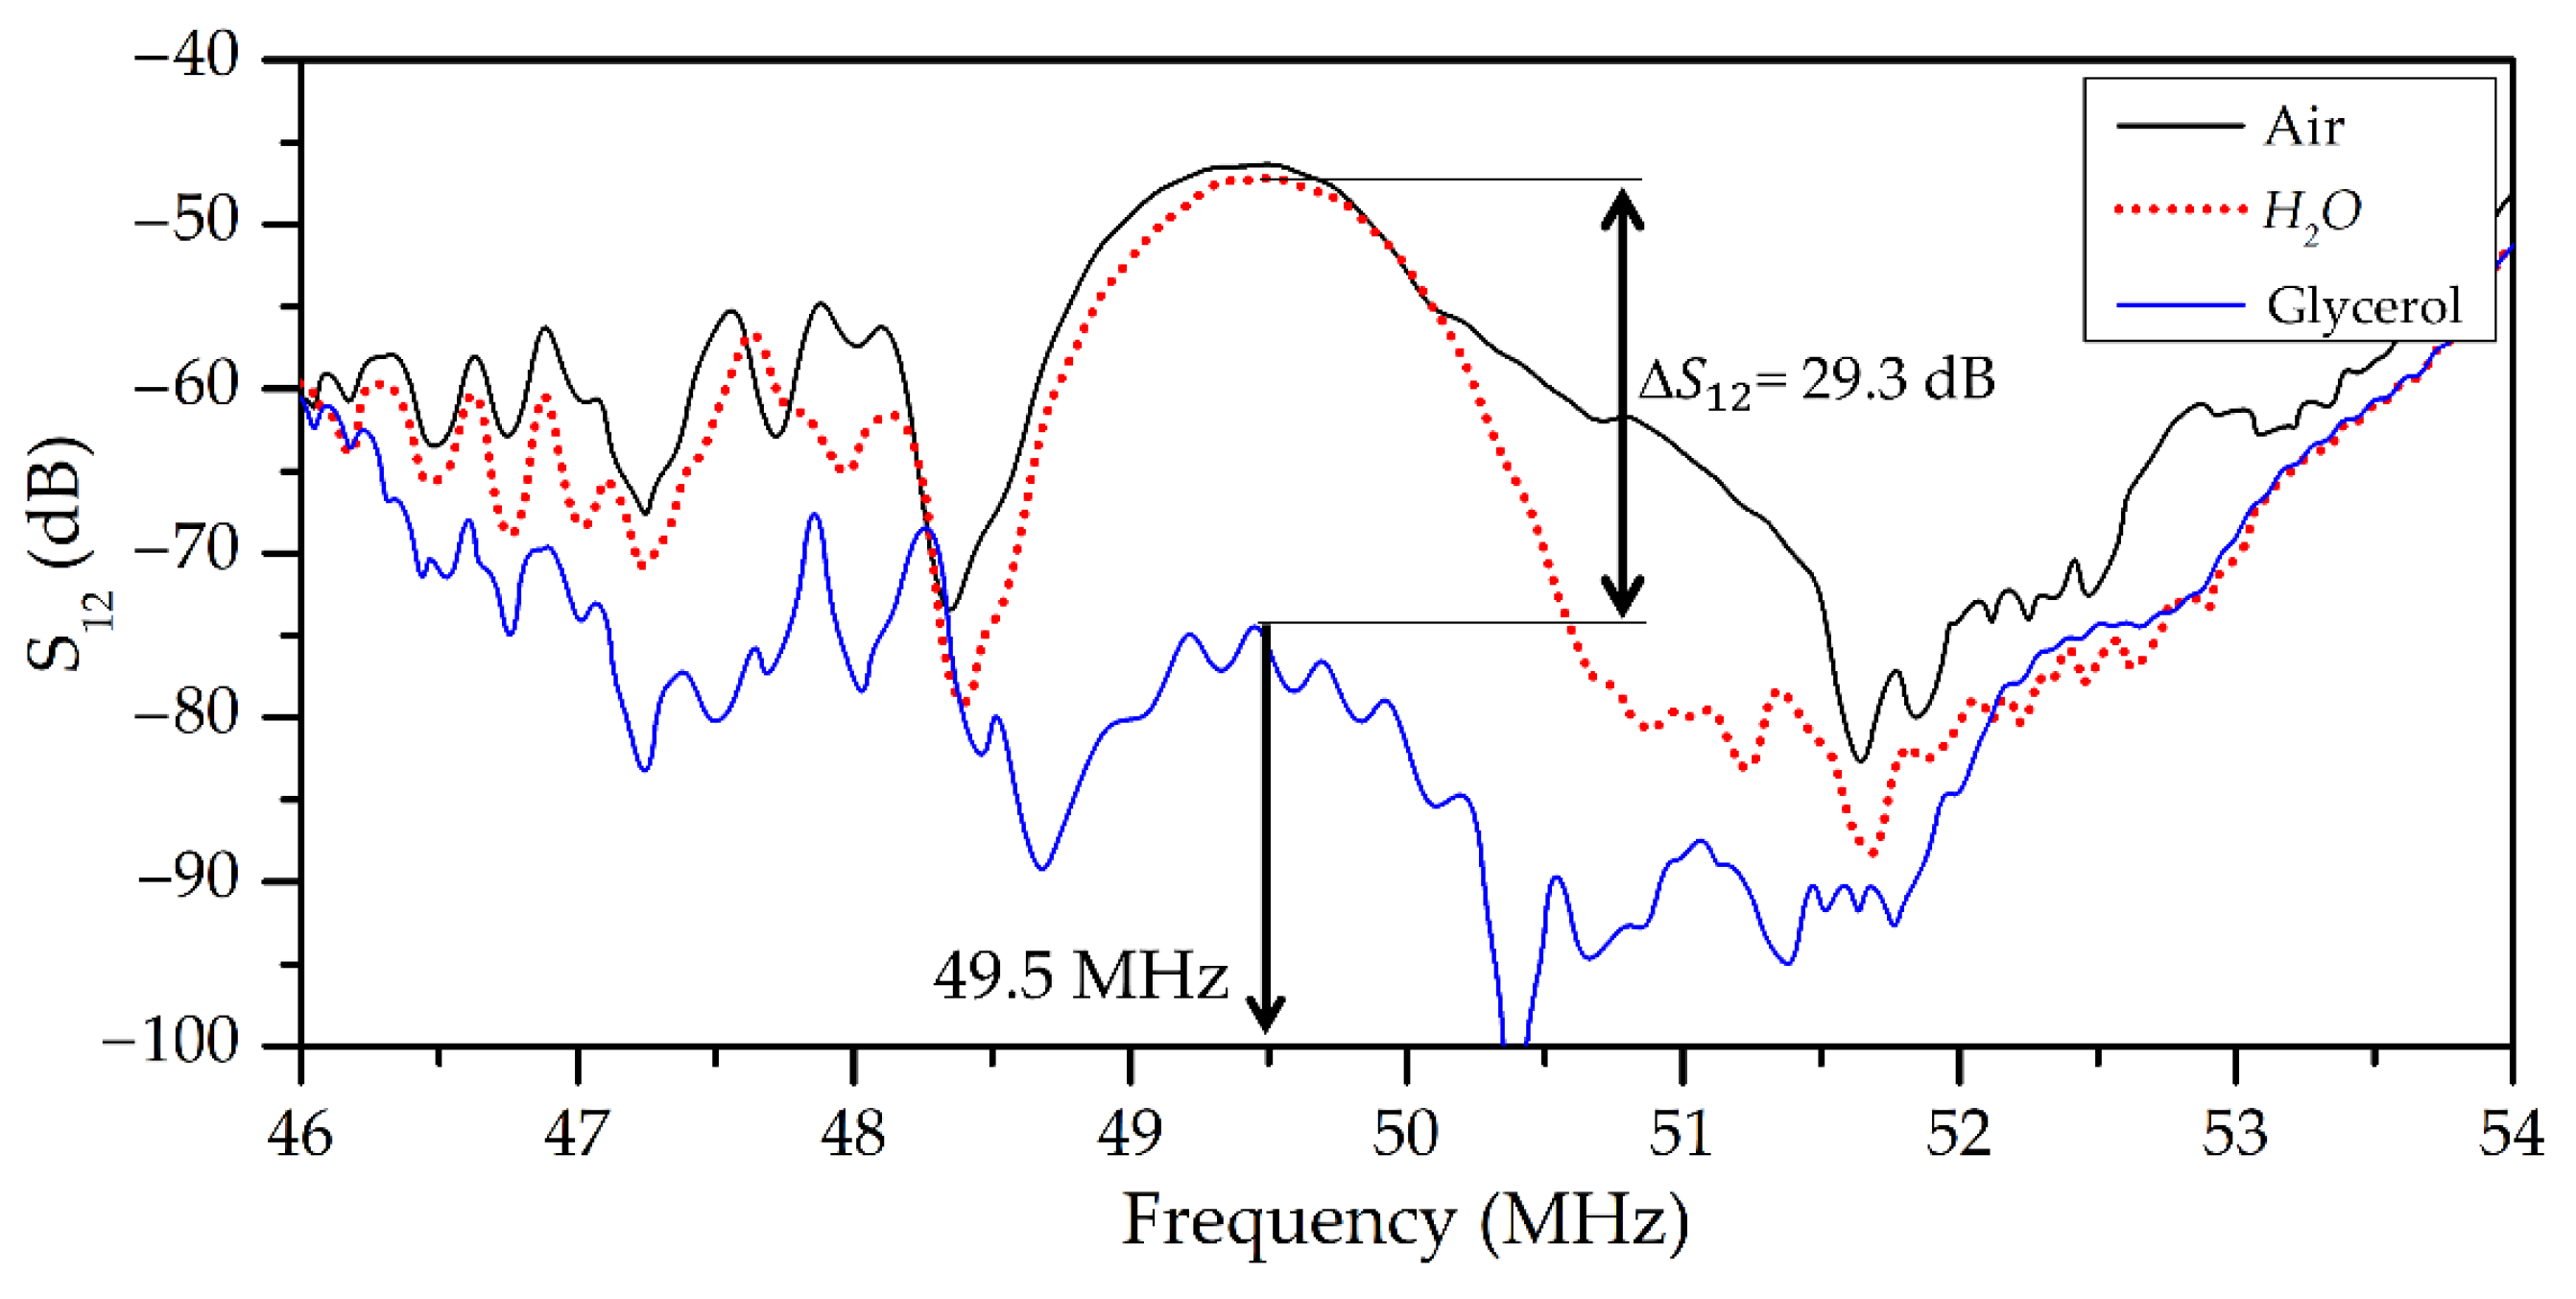
| 4 | IDT/ZnO(6.3)/(111) Si(380) f = 49.5 MHz | 1.9 | 200 | 37 | 9900 | 75 ± 0.1 | 29.3 ± 0.1 | 0.8 ± 0.003 |
| 5 | IDT/ZnO(6.5)/(111)Si(380)/AlN(1.2) f = 49.5 MHz | 1.9 | 200 | 16 | 9900 | 53 ± 0.1 | 8 ± 0.1 | 0.5 ± 0.006 |
| 6 | IDT/ZnO(10)/(100)Si(380)/AlN(0.2) f = 48.8 MHz | 1.9 | 200 | 16 | 9800 | 66 ± 0.1 | 8 ± 0.1 | 0.5 ± 0.006 |
| 7 | IDT/ZnO(10.5)/(100)Si(380) f = 72.75 MHz | 1.9 | 200 | 16 | 14,600 | 68 ± 0.1 | 17.5 ± 0.1 | 1.1 ± 0.006 |
| 8 | IDT/ZnO(10.5)/(100)Si(380) f = 74.76 MHz | 1.9 | 200 | 16 | 15,000 | 77 ± 0.1 | 22.2 ± 0.1 | 1.4 ± 0.006 |
| 9 | IDT/ZnO(8.8)/(100)Si(380)/ZnO(5.6) f = 57.5 MHz | 2.6 | 146 | 16 | 8400 | 61 ± 0.1 | 25 ± 0.1 | 1.6 ± 0.006 |
| 10 | IDT/ZnO(8.8)/(100)Si(380)/ZnO(5.6) f = 51.24 MHz | 2.6 | 146 | 16 | 7500 | 56 ± 0.1 | 18 ± 0.1 | 1.13 ± 0.006 |
| 11 | IDT/ZnO(12.3)/(111)Si (380) f = 32.1 MHz | 1.9 | 200 | 37 | 6400 | 57 ± 0.1 | 18.3 ± 0.1 | 0.5 ± 0.003 |
| No. | Layers (Thickness) (μm)/(μm), Frequency | H/λ | λ, μm | L, mm | Free Structure vth, m/s (U1; U2; U3) α, dB/mm | Structure + H2O vth, m/s (U1; U2; U3) α, dB/mm | Structure + Glycerol vth, m/s (U1; U2; U3) α, dB/mm |
|---|---|---|---|---|---|---|---|
| 1 | AlN(1.8)/(111)Si (250) f = 67.94 MHz | 0.625 | 400 | 45 | 25,515 | 25,514 | 25,485 |
| (1; 0.45; 0.42) | (1; 0.4; 0.3) | (1; 0.45; 0.6) | |||||
| 0 | 0 | 0.1 | |||||
| 2 | ZnO(0.4)/(100)Si (380)/ZnO(10) f = 34.6 MHz | 1.9 | 200 | 16 | 13,937 | 13,936 | 13,917 |
| (1; 0; 0.73) | (1; 0; 0.3) | (1; 0; 0.8) | |||||
| 0 | 0.1 | 0.1 | |||||
| 3 | ZnO(10)/(100) Si(380) f = 43.46 MHz | 1.9 | 200 | 16 | 8438 | 8437 | 8415 |
| (1; 0; 2.86) | (1; 0; 2) | (1; 0; 2.2) | |||||
| 0 | 0 | 0.1 | |||||
| 4 | ZnO(6.3)/(111) Si(380) f = 49.5 MHz | 1.9 | 200 | 37 | 9781 | 9780 | 9767 |
| (1; 1.1; 0.1) | (1; 0.9; 0) | (1; 1.1; 0.1) | |||||
| 0 | 0 | 0.5 | |||||
| 5 | ZnO(6.5)/(111)Si(380)/AlN(1.2) f = 49.5 MHz | 1.9 | 200 | 16 | 9894 | 9893 | 9876 |
| (1; 0.82; 0.22) | (1; 0.6; 0.1) | (1; 0.8; 0.2) | |||||
| 0 | 0 | 0.1 | |||||
| 6 | ZnO(10)/(100)Si(380)/AlN(0.2) f = 48.8 MHz | 1.9 | 200 | 16 | 9342 | 9341 | 9312 |
| (1; 0; 0.09) | (1; 0; 0.01) | (1; 0; 0.1) | |||||
| 0 | 0 | 0.1 | |||||
| 7 | ZnO(10.5)/(100)Si(380) f = 72.75 MHz | 1.9 | 200 | 16 | 14,278 | 14,277 | 14,253 |
| (1; 6140; 1.1) | (1; 120; 0.05) | (1; 130; 0.4) | |||||
| 0 | 0 | 0.55 | |||||
| 8 | ZnO(10.5)/(100)Si(380) f = 74.76 MHz | 1.9 | 200 | 16 | 15,629 | 15,628 | 15,589 |
| (1; 14120; 1.8) | (1; 1500; 1.) | (1; 134; 1.2) | |||||
| 0 | 0 | 0.6 | |||||
| 9 | ZnO(8.8)/(100)Si(380)/ZnO(5.6) f = 57.5 MHz | 2.6 | 146 | 16 | 8365 | 8364 | 8341 |
| (1; 0; 0.012) | (1; 0; 0.002) | (1; 0; 0.015) | |||||
| 0 | 0 | 0.55 | |||||
| 10 | ZnO(8.8)/(100)Si(380)/ZnO(5.6) f = 51.24 MHz | 2.6 | 146 | 16 | 7382 | 7381 | 7364 |
| (1; 0; 0.7) | (1; 0; 0.5) | (1; 0; 0.75) | |||||
| 0 | 0.2 | 0.45 | |||||
| 11 | ZnO(12.3)/(111)Si (380) f = 32.1 MHz | 1.9 | 200 | 37 | 6425 | 6424 | 6395 |
| (1; 2; 0.48) | (1; 1.7; 0.2) | (1; 2.2; 0.3) | |||||
| 0 | 0 | 0.1 |
Disclaimer/Publisher’s Note: The statements, opinions and data contained in all publications are solely those of the individual author(s) and contributor(s) and not of MDPI and/or the editor(s). MDPI and/or the editor(s) disclaim responsibility for any injury to people or property resulting from any ideas, methods, instructions or products referred to in the content. |
© 2023 by the authors. Licensee MDPI, Basel, Switzerland. This article is an open access article distributed under the terms and conditions of the Creative Commons Attribution (CC BY) license (https://creativecommons.org/licenses/by/4.0/).
Share and Cite
Smirnov, A.; Anisimkin, V.; Shamsutdinova, E.; Signore, M.-A.; Francioso, L.; Zykov, K.; Baklaushev, V.; Kuznetsova, I. Acoustic Waves in Piezoelectric Layered Structure for Selective Detection of Liquid Viscosity. Sensors 2023, 23, 7329. https://doi.org/10.3390/s23177329
Smirnov A, Anisimkin V, Shamsutdinova E, Signore M-A, Francioso L, Zykov K, Baklaushev V, Kuznetsova I. Acoustic Waves in Piezoelectric Layered Structure for Selective Detection of Liquid Viscosity. Sensors. 2023; 23(17):7329. https://doi.org/10.3390/s23177329
Chicago/Turabian StyleSmirnov, Andrey, Vladimir Anisimkin, Elizaveta Shamsutdinova, Maria-Assunta Signore, Luca Francioso, Kirill Zykov, Vladimir Baklaushev, and Iren Kuznetsova. 2023. "Acoustic Waves in Piezoelectric Layered Structure for Selective Detection of Liquid Viscosity" Sensors 23, no. 17: 7329. https://doi.org/10.3390/s23177329
APA StyleSmirnov, A., Anisimkin, V., Shamsutdinova, E., Signore, M.-A., Francioso, L., Zykov, K., Baklaushev, V., & Kuznetsova, I. (2023). Acoustic Waves in Piezoelectric Layered Structure for Selective Detection of Liquid Viscosity. Sensors, 23(17), 7329. https://doi.org/10.3390/s23177329