Figure 4.
Time series of sEMG signals for three respiratory muscles EMG
SC, EMG
IC, and EMG
RA and one nonrespiratory muscle EMG
BR, respectively, from top to bottom, which are given for a representative apneist
BHr3 (BHD Rank #1;
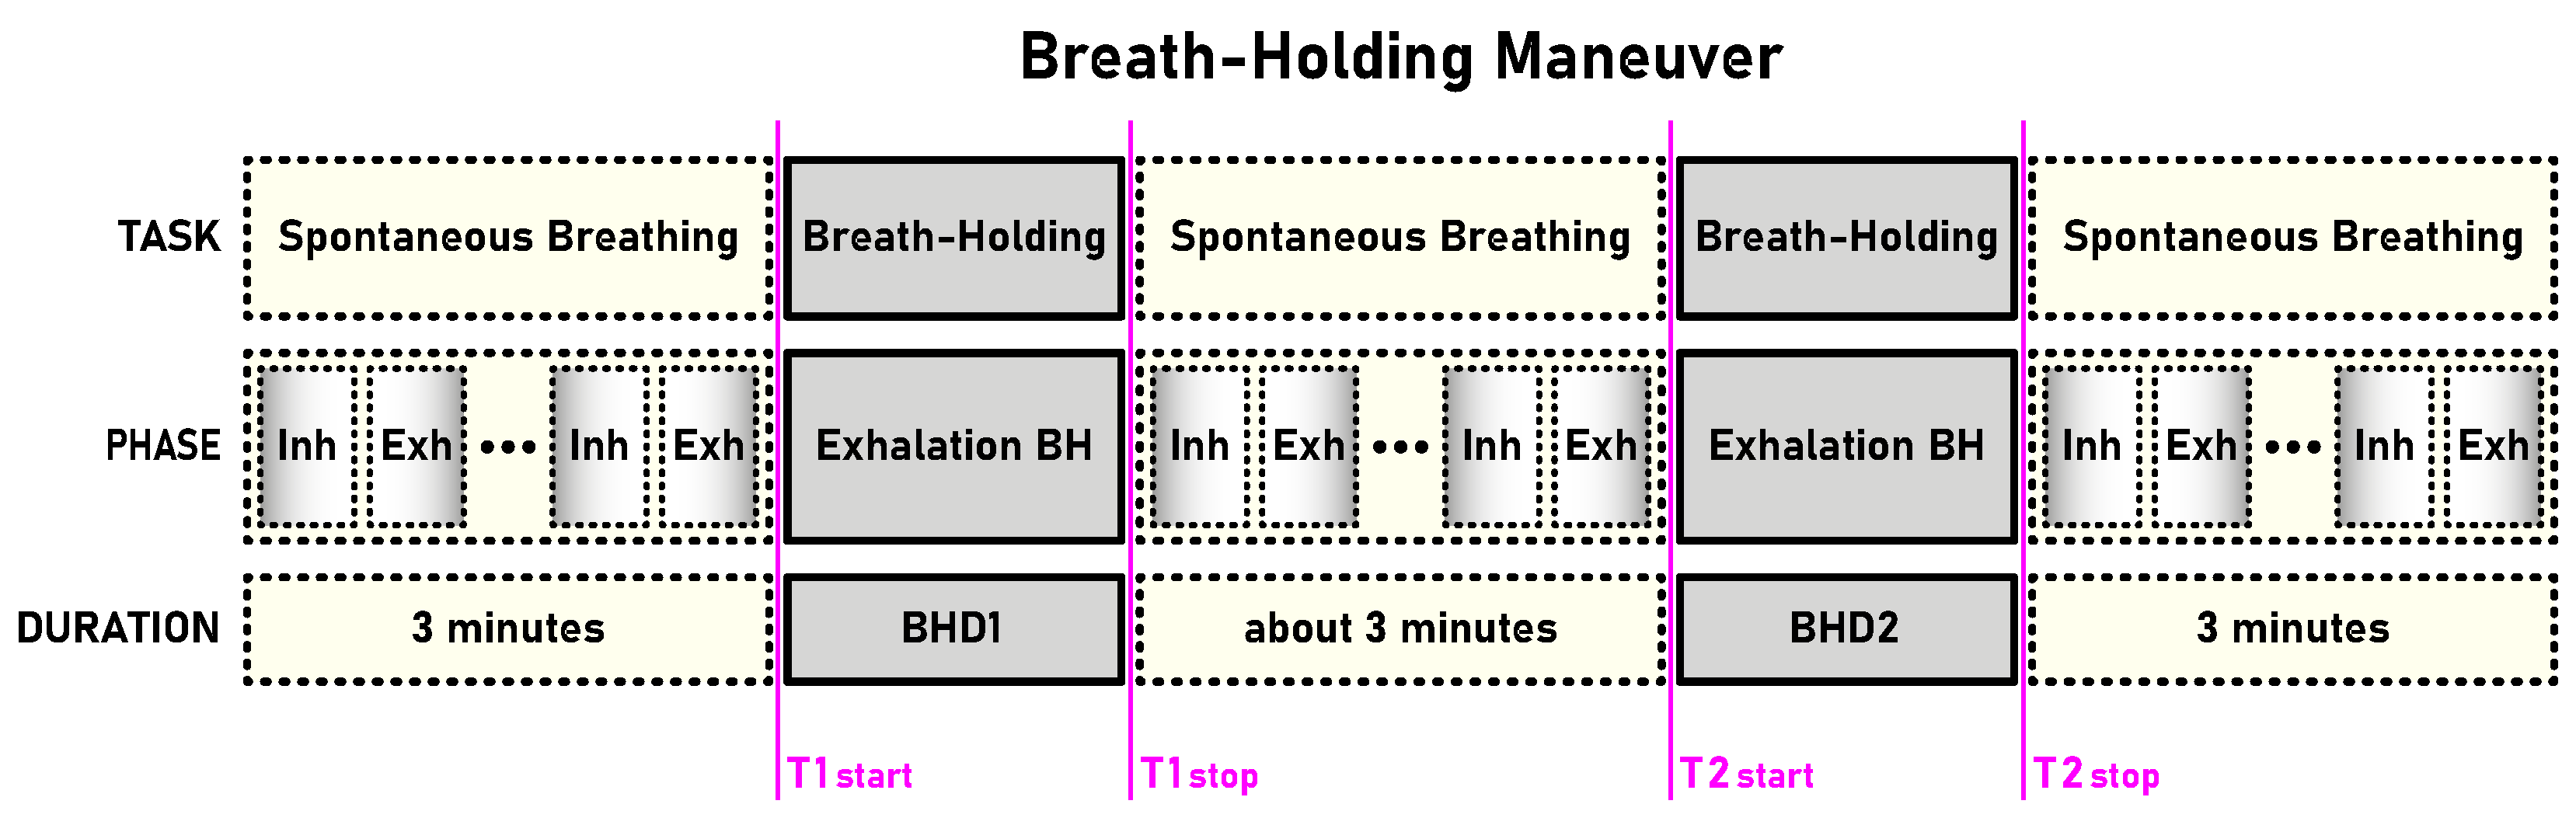
Table 1). The first and second BH phases (BH1 and BH2) are marked with time markers (T1start/T1stop and T2start/T2stop,
Figure 1) and colored rectangles, while their colors correspond to the sensor colors in
Figure 2. In the final stages of BH, a gradual increase in the magnitudes of EMG
SC, and especially EMG
IC, was noticeable in both BH1 and BH2 periods.
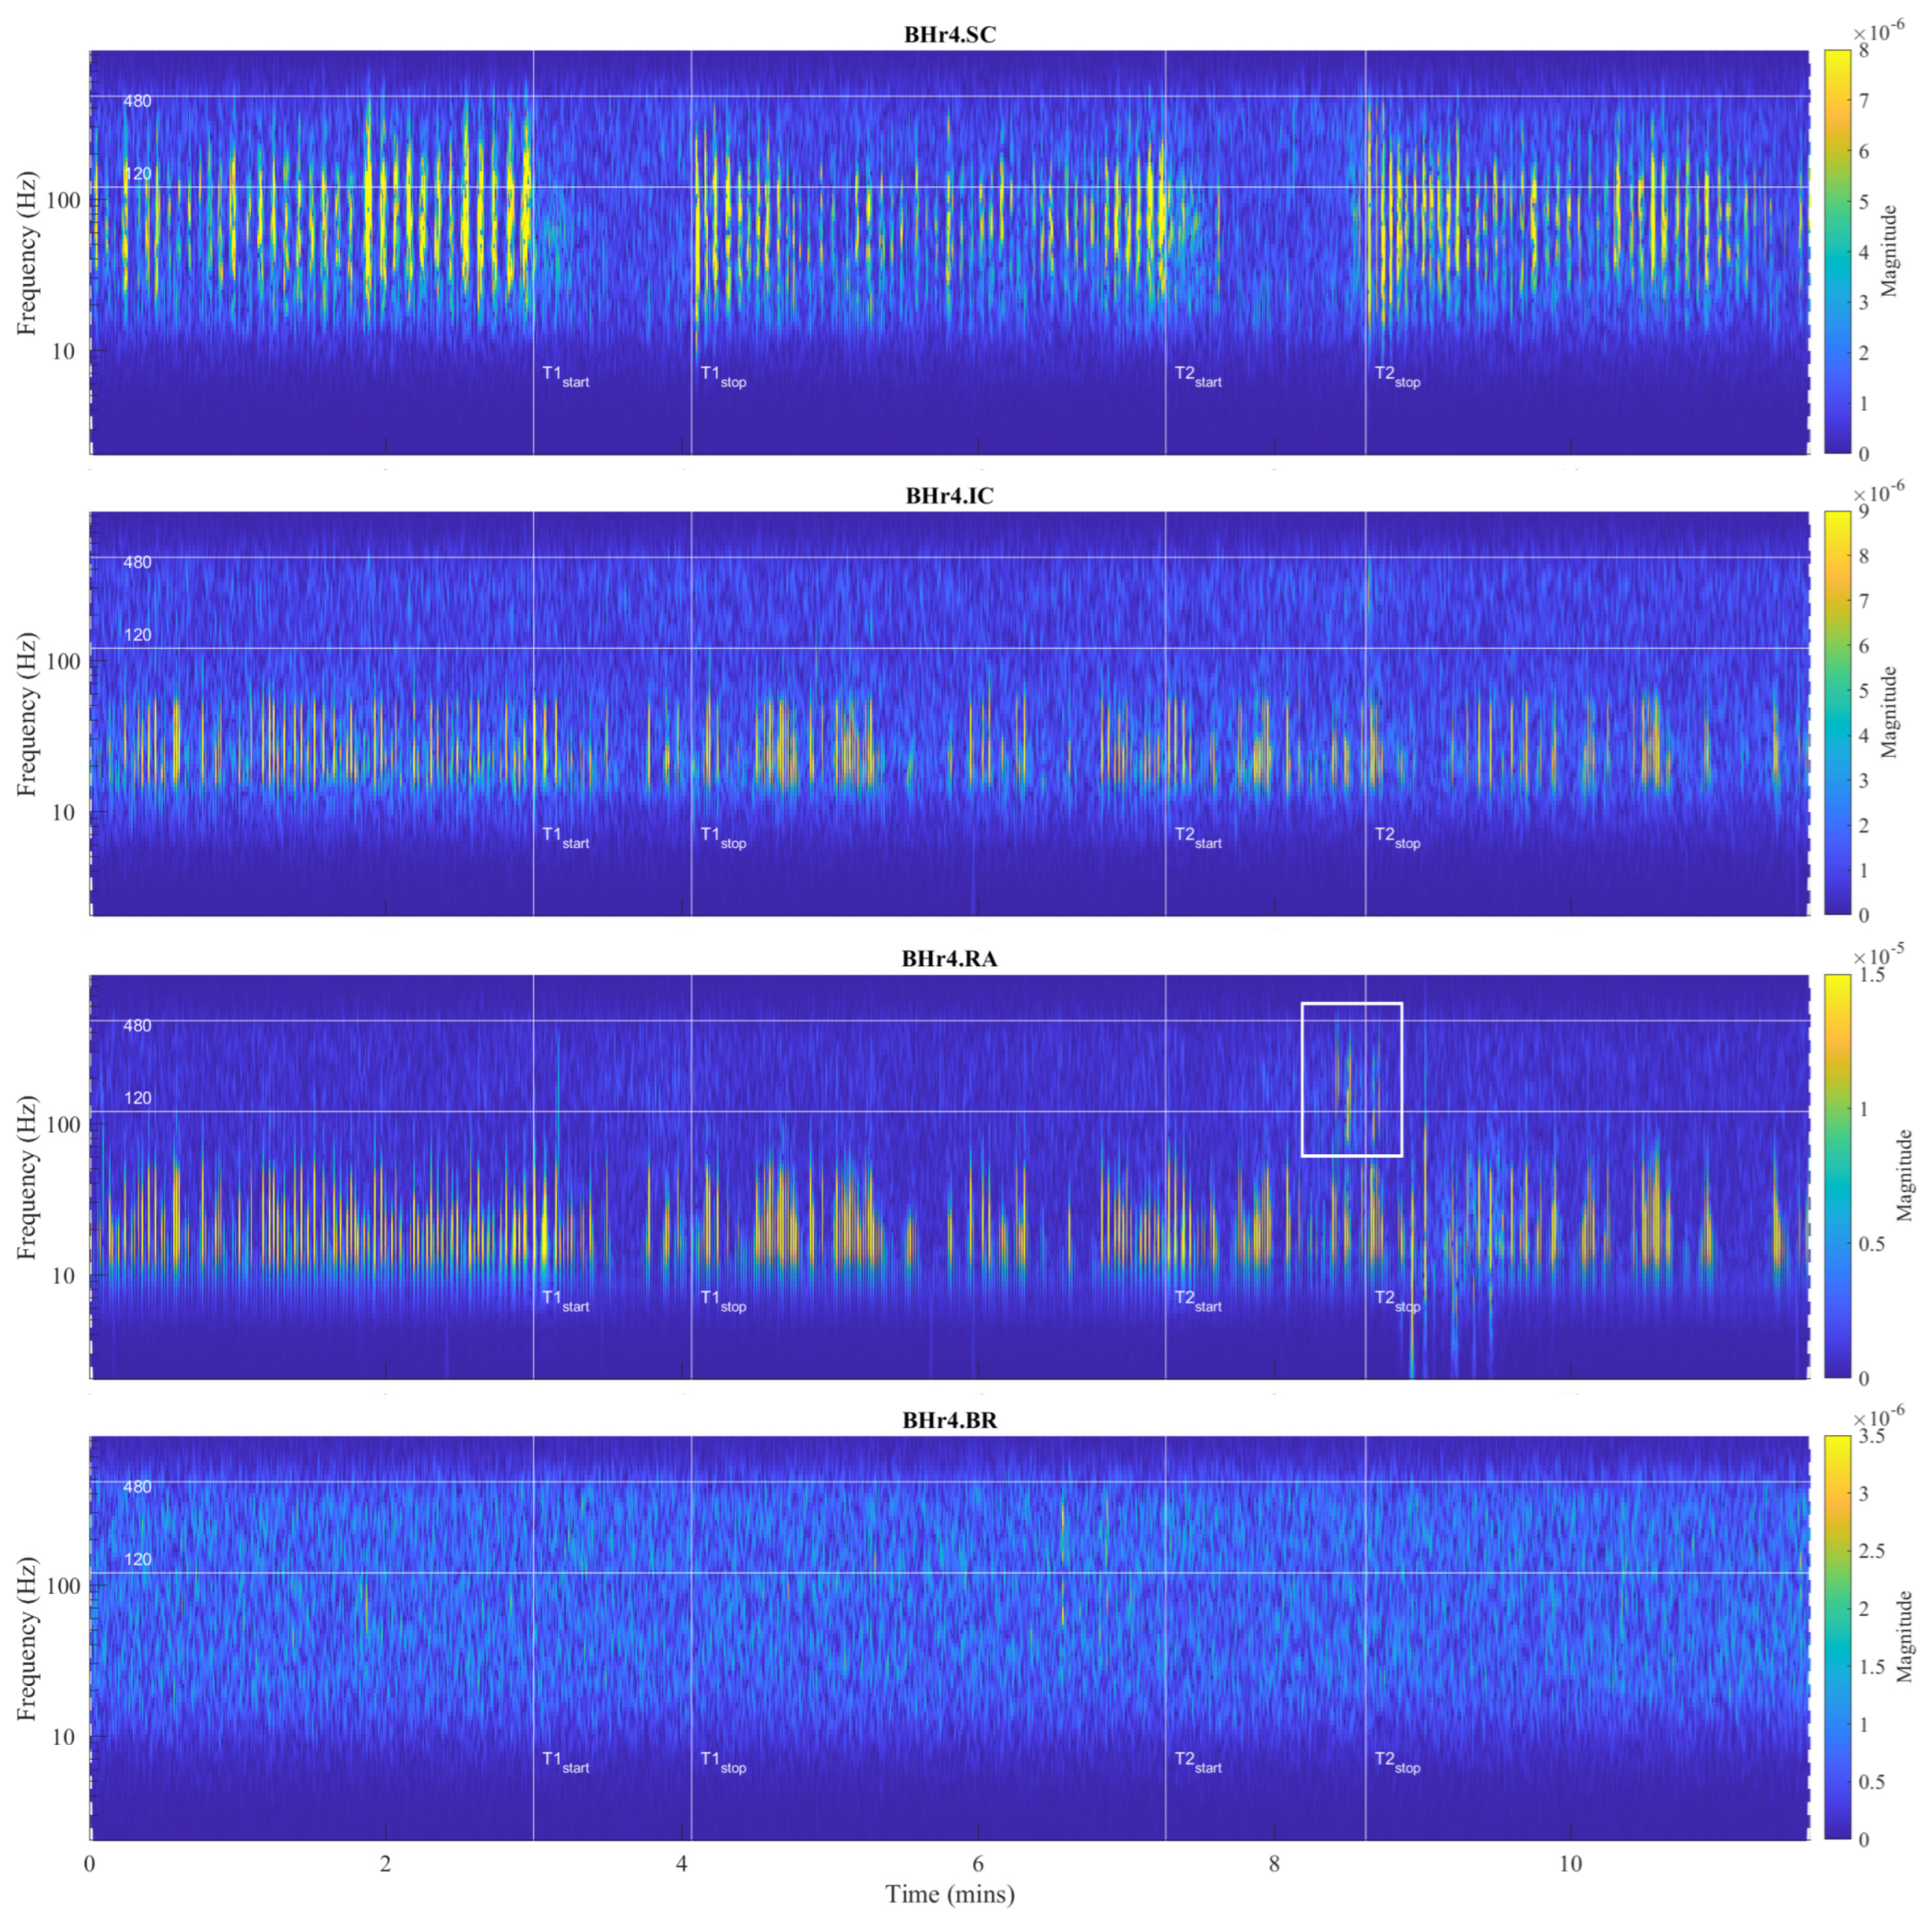
Figure 5.
Time series of EMG
SC, EMG
IC, and EMG
RA, and EMG
BR, respectively, from top to bottom, which are given for a representative apneist
BHr4 (BHD Rank #1, highest BHD score;
Table 1). Other descriptive notes in the caption for
Figure 4. In contrast to BHr3, limited or no changes were observed in EMG
SC and EMG
IC; however, abrupt changes in EMG
RA magnitudes were present in the final stages of BH2, indicating a different BH response mechanism.
The main observed effects of the prolonged BH for these two representative cases were different. For the BHr3, it consisted in a gradual increase of the sEMG magnitudes of the inspiratory muscle signals starting from the second half of the BH periods. This was noticeable for the EMGSC signal, but it was significantly more pronounced for the EMGIC signal. For the BHr4, we observed a somewhat opposite effect—the abrupt changes in the magnitudes of the expiratory muscle RA signal.
4.2.1. Power Spectral Analysis
The sEMG signals in the time domain show us different types of responses to breath holding. In order to understand in more detail how the frequencies and power of the signal change over time, we compared the responses in the initial and final stages of the BHs. To study the changes in the frequency response, we calculated the occupied bandwidth (OBW), which gives a frequency range of the signal containing 99% of the total integrated power of its spectrum. The OBW is the frequency difference between points where the integrated power crosses 0.5% and 99.5% of the total power in the spectrum. To determine the OBW, we first estimated a periodogram power spectral density using a rectangular window and then integrated the estimate using the Riemann sum (midpoint rule). The OBW was calculated for a time interval of 3 s, while the locations of the time intervals were shifted by 2 s inwards from the BH phase boundaries, i.e., the BH initial stage was calculated from Tstart+2 to Tstart+5 (in seconds), while the BH final stage was calculated from Tstop-5 to Tstop-2 (in seconds).
In
Figure 6, we show a comparison of the occupied bandwidth (OBW) characteristics of the initial and final stages of the BHs (combined for BH1 and BH2) of the muscle sEMG signals for the case of the combined 12 naive apneists. Each column represents the OBW of the individual muscle sEMG signals of the SC, IC, RA, and BR muscles in order from left to right, which corresponds to the order of sensors from top to bottom in
Figure 2. We can observe that the lower bounds approximately stayed the same, while the upper bounds increases for EMG
SC, EMG
IC, and EMG
RA. As a result, the width of the OBW increased for these three signals, and it stayed the same for EMG
BR. The occupied band power, which represents the signal power within the OBW, slightly increased for EMG
IC, whereas it was not visibly changed for the other signals. We noticed that the combined effect of the heart rate drop took place, together with an increased response of the muscle sEMG signals, which was not easily discerned in these combined graphs. This motivated more detailed signal analysis of both the time and frequency so that we could better see various influences that overlapped each other and how the signals changed their frequencies and energies over time.
Figure 6.
Comparison of the occupied bandwidth (OBW) estimates (the width of the frequency band that contains 99% of the power of the signal, the lower and upper bounds of the band, and the power in the band), of the muscle sEMG signals in the initial and final phases of breathholding (during BH1 and BH2). The lower bounds were about 7 Hz, which were a consequence of an AC-coupling filtering with 7 Hz highpass filter that strongly attenuated lower frequencies in the sEMG signals. As a result, the upper bounds were similar to the occupied bandwidth. The increase in occupied bandwidth was most pronounced for IC, followed by SC. The occupied band power was the highest for RA and the lowest for BR, which indicated that it was necessary to normalize the power in order to be able to compare the change in the initial and final BH phases for different muscles.
4.2.2. Frequency Range of Muscle Response Using Scalograms
Our study used the Daubechies (
db) wavelets family, specifically
db8 (of order eight), as one of the most suitable mother wavelets for the sEMG signal analysis according to [
45]. In line with their recommendation [
38], higher-order wavelets were used in order to achieve the lowest possible interactions between the decomposed components. The mother wavelets
db8 [
45] and
sym8 [
38] were compared; however, the
db8 wavelets slightly better concentrated the energy into active components, while their asymmetry did not affects the translation of the signal due to the high sampling frequency
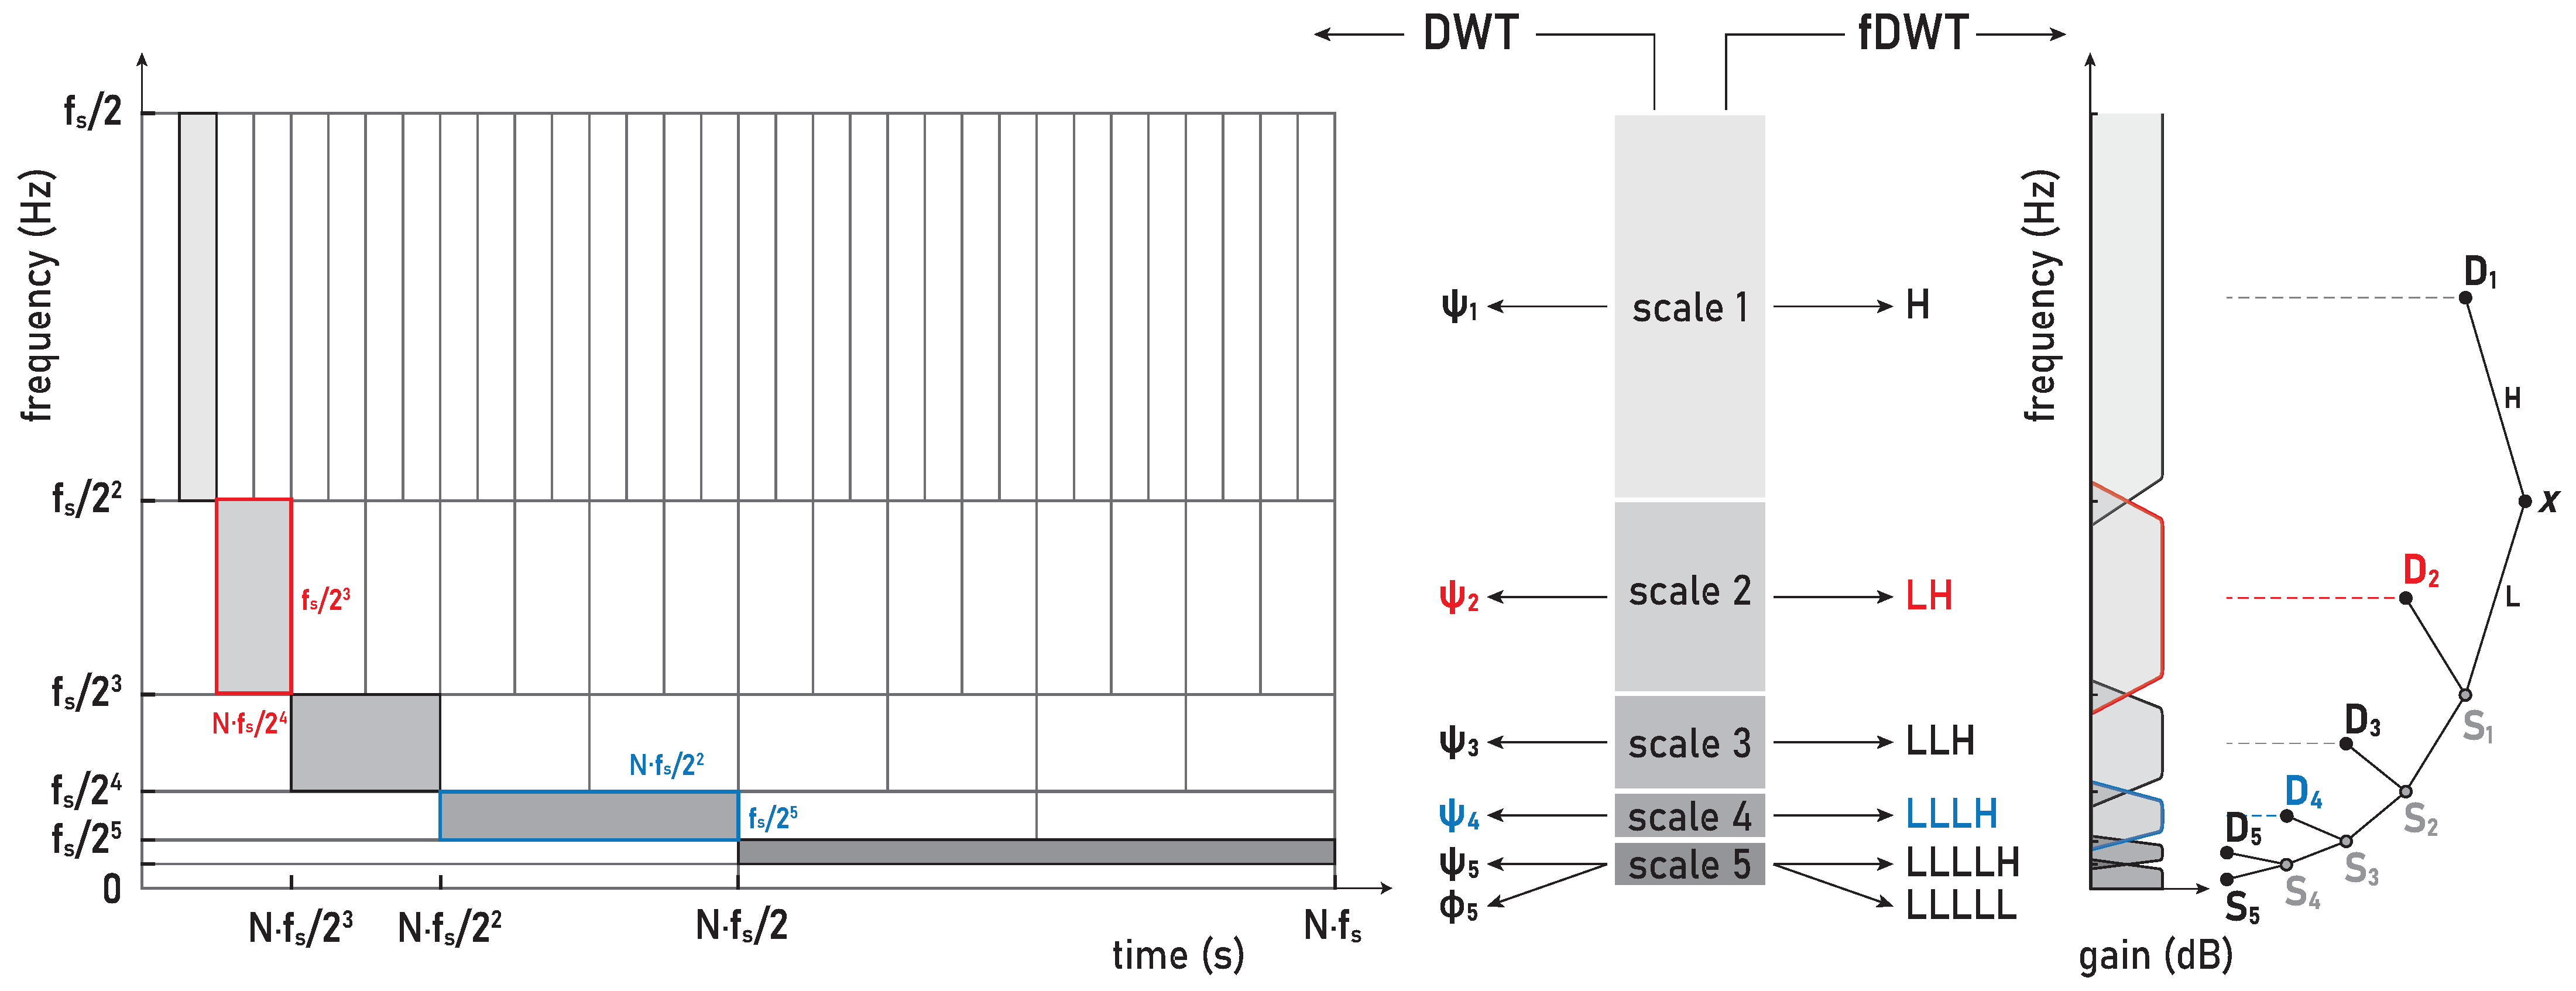
Hz. Hence, our WMRA split the sEMG signals in the frequency bands D1–D8 and S8, as are defined in the following: D1 (481–963 Hz), D2 (241–481 Hz), D3 (120–241 Hz), D4 (60–120 Hz), D5 (30–60 Hz), D6 (15–30 Hz), D7 (7–15 Hz), D8 (4–7 Hz), and S8 (0–4 Hz).
For the visual detection and the T-F localization of the transient phenomena in the respiratory muscle sEMG signals, as well as for the interfered oscillatory cardiac (QRS) activity, first we used scalograms (
Section 3.1). CWT and MODWT analysis showed that, for the selected group of respiratory muscles in this study, the dominant muscle response and, thus, the physiological break point in all subjects, occurred in two respiratory muscles—either the inspiratory IC or the expiratory RA. The scalograms of the two representative cases for these two types of muscle responses are provided as follows:
Figure 7 shows results for apneist BHr3 (BHD Rank #1) with a dominant response at the inspiratory IC (see sEMG time series for BHr3 in
Figure 4);
Figure 8 shows results for apneist BHr4 (BHD Rank #1, highest BHD score) with a dominant response at the expiratory RA (see sEMG time series for BHr4 in
Figure 5).
In order to analyze the contributions of the higher and lower frequencies to the sEMG signals, it is worth noting that the sEMG frequency spectrum lies between 20 Hz (or lower) and 500 Hz and that, for respiratory muscles, the high frequency range is defined at 130–250 Hz, and the low frequency range is defined at 30–50 Hz [
46]. In accordance with these standards, we assumed the following division of the frequency bands (FBs): very high FB—VHFB (250–500 Hz), high FB—HFB (130–250 Hz), medium FB—MFB (50–130 Hz), and low FB—LFB (30–50 Hz). By comparing the WMRA and standard FB division, we can determine the following approximate correlation: D2∼VHFB, D3∼HFB, D4∼MFB, and D5∼LFB.
For BHr3, the most pronounced muscle activity related to the apneic response was at the IC in the D2/VHFB and less in the D3/HFB, which was characterized by a progressive increase in the EMGIC energy density centered around 300 Hz that started approximately in the middle of the BH and ended abruptly immediately after breath reinstatement. Very slight correlated changes in the same FBs were also observed for the EMGSC. In contrast, for the BHr4, no obvious increased sEMG activity was observed in the inspiratory muscles SC and IC, but there was abrupt activation of the expiratory muscle RA in the D3/HFB and less in the D4/MFB, which therefore resulted in a lower FB than for the inspiratory muscles.
Muscle activation accompanied by changes in the sEMG amplitude and energy/power spectral density is generally achieved by varying the combination of the motor unit (MU) recruitment and the modulation of the firing rate. The MU morphological features such as the number, spatial distributions (cross-sectional area), and the composition of muscle fibers are the major determinants of MU potential. Based on previous studies [
47,
48,
49], these three partially dependent factors contribute differently to the variation in the motor unit action potential (MUAP) waveform and, thus, to the electromyographic activity and force generation—the geometric factors have a greater influence on the amplitude of the sEMG signal, while the fiber type has a greater influence on its spectral characteristics.
Three types of fibers are known to exist in human skeletal muscles, each with specific contractile and biochemical characteristics such that different compositions of fibers in a muscle are adapted to muscle functions in the body. The main biochemical characteristics of the fibers are related to the metabolic pathways for energy supply and oxidative capacity. According to the contractile properties and oxidative capacity, fibers are commonly categorized into slow-twitch slow oxidative (type 1), fast-twitch fast oxidative/glycolytic (2A), and fast-twitch fast glycolytic fibers (2X). Type 1 fibers use mainly oxidative phosphorylation, which makes them resistant to fatigue and, hence, are mainly involved in aerobic activities and endurance exercises. In contrast, type 2 fibers rely mainly on glycolytic metabolic pathways for energy supply, have faster contraction velocities than type 1 fibers, and are not fatigue-resistant. These types of fibers are predominant in the skeletal muscles of adult humans, but, in addition to them, these muscles of specific functions may contain other types, as well as “hybrid” types of fibers [
50].
The recruitment pattern of MUs usually follows the principle of orderly recruitment according to their motor neuron size. Because MUs with slow type 1 fibers have smaller motor neurons, and those with fast-twitch type 2 fibers have larger ones, the order of recruitment is also related to MU fiber type composition. Hence, skeletal muscle contraction involves progressive recruitment in an additive manner and in the following order:
[
50]. Since an interference signal of all generated MUAPs defines the properties of the sEMG, the MU recruitment pattern reflects the spectral characteristics of the muscle activity such that fast fibers generate higher frequencies within the myoelectric spectrum than slow fibers [
47]. The
hypoxia-induced progressive activation of larger MUs with faster fibers during apnea can significantly explain the pattern of gradual changes in the EMG
SC and EMG
IC spectral characteristics in inspiratory muscles of BHr3 [
9,
51], but this explanation is unsatisfactory for the case of apneist BHr4 (
Figure 8).
Although the generated MUAPs mainly depend on the MU recruitment pattern, other specific factors can significantly influence the modulation of the firing rate of MUAPs. In addition to hypercapnia induced by prolonged apnea, muscle contractions cause an increase in the concentration of lactic acid and other metabolic products, which leads to a decrease in intracellular pH and, consequently, to a decrease in muscle fiber conduction velocity [
47,
48,
49]. The compensatory mechanism in maintaining or increasing the muscle contractile force despite the decrease in fiber conduction velocity induces a direct change in the shape of the MUAP waveform, which leads to an increase in various parameters of the waveform (duration, area, amplitude, etc.). Thus, these changes in MUAP characteristics induced by pH reduction directly influence greater electromyographic responses, but they do not imply correspondingly greater MU recruitment and muscle activation. In the case of the BHr4 apneist, as well as other apneists that held their breath for about 1 min at FRC (which at TLC could correspond to approximately twice as long the BHD [
43]), we suggest that the sudden activation of the RA was primarily the result of
hypercapnic stimulation.
The observed differences in the responses of the respiratory muscles to apnea-induced hypoxia and hypercapnia for apneists BHr3 and BHr4 are supported by well-known differences in the response of respiratory muscles to hyperventilation. Namely, for the equivalent minute volume, hypoxia mainly stimulates inspiratory muscles, while hypercapnia stimulates both inspiratory and expiratory groups [
41]. Moreover, while diaphragmatic EMG activity increases in response to both hypercapnia and hypoxia, expiratory muscle activity increases almost exclusively during hypercapnic hyperventilation [
42]. Abdominal muscles are generally expiratory, and RA, one of the important abdominal expiratory muscles, is known to play an important respiratory role during physical exercise and hypercapnia [
42].
It was thought that hypoxia and hypercapnia were simply additive in their effects, but, due to complexity, a hybrid model of integration of possible additive, hyperadditive, and hypoadditive interactions between the central and peripheral chemoreceptors in relation to systemic
was proposed, where the form of interaction generally depends on the behavior and/or metabolism of the individual [
52,
53]. In this regard, the case of apneist BHr12 (BHD Rank #3, the lowest BHD score) is particularly indicative, where we can observe two phenomena by comparing the scalograms for the EMG
SC and EMG
IC signals shown in
Figure 9. First, we observed a correlation of the neuromuscular activity for the SC and IC inspiratory muscles in the approximate frequency range of 120–480 Hz, which constituted the same characteristic D2/VHFB and D3/HFB results that were present in the IC and partially SC muscle responses to apnea in the BHr3 (scalograms were adopted to assess muscle cocontraction [
54]). This correlation could be partly attributed to the intercostal–scalene reflex related to the phrenic nerve [
55]. Second, there was a disproportionate increase in the IC electromyographic activity compared to the breath-hold duration (average BHD was 22 s, which was a period in which BHr3 and BHr4 had no response). The explanation may be in the mentioned ’silent’ or ’apathetic’ hypoxia and respiratory muscle weakness as the consequences of the previously acquired disease of COVID-19, while it is also known that COVID-19 can induce lactic acid production accompanied by uncompensated respiratory acidosis, decreased plasma pH, hypercapnia, and more [
44]. This can be linked to the previous comment regarding a decrease in muscle fiber conduction velocity and an increase in sEMG activity without a proportional increase in muscle activity. Similarly, some other respiratory diseases can lead to a disproportionate increase in neural respiratory drive directed towards the respiratory muscles [
48,
49]. The correlation of the respiratory muscles with physical performance/training is also shown by respiratory muscle training [
56,
57].
Large interindividual variations in the physiological response to hypoxic and/or hypercapnic stimulation during apnea could be explained by a heterogeneous tissue of human skeletal muscle, as well as metabolic, energetic, and neuromuscular differences. Our analysis showed that, among the selected muscles, the individual specificities of the neuromuscular coupling in the participants were most pronounced in the SC, as demonstrated in the case of the apneist BHr6 (BHD Rank #1)—who is a professional diver (
Figure 10).
The claims we made in this section could be partially confirmed if a relationship could be established between the spectral features of the sEMG activity and the BHD, so we first examined the reproducibility of the spectral features of the sEMG activity during the BH1 and BH2 using wavelet MRA (WMRA).
Figure 9.
Correlations of neuromuscular coupling for inspiratory muscles SC and IC were demonstrated by comparing scalograms for EMG
SC and EMG
IC signals of naive apneist
BHr12 (BHD Rank #3). Correlation of areas of high energy density for EMG
SC and EMG
IC signals in the T-F plane were characteristic for the approximate FB of 120–480 Hz. This was the same FB for the increased energy density of the BH final stages for EMG
IC signals in both BHr12 and BHr3, as shown in
Figure 7, thus indicating that this FB is characteristic of increased IC electromyographic activity, regardless of the primary stimulus.
Figure 10.
Individual specificities of neuromuscular coupling in participants for SC were demonstrated by comparing the scalograms for EMG
SC signals of apneist
BHr6 (BHD Rank #1) with BHr4 (BHD Rank #1, which are presented in
Figure 8). During the BH maneuver, participant BHr4 (rower) showed higher SC activity during spontaneous breathing (areas of high energy density for EMG
SC signal in the T-F plane are related to inspiration), while BHr6 (diver) showed greater SC activity during breath holding.
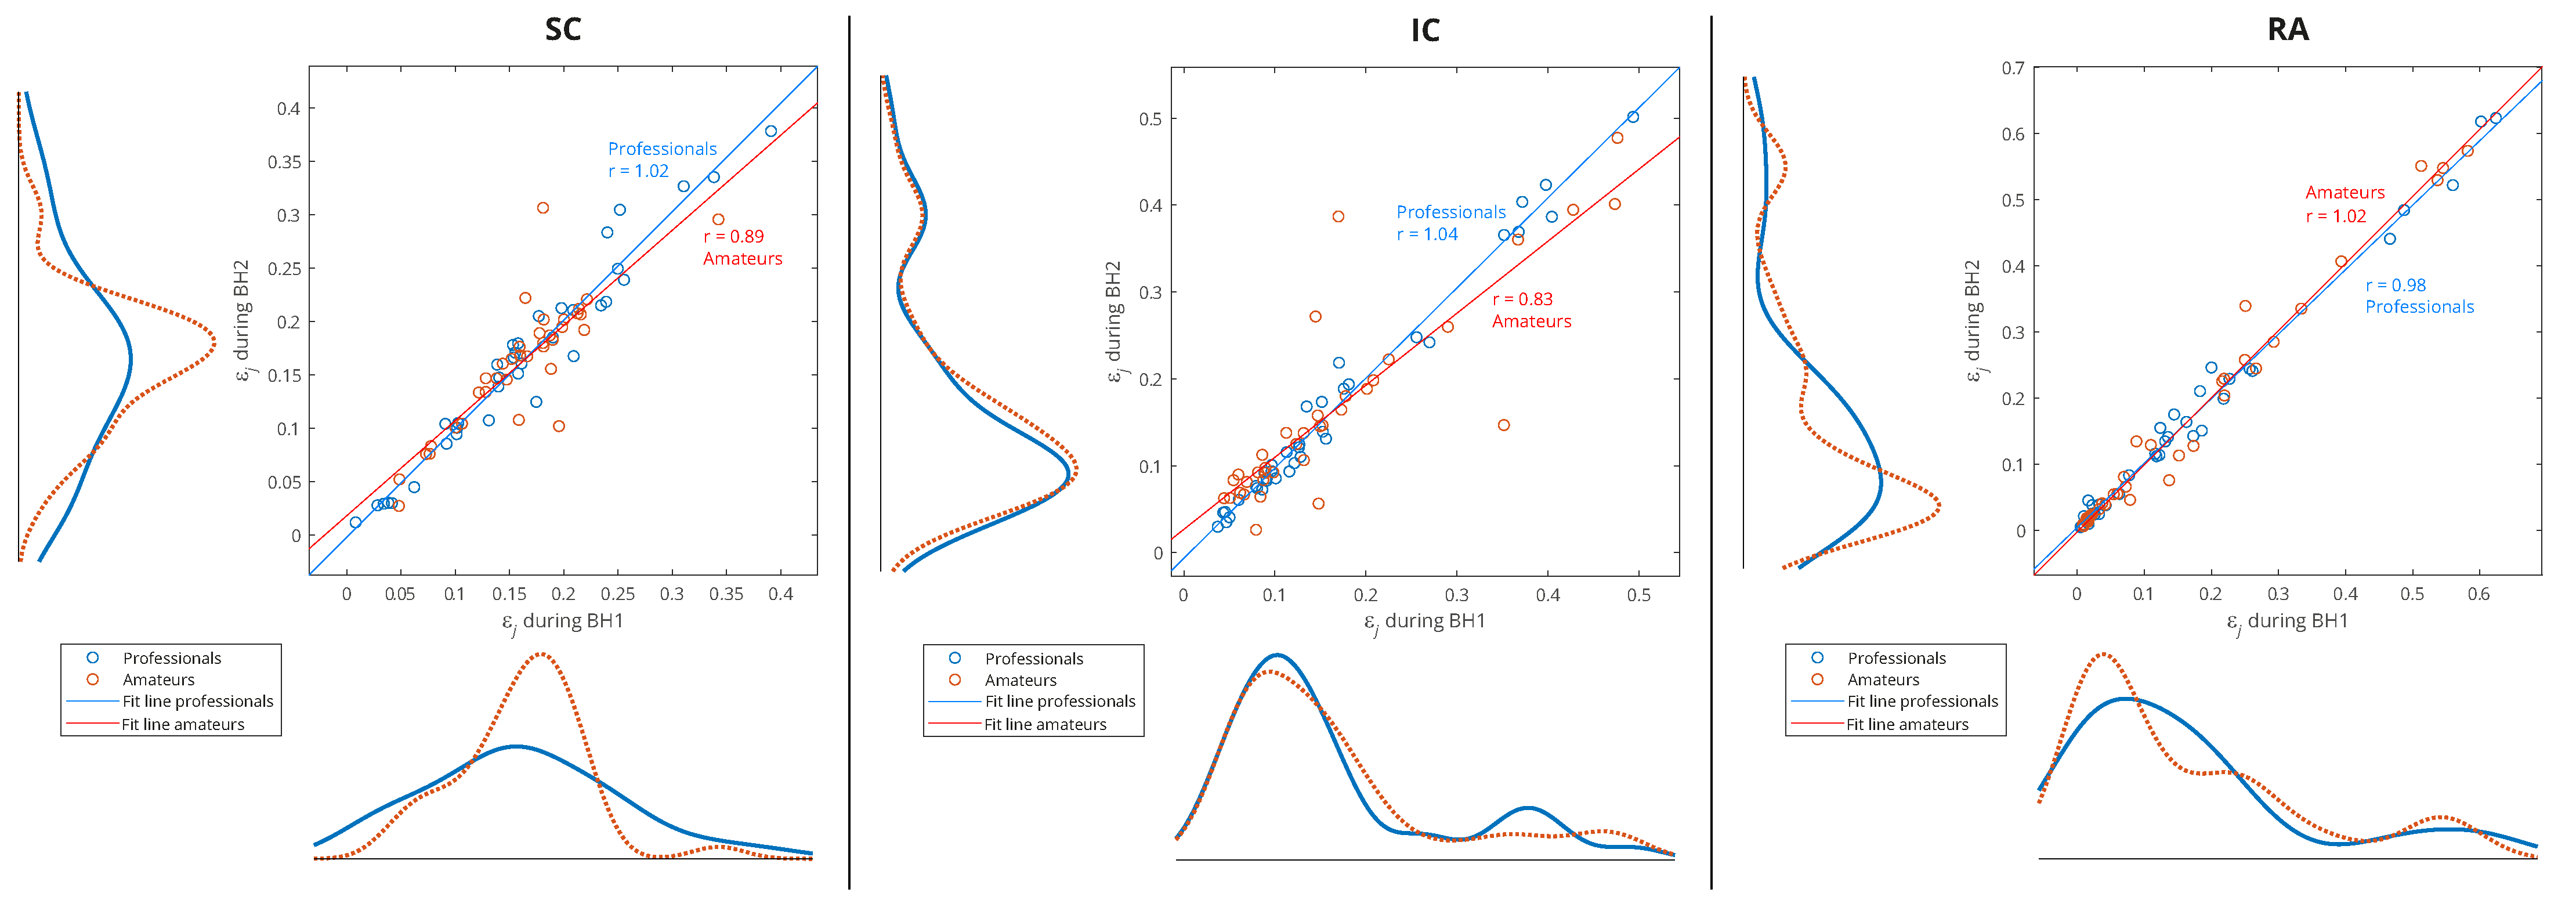
4.2.3. Muscle Response Reproducibility Analyses Using WMRA
In order to analyze the relationship between the two groups of data—the distributions of the relative energies
of the WMRA components during BH1 and BH2, and, thus, muscle-activation reproducibility—the scatter plots with marginal histograms are presented in
Figure 11 and
Figure 12. They show the distributions of relative energies of the respiratory signals EMG
SC, EMG
IC, and EMG
RA, which were determined using a probability density estimate based on the normal kernel function. To avoid a strong bias in the distributions, we excluded the D1, D8, and S8 scales, as these components had very small relative energies compared to the other scales and would otherwise create large peaks in the distribution around zero. In this way, we focused on the frequency components D2–D7 in the range from about 7 Hz to 500 Hz.
In
Figure 11, the data of all the participants from both BH periods were used (
x-axis: BH1 and
y-axis: BH2), and the distributions are shown for three types of data grouping: professionals vs. amateurs (left), respiratory muscle signal type (middle), and WMRA components (right). We can notice that the energy distributions of professionals and amateurs were approximately the same (see
Figure 11, left), which means that, on average, the populations of different subjects behaved similarly. At the same time, a strong correlation was observed between BH1 and BH2, since the coefficient of the linear regression model was approximately one, which provided the basis for the integral analysis of BH1 and BH2.
Figure 11.
Joint distribution of relative energies of wavelet MRA (WMRA) components of respiratory signals EMGSC, EMGIC, and EMGRA of all participants for three types of data grouping: professional/amateur (left), respiratory signal type (middle), and MRA components (right). The distributions were determined using a probability density estimate based on a normal kernel function. The lines of best fit of the two data sets, professionals and amateurs, are calculated using linear regression, where r is the appropriate estimate of the regression slope.
Observing the maximum values of probability density for the relative energies in
Figure 11 (middle) indicates some biases between different muscles. The RA was characterized by a large number of components with low relative energy and a small number of components with a larger range of high relative energies, which mostly exceeded the relative energy values of the components for the SC and IC. On the contrary, the SC had the narrowest distribution, and the maximum shifted most to the right, which means that the relative energies by components were most evenly distributed (similar energies for all D2–D7 spectral components) and showed higher values compared to the RA and IC. The characteristics of the IC were somewhat in between the SC and RA, with two peaks of the accumulation of relative energies. Compared to
Figure 11 (right), we can conclude that high relative energies mostly originated from the D6 signal component (15–30 Hz), which had an interference with cardiac electromyographic activity that pushed the energies towards higher values, especially for the EMG
RA and then for the EMG
IC signals (corresponding to the second distribution peak with a smaller number of components of higher relative energies). This general distribution of relative energy across the respiratory muscles is consistent with the energy density distribution in the T-F plane of their corresponding scalograms (
Figure 7 and
Figure 8).
Additionally,
Figure 11 (right) shows that the relative energies at all scales had similar behavior, except for D5 and D6. While we gave an explanation for D6, the distribution of D5 most closely corresponded to the distribution of the SC, especially for high relative energies, which indicated the negligible influence of the D6 and D7 components. The narrow distribution of the D5 was a result of an accumulation of components of approximately similar relative energies that originated from different muscles and subjects—this indicates that it corresponded to a frequency range of the SC that was not significantly involved in apnea-induced muscle activity.
Since one of our goals was to find out which muscle was the most appropriate for IBM detection and characterization, we performed an analysis of the separate distributions of each of the respiratory muscles for grouping by sporting activity—professionals vs. amateurs (
Figure 12). As there was also a partial correlation with the BHDs (
Section 4.1) for this type of grouping, we gave an interpretation of some results in that context as well.
Figure 12.
Separated distributions of relative energies of WMRA components of respiratory signals EMG
SC, EMG
IC, and EMG
RA of all participants for professional/amateur grouping. As in the caption of
Figure 11, the lines of best fit of the two data sets, professionals and amateurs, are calculated using linear regression, where
r is the appropriate estimate of the regression slope. A comparison of the distribution curves for professionals and amateurs shows that they most closely matched for the IC.
A consistent overlap of the distribution curves for professionals and amateurs was noticeable only for the IC, while for the RA and especially the SC, they differ (
Figure 12). Since the IC distribution was very similar for widely varying values of the BHD (from
to
s), it follows that the apneic response of the IC is largely universal in the healthy population. In contrast, there was a significant difference in the distributions for the SC: the wide distribution for professionals points to a strong energy redistribution for a longer BH. Finally, for the RA muscle in the professional population, there was a distribution of energy from components with high relative energies to components with medium energies, which was not noticeable for amateurs (this can be more clearly seen in Figure 15, for Rank #1 subjects). This can be explained by the more pronounced heart rate drop that accompanied longer periods of BHs for professionals.
4.2.4. Correlation Analyses of Muscle Activation and BH Duration Using WMRA
In
Section 4.2.3, we analyzed the relative energies of the wavelet MRA components for the entire interval of the BH duration, but our goal now was to visualize and quantify the changes in relative energies during the development of the apneic response. We used the moving variance to visualize the transient process (as explained in
Section 3.2.2), while the absolute difference of the normalized wavelet energy spectra (
Section 3.2.1) between the BH final stage and BH initial stage was used to quantify energy changes during IBM.
The moving variance is a common tool for detecting short-term fluctuations and long-term trends or cycles in a time series. Since the moving variance is a type of convolution (nonlinear filter), it is calculated using the sliding window method. Here, it was applied to the WMRA components using a centered window of 1.5 s (2889 samples), where this fixed window length was chosen to contain approximately two cardiac RR intervals.
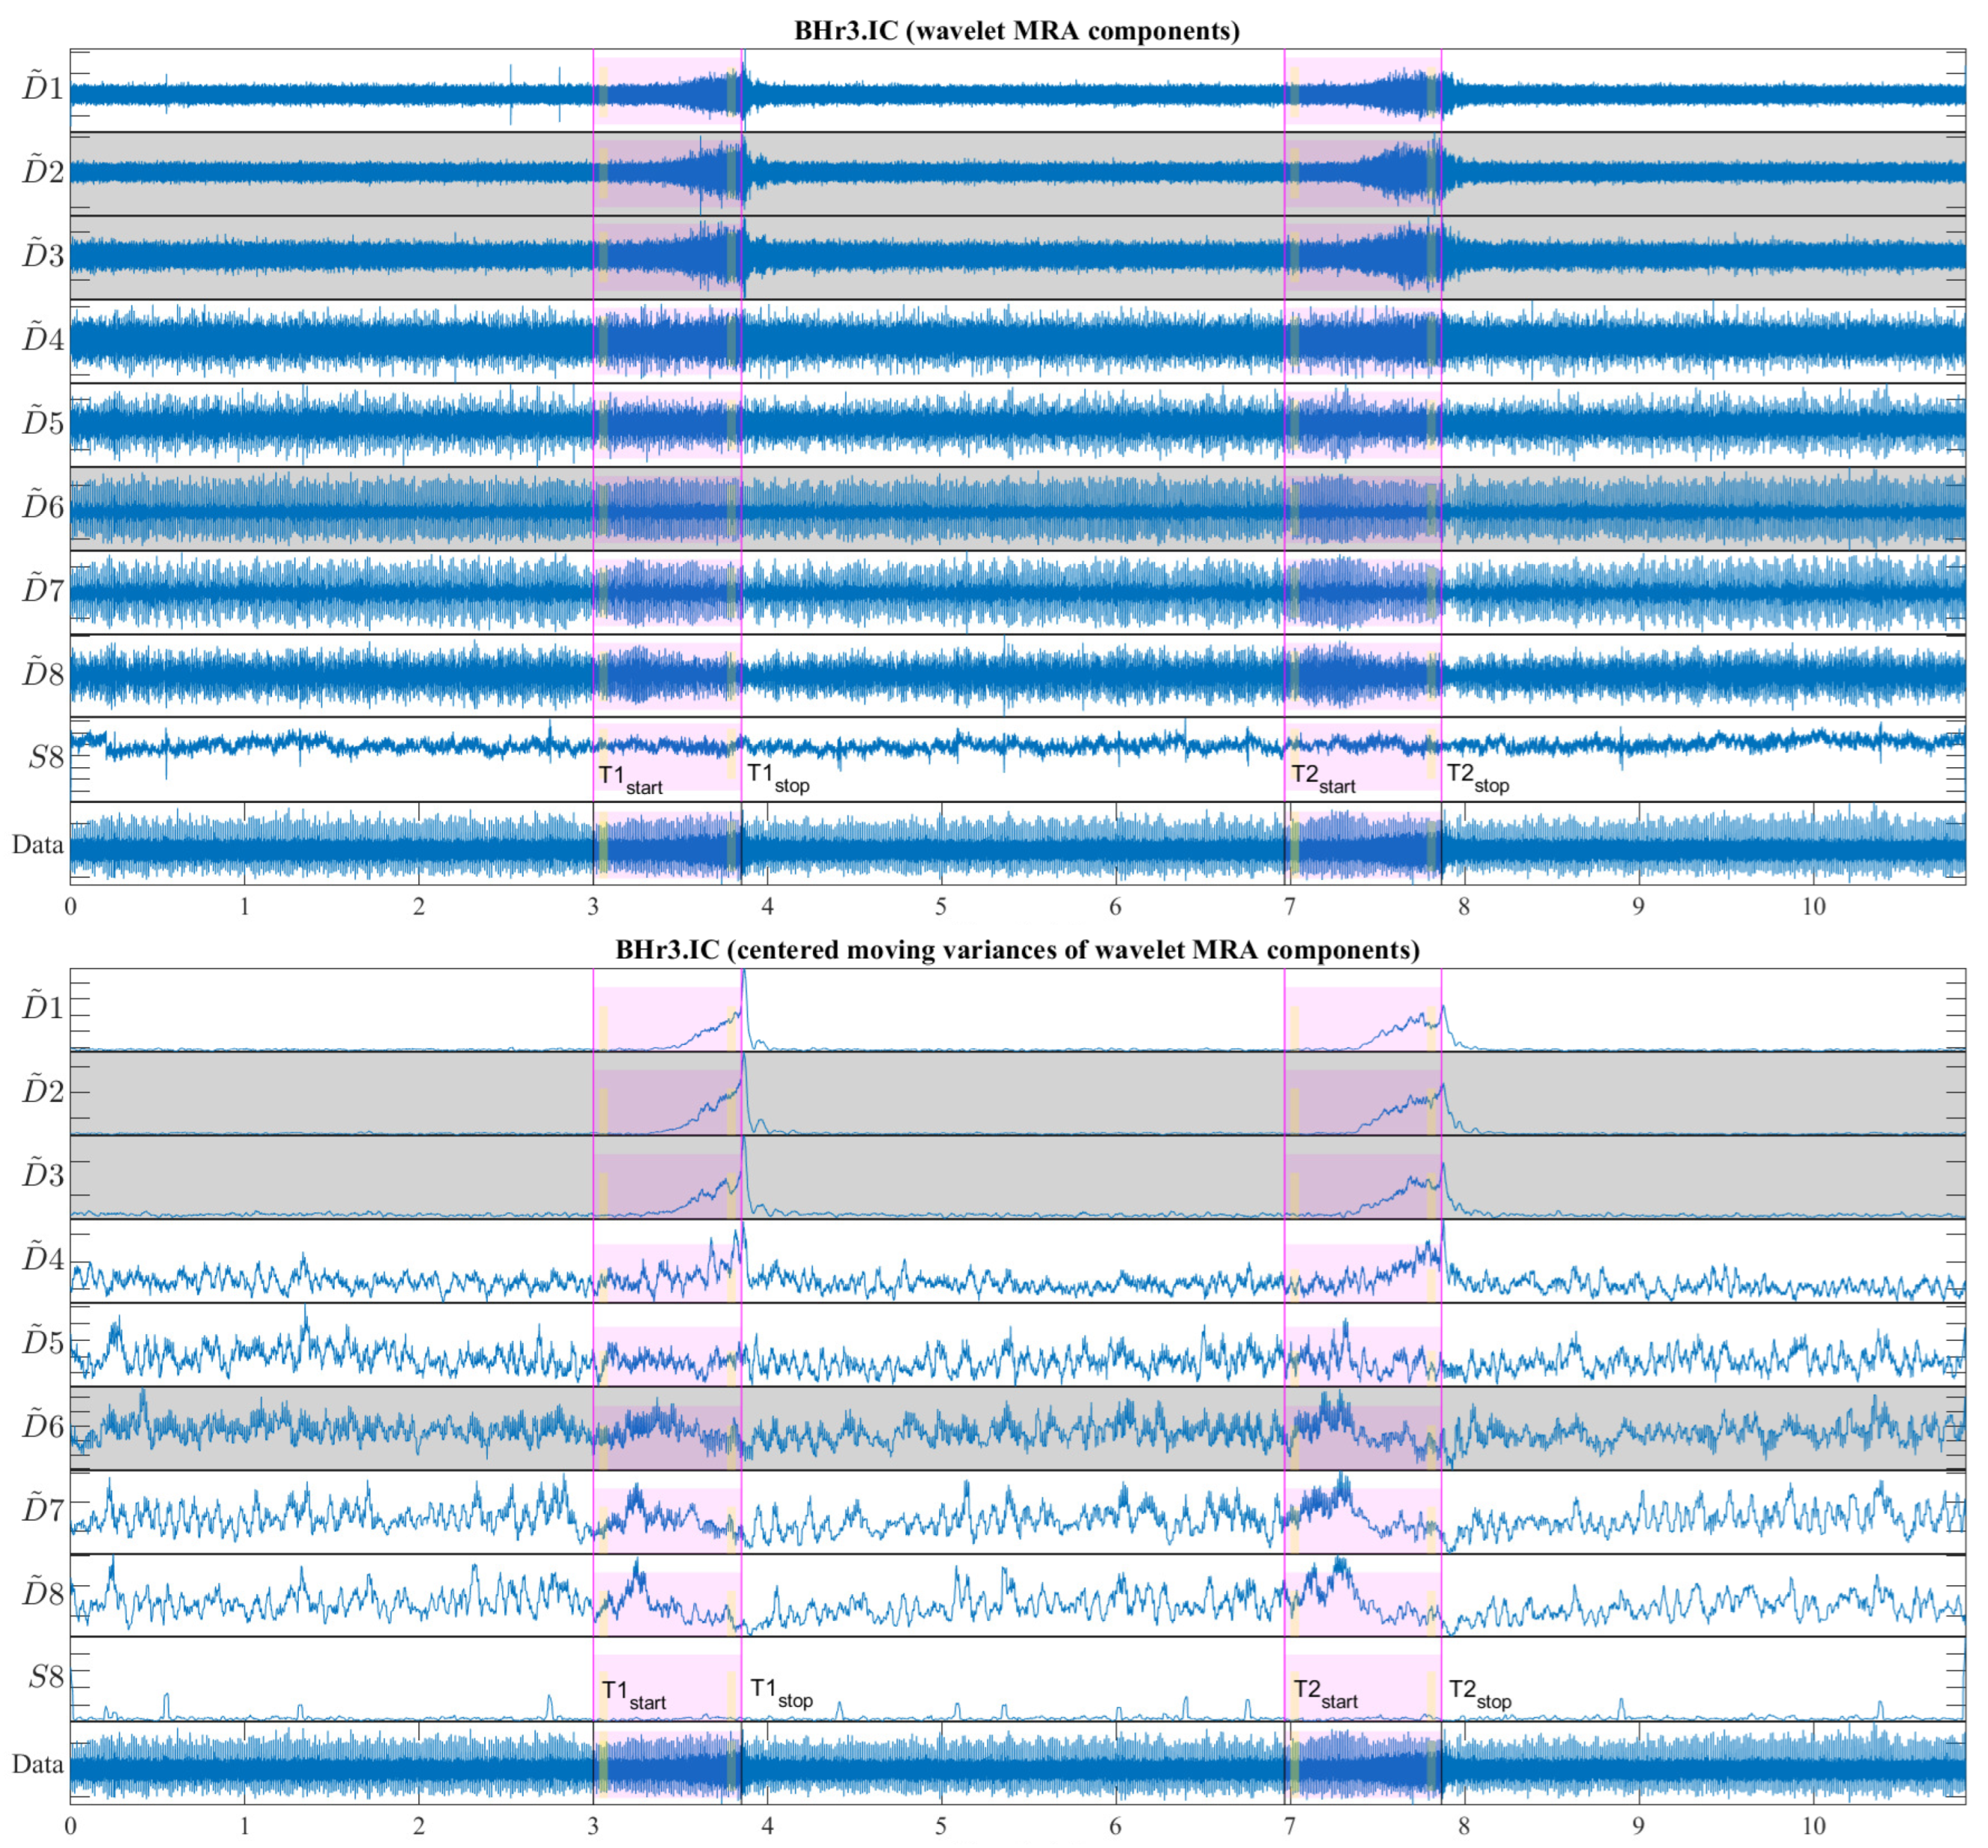
Figure 13 shows a representative case of subject BHr3 (BHD Rank #1) for the IC muscle, where the upper part of the figure contains the WMRA components of the entire EMG
IC signal, and the lower part contains the corresponding filtered components using the centered moving variances.
From
Figure 13, two synchronized processes are visible that occurred as a result of the apneic response (both started around the middle of BH1 and BH2): the first referred to a gradual increase in power for the high-frequency range D2/VHFB–D3/HFB (120–481 Hz) and to a lesser extent the D4/MFB, and the second referred to a gradual decrease in power for the frequency range D6–D7 (7–30 Hz) and to a lesser extent the D5/LFB.
In order to quantify the changes of relative energy across the scales related to the first IBM during the BHs, we compared the normalized wavelet energy spectra
(
Section 3.2.1) at the BH initial stage,
, and the BH final stage,
. We calculated this change as the absolute difference between
and
such that, for each component, we obtained
−
. The time intervals for calculating
were 3 s with a shift of 2 s inwards from the BH phase boundaries, as was the case of the OBW in
Figure 6 and as indicated in
Figure 13 (the narrow yellow rectangles across the scales).
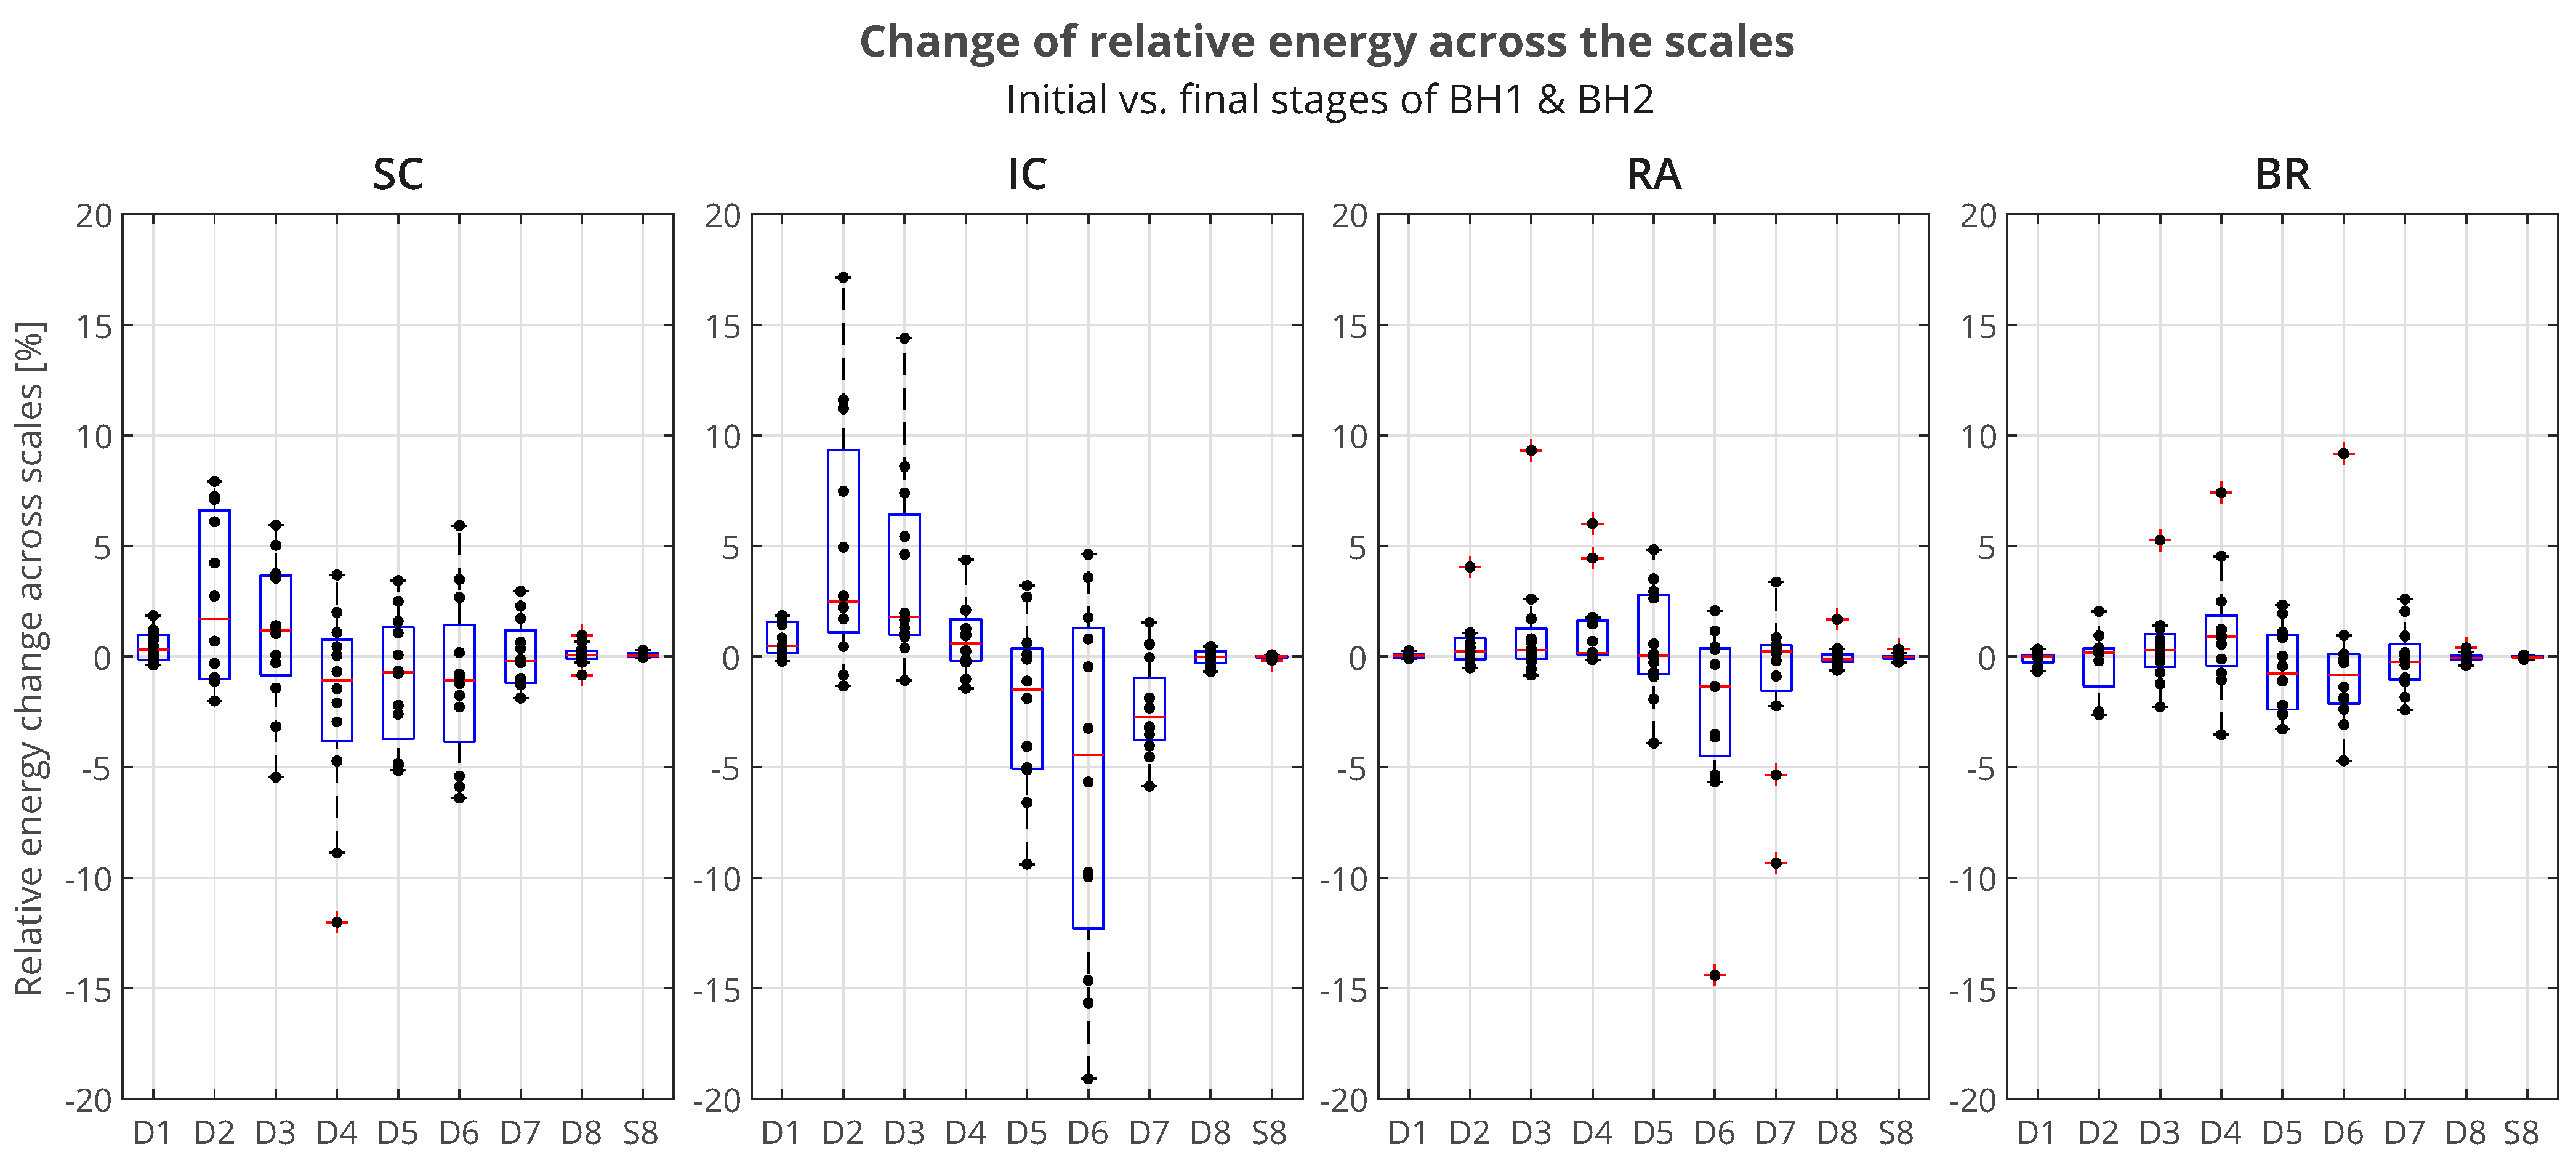
The distributions of
of all the participants across the scales, grouped by muscles, is presented using boxplots in
Figure 14. We can observe that the most pronounced increase in activity for the IC was primarily in the D2/VHFB component, followed by the D3/HFB, which were also the only increased components whose lower quartiles were above zero. It is also indicative that a similar trend was present in the same components of the SC such that the apneic response of the IC and SC was generally consistent in the frequency range above 120 Hz (D3 and D2 components). This correlated muscle activity of the inspiratory IC and SC muscles in the higher frequency range during apnea had been previously observed in the scalograms of the EMG
SC and EMG
IC signals for several individual apneists and was very apparent for apneist BHr12 (Rank #3;
Figure 9), not only during apneic periods, but also during spontaneous breathing in the inspiratory phases.
Figure 14.
Boxplot representation of the changes in relative energy across the scales
between the BH final and initial stages (as explained in the caption of
Figure 13), calculated for the combined BH1 and BH2 periods. The changes were most pronounced for the IC muscle, in particular an increase of D2 and D3 components, with a synchronous decrease of the D6 component (compare with the captions of
Figure 13 and
Figure 15).
At the same time, the D6 component of the IC had the largest energy drop similar to the D6 component of the RA, which could be attributed to heart rate drop (the SC and BR did not follow this trend due to the absence of limited electromyographic contributions from the cardiac signal).
For the BR muscle, a slight frequency redistribution of the muscle activity from a medium to high frequency band was also observed, especially a slight shift from the D5 to D4 frequency range. This can be explained by the limitation of blood flow to the limbs, not only as a consequence of the apneic response (sympathetically mediated peripheral vasoconstriction), but also of the metaboreflex (redistribution of blood flow to the respiratory muscles during their fatigue followed by a consequent restriction of blood flow to the locomotor muscles).
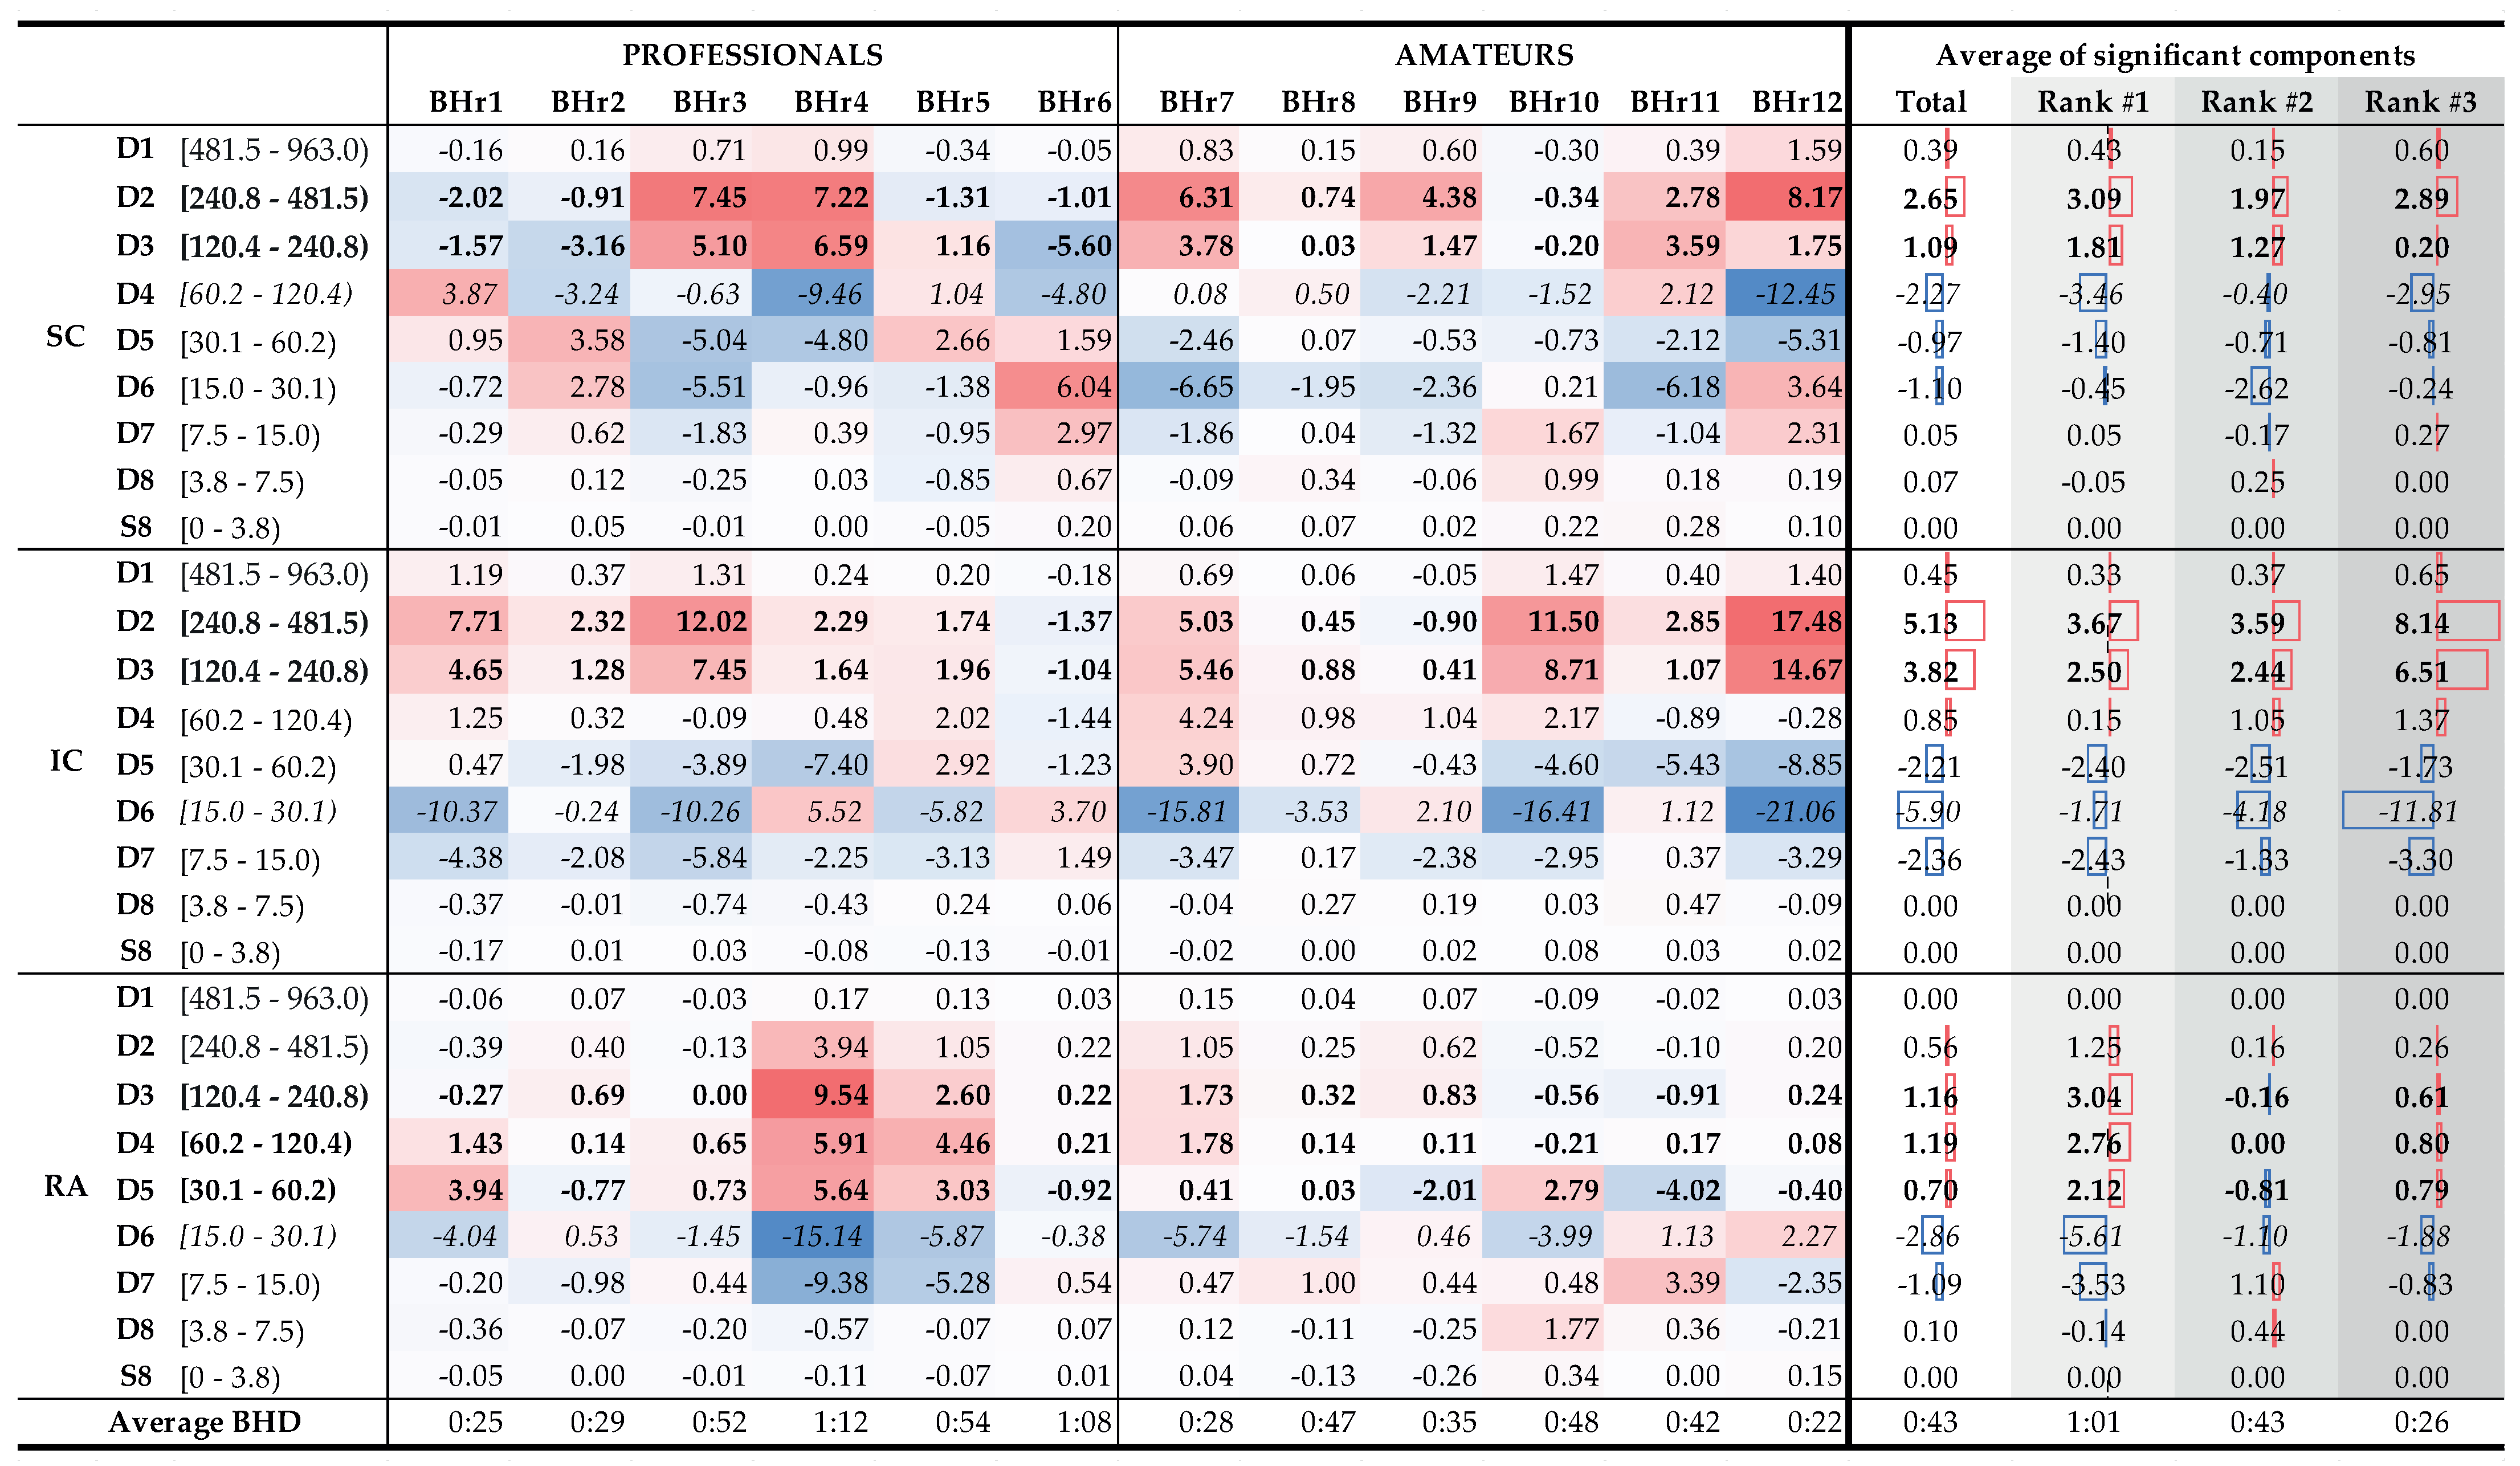
To understand which frequency bands had
significant changes in energy in the SC, IC, and RA muscles, we calculated a change in relative energies across all the subjects and wavelet scales per muscle (see left side of
Figure 15 that encompassed the 12 subjects labeled as professionals and amateurs). According to the central limit theorem, the distribution of values for each random process can be approximated with a Gaussian normal distribution for a large enough sample. As we were calculating a relative energy change for each person, which implied normalization, we obtained a process with a zero mean value for each person, but also for all the components of each muscle. Looking at
Figure 15, in many cases, only a small relative change was observable, which could be attributed to a random process. In order to isolate the components with significant energy changes, we calculates a 95% confidence interval (CI), which, in this case, encompassed the majority of values where no significant change was observable. Values that were outside of this 95% CI were significantly different from the majority of the population and were the components of interest. On the right side of
Figure 15, with the average change of significant components, we averaged, per rank, all the relative energies of a particular wavelet scale that were outside of the 95% CI, which thus represented components with significant change. For example, the value 3.09% for the D2 component of the Rank #1 subgroup represented an average value of significantly changed D2 components of the SC muscle for that subgroup.
Figure 15.
Changes in relative energy across the scales between the BH final and initial stages calculated for both BH1 and BH2 periods (left) and corresponding to the average values per scale for the total population and the population grouped by ranks (right). Scales with a significant positive change are displayed in boldface, and with negative change are italic (all values are expressed in percentages). Gradual highlighting from negative (blue) to positive (red) values was performed at the level of one muscle. In the part of the figure where the average values are calculated, the width of the red and blue boxes visualizes the size of the positive and negative change in values, respectively. Average values show the largest energy increase for D2 and D3 scales of EMGIC and EMGSC signals, regardless of the rank, as well as for D3, D4, and D5 scales of EMGRA signal, but only for the Rank #1 group.
The distributions of
of the average values per scale for the total population and the BHD rank groups confirmed the insights and conclusions given for
Figure 14 and also provided new ones in the context of the BHD.
According to the average values (
Figure 15, columns Total, and Ranks #1, #2, and #3), the relative energy increase of the EMG
SC signal of the main two components the D2 and D3 calculated for the entire population was 88%, while, for the three BHD rank groups, the increased were 91%, 89%, and 78%, respectively. The corresponding average D2 and D3 values of the EMG
IC signal constituted 87% of the total energy increase, while, separated by the ranks, they were 93%, 81%, and 88%, respectively. The consistent contribution of the D2 and D3 components in the total energy increase of the EMG
SC and EMG
IC signals again indicates their correlated muscle activity in the higher frequency range, which we mentioned in the context of the results from
Figure 9 and
Figure 14. By comparing the joint percentage increases of these two components by BHD Ranks #1, #2, and #3 for the SC, which were 6.17%, 6.03%, and 14.65%, respectively, we conclude that the percentage increase was the most pronounced for the BHD Rank #3 group, especially with the BHr12 apneist, which could be related to a possible post-COVID hypoxic state.
From
Figure 15, two sharp transitions of energy decreases and increases between adjacent components can be observed: first, between the D3 and D4 of the EMG
SC signal, which were visible for subjects with the BHD Ranks #1 and #3, and, second, between the D5 and D6 of the EMG
RA signal, which were visible only for subjects with the BHD Rank #1. It is particularly indicative that these most pronounced changes were correlated with the BHD rank groups: for the SC, it was for the apneists for whom hypoxia was more pronounced, either due to a significantly prolonged BH (BHD Rank #1) or due to the partial influence of possible chronic hypoxia and accompanied by uncompensated hypercapnia due to the post-COVID state (BHD Rank #3), while for the RA, it was for apneists for whom hypercapnia was more pronounced due to prolonged BH (BHD Rank #1). We consider that this phenomenon could be explained by MU recruitment: this would be due to a change in recruited MUs during the time evolution of the apneic response from smaller MUs of slow-twitch oxidative type 1 fibers to larger MUs of fast-twitch (oxidative) glycolytic type 2 fibers.
Figure 15 provides us with one of the most significant results that followed from the comparison of the distribution of energy changes for the EMG
RA signal in correlation with the BHD, where it is shown that the increase in activity in the D3–D5 components referred only to apnests with the first rank, more precisely, BHr4 and BHr5, whose BHDs lasted about 1 min. This observation is consistent with [
42] according to which the RA responds almost exclusively to hypercapnia.
Finally, as an interesting and important fact, we can point out that most subjects from the Rank #2 group had a mild to moderate reaction to BH. Only subject BHr10, who had BHD2 (57 s) comparable to subjects with the BHD Rank #1, showed a more pronounced reaction on the IC muscle with the same characteristics (a pronounced increase of D2 and D3 components, with a synchronous decrease of the D6 component). A more detailed analysis in which we compared changes in component energies for BH1 and BH2 in subject BHr10 showed that the prolonging of BHD from 40 s (BHD1) to 57 s (BHD2) resulted in the greatest changes precisely in the mentioned components D2 and D3 (a total increase of 6%) and D6 (decrease 6%). This leads to the conclusion that longer breath holding, especially over 50 s, results in an increased activation of the IC muscle in healthy subjects.
The observed links between the sEMG activity and BHD, as well as their interpretation in the context of MU recruitment in relation to the respiratory muscle’s response to hypoxia/hypercapnia, are also supported by a recent study [
58] in which an sEMG–NIRS correlation analysis was performed. Namely, using near-infrared spectroscopy (NIRS), as a standard method for measuring local tissue oxygenation, in correlation with sEMG activity of the locomotor muscle, a higher correlation between the EMG and NIRS signals was observed in participants with a more active lifestyle. It was also shown that subjects with the least active lifestyles had the lowest correlation. A reduced EMG–NIRS correlation indicates the influence of factors other than oxygenation, such as metabolic, energetic, and neuromuscular factors, which may be particularly pronounced in persons with a specific health condition, as in the case of BHr12 in the post-COVID state (more details in
Section 4.2.2,
Figure 9). All this gives us an additional argument that, by using the sEMG signals, we can evaluate oxygenation, even in cases when a disproportion between the sEMG activity and muscle response is observed.
Considering all these findings, we conclude that our setup allows for the assessment of skeletal muscle oxygen storage and current fitness levels: subjects with higher BHsD and a primarily hypercapnic response in the expiratory RA are more fit than subjects with shorter BHDs and primarily hypoxic response in the inspiratory IC.
This study has limitations that should be taken into account when validating the final conclusions related to the mentioned relationships between the spectral characteristics of respiratory muscles, their fiber activation, and metabolism during the apneic response. Future studies should include a bigger population and more respiratory muscles, especially the diaphragm, and they should use sEMG in combination with advanced techniques to assess blood flow and tissue oxygenation (NIRS) in order to obtain more accurate quantitative estimators of physical fitness.

 ,
, 


