

Precision Heart Rate Estimation Using a PPG Sensor Patch Equipped with New Algorithms of Pre-Quality Checking and Hankel Decomposition


Abstract
1. Introduction
2. PPG Signals and Motion Artifacts
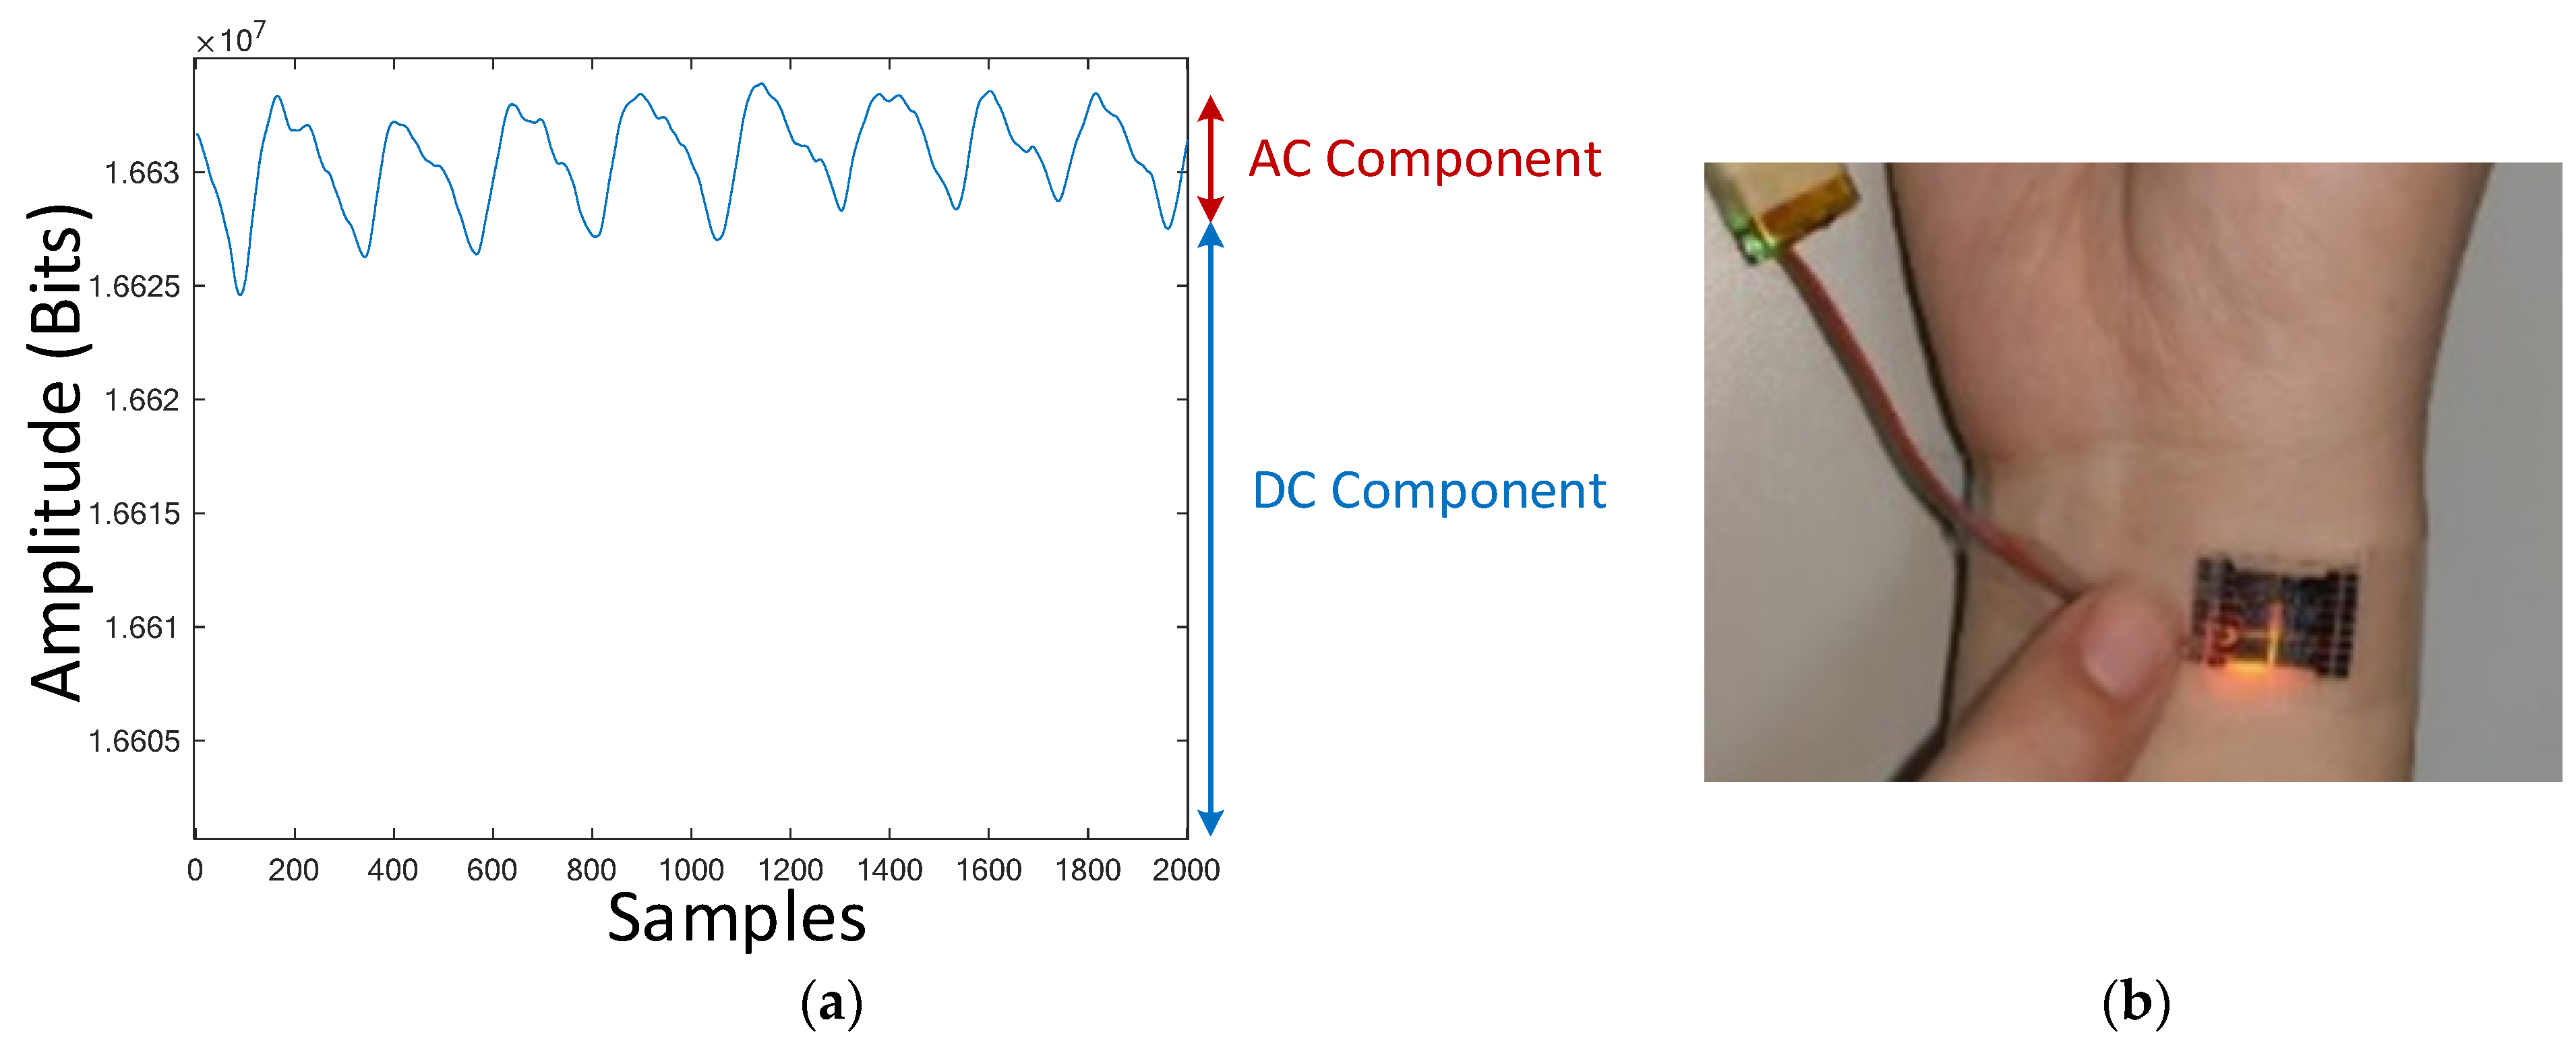
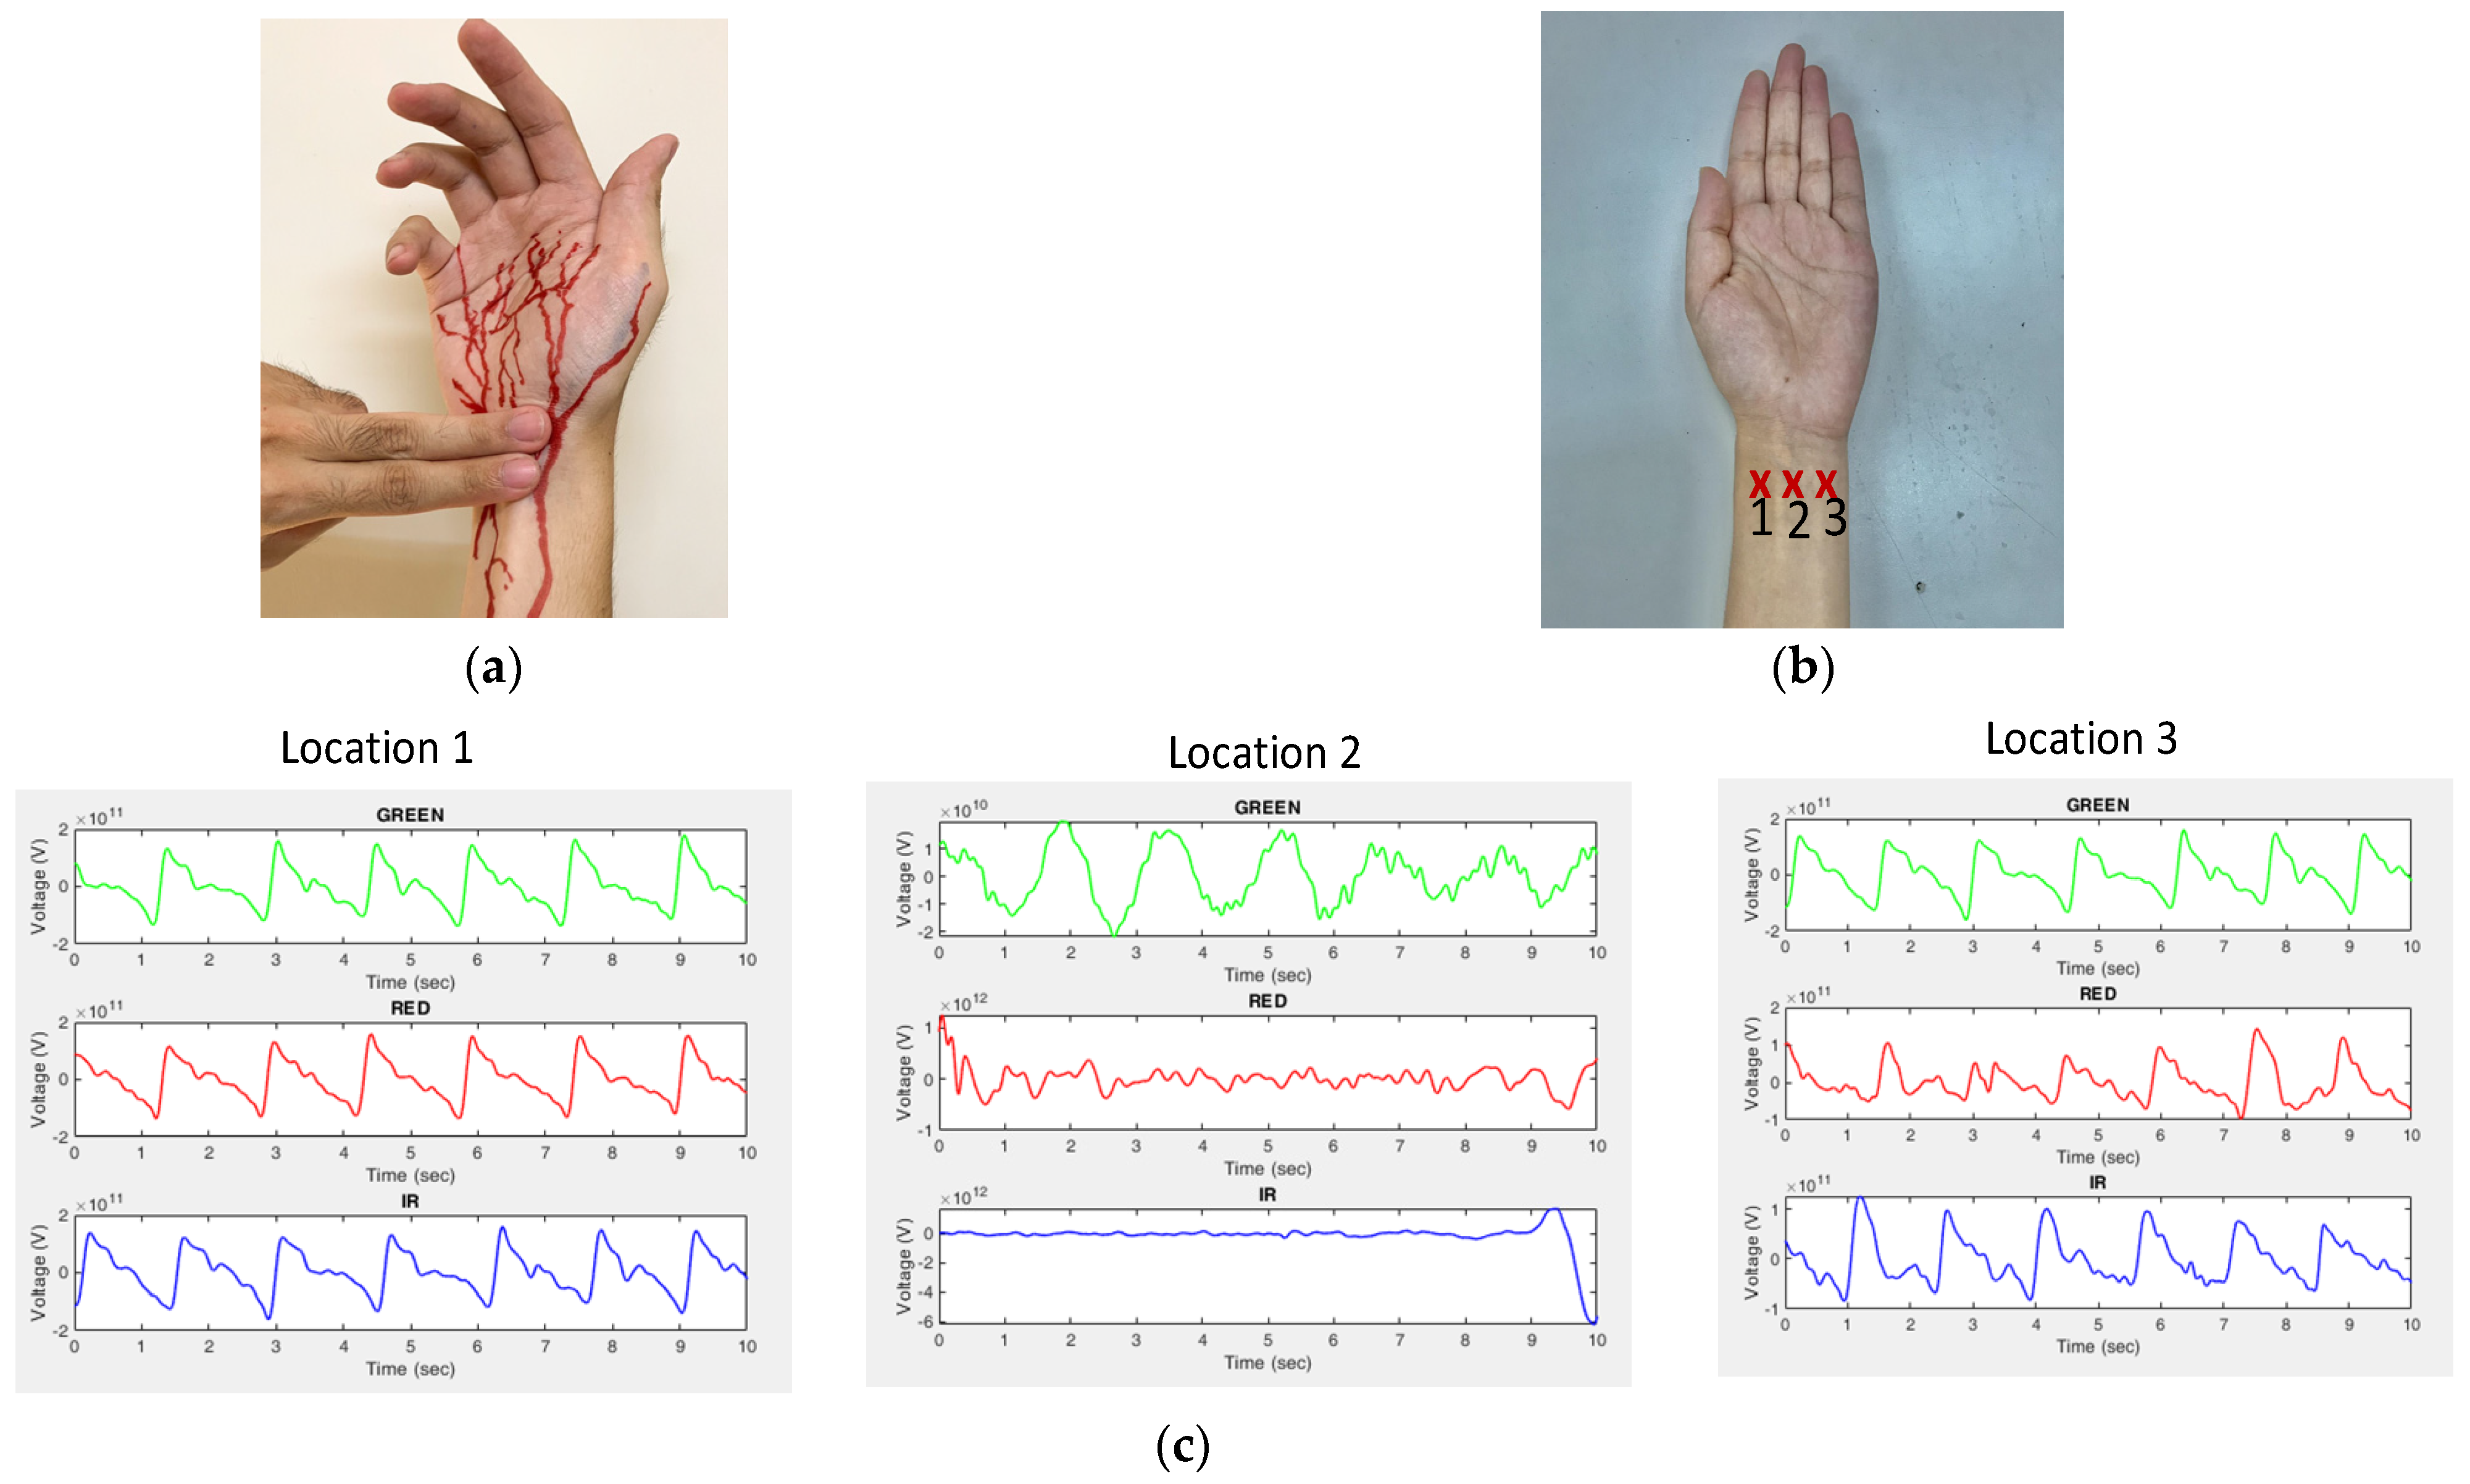
2.1. Measuring PPG
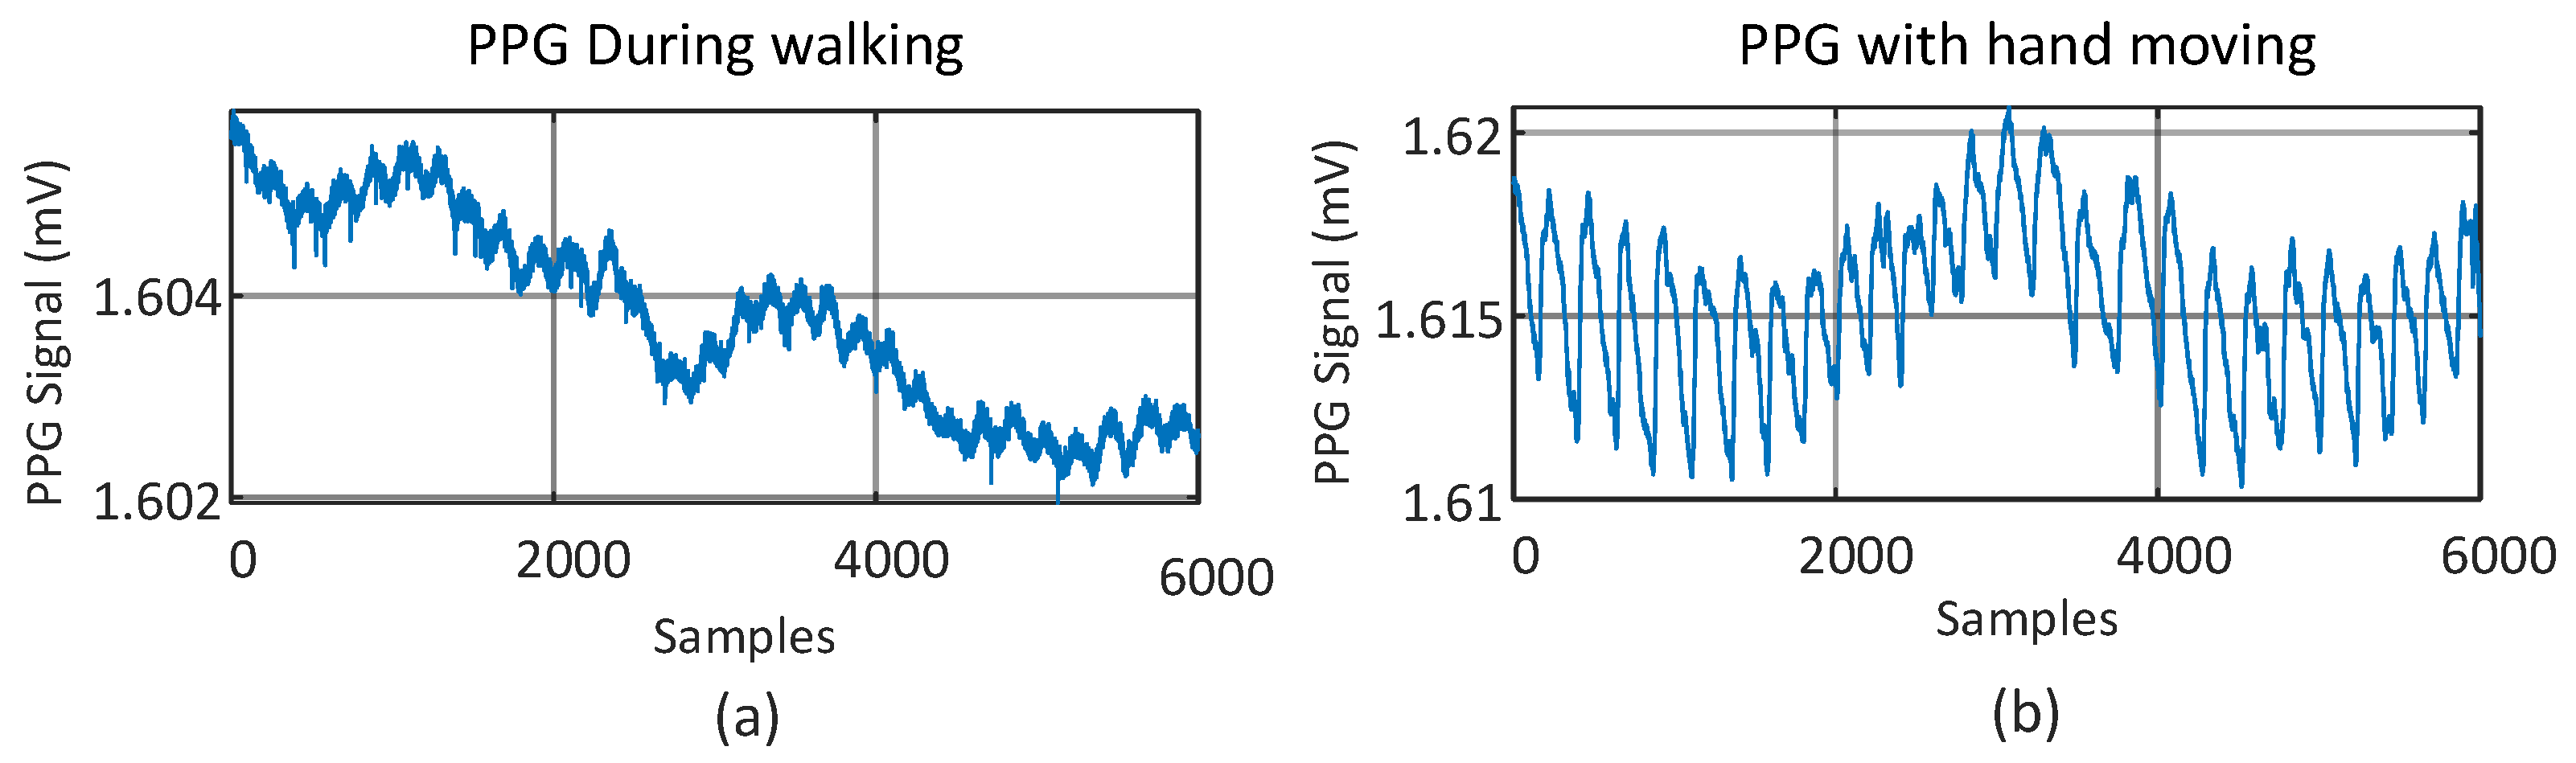
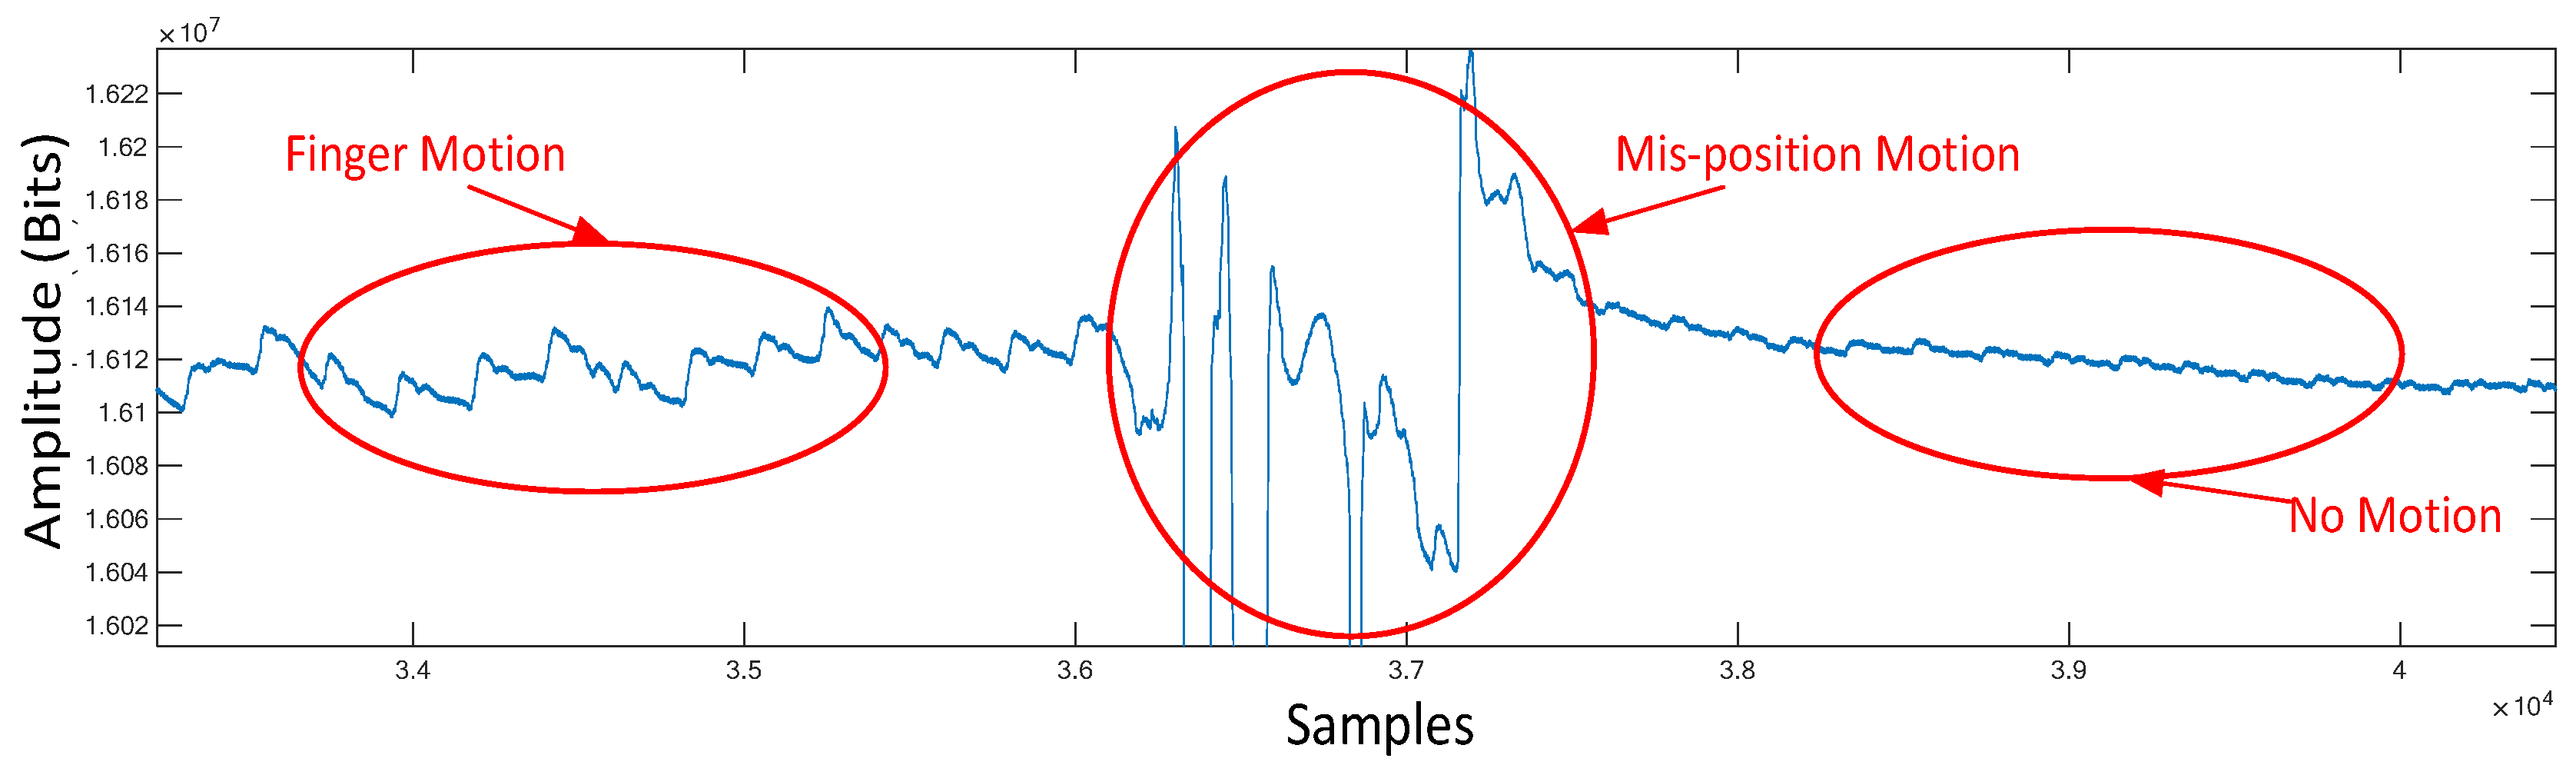
2.2. Classification of Motion Artifacts
3. The First Sub-Algorithm of Quality Check on Measured PPG Signals
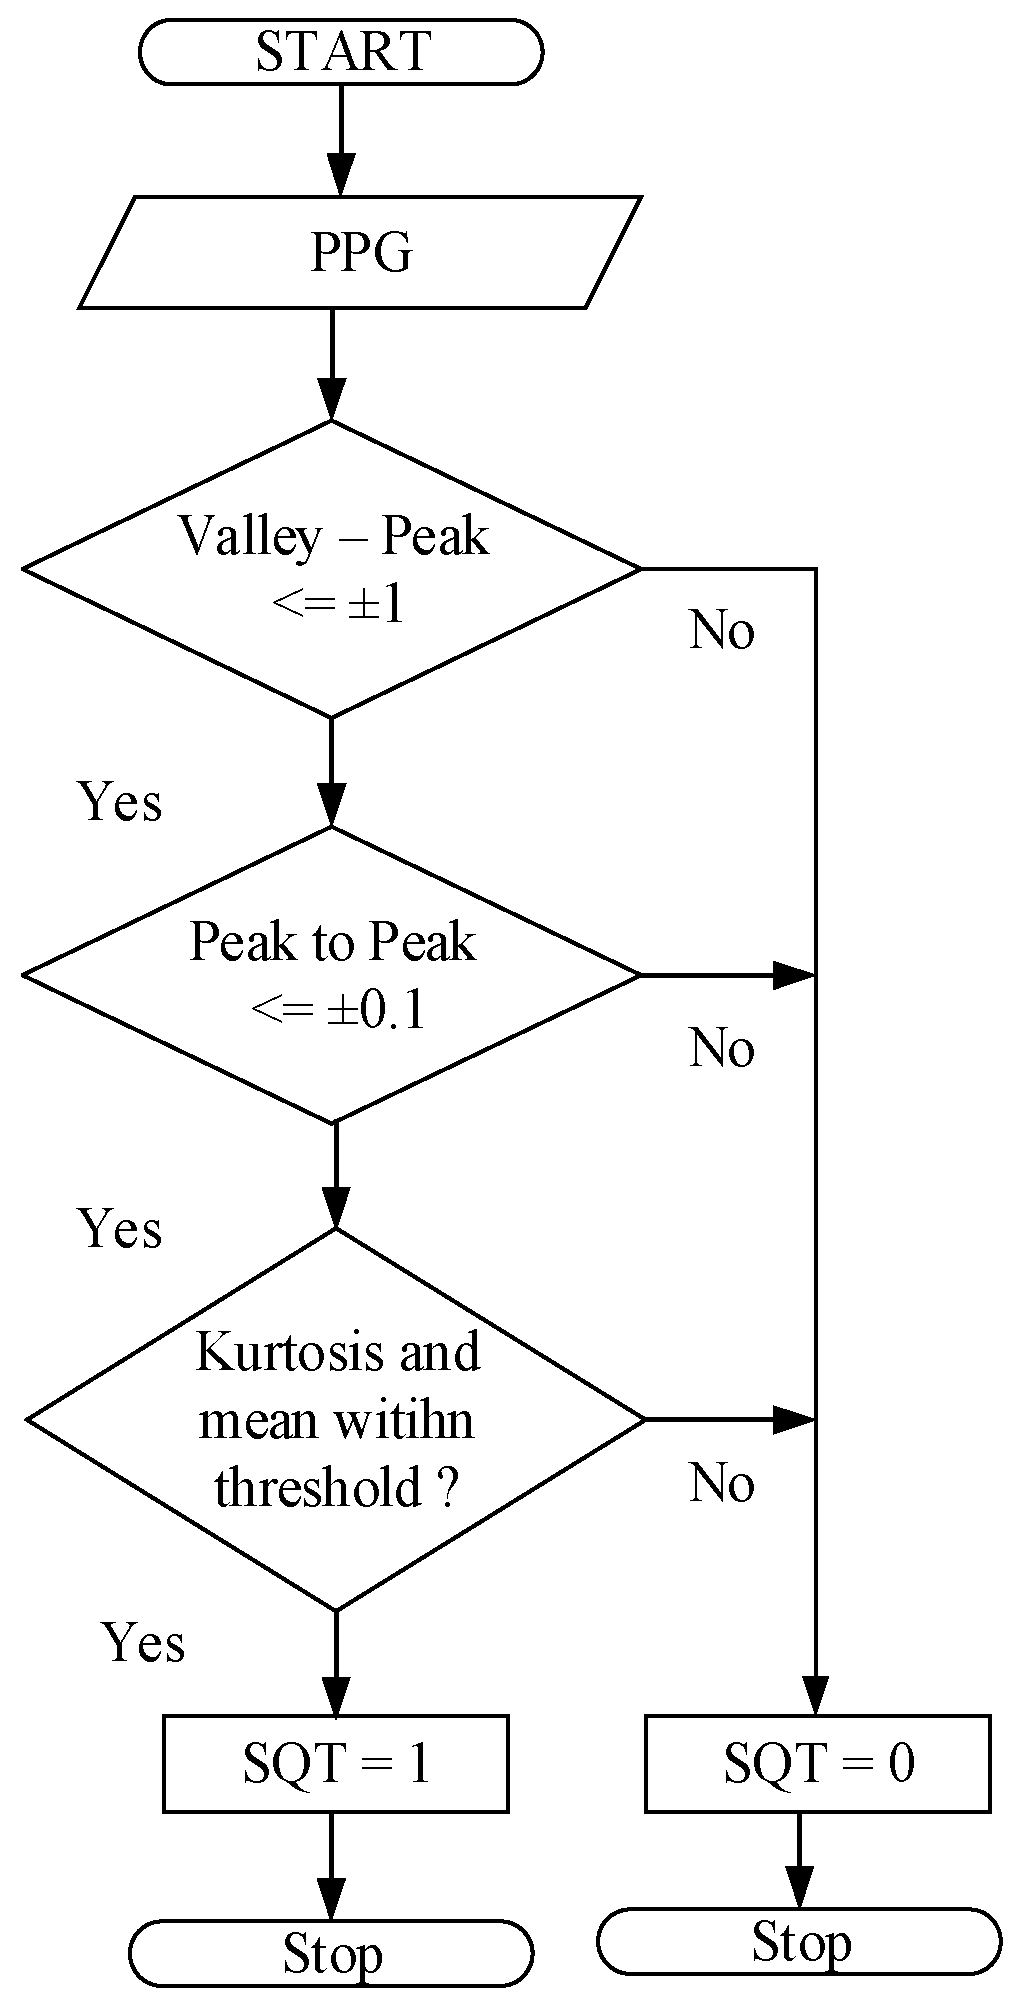
- (1)
- The number of valleys and peaks of the measured PPG signal is calculated, and then it is checked ifto affirm the presence of pulsation in the measured PPG; otherwise, the signal is labeled as “unqualified” and we then return to stage one for motion artifact reduction.
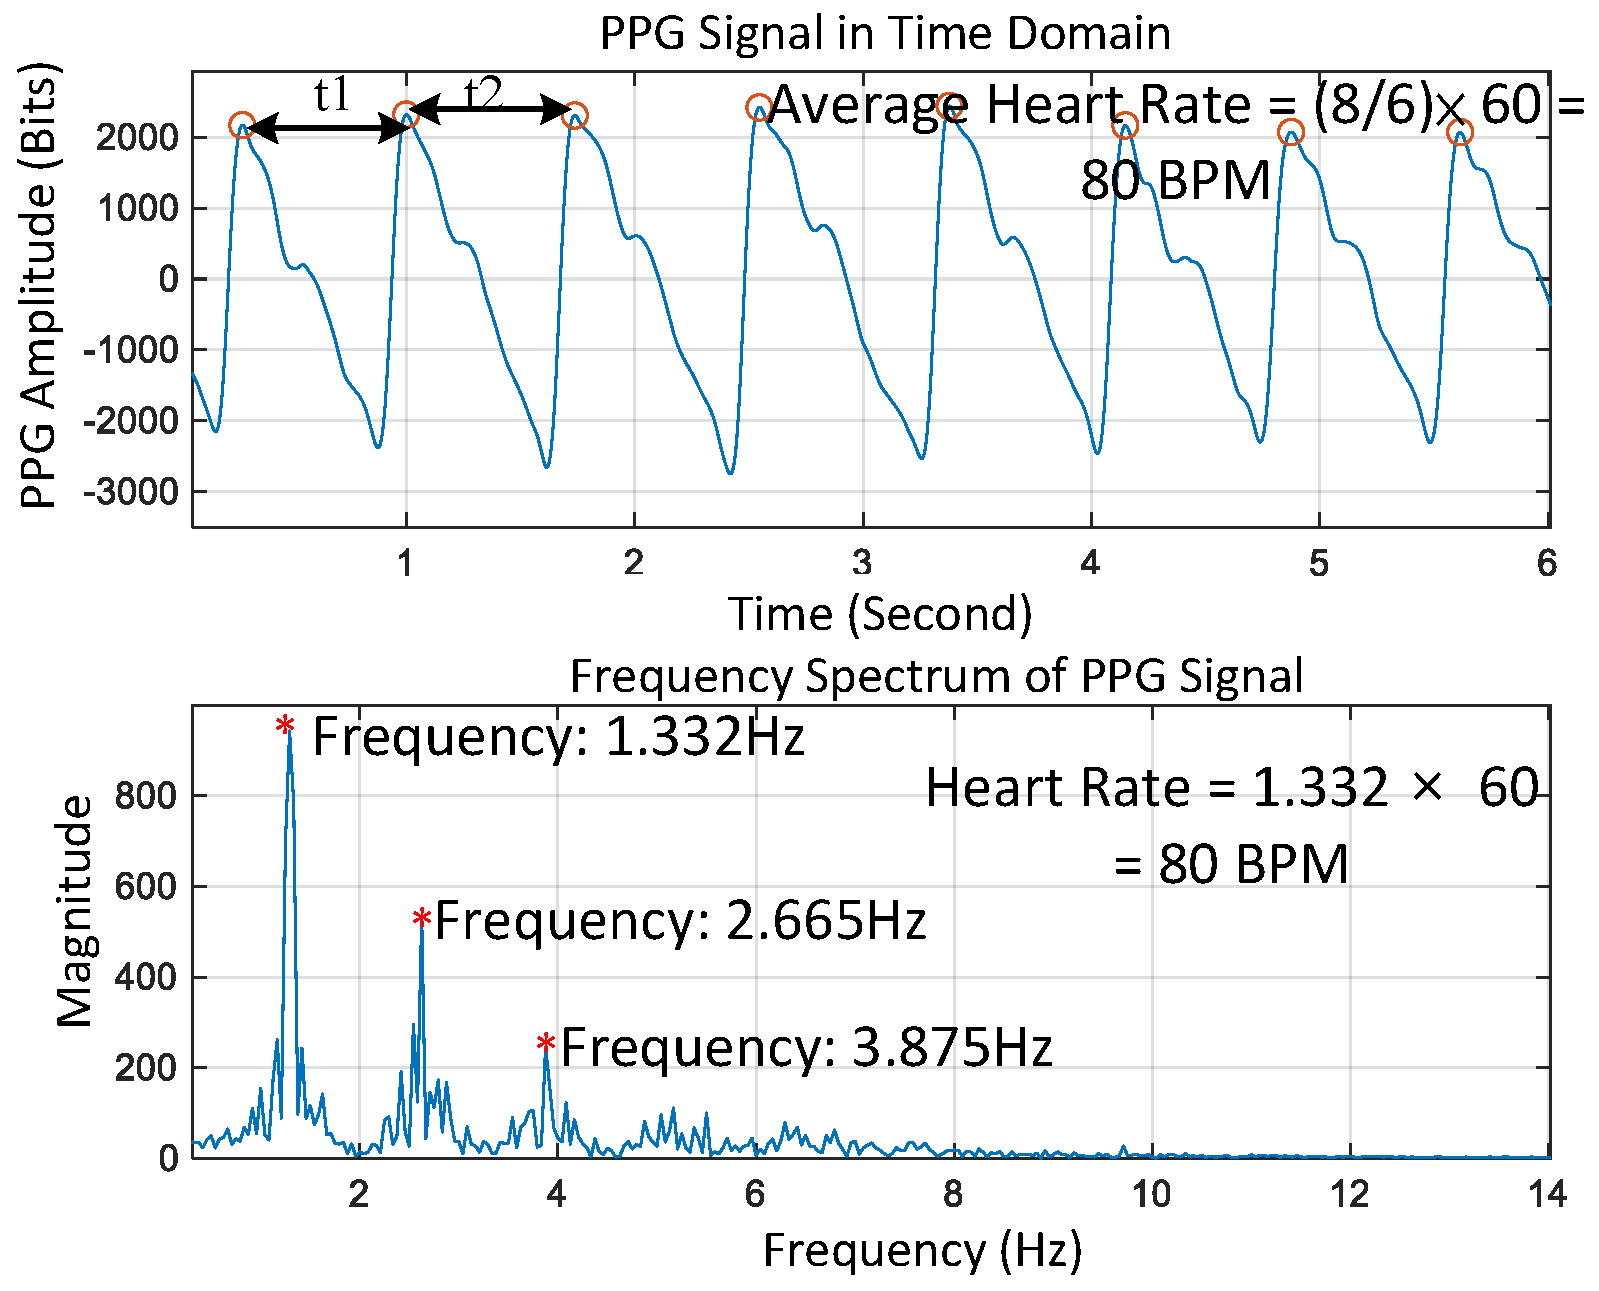
- (2)
- The ti values are defined as the time intervals between peaks that can be extracted from measured PPGs, as shown in Figure 7. It is next checked if all differences between consecutive ti values,are each less than or equal to ±0.1 of ti. If this condition is true, the signal is labelled as “qualified,” and then we go to the next step in Figure 6; otherwise, the signal is labelled as “unqualified” and we stop the computation.Δt = ti+1 − ti,
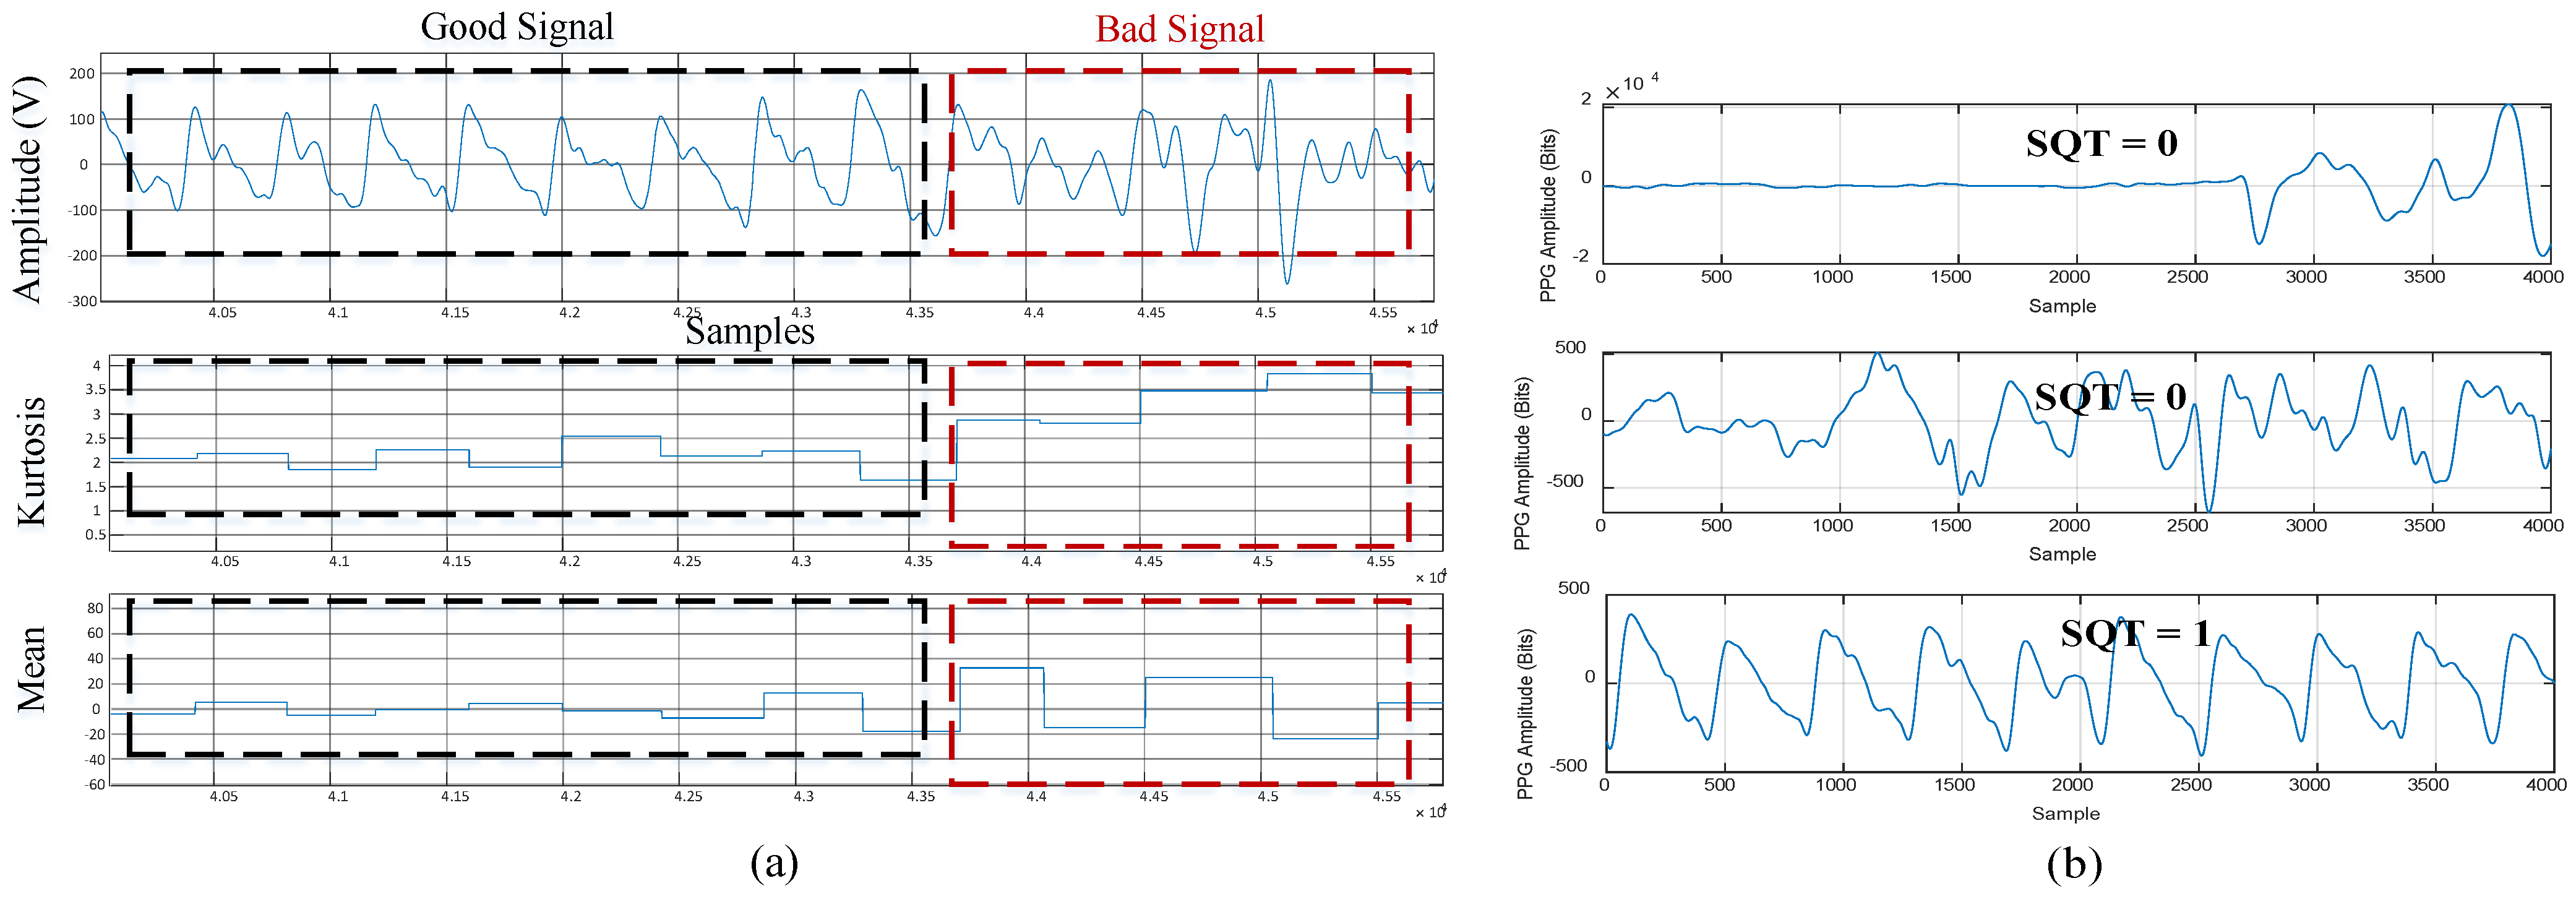
- (3)
- The statistical measures of kurtosis, mean, and standard deviation of the qualified PPG segments are calculated further at each cycle. If all calculated statistical values are within pre-defined thresholds, as shown in Figure 8a, the measured PPG is identified as “qualified;” otherwise, it is determined as as “unqualified” and then the computation is stopped. Note that a similar approach was used by [3] for motion artifact detection.
- (4)
- A marker SQT (Signal Quality Token) is defined as either ’0’ or ‘1’ to label the measured PPG segment as qualified or unqualified. Figure 8b shows three representative examples of PPG marked with different SQTs. Only the PPG with SQRT = 1 is passed on to calculate heart rate based on the Hankel matrix and SVD decomposition.


4. The Second Sub-Algorithm for Motion Artifact Removal
4.1. The Hankel Matrix and Its SVD
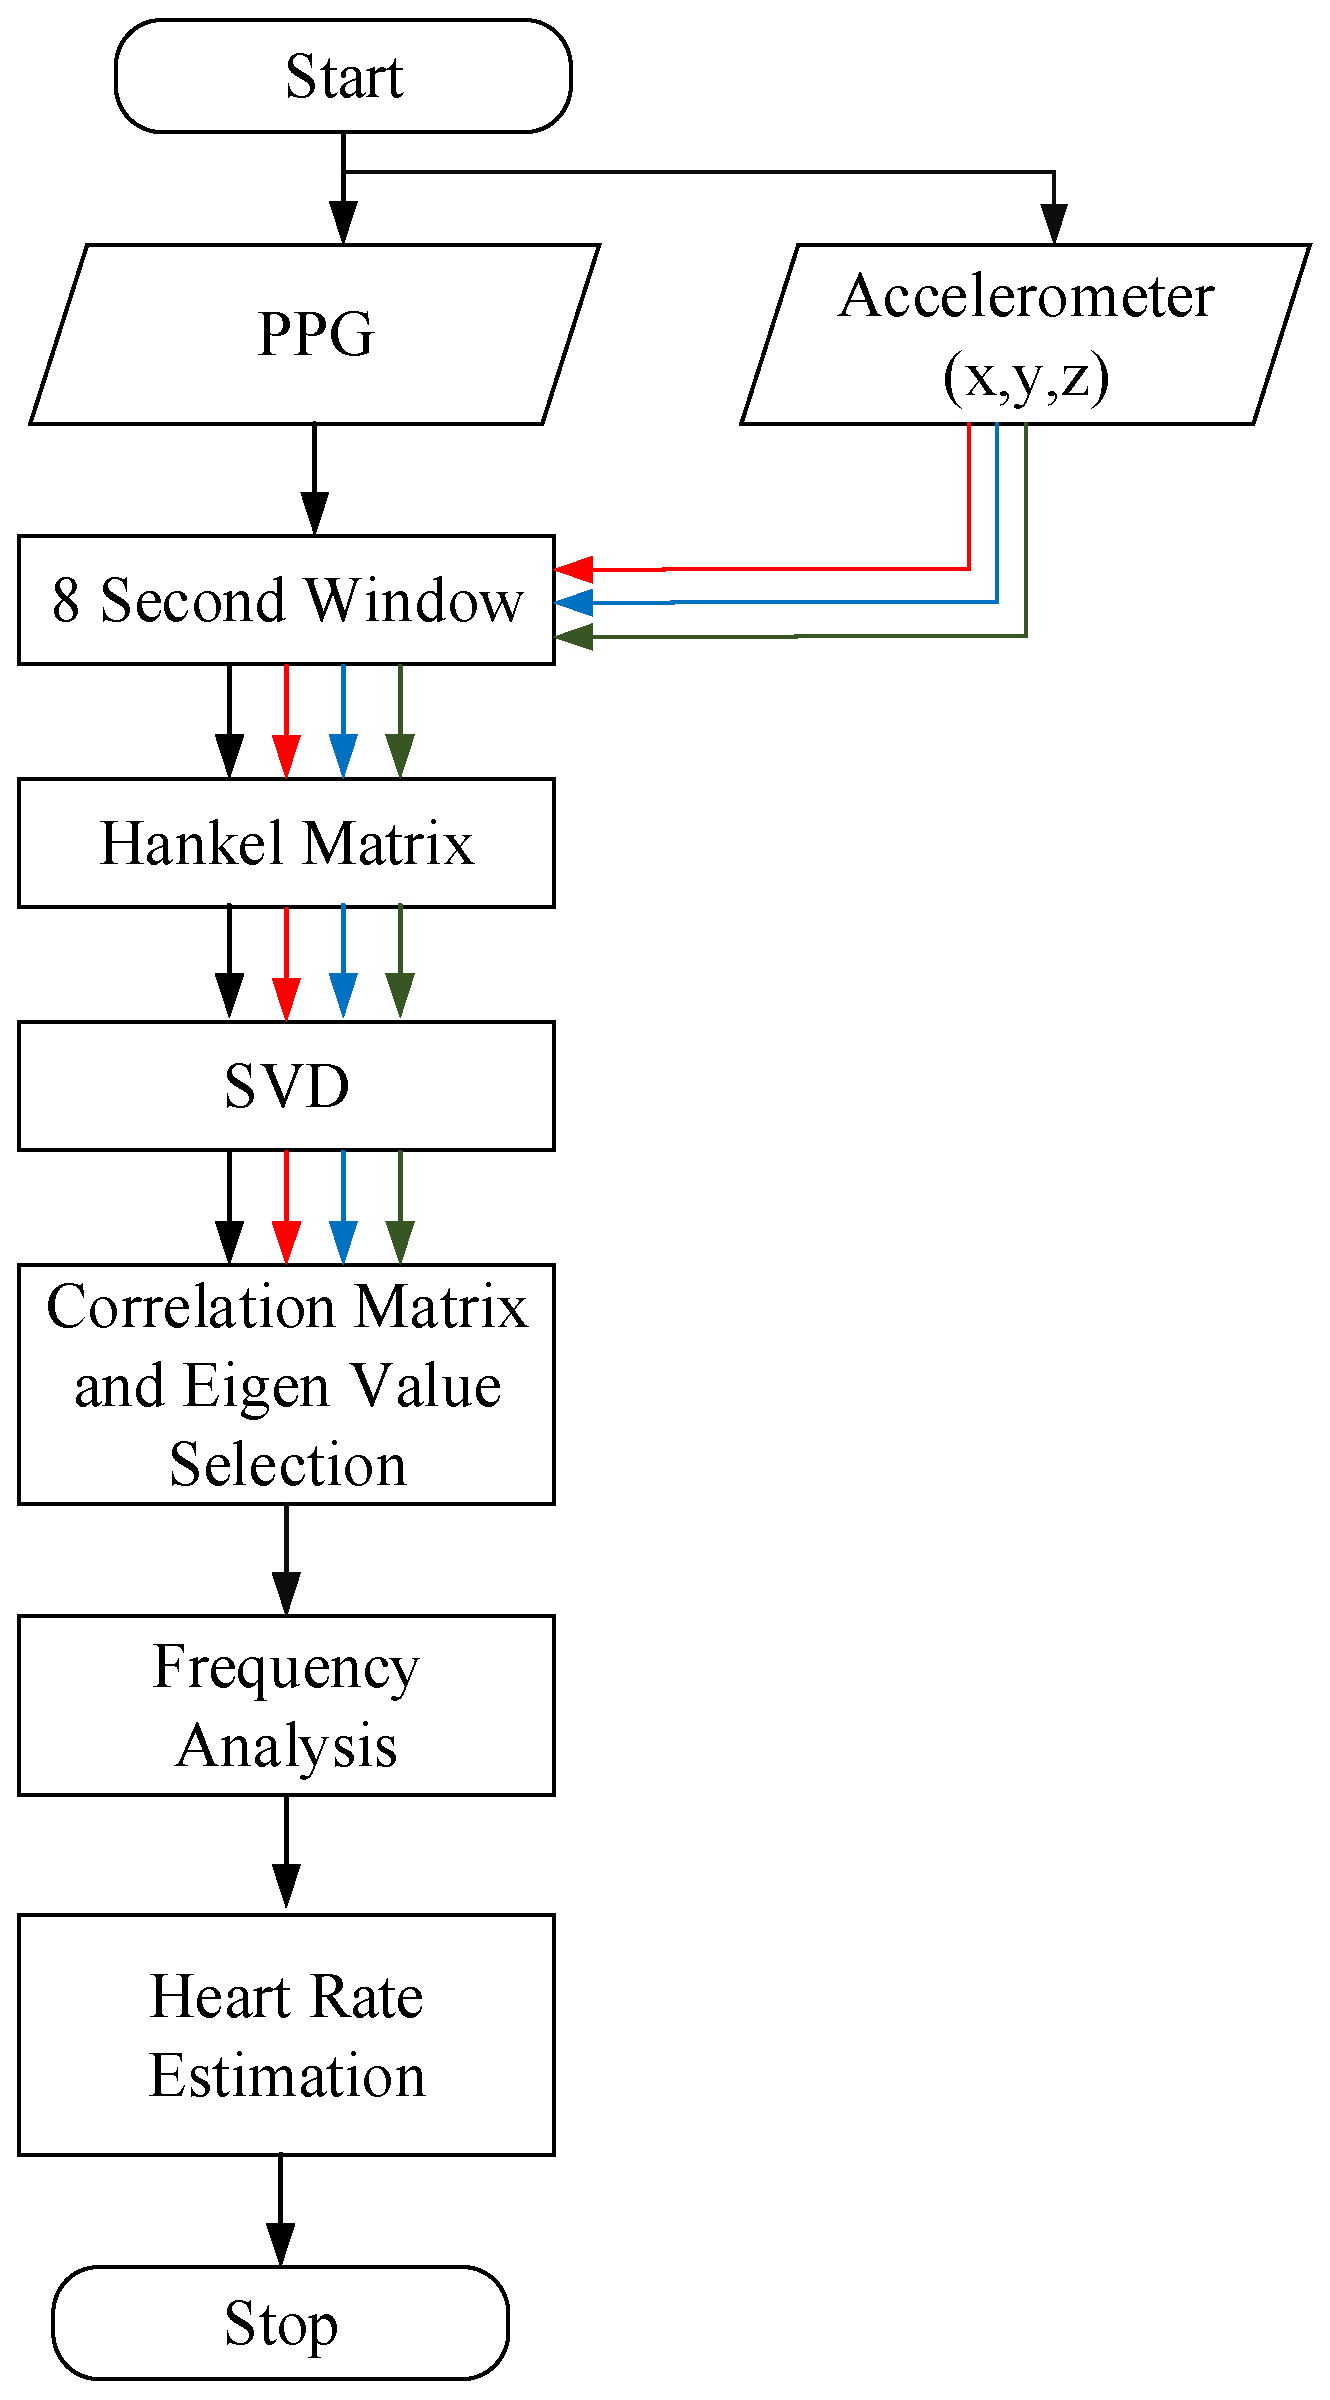
4.2. The Computational Flow of the Proposed MAR Algorithm
| Algorithm 1 In pseudocode: Motion Artifact Algorithm for Walking. |
| 1: Procedure Record PPG signal and accelerometer signal x,y,z for 8 s 2: Initialize HR_est = 78 3: Construct Hankel matrix Hppg for PPG 4: Construct Hankel matrix Hx for x 5: Construct Hankel matrix Hy for y 6: Construct Hankel matrix Hz for z 7: Find SVD of matrix obtained from step 3, 4, 5, 6 8: Construct a correlation matrix between the 3-axis accelerometer and PPG 9: Select eigenvalues 10: Reconstruct using inverse SVD 11: Find DFT of the reconstructed signal 12: Find HR 13: Heart rate estimation 14: End procedure |
5. Experimental Results
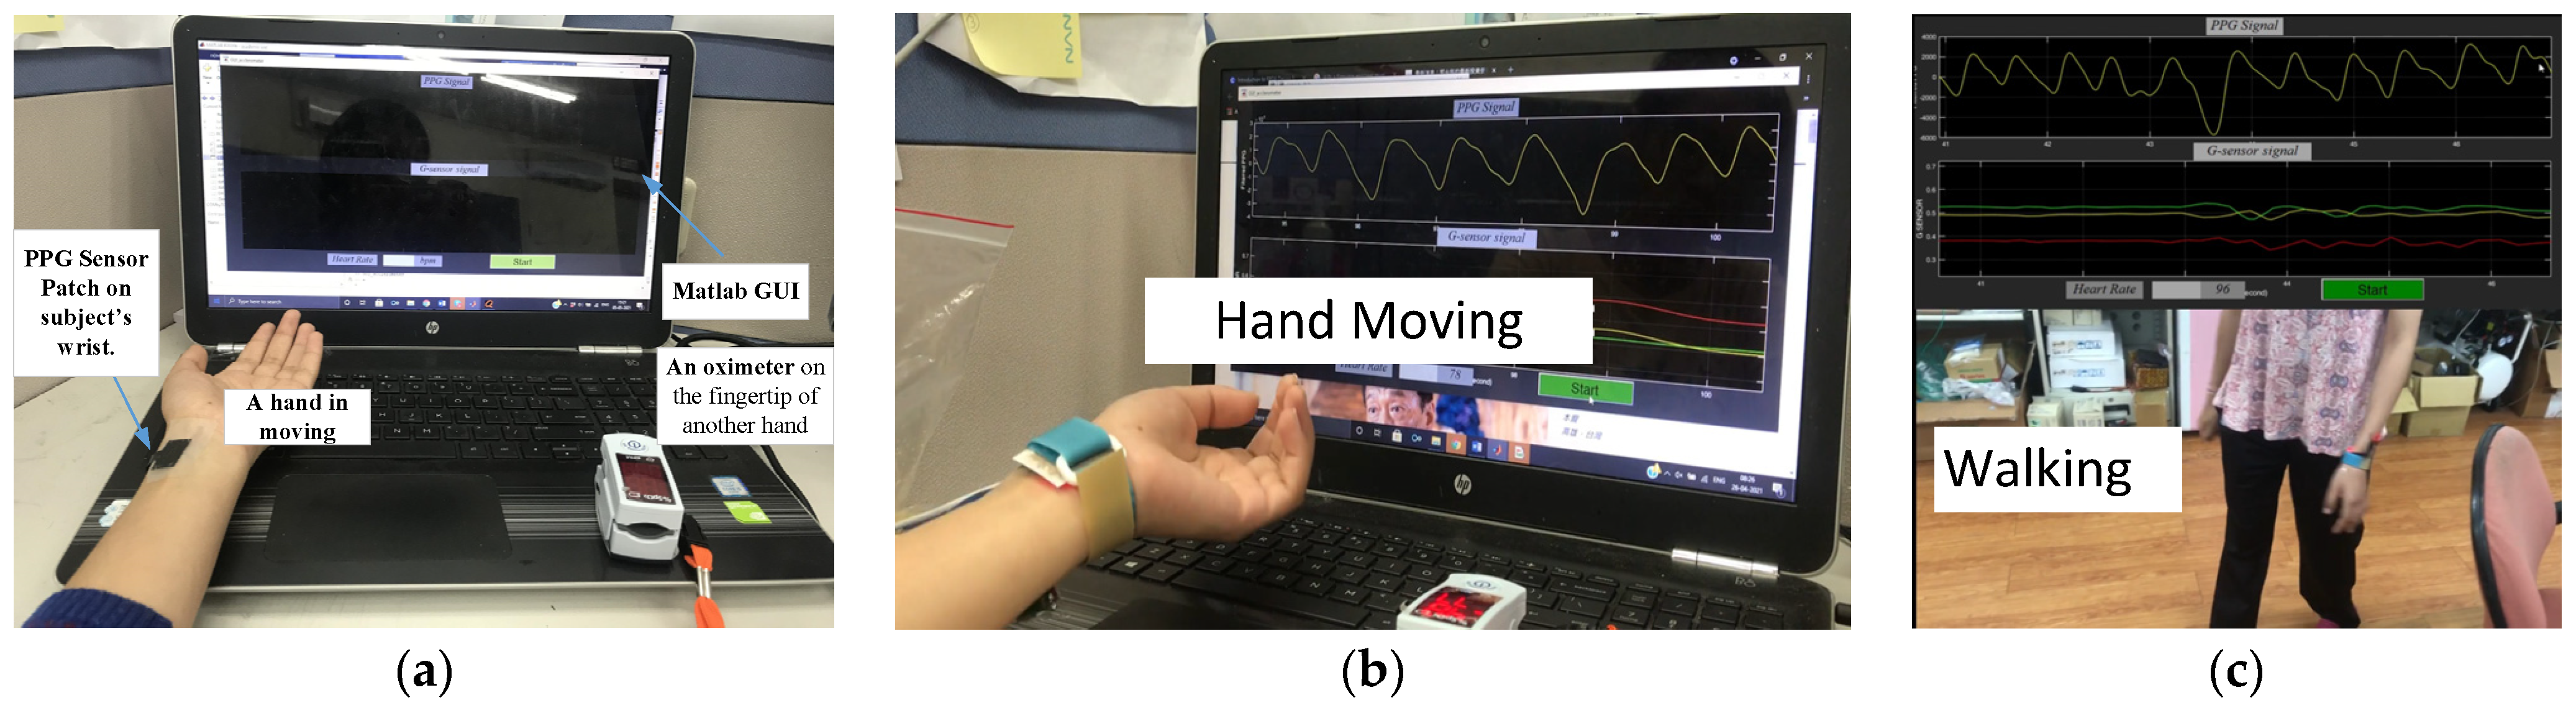
5.1. Hand Movement
5.2. Walking
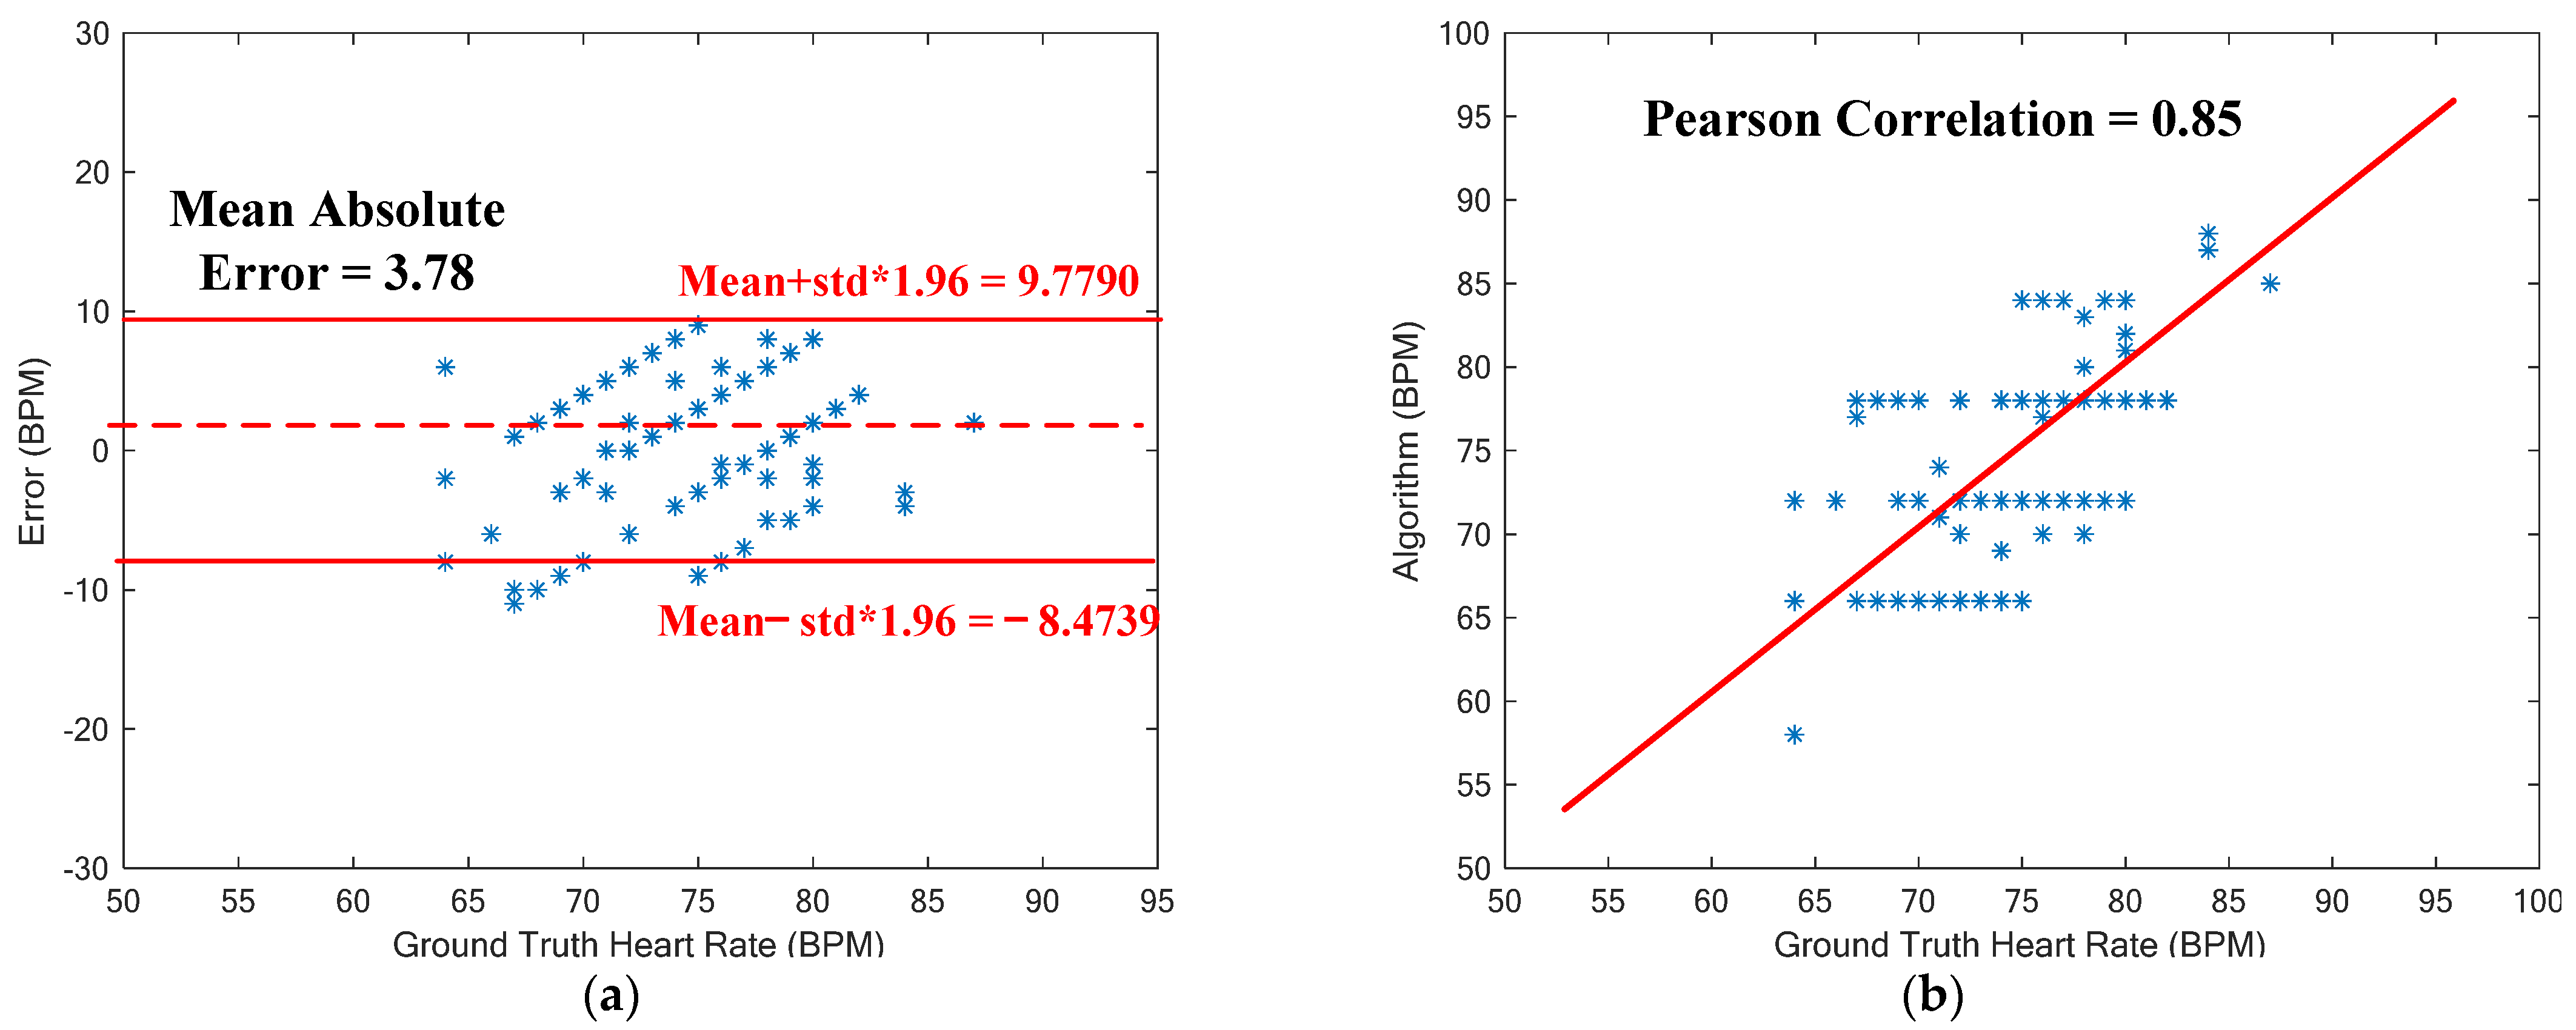
5.3. Discussion
6. Conclusions
Author Contributions
Funding
Institutional Review Board Statement
Informed Consent Statement
Data Availability Statement
Conflicts of Interest
References
- Zenian, A. Technology Spotlight: Taking the Pulse of the Pulse Oximetry Market. Available online: https://24x7mag.com/medical-equipment/patient-care-equipment/technology-spotlight-taking-pulse-pulse-oximetry-market/ (accessed on 17 March 2021).
- Castaneda, D.; Esparza, A.; Ghamari, M.; Soltanpur, C.; Nazeran, H. A review on wearable photoplethysmography sensors and their potential future applications in health care. Int. J. Biosens. Bioelectron. 2018, 4, 195. [Google Scholar] [PubMed]
- Krishnan, R.; Natarajan, B.; Warren, S. Analysis and detection of motion artifact in photoplethysmographic data using higher order statistics. In Proceedings of the 2008 IEEE International Conference on Acoustics, Speech and Signal Processing, Las Vegas, NV, USA, 31 March–4 April 2008; pp. 613–616. [Google Scholar]
- Lee, Y.; Shin, H.; Jo, J.; Lee, Y.-K. Development of a wristwatch-type PPG array sensor module. In Proceedings of the 2011 IEEE International Conference on Consumer Electronics-Berlin (ICCE-Berlin), Berlin, Germany, 6–8 September 2011; pp. 168–171. [Google Scholar]
- Thomas, S.S.; Nathan, V.; Zong, C.; Soundarapandian, K.; Shi, X.; Jafari, R. BioWatch: A noninvasive wrist-based blood pressure monitor that incorporates training techniques for posture and subject variability. IEEE J. Biomed. Health Inform. 2015, 20, 1291–1300. [Google Scholar] [CrossRef]
- Shao, H.Y.; Chen, X.H. Motion artifact detection and reduction in PPG signals based on statistics analysis. In Proceedings of the 2017 29th Chinese control and decision conference (CCDC), Chongqing, China, 28–30 May 2017; pp. 3114–3119. [Google Scholar]
- Zhang, Y.; Liu, B.; Zhang, Z. Combining ensemble empirical mode decomposition with spectrum subtraction technique for heart rate monitoring using wrist-type photoplethysmography. Biomed. Signal Process. Control 2015, 21, 119–125. [Google Scholar] [CrossRef]
- Friman, S.; Vehkaoja, A.; Perez-Macias, J.M. The use of wrist EMG increases the PPG Heart Rate accuracy in smartwatches. IEEE Sens. J. 2022, 22, 24197–24204. [Google Scholar] [CrossRef]
- Bashar, S.K.; Han, D.; Soni, A.; McManus, D.D.; Chon, K.H. Developing a novel noise artifact detection algorithm for smartphone PPG signals: Preliminary results. In Proceedings of the 2018 IEEE EMBS International Conference on Biomedical & Health Informatics (BHI), Las Vegas, NV, USA, 4–7 March 2018; pp. 79–82. [Google Scholar]
- Kong, Y.; Chon, K.H. Heart rate tracking using a wearable photoplethysmographic sensor during treadmill exercise. IEEE Access 2019, 7, 152421–152428. [Google Scholar] [CrossRef]
- Raghuram, M.; Sivani, K.; Reddy, K.A. Use of complex EMD generated noise reference for adaptive reduction of motion artifacts from PPG signals. In Proceedings of the 2016 International Conference on Electrical, Electronics, and Optimization Techniques (ICEEOT), Chennai, India, 3–5 March 2016; pp. 1816–1820. [Google Scholar]
- Hara, S.; Shimazaki, T.; Okuhata, H.; Nakamura, H.; Kawabata, T.; Cai, K.; Takubo, T. Parameter optimization of motion artifact canceling PPG-based heart rate sensor by means of cross validation. In Proceedings of the 2017 11th International Symposium on Medical Information and Communication Technology (ISMICT), Lisbon, Portugal, 6–8 February 2017; pp. 73–76. [Google Scholar]
- Lin, W.-J.; Ma, H.-P. A physiological information extraction method based on wearable PPG sensors with motion artifact removal. In Proceedings of the 2016 IEEE International Conference on Communications (ICC), Kuala Lumpur, Malaysia, 22–27 May 2016; pp. 1–6. [Google Scholar]
- Mashhadi, M.B.; Asadi, E.; Eskandari, M.; Kiani, S.; Marvasti, F. Heart rate tracking using wrist-type photoplethysmographic (PPG) signals during physical exercise with simultaneous accelerometry. IEEE Signal Process. Lett. 2015, 23, 227–231. [Google Scholar] [CrossRef]
- Lee, J.; Kim, M.; Park, H.-K.; Kim, I.Y. Motion artifact reduction in wearable photoplethysmography based on multi-channel sensors with multiple wavelengths. Sensors 2020, 20, 1493. [Google Scholar] [CrossRef]
- Kim, B.S.; Yoo, S.K. Motion artifact reduction in photoplethysmography using independent component analysis. IEEE Trans. Biomed. Eng. 2006, 53, 566–568. [Google Scholar] [CrossRef] [PubMed]
- Lee, H.; Chung, H.; Ko, H.; Lee, J. Wearable multichannel photoplethysmography framework for heart rate monitoring during intensive exercise. IEEE Sens. J. 2018, 18, 2983–2993. [Google Scholar] [CrossRef]
- Xiong, J.; Cai, L.; Jiang, D.; Song, H.; He, X. Spectral matrix decomposition-based motion artifacts removal in multi-channel PPG sensor signals. IEEE Access 2016, 4, 3076–3086. [Google Scholar] [CrossRef]
- Zhao, C.; Zeng, W.; Hu, D.; Liu, H. Robust heart rate monitoring by a single wrist-worn accelerometer based on signal decomposition. IEEE Sens. J. 2021, 21, 15962–15971. [Google Scholar] [CrossRef]
- Yousef, Q.; Reaz, M.; Ali, M.A.M. The analysis of PPG morphology: Investigating the effects of aging on arterial compliance. Meas. Sci. Rev. 2012, 12, 266–271. [Google Scholar] [CrossRef]
- Motin, M.A.; Karmakar, C.K.; Palaniswami, M. Ensemble empirical mode decomposition with principal component analysis: A novel approach for extracting respiratory rate and heart rate from photoplethysmographic signal. IEEE J. Biomed. Health Inform. 2017, 22, 766–774. [Google Scholar] [CrossRef] [PubMed]
- Koneshloo, A.; Du, D. A novel motion artifact removal method via joint basis pursuit linear Program to accurately monitor heart rate. IEEE Sens. J. 2019, 19, 9945–9952. [Google Scholar] [CrossRef]
- He, W.; Ye, Y.; Lu, L.; Cheng, Y.; Li, Y.; Wang, Z. Robust heart rate monitoring for quasi-periodic motions by wrist-type PPG signals. IEEE J. Biomed. Health Inform. 2019, 24, 636–648. [Google Scholar] [CrossRef] [PubMed]
- Savaskan, D.A.; Mahanoglu, A.; Soner, B.; Kholmatov, A. Heart Rate Measurement from Motion Compensated Photoplethysmographic Signals. In Proceedings of the 2020 28th Signal Processing and Communications Applications Conference (SIU), Gaziantep, Turkey, 5–7 October 2020; pp. 1–4. [Google Scholar]
- Huang, N.; Selvaraj, N. Robust ppg-based ambulatory heart rate tracking algorithm. In Proceedings of the 2020 42nd Annual International Conference of the IEEE Engineering in Medicine & Biology Society (EMBC), Montreal, QC, Canada, 20–24 July 2020; pp. 5929–5934. [Google Scholar]
- Temko, A. Accurate heart rate monitoring during physical exercises using PPG. IEEE Trans. Biomed. Eng. 2017, 64, 2016–2024. [Google Scholar] [CrossRef]
- Tanweer, K.T.; Hasan, S.R.; Kamboh, A.M. Motion artifact reduction from PPG signals during intense exercise using filtered X-LMS. In Proceedings of the 2017 IEEE International Symposium on Circuits and Systems (ISCAS), Baltimore, MD, USA, 28–31 May 2017; pp. 1–4. [Google Scholar]
- Wu, C.-C.; Chen, I.-W.; Fang, W.-C. An implementation of motion artifacts elimination for PPG signal processing based on recursive least squares adaptive filter. In Proceedings of the 2017 IEEE Biomedical Circuits and Systems Conference (BioCAS), Turin, Italy, 19–21 October 2017; pp. 1–4. [Google Scholar]
- Arunkumar, K.; Bhaskar, M. Robust de-noising technique for accurate heart rate estimation using wrist-type PPG signals. IEEE Sens. J. 2020, 20, 7980–7987. [Google Scholar] [CrossRef]
- Zhang, Y.; Song, S.; Vullings, R.; Biswas, D.; Simões-Capela, N.; Van Helleputte, N.; Van Hoof, C.; Groenendaal, W. Motion artifact reduction for wrist-worn photoplethysmograph sensors based on different wavelengths. Sensons 2019, 19, 673. [Google Scholar] [CrossRef]
- Bousefsaf, F.; Maaoui, C.; Pruski, A. Continuous wavelet filtering on webcam photoplethysmographic signals to remotely assess the instantaneous heart rate. Biomed. Signal Process. Control 2013, 8, 568–574. [Google Scholar] [CrossRef]
- Teng, X.; Zhang, Y. Continuous and noninvasive estimation of arterial blood pressure using a photoplethysmographic approach. In Proceedings of the 25th Annual International Conference of the IEEE Engineering in Medicine and Biology Society (IEEE Cat. No. 03CH37439), Cancun, Mexico, 17–21 September 2003; Volume 4, pp. 3153–3156. [Google Scholar]
- Zhang, Q.; Xie, Q.; Wang, M.; Wang, G. Motion artifact removal for PPG signals based on accurate fundamental frequency estimation and notch filtering. In Proceedings of the 2018 40th Annual International Conference of the IEEE Engineering in Medicine and Biology Society (EMBC), Honolulu, HI, USA, 18–21 July 2018; pp. 2965–2968. [Google Scholar]
- Guo, J.; Chen, X.; Zhao, J.; Zhang, X.; Chen, X. An Effective Photoplethysmography Heart Rate Estimation Framework Integrating Two-Level Denoising Method and Heart Rate Tracking Algorithm Guided by Finite State Machine. IEEE J. Biomed. Health Inform. 2022, 26, 3731–3742. [Google Scholar] [CrossRef]
- Shuzan, M.N.I.; Chowdhury, M.H.; Hossain, M.S.; Chowdhury, M.E.; Reaz, M.B.I.; Uddin, M.M.; Khandakar, A.; Mahbub, Z.B.; Ali, S.H.M. A novel non-invasive estimation of respiration rate from motion corrupted photoplethysmograph signal using machine learning model. IEEE Access 2021, 9, 96775–96790. [Google Scholar] [CrossRef]
- Biswas, D.; Everson, L.; Liu, M.; Panwar, M.; Verhoef, B.-E.; Patki, S.; Kim, C.H.; Acharyya, A.; Van Hoof, C.; Konijnenburg, M.; et al. CorNET: Deep learning framework for PPG-based heart rate estimation and biometric identification in ambulant environment. IEEE Trans. Biomed. Circuits Syst. 2019, 13, 282–291. [Google Scholar] [CrossRef]
- Shin, H.C.; Roth, H.R.; Gao, M.; Lu, L.; Xu, Z.; Nogues, I.; Yao, J.; Mollura, D.; Summers, R.M. Deep convolutional neural networks for computer-aided detection: CNN architectures, dataset characteristics and transfer learning. IEEE Trans. Med. Imaging 2016, 35, 1285–1298. [Google Scholar] [CrossRef] [PubMed]
- Schäck, T.; Muma, M.; Zoubir, A.M. Computationally efficient heart rate estimation during physical exercise using photoplethysmographic signals. In Proceedings of the 2017 25th European Signal Processing Conference (EUSIPCO), Kos, Greece, 28 August–2 September 2017; pp. 2478–2481. [Google Scholar]
- Chowdhury, S.S.; Hyder, R.; Hafiz, M.S.B.; Haque, M.A. Real-time robust heart rate estimation from wrist-type PPG signals using multiple reference adaptive noise cancellation. IEEE J. Biomed. Health Inform. 2016, 22, 450–459. [Google Scholar] [CrossRef]
- Yu, S.-N.; Wang, C.-S.; Chang, Y.P. Heart Rate Estimation from Remote Photoplethysmography Based on Light-weight U-Net and Attention Modules. IEEE Access 2023, 11, 54058–54069. [Google Scholar] [CrossRef]
- Kao, Y.-H.; Chao, P.C.-P.; Wey, C.-L. Design and validation of a new PPG module to acquire high-quality physiological signals for high-accuracy biomedical sensing. IEEE J. Sel. Top. Quant. 2018, 25, 69000210. [Google Scholar] [CrossRef]
- Abreu, S. The Pulse in the Wrist Is Felt Over Which Artery? Available online: https://socratic.org/questions/the-pulse-in-the-wrist-is-felt-over-which-artery (accessed on 1 August 2017).
- Peller, V. An Introduction to Hankel Operators. In Hankel Operators and Their Applications; Springer: Berlin/Heidelberg, Germany, 2003; pp. 1–59. [Google Scholar]
- Banerjee, S.; Roy, A. Linear Algebra and Matrix Analysis for Statistics; CRC Press: Boca Raton, FL, USA, 2014. [Google Scholar]
- Rodgers, J.L.; Nicewander, W.A. Thirteen ways to look at the correlation coefficient. Am. Stat. 1988, 42, 59–66. [Google Scholar] [CrossRef]
- Motin, M.A.; Karmakar, C.K.; Palaniswami, M. PPG derived heart rate estimation during intensive physical exercise. IEEE Access 2019, 7, 56062–56069. [Google Scholar] [CrossRef]


| Year | Technique | Sensors (Database) | Reference Signal | Movement | Mean Absolute Error in (bpm) | Mean Error (bpm) | Measurement Location | |
|---|---|---|---|---|---|---|---|---|
| This study | 2023 | Quality Check and Notch Filtering with peak selection and current and gain tuning | One-channel PPG and 3-axis accelerometer signals recorded in the lab | Accelerometer | Waving the hand | 3.78 95% of HR estimation within ± 9.3 bpm | 0.6525 | Wrist |
| Lin and Ma [13] | 2016 | DWT | PPG signals | None | Waving the hand | 6.87 | NA | NA |
| Hanyu and Xiao hui [6] | 2017 | Statistical Evaluation | PPG signals | None | Finger tapping or hand swinging | 7.85 | NA | NA |
| Chao Zhao et al. [19] | 2021 | ICA, VMD, WSST, SSA, and Kalman Smoothing | A three-axis acceleration signals | None | Finger tapping or hand swinging | 95% of HR estimation within ±8.86 bpm | NA | Wrist |
| Year | Technique | Sensors (Database) | Reference Signal | Movement | Mean Absolute Error (bpm) | Mean Error (bpm) | Measurement Location | |
|---|---|---|---|---|---|---|---|---|
| This Study | 2023 | Hankel Matrix, SVD and Spectral Analysis | Two-channel PPG signals, three-axis accelerations | Accelerometer and a single PPG | Walking | 1.86 | 0.7345 | Wrist |
| Amirhossein Koneshloo et al. [22] | 2019 | Joint Basis Pursuit Linear Program | Two-channel PPG signals, three-axis accelerations | Accelerometer and PPG signal. | Walking and running | 2.61 | NA | Wrist |
| Mohammod Abdul Motin et al. [46] | 2019 | Recursive Wiener Filtering | Two-channel PPG signals, three-axis accelerations | Accelerometer and PPG signal | Walking and running | 1.85 | NA | Wrist |
| Wenwen He et al. [23] | 2020 | Motion tracking, Sparse Representation-based MA elimination, and Spectral Peak Tracking for HR | PPG signals with 3-axis accelerometer signal | Accelerometer | Quasi-periodic motions. | 2.40 | NA | Wrist |
| Deniz Alp Savaskan et al. [24] | 2020 | SPECMAR, TROIKA and JOSS methods along with pre and post processing | Two-channel PPG signals, three-axis acceleration signals for 12 samples | Accelerometer and PPG signal | Walking and running | 4.19 | NA | Wrist |
| Youngsun Kong et al. [10] | 2019 | VFCDM approach, Cubic Spline | Two-channel PPG signals, three-axis acceleration signals | Accelerometer and PPG signal | Walking and running | 2.94 | NA | Wrist |
| Two-channel PPG signals, three-axis acceleration signals (lab) | Accelerometer and PPG signal | Walking and running | NA | Forehead | ||||
| Nicholas Huang et al. [25] | 2020 | TAPIR Method | Two-channel PPG signals, three-axis acceleration signals | Accelerometer and PPG signal | Walking | 9.21 | NA | Wrist |
| K.R. Arunkumar et al. [29] | 2020 | Recursive Least Squares (RLS) and Normalized Least Mean Squares (NLMS) | Two-channel PPG signals, three-axis acceleration signals recorded for 23 samples | Accelerometer and PPG signal. | Walking and running | 1.89 | NA | Wrist |
| S. Friman et al. [8] | 2022 | Electromyogram (EMG) and accelerometer (ACC) | PPG signals with three-axis acceleration signals | Accelerometer, EMG and PPG signal | Walking and running | 2.83 | NA | Wrist |
Disclaimer/Publisher’s Note: The statements, opinions and data contained in all publications are solely those of the individual author(s) and contributor(s) and not of MDPI and/or the editor(s). MDPI and/or the editor(s) disclaim responsibility for any injury to people or property resulting from any ideas, methods, instructions or products referred to in the content. |
© 2023 by the authors. Licensee MDPI, Basel, Switzerland. This article is an open access article distributed under the terms and conditions of the Creative Commons Attribution (CC BY) license (https://creativecommons.org/licenses/by/4.0/).
Share and Cite
Thakur, S.; Chao, P.C.-P.; Tsai, C.-H. Precision Heart Rate Estimation Using a PPG Sensor Patch Equipped with New Algorithms of Pre-Quality Checking and Hankel Decomposition. Sensors 2023, 23, 6180. https://doi.org/10.3390/s23136180
Thakur S, Chao PC-P, Tsai C-H. Precision Heart Rate Estimation Using a PPG Sensor Patch Equipped with New Algorithms of Pre-Quality Checking and Hankel Decomposition. Sensors. 2023; 23(13):6180. https://doi.org/10.3390/s23136180
Chicago/Turabian StyleThakur, Smriti, Paul C.-P. Chao, and Cheng-Han Tsai. 2023. "Precision Heart Rate Estimation Using a PPG Sensor Patch Equipped with New Algorithms of Pre-Quality Checking and Hankel Decomposition" Sensors 23, no. 13: 6180. https://doi.org/10.3390/s23136180
APA StyleThakur, S., Chao, P. C.-P., & Tsai, C.-H. (2023). Precision Heart Rate Estimation Using a PPG Sensor Patch Equipped with New Algorithms of Pre-Quality Checking and Hankel Decomposition. Sensors, 23(13), 6180. https://doi.org/10.3390/s23136180