

Traffic Sign Recognition with Deep Learning: Vegetation Occlusion Detection in Brazilian Environments
 ,
,  , , , , , and
Abstract
1. Introduction
- Development of a new Brazilian TSR dataset (BRTSD) which contains not only annotations of visible traffic signs, but also vegetation occlusion as a new class;
- Vegetation occlusion recognition with the use of YOLOv5 architecture.
2. Materials and Methods
2.1. Data Set Definition
2.2. Obtaining Images
2.3. Annotation Process
2.4. Model Training
2.5. Evaluation Metrics
3. Results
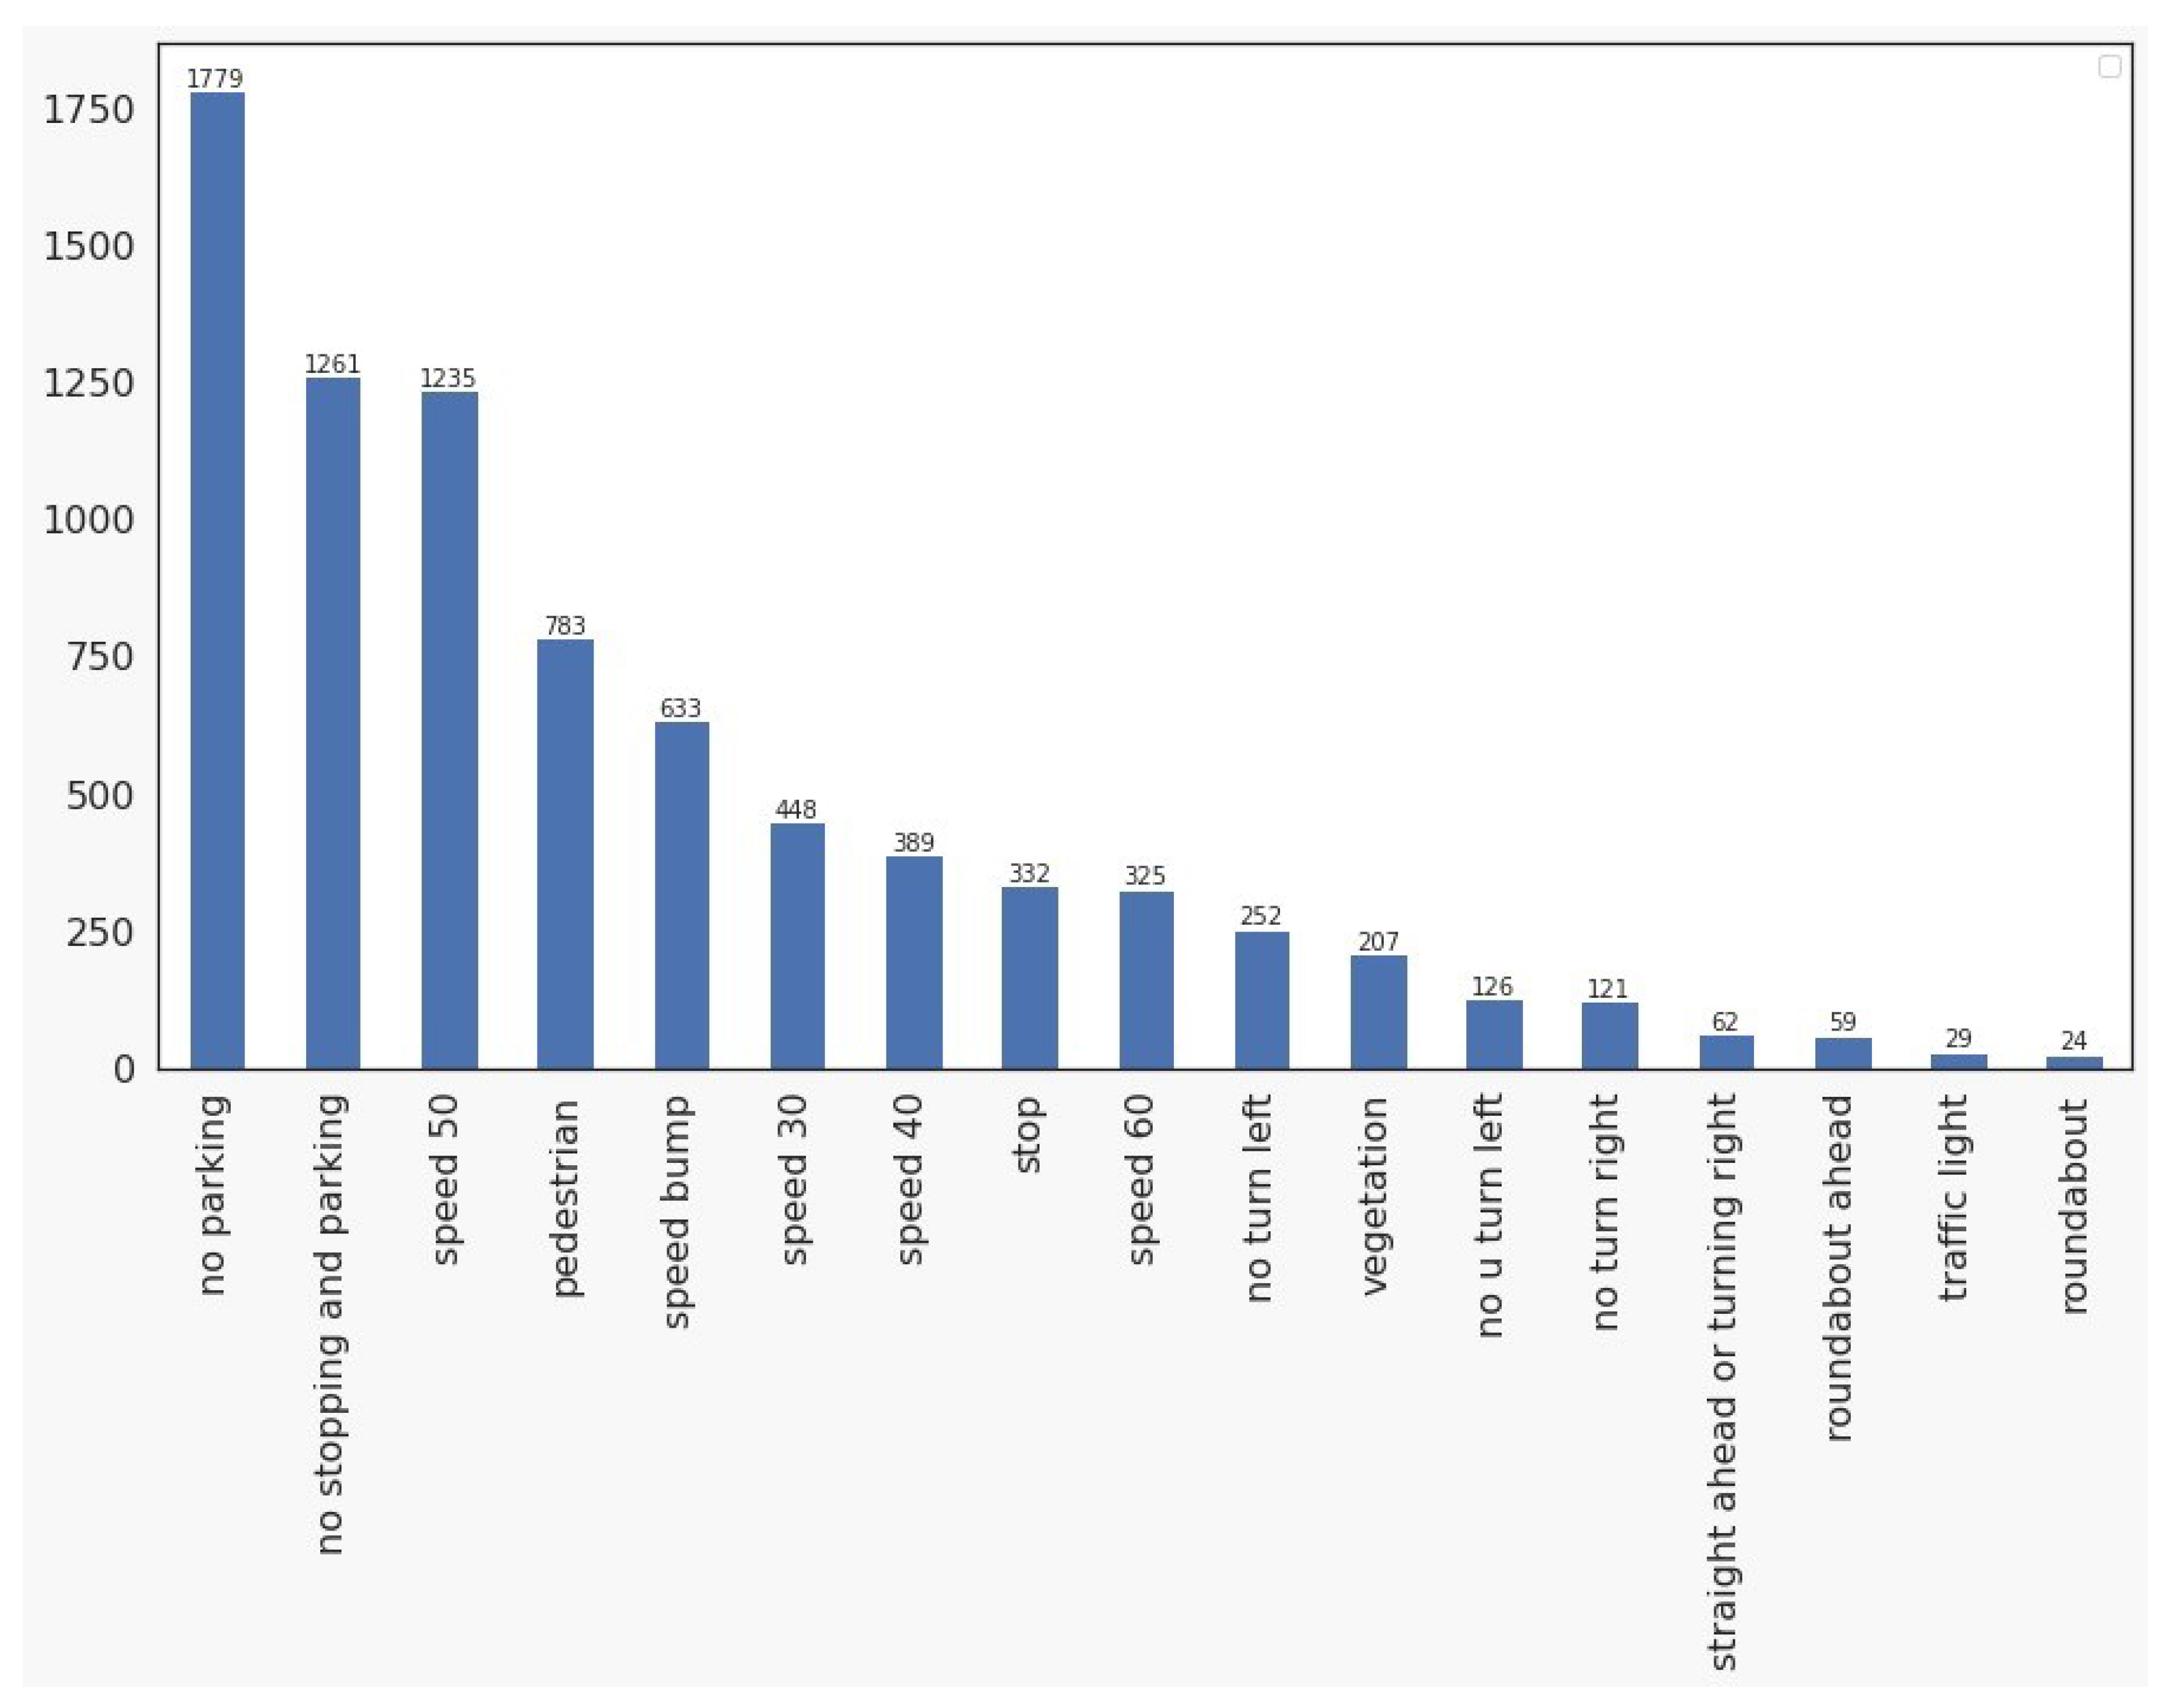
3.1. Dataset
3.2. Training Results
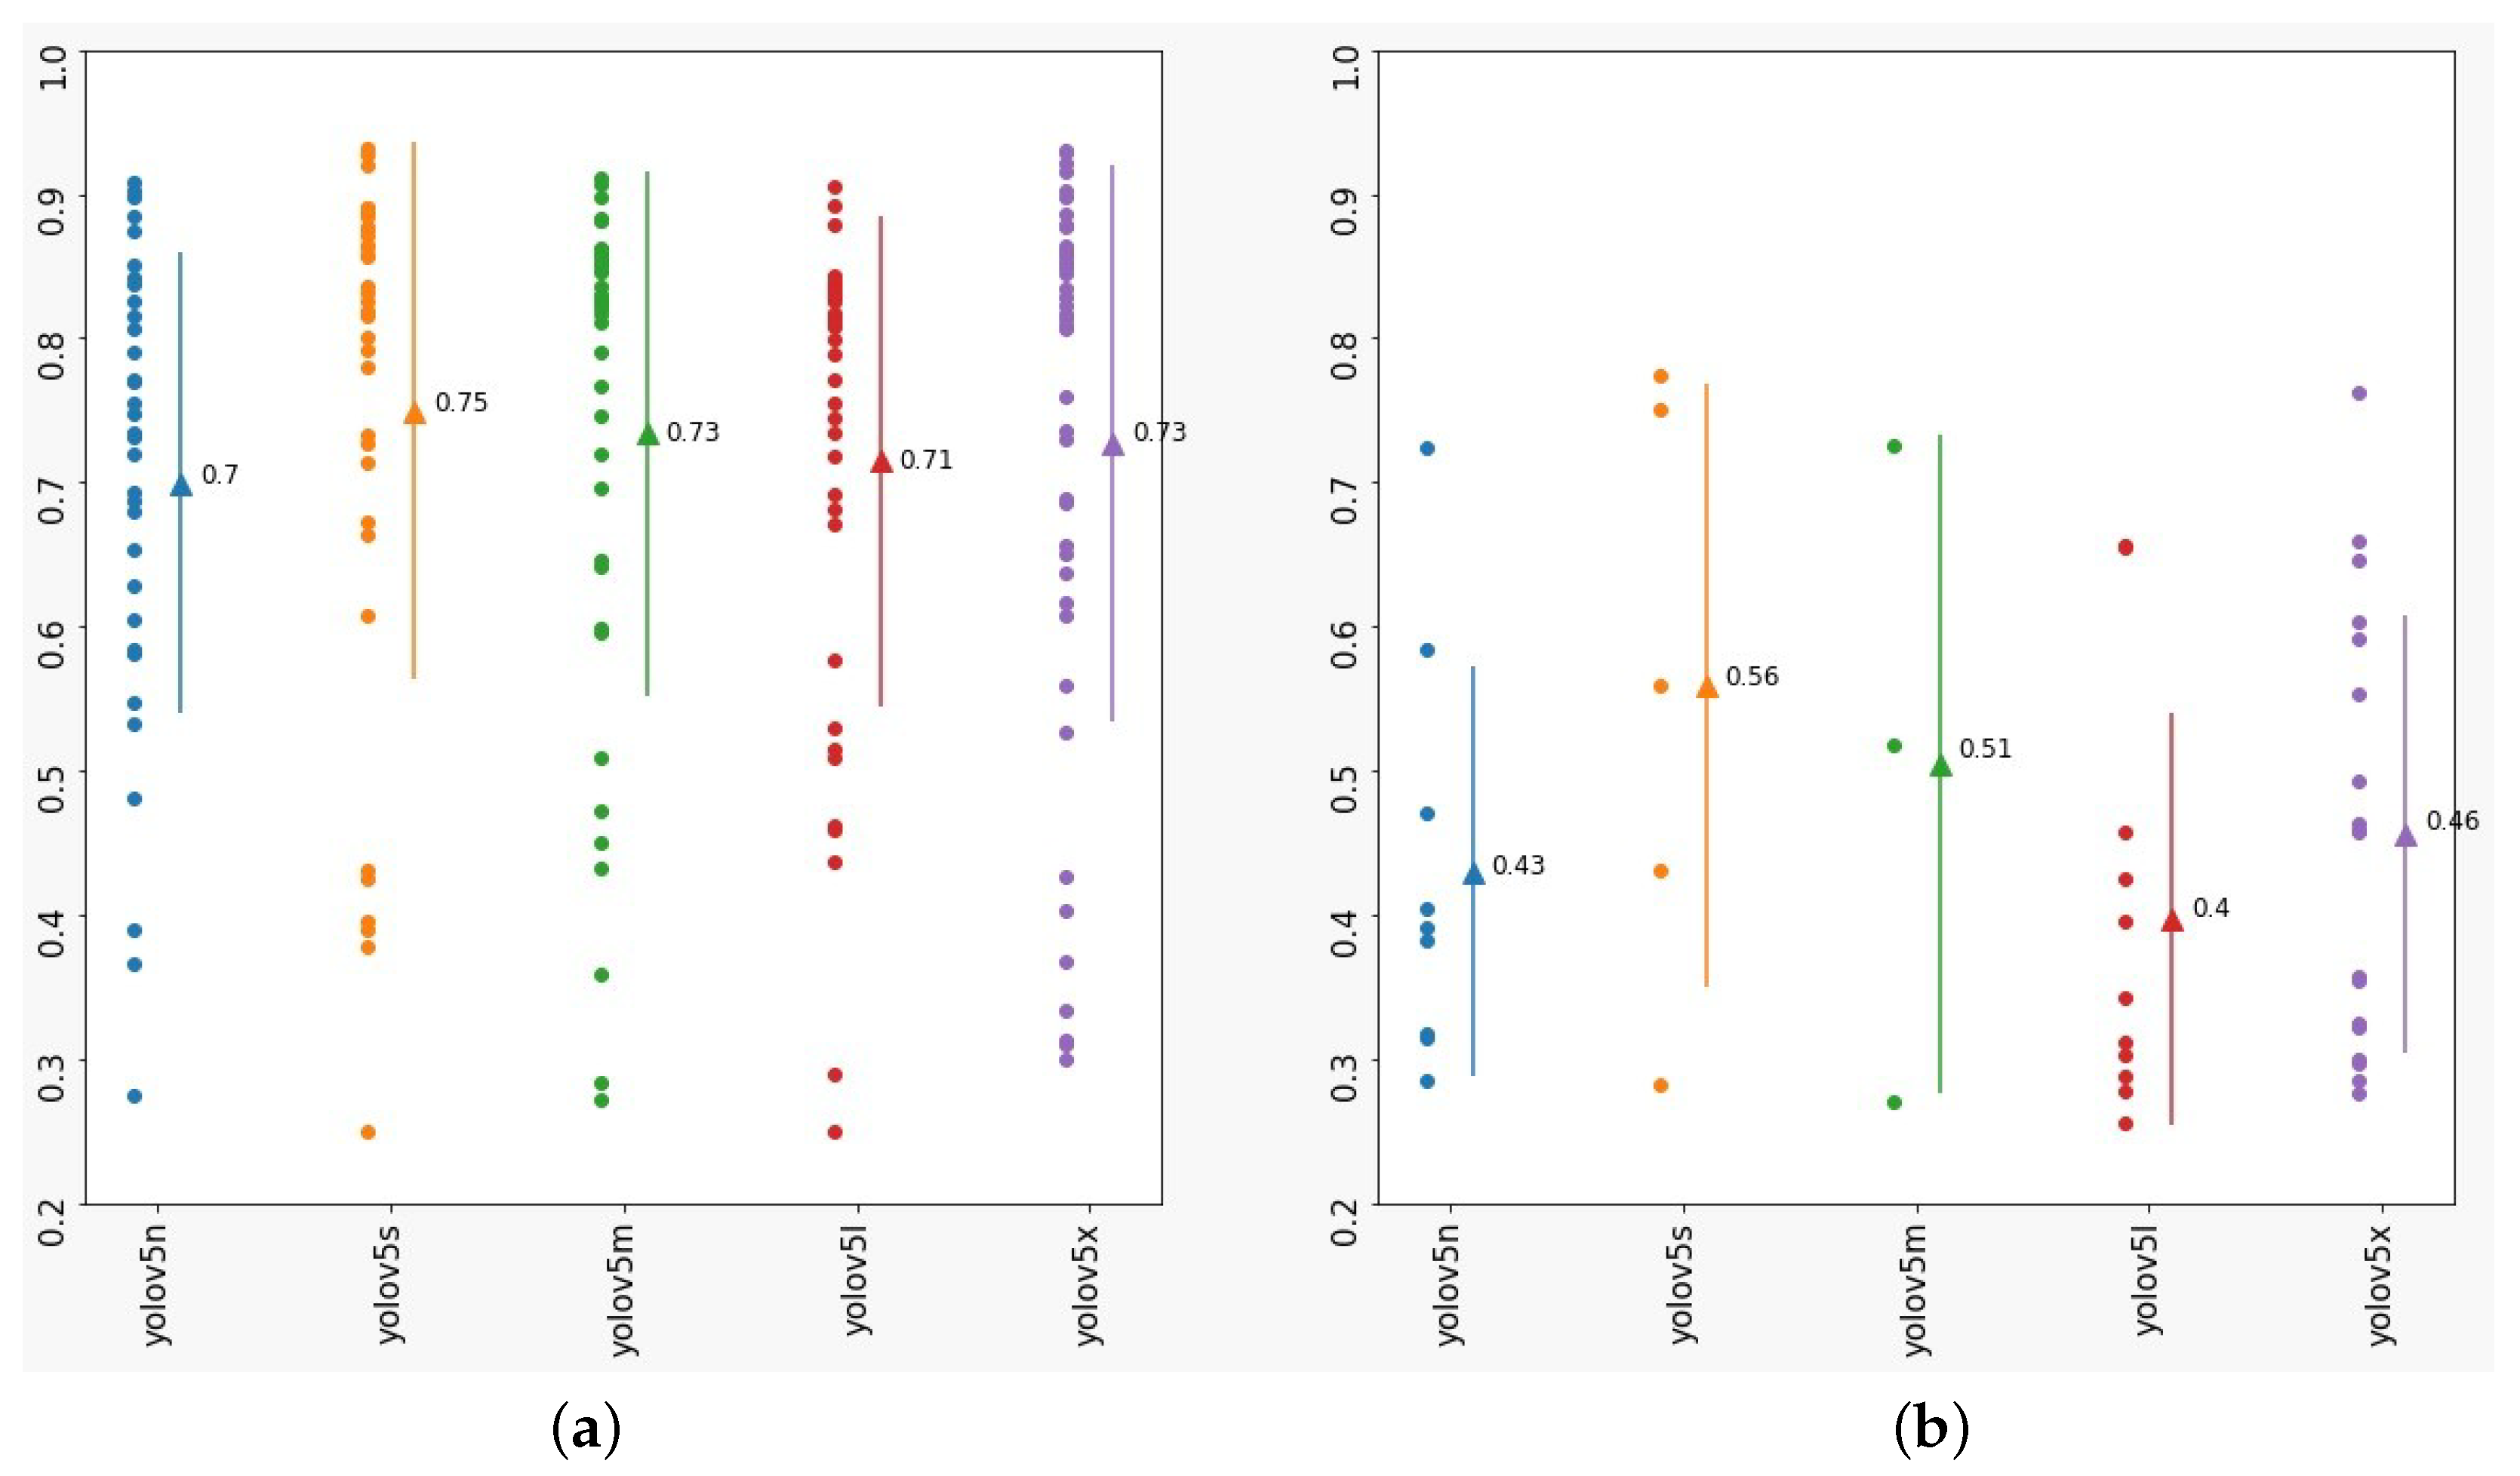
3.3. All Classes Validation Results
3.4. Vegetation Class Validation Results
4. Discussion
5. Conclusions and Future Work
Author Contributions
Funding
Institutional Review Board Statement
Informed Consent Statement
Data Availability Statement
Acknowledgments
Conflicts of Interest
References
- Galvani, M. Classifications of Safety Systems. IEEE Instrum. Meas. Mag. 2019, 22, 11–16. [Google Scholar] [CrossRef]
- Chourasia, K.; Chourasia, J.N. A Review and Comparative Analysis of Recent Advancements in Traffic Sign Detection and Recognition Techniques. SAMRIDDHI J. Phys. Sci. Eng. Technol. 2011, 2, 24–34. [Google Scholar] [CrossRef]
- Cao, J.; Song, C.; Peng, S.; Xiao, F.; Song, S. Improved traffic sign detection and recognition algorithm for intelligent vehicles. Sensors 2019, 19, 4021. [Google Scholar] [CrossRef] [PubMed]
- Silva, R.; Prado, B.; Matos, L.N.; Santo, F.; Zanchettin, C.; Novais, P. Construction of Brazilian Regulatory Traffic Sign Recognition Dataset; Springer: Berlin/Heidelberg, Germany, 2021; pp. 163–172. [Google Scholar] [CrossRef]
- Gu, Y.; Si, B. A Novel Lightweight Real-Time Traffic Sign Detection Integration Framework Based on YOLOv4. Entropy 2022, 24, 487. [Google Scholar] [CrossRef] [PubMed]
- Zhu, Y.; Yan, W.Q. Traffic sign recognition based on deep learning. Multimed. Tools Appl. 2022, 81, 17779–17791. [Google Scholar] [CrossRef]
- Triki, N.; Karray, M.; Ksantini, M. A Real-Time Traffic Sign Recognition Method Using a New Attention-Based Deep Convolutional Neural Network for Smart Vehicles. Appl. Sci. 2023, 13, 4793. [Google Scholar] [CrossRef]
- Ren, S.; He, K.; Girshick, R.; Sun, J. Faster R-CNN: Towards Real-Time Object Detection with Region Proposal Networks. IEEE Trans. Pattern Anal. Mach. Intell. 2017, 39, 1137–1149. [Google Scholar] [CrossRef]
- Bochkovskiy, A.; Wang, C.Y.; Liao, H.Y.M. YOLOv4: Optimal Speed and Accuracy of Object Detection. arXiv 2020, arXiv:2004.10934. [Google Scholar] [CrossRef]
- Liu, W.; Anguelov, D.; Erhan, D.; Szegedy, C.; Reed, S.; Fu, C.Y.; Berg, A.C. SSD: Single Shot Multibox Detector; Lecture Notes in Computer Science (Including Subseries Lecture Notes in Artificial Intelligence and Lecture Notes in Bioinformatics); 9905 LNCS; Springer: Berlin/Heidelberg, Germany, 2016; pp. 21–37. Available online: http://xxx.lanl.gov/abs/1512.02325 (accessed on 10 February 2023). [CrossRef]
- Zhou, K.; Zhan, Y.; Fu, D. Learning region-based attention network for traffic sign recognition. Sensors 2021, 21, 686. [Google Scholar] [CrossRef]
- Stallkamp, J.; Schlipsing, M.; Salmen, J.; Igel, C. Man vs. computer: Benchmarking machine learning algorithms for traffic sign recognition. Neural Netw. 2012, 32, 323–332. [Google Scholar] [CrossRef]
- Houben, S.; Stallkamp, J.; Salmen, J.; Schlipsing, M.; Igel, C. Detection of traffic signs in real-world images: The German traffic sign detection benchmark. In Proceedings of the 2013 International Joint Conference on Neural Networks (IJCNN), Dallas, TX, USA, 4–9 August 2013. [Google Scholar] [CrossRef]
- Timofte, R.; Zimmermann, K.; Van Gool, L. Multi-view traffic sign detection, recognition, and 3D localisation. Mach. Vis. Appl. 2014, 25, 633–647. [Google Scholar] [CrossRef]
- Youssef, A.; Albani, D.; Nardi, D.; Bloisi, D.D. Advanced Concepts for Intelligent Vision Systems; Lecture Notes in Computer Science; Springer International Publishing: Cham, Switzerland, 2016; Volume 10016. [Google Scholar] [CrossRef]
- Saadna, Y.; Behloul, A. An overview of traffic sign detection and classification methods. Int. J. Multimed. Inf. Retr. 2017, 6, 193–210. [Google Scholar] [CrossRef]
- Magnussen, A.F.; Le, N.; Hu, L.; Eric Wong, W. A Survey of the Inadequacies in Traffic Sign Recognition Systems for Autonomous Vehicles. Int. J. Perform. Eng. 2020, 16, 1588. [Google Scholar] [CrossRef]
- Wali, S.B.; Abdullah, M.A.; Hannan, M.A.; Hussain, A.; Samad, S.A.; Ker, P.J.; Mansor, M.B. Vision-Based Traffic Sign Detection and Recognition Systems: Current Trends and Challenges. Sensors 2019, 19, 2093. [Google Scholar] [CrossRef]
- Mannan, A.; Javed, K.; Rehman, A.U.; Babri, H.A.; Noon, S.K. Cognition based Recognition of Partially Occluded Traffic Signs. Sci. Iran. 2022, 29, 1881–1897. [Google Scholar] [CrossRef]
- Rehman, Y.; Riaz, I.; Fan, X.; Shin, H. D-patches: Effective traffic sign detection with occlusion handling. IET Comput. Vis. 2017, 11, 368–377. [Google Scholar] [CrossRef]
- Jocher, G. YOLOv5 by Ultralytics, Version 7.0; Zenodo. 2020. Available online: https://doi.org/10.5281/zenodo.3908559 (accessed on 15 January 2022).
- Mathias, M.; Timofte, R.; Benenson, R.; Van Gool, L. Traffic sign recognition—How far are we from the solution? In Proceedings of the The 2013 International Joint Conference on Neural Networks (IJCNN), Dallas, TX, USA, 4–9 August 2013; pp. 1–8. [Google Scholar] [CrossRef]
- Balali, V.; Golparvar-Fard, M. Video-based detection and classification of US traffic signs and mile markers using color candidate extraction and feature-based recognition. Tech. Rep. 2014, 858–866. [Google Scholar] [CrossRef]
- Prieto, M.S.; Allen, A.R. Using self-organising maps in the detection and recognition of road signs. Image Vis. Comput. 2009, 27, 673–683. [Google Scholar] [CrossRef]
- Zhu, Z.; Liang, D.; Zhang, S.; Huang, X.; Li, B.; Hu, S. Traffic-Sign Detection and Classification in the Wild. In Proceedings of the IEEE Computer Society Conference on Computer Vision and Pattern Recognition, Las Vegas, NV, USA, 26 June–1 July 2016; IEEE Computer Society: New York, NY, USA, 2016; pp. 2110–2118. [Google Scholar] [CrossRef]
- Atif, M.; Zoppi, T.; Gharib, M.; Bondavalli, A. Towards Enhancing Traffic Sign Recognition through Sliding Windows. Sensors 2022, 22, 2683. [Google Scholar] [CrossRef]
- Gilroy, S.; Jones, E.; Glavin, M. Overcoming Occlusion in the Automotive Environment—A Review. IEEE Trans. Intell. Transp. Syst. 2021, 22, 23–35. [Google Scholar] [CrossRef]
- Kim, J.U.; Kwon, J.; Kim, H.G.; Lee, H.; Ro, Y.M. Object Bounding Box-Critic Networks for Occlusion-Robust Object Detection in Road Scene. In Proceedings of the Proceedings—International Conference on Image Processing, ICIP, Athens, Greece, 7–10 October 2018; pp. 1313–1317. [Google Scholar] [CrossRef]
- Mostafa, T.; Chowdhury, S.J.; Rhaman, M.K.; Alam, M.G.R. Occluded Object Detection for Autonomous Vehicles Employing YOLOv5, YOLOX and Faster R-CNN. In Proceedings of the 2022 IEEE 13th Annual Information Technology, Electronics and Mobile Communication Conference, IEMCON, Vancouver, BC, Canada, 12–15 October 2022; pp. 405–410. [Google Scholar] [CrossRef]
- Hirt, P.R.; Holtkamp, J.; Hoegner, L.; Xu, Y.; Stilla, U. Occlusion detection of traffic signs by voxel-based ray tracing using highly detailed models and MLS point clouds of vegetation. Int. J. Appl. Earth Obs. Geoinf. 2022, 114, 103017. [Google Scholar] [CrossRef]
- Zottis Junges, R.; de Paula, M.; de Aguiar, M. Brazilian Traffic Signs Detection and Recognition in Videos Using CLAHE, HOG Feature Extraction and SVM Cascade Classifier with Temporal Coherence. In Proceedings of the Advances in Soft Computing, Xalapa, Mexico, 27 October–2 November 2019; pp. 589–600. [Google Scholar]
- Conselho Nacional de Trânsito (CONTRAN). Manuais Brasileiros de Sinalização de Trânsito. 2022. Available online: https://www.gov.br/transportes/pt-br/assuntos/transito/senatran/manuais-brasileiros-de-sinalizacao-de-transito (accessed on 15 January 2022).
- KartaView. KartaView. 2020. Available online: https://kartaview.org/ (accessed on 15 January 2022).
- Tkachenko, M.; Malyuk, M.; Holmanyuk, A.; Liubimov, N. Label Studio: Data labeling software. Available online: https://labelstud.io/ (accessed on 15 January 2022).
- Wada, K. Labelme: Image Polygonal Annotation with Python. Available online: https://github.com/zhong110020/labelme (accessed on 15 January 2022).
- CVAT.ai Corporation. Computer Vision Annotation Tool (CVAT), Version 2.0.0; CVAT.ai Corporation: Palo Alto, CA, USA, 2022.
- Padilla, R.; Netto, S.L.; da Silva, E.A.B. A Survey on Performance Metrics for Object-Detection Algorithms. In Proceedings of the 2020 International Conference on Systems, Signals and Image Processing (IWSSIP), Niteroi, Brazil, 1–3 July 2020; pp. 237–242. [Google Scholar]
- Consortium, C. COCO Common Objects in Context. 2015. Available online: https://cocodataset.org/#home (accessed on 23 January 2022).


| Model | Parameters (M) |
|---|---|
| yolov5n | 1.9 |
| yolov5s | 7.2 |
| yolov5m | 21.2 |
| yolov5l | 46.5 |
| yolov5x | 86.5 |
| Dataset | Classes | Images | Objects |
|---|---|---|---|
| BTSD | 62 | 9006 | 13,444 |
| DITS | 3 | 1872 | 1891 |
| GTSDB | 43 | 900 | 1206 |
| ITSDB | 1 | 5806 | 43,290 |
| BRTSD | 17 | 5631 | 8065 |
| Model | mAP | Precision | Recall |
|---|---|---|---|
| yolov5n | 0.609 | 0.810 | 0.832 |
| yolov5s | 0.672 | 0.856 | 0.869 |
| yolov5m | 0.718 | 0.921 | 0.851 |
| yolov5l | 0.700 | 0.889 | 0.893 |
| yolov5x | 0.750 | 0.951 | 0.865 |
| Model | Precision | Recall | F1-Score | AP |
|---|---|---|---|---|
| yolov5n | 0.795 | 0.583 | 0.673 | 0.337 |
| yolov5s | 0.878 | 0.600 | 0.713 | 0.379 |
| yolov5m | 0.929 | 0.650 | 0.765 | 0.427 |
| yolov5l | 0.771 | 0.617 | 0.685 | 0.411 |
| yolov5x | 0.726 | 0.750 | 0.738 | 0.454 |
Disclaimer/Publisher’s Note: The statements, opinions and data contained in all publications are solely those of the individual author(s) and contributor(s) and not of MDPI and/or the editor(s). MDPI and/or the editor(s) disclaim responsibility for any injury to people or property resulting from any ideas, methods, instructions or products referred to in the content. |
© 2023 by the authors. Licensee MDPI, Basel, Switzerland. This article is an open access article distributed under the terms and conditions of the Creative Commons Attribution (CC BY) license (https://creativecommons.org/licenses/by/4.0/).
Share and Cite
Dalborgo, V.; Murari, T.B.; Madureira, V.S.; Moraes, J.G.L.; Bezerra, V.M.O.S.; Santos, F.Q.; Silva, A.; Monteiro, R.L.S. Traffic Sign Recognition with Deep Learning: Vegetation Occlusion Detection in Brazilian Environments. Sensors 2023, 23, 5919. https://doi.org/10.3390/s23135919
Dalborgo V, Murari TB, Madureira VS, Moraes JGL, Bezerra VMOS, Santos FQ, Silva A, Monteiro RLS. Traffic Sign Recognition with Deep Learning: Vegetation Occlusion Detection in Brazilian Environments. Sensors. 2023; 23(13):5919. https://doi.org/10.3390/s23135919
Chicago/Turabian StyleDalborgo, Vanessa, Thiago B. Murari, Vinicius S. Madureira, João Gabriel L. Moraes, Vitor Magno O. S. Bezerra, Filipe Q. Santos, Alexandre Silva, and Roberto L. S. Monteiro. 2023. "Traffic Sign Recognition with Deep Learning: Vegetation Occlusion Detection in Brazilian Environments" Sensors 23, no. 13: 5919. https://doi.org/10.3390/s23135919
APA StyleDalborgo, V., Murari, T. B., Madureira, V. S., Moraes, J. G. L., Bezerra, V. M. O. S., Santos, F. Q., Silva, A., & Monteiro, R. L. S. (2023). Traffic Sign Recognition with Deep Learning: Vegetation Occlusion Detection in Brazilian Environments. Sensors, 23(13), 5919. https://doi.org/10.3390/s23135919