
Optimal Combination of Mother Wavelet and AI Model for Precise Classification of Pediatric Electroretinogram Signals


Abstract
1. Introduction
2. Related Works

| Year | First Author and Reference | Mother Wavelet | Number of Signals (Subjects) |
|---|---|---|---|
| 2005 | Penkala [16] | Morlet Wavelet, Ricker Wavelet | 120 (N/A) |
| 2007 | Penkala [15] | 102 (N/A) | |
| 2010 | Barraco [21] | Ricker Wavelet | 24 (N/A) |
| 2011 | Barraco [22] | N/A (10) | |
| 2011 | Barraco [23] | N/A (10) | |
| 2014 | Gauvin [19] | Morse Wavelet | N/A (40) |
| 2014 | Dimopoulos [18] | Morlet Wavelet | N/A (63) |
| 2015 | Miguel-Jiménez [24] | N/A (47) | |
| 2020 | Ahmadieh [17] | N/A (36) | |
| 2022 | Zhdanov [20] | Gaussian Wavelet | 425 (N/A) |
3. Materials and Methods
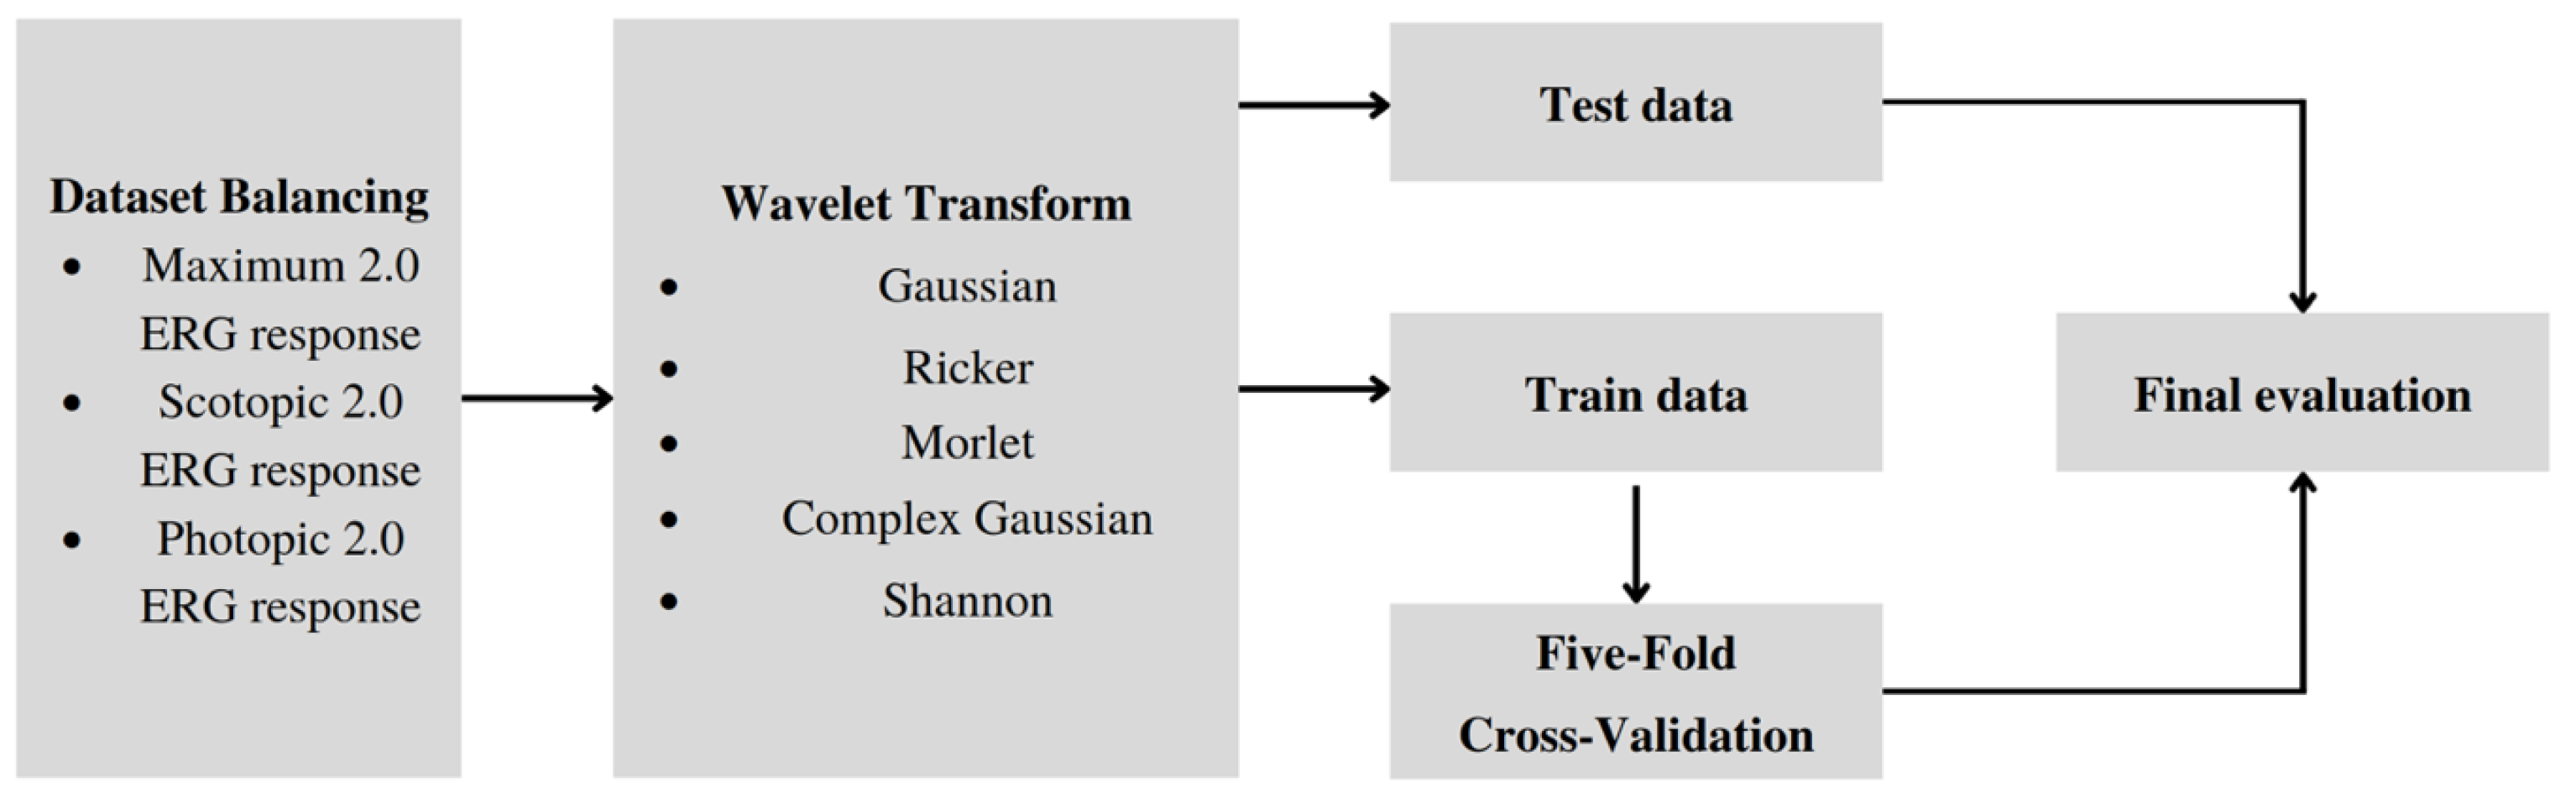
3.1. Dataset Balancing
3.2. Training Pipeline
3.2.1. Data Preprocessing
3.2.2. Baseline
3.2.3. Loss Function
- —one-hot encoded ground truth distribution,
- —predicted probability distribution,
- N—the size of the training set.
3.2.4. Data Augmentation
3.2.5. Cross Validation
3.2.6. Evaluation
- ,
- ,
- .
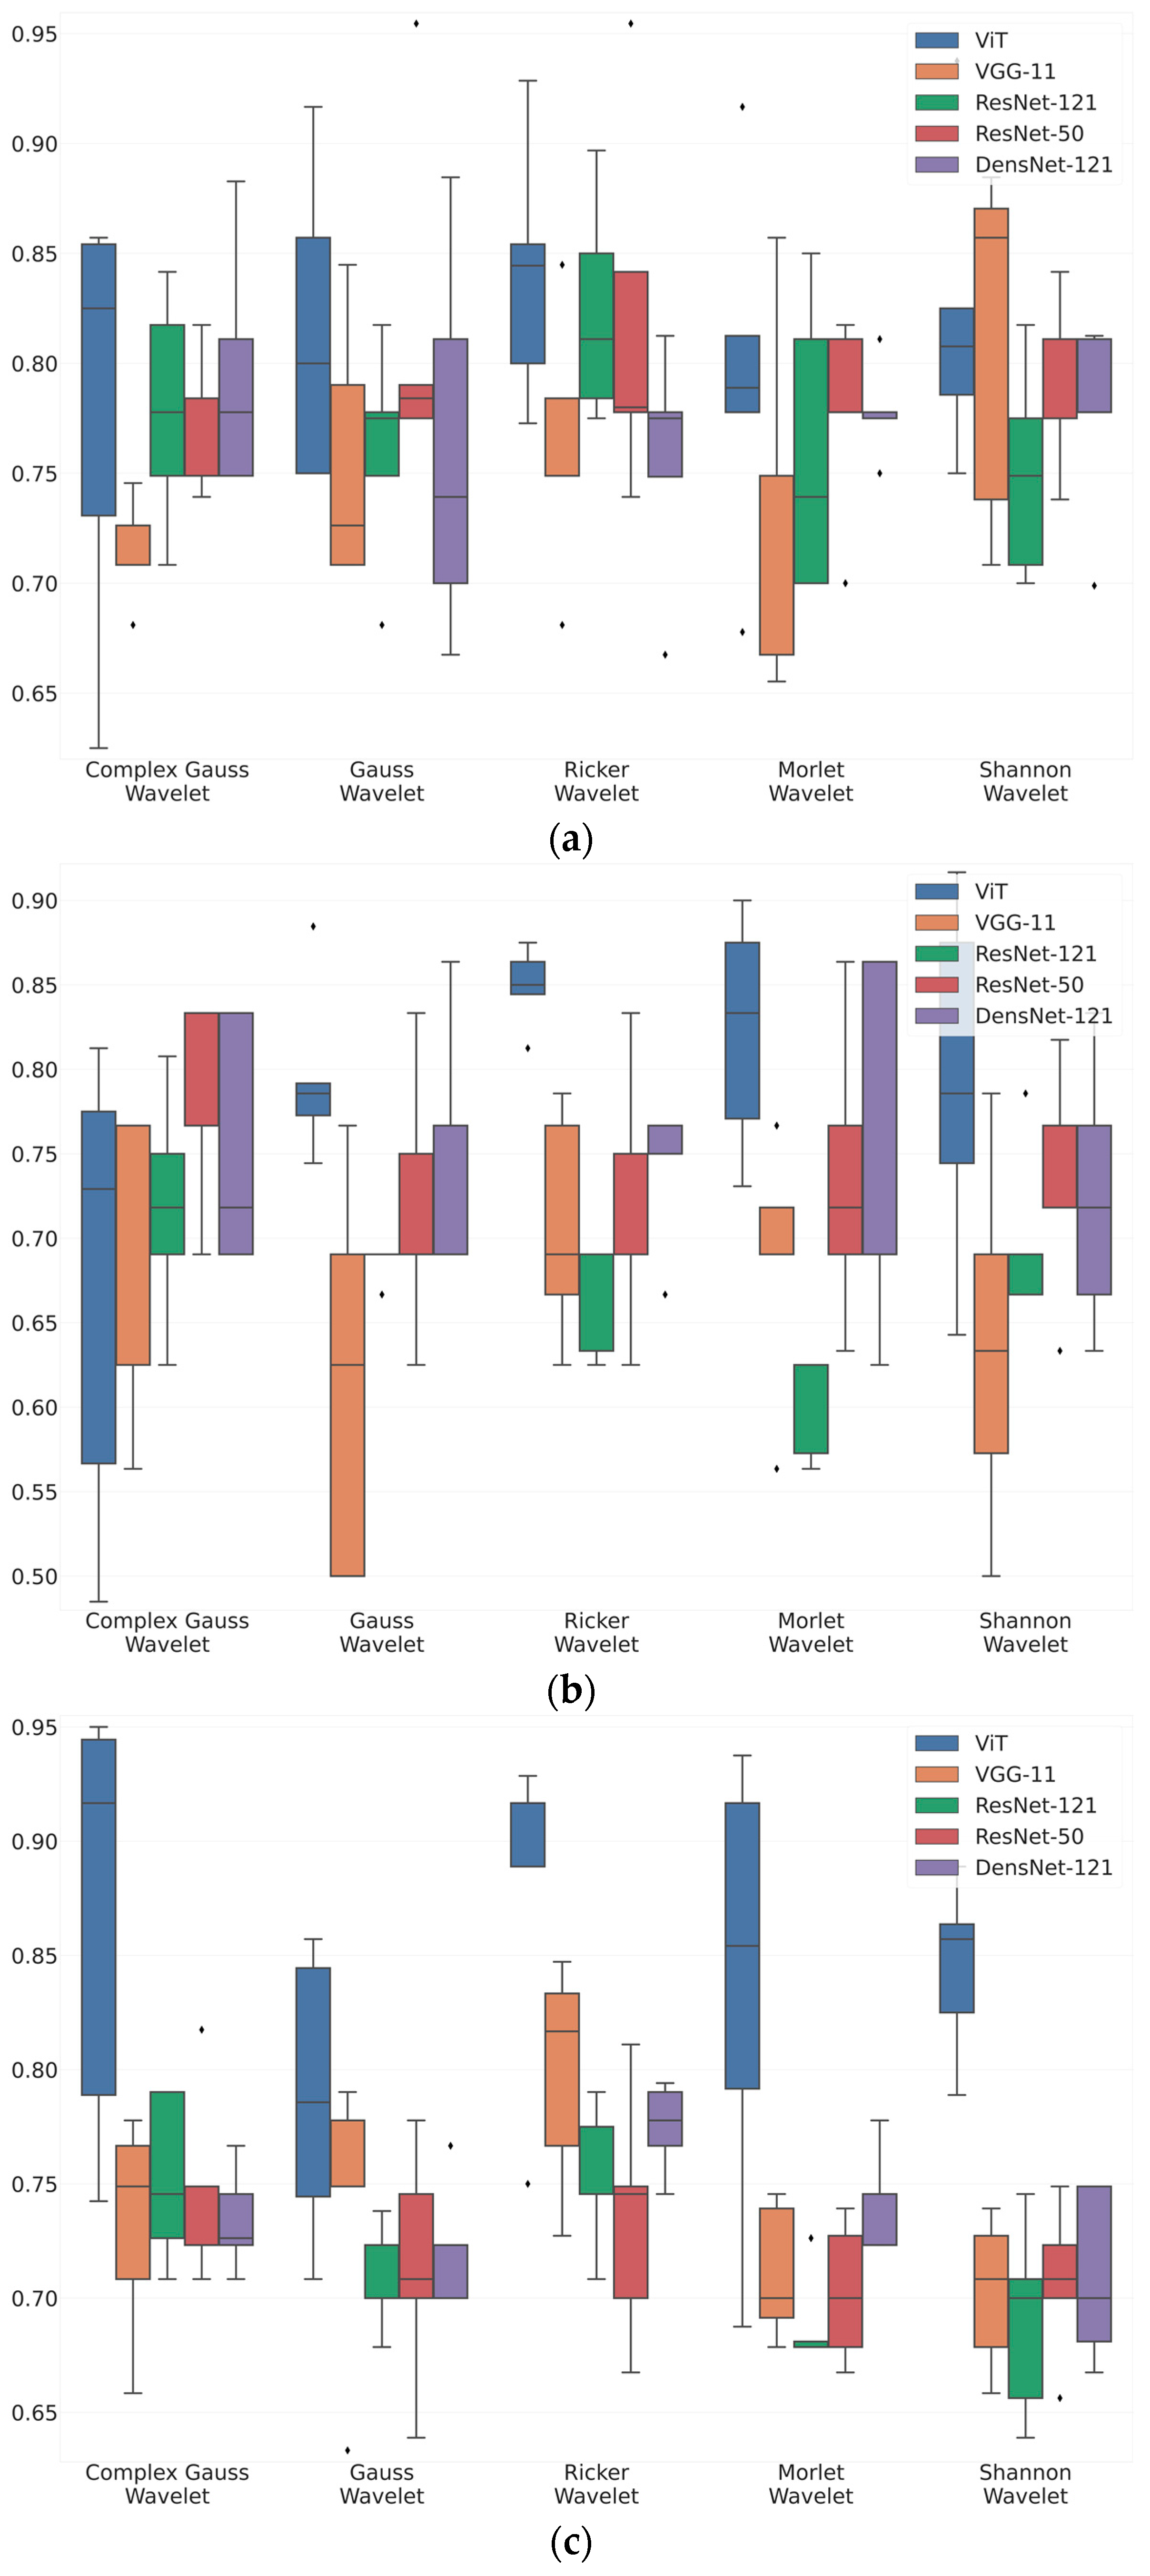
4. Results
5. Discussion
- Wavelet characteristics: the specific properties of the Ricker Wavelet, including its shape and frequency properties, align well with the features present in ERG wavelet scalograms, leading to improved accuracy in classification compared to other wavelet types.
- Noise suppression capabilities: the Ricker Wavelet demonstrates superior noise suppression capabilities, effectively reducing unwanted noise in ERG wavelet scalograms while preserving important signal components, resulting in enhanced accuracy.
- Time-frequency localization: the Ricker Wavelet excels in accurately localizing transient and sustained components of ERG waveforms across different time intervals, enabling better capture and representation of crucial temporal features, thereby increasing the discriminative power of the wavelet in classifying ERG responses.
Limitations
6. Conclusions
Author Contributions
Funding
Institutional Review Board Statement
Informed Consent Statement
Data Availability Statement
Conflicts of Interest
Appendix A
| VGG-11 | ||||
| Mother Wavelet Function | Balanced Accuracy | Recall | F1 | Precision |
| Complex Gaussian Wavelet | 0.714 | 0.885 | 0.745 | 0.65 |
| Gaussian Wavelet | 0.756 | 0.86 | 0.771 | 0.73 |
| Ricker Wavelet | 0.762 | 0.819 | 0.81 | 0.82 |
| Morlet Wavelet | 0.719 | 0.783 | 0.795 | 0.82 |
| Shannon Wavelet | 0.812 | 0.773 | 0.835 | 0.92 |
| ResNet-50 | ||||
| Mother Wavelet Function | Balanced Accuracy | Recall | F1 | Precision |
| Complex Gaussian Wavelet | 0.779 | 0.858 | 0.841 | 0.83 |
| Gaussian Wavelet | 0.76 | 0.86 | 0.828 | 0.8 |
| Ricker Wavelet | 0.823 | 0.874 | 0.881 | 0.89 |
| Morlet Wavelet | 0.76 | 0.861 | 0.827 | 0.8 |
| Shannon Wavelet | 0.75 | 0.845 | 0.826 | 0.81 |
| DensNet-121 | ||||
| Mother Wavelet Function | Balanced Accuracy | Recall | F1 | Precision |
| Complex Gaussian Wavelet | 0.779 | 0.858 | 0.841 | 0.83 |
| Gaussian Wavelet | 0.76 | 0.86 | 0.828 | 0.8 |
| Ricker Wavelet | 0.823 | 0.874 | 0.881 | 0.89 |
| Morlet Wavelet | 0.76 | 0.861 | 0.827 | 0.8 |
| Shannon Wavelet | 0.75 | 0.845 | 0.826 | 0.81 |
| ResNext-50 | ||||
| Mother Wavelet Function | Balanced Accuracy | Recall | F1 | Precision |
| Complex Gaussian Wavelet | 0.768 | 0.856 | 0.835 | 0.82 |
| Gaussian Wavelet | 0.816 | 0.873 | 0.869 | 0.87 |
| Ricker Wavelet | 0.819 | 0.845 | 0.869 | 0.9 |
| Morlet Wavelet | 0.777 | 0.866 | 0.847 | 0.83 |
| Shannon Wavelet | 0.788 | 0.846 | 0.857 | 0.87 |
| Vision Transformer | ||||
| Mother Wavelet Function | Balanced Accuracy | Recall | F1 | Precision |
| Complex Gaussian Wavelet | 0.778 | 0.74 | 0.812 | 0.895 |
| Gaussian Wavelet | 0.815 | 0.658 | 0.77 | 0.891 |
| Ricker Wavelet | 0.84 | 0.727 | 0.802 | 0.867 |
| Morlet Wavelet | 0.795 | 0.738 | 0.789 | 0.833 |
| Shannon Wavelet | 0.821 | 0.72 | 0.782 | 0.84 |
| VGG-11 | ||||
| Mother Wavelet Function | Balanced Accuracy | Recall | F1 | Precision |
| Complex Gaussian Wavelet | 0.669 | 0.644 | 0.668 | 0.7 |
| Gaussian Wavelet | 0.616 | 0.598 | 0.574 | 0.575 |
| Ricker Wavelet | 0.707 | 0.629 | 0.707 | 0.805 |
| Morlet Wavelet | 0.691 | 0.675 | 0.674 | 0.7 |
| Shannon Wavelet | 0.636 | 0.59 | 0.613 | 0.655 |
| ResNet-50 | ||||
| Mother Wavelet Function | Balanced Accuracy | Recall | F1 | Precision |
| Complex Gaussian Wavelet | 0.718 | 0.701 | 0.684 | 0.68 |
| Gaussian Wavelet | 0.686 | 0.688 | 0.673 | 0.675 |
| Ricker Wavelet | 0.655 | 0.677 | 0.62 | 0.575 |
| Morlet Wavelet | 0.602 | 0.606 | 0.6 | 0.625 |
| Shannon Wavelet | 0.7 | 0.657 | 0.66 | 0.705 |
| DensNet-121 | ||||
| Mother Wavelet Function | Balanced Accuracy | Recall | F1 | Precision |
| Complex Gaussian Wavelet | 0.753 | 0.707 | 0.723 | 0.755 |
| Gaussian Wavelet | 0.756 | 0.79 | 0.714 | 0.65 |
| Ricker Wavelet | 0.743 | 0.8 | 0.679 | 0.6 |
| Morlet Wavelet | 0.747 | 0.761 | 0.707 | 0.65 |
| Shannon Wavelet | 0.724 | 0.79 | 0.614 | 0.5 |
| ResNext-50 | ||||
| Mother Wavelet Function | Balanced Accuracy | Recall | F1 | Precision |
| Complex Gaussian Wavelet | 0.778 | 0.813 | 0.608 | 0.55 |
| Gaussian Wavelet | 0.718 | 0.742 | 0.691 | 0.675 |
| Ricker Wavelet | 0.718 | 0.685 | 0.71 | 0.73 |
| Morlet Wavelet | 0.734 | 0.783 | 0.667 | 0.575 |
| Shannon Wavelet | 0.731 | 0.796 | 0.668 | 0.6 |
| Vision Transformer | ||||
| Mother Wavelet Function | Balanced Accuracy | Recall | F1 | Precision |
| Complex Gaussian Wavelet | 0.674 | 0.739 | 0.712 | 0.718 |
| Gaussian Wavelet | 0.796 | 0.676 | 0.762 | 0.848 |
| Ricker Wavelet | 0.849 | 0.775 | 0.825 | 0.833 |
| Morlet Wavelet | 0.822 | 0.845 | 0.736 | 0.701 |
| Shannon Wavelet | 0.793 | 0.724 | 0.764 | 0.78 |
| VGG-11 | ||||
| Mother Wavelet Function | Balanced Accuracy | Recall | F1 | Precision |
| Complex Gaussian Wavelet | 0.732 | 0.877 | 0.782 | 0.71 |
| Gaussian Wavelet | 0.74 | 0.878 | 0.797 | 0.73 |
| Ricker Wavelet | 0.798 | 0.964 | 0.798 | 0.7 |
| Morlet Wavelet | 0.711 | 0.881 | 0.736 | 0.64 |
| Shannon Wavelet | 0.702 | 0.876 | 0.711 | 0.62 |
| ResNet-50 | ||||
| Mother Wavelet Function | Balanced Accuracy | Recall | F1 | Precision |
| Complex Gaussian Wavelet | 0.752 | 0.912 | 0.79 | 0.7 |
| Gaussian Wavelet | 0.713 | 0.895 | 0.725 | 0.62 |
| Ricker Wavelet | 0.753 | 0.896 | 0.8 | 0.73 |
| Morlet Wavelet | 0.689 | 0.857 | 0.731 | 0.64 |
| Shannon Wavelet | 0.69 | 0.842 | 0.74 | 0.67 |
| DensNet-121 | ||||
| Mother Wavelet Function | Balanced Accuracy | Recall | F1 | Precision |
| Complex Gaussian Wavelet | 0.734 | 0.899 | 0.772 | 0.68 |
| Gaussian Wavelet | 0.718 | 0.868 | 0.773 | 0.7 |
| Ricker Wavelet | 0.775 | 0.938 | 0.806 | 0.71 |
| Morlet Wavelet | 0.743 | 0.899 | 0.785 | 0.7 |
| Shannon Wavelet | 0.709 | 0.849 | 0.778 | 0.72 |
| ResNext-50 | ||||
| Mother Wavelet Function | Balanced Accuracy | Recall | F1 | Precision |
| Complex Gaussian Wavelet | 0.749 | 0.866 | 0.813 | 0.77 |
| Gaussian Wavelet | 0.714 | 0.859 | 0.775 | 0.71 |
| Ricker Wavelet | 0.735 | 0.872 | 0.792 | 0.73 |
| Morlet Wavelet | 0.703 | 0.858 | 0.733 | 0.71 |
| Shannon Wavelet | 0.707 | 0.854 | 0.769 | 0.7 |
| Vision Transformer | ||||
| Mother Wavelet Function | Balanced Accuracy | Recall | F1 | Precision |
| Complex Gaussian Wavelet | 0.868 | 0.857 | 0.902 | 0.893 |
| Gaussian Wavelet | 0.788 | 0.785 | 0.787 | 0.791 |
| Ricker Wavelet | 0.875 | 0.758 | 0.852 | 0.895 |
| Morlet Wavelet | 0.838 | 0.863 | 0.851 | 0.807 |
| Shannon Wavelet | 0.845 | 0.778 | 0.83 | 0.856 |
References
- Constable, P.; Marmolejo-Ramos, F.; Gauthier, M.; Lee, I.; Skuse, D.; Thompson, D. Discrete Wavelet Transform Analysis of the Electroretinogram in Autism Spectrum Disorder and Attention Deficit Hyperactivity Disorder. Front. Neurosci. 2022, 16, 890461. [Google Scholar] [CrossRef] [PubMed]
- Manjur, S.; Hossain, M.B.; Constable, P.; Thompson, D.; Marmolejo-Ramos, F.; Lee, I.; Skuse, D.; Posada-Quintero, H. Detecting Autism Spectrum Disorder Using Spectral Analysis of Electroretinogram and Machine Learning: Preliminary results. IEEE Eng. Med. Biol. Soc. 2022, 2022, 3435–3438. [Google Scholar] [CrossRef]
- Constable, P.; Bach, M.; Frishman, L.; Jeffrey, B.; Robson, A. ISCEV Standard for clinical electro-oculography (2017 update). Doc. Ophthalmol. Adv. Ophthalmol. 2017, 134, 1–9. [Google Scholar] [CrossRef] [PubMed]
- Arden, G.; Constable, P. The electro-oculogram. Prog. Retin. Eye Res. 2006, 25, 207–248. [Google Scholar] [CrossRef] [PubMed]
- Umeya, N.; Miyawaki, I.; Inada, H. Use of an alternating current amplifier when recording the ERG c-wave to evaluate the function of retinal pigment epithelial cells in rats. Doc. Ophthalmol. 2022, 145, 147–155. [Google Scholar] [CrossRef]
- Zhdanov, A.; Constable, P.; Manjur, S.M.; Dolganov, A.; Posada-Quintero, H.F.; Lizunov, A. OculusGraphy: Signal Analysis of the Electroretinogram in a Rabbit Model of Endophthalmitis Using Discrete and Continuous Wavelet Transforms. Bioengineering 2023, 10, 708. [Google Scholar] [CrossRef]
- Zhdanov, A.; Evdochim, L.; Borisov, V.; Bao, X.; Dolganov, A.; Kazaijkin, V. OculusGraphy: Filtering of Electroretinography Response in Adults. Young Prof. Electron Devices Mater. 2021, 2021, 395–398. [Google Scholar] [CrossRef]
- Constable, P.; Gaigg, S.; Bowler, D.; Jägle, H.; Thompson, D. Full-field electroretinogram in autism spectrum disorder. Doc. Ophthalmol. Adv. Ophthalmol. 2016, 132, 83–99. [Google Scholar] [CrossRef] [PubMed]
- Constable, P.; Ritvo, R.A.; Ritvo, A.; Lee, I.; McNair, M.; Stahl, D.; Sowden, J.; Quinn, S.; Skuse, D.; Thompson, D.; et al. Light-Adapted Electroretinogram Differences in Autism Spectrum Disorder. J. Autism Dev. Disord. 2020, 50, 2874–2885. [Google Scholar] [CrossRef]
- McAnany, J.J.; Persidina, O.; Park, J. Clinical electroretinography in diabetic retinopathy: A review. Surv. Ophthalmol. 2021, 67, 712–722. [Google Scholar] [CrossRef]
- Kim, T.H.; Wang, B.; Lu, Y.; Son, T.; Yao, X. Functional Optical Coherence Tomography Enables in vivo Optoretinography of Photoreceptor Dysfunction due to Retinal Degeneration. Biomed. Opt. Express 2020, 11, 5306–5320. [Google Scholar] [CrossRef] [PubMed]
- Hayashi, T.; Hosono, K.; Kurata, K.; Katagiri, S.; Mizobuchi, K.; Ueno, S.; Kondo, M.; Nakano, T.; Hotta, Y. Coexistence of GNAT1 and ABCA4 variants associated with Nougaret-type congenital stationary night blindness and childhood-onset cone-rod dystrophy. Doc. Ophthalmol. 2020, 140, 147–157. [Google Scholar] [CrossRef] [PubMed]
- Kim, H.M.; Joo, K.; Han, J.; Woo, S.J. Clinical and Genetic Characteristics of Korean Congenital Stationary Night Blindness Patients. Genes 2021, 12, 789. [Google Scholar] [CrossRef] [PubMed]
- Zhdanov, A.E.; Dolganov, A.Y.; Zanca, D.; Borisov, V.I.; Lucian, E.; Dorosinskiy, L.G. Evaluation of the effectiveness of the decision support algorithm for physicians in retinal dystrophy using machine learning methods. Comput. Opt. 2023, 42, 272–277. [Google Scholar] [CrossRef]
- Penkala, K.; Jaskuła, M.; Lubiński, W. Improvement of the PERG parameters measurement accuracy in the continuous wavelet transform coefficients domain. Ann. Acad. Med. Stetin. 2007, 53 (Suppl. 1), 58–60; discussion 61. [Google Scholar]
- Penkala, K. Analysis of bioelectrical signals of the human retina (PERG) and visual cortex (PVEP) evoked by pattern stimuli. Bull. Pol. Acad. Sci. Tech. Sci. 2005, 53, 223–229. [Google Scholar]
- Ahmadieh, H.; Behbahani, S.; Safi, S. Continuous wavelet transform analysis of ERG in patients with diabetic retinopathy. Doc. Ophthalmol. 2021, 142, 305–314. [Google Scholar] [CrossRef]
- Dimopoulos, I.; Freund, P.; Redel, T.; Dornstauder, B.; Gilmour, G.; Sauvé, Y. Changes in Rod and Cone-Driven Oscillatory Potentials in the Aging Human Retina. Investig. Ophthalmol. Vis. Sci. 2014, 55, 5058–5073. [Google Scholar] [CrossRef]
- Gauvin, M.; Lina, j.m.; Lachapelle, P. Advance in ERG Analysis: From Peak Time and Amplitude to Frequency, Power, and Energy. BioMed Res. Int. 2014, 2014, 246096. [Google Scholar] [CrossRef]
- Zhdanov, A.; Dolganov, A.; Zanca, D.; Borisov, V.; Ronkin, M. Advanced Analysis of Electroretinograms Based on Wavelet Scalogram Processing. Appl. Sci. 2022, 12, 12365. [Google Scholar] [CrossRef]
- Barraco, R.; Adorno, D.P.; Brai, M. Wavelet analysis of human photoreceptoral response. In Proceedings of the 2010 3rd International Symposium on Applied Sciences in Biomedical and Communication Technologies (ISABEL 2010), Rome, Italy, 7–10 November 2010; pp. 1–4. [Google Scholar] [CrossRef]
- Barraco, R.; Persano Adorno, D.; Brai, M. An approach based on wavelet analysis for feature extraction in the a-wave of the electroretinogram. Comput. Methods Programs Biomed. 2011, 104, 316–324. [Google Scholar] [CrossRef] [PubMed]
- Barraco, R.; Persano Adorno, D.; Brai, M. ERG signal analysis using wavelet transform. Theory Biosci. 2011, 130, 155–163. [Google Scholar] [CrossRef] [PubMed]
- Miguel-Jiménez, J.M.; Blanco, R.; De-Santiago, L.; Fernández, A.; Rodríguez-Ascariz, J.M.; Barea, R.; Martín-Sánchez, J.L.; Amo, C.; Sánchez-Morla, E.V.; Boquete, L. Continuous-wavelet-transform analysis of the multifocal ERG waveform in glaucoma diagnosis. Med Biol. Eng. Comput. 2015, 53, 771–780. [Google Scholar] [CrossRef] [PubMed]
- Zhdanov, A.; Dolganov, A.; Borisov, V.; Ronkin, M.; Ponomarev, V.; Zanca, D. OculusGraphy: Ophthalmic Electrophysiological Signals Database. IEEE Dataport 2022. [Google Scholar] [CrossRef]
- Lemaître, G.; Nogueira, F.; Aridas, C. Imbalanced-learn: A Python Toolbox to Tackle the Curse of Imbalanced Datasets in Machine Learning. J. Mach. Learn. Res. 2016, 18, 559–563. [Google Scholar]
- Fricke, M.; Bodendorf, F. Identifying Trendsetters in Online Social Networks—A Machine Learning Approach. In Advances in the Human Side of Service Engineering, Proceedings of the AHFE 2020 Virtual Conference on the Human Side of Service Engineering, Virtual, 16–20 July 2020, USA; Springer International Publishing: Berlin/Heidelberg, Germany, 2020; pp. 3–9. [Google Scholar] [CrossRef]
- Lee, G.; Gommers, R.; Waselewski, F.; Wohlfahrt, K.; O’Leary, A. PyWavelets: A Python package for wavelet analysis. J. Open Source Softw. 2019, 4, 1237. [Google Scholar] [CrossRef]
- Xu, G.; Shen, X.; Chen, S.; Zong, Y.; Zhang, C.; Yue, H.; Liu, M.; Chen, F.; Che, W. A Deep Transfer Convolutional Neural Network Framework for EEG Signal Classification. IEEE Access 2019, 7, 112767–112776. [Google Scholar] [CrossRef]
- Wu, Q.E.; Yu, Y.; Zhang, X. A Skin Cancer Classification Method Based on Discrete Wavelet Down-Sampling Feature Reconstruction. Electronics 2023, 12, 2103. [Google Scholar] [CrossRef]
- Huang, G.H.; Fu, Q.J.; Gu, M.Z.; Lu, N.H.; Liu, K.Y.; Chen, T.B. Deep Transfer Learning for the Multilabel Classification of Chest X-ray Images. Diagnostics 2022, 12, 1457. [Google Scholar] [CrossRef]
- Chen, C.F.R.; Fan, Q.; Panda, R. CrossViT: Cross-Attention Multi-Scale Vision Transformer for Image Classification. In Proceedings of the International Conference on Computer Vision (ICCV), Montreal, QC, Canada, 10–17 October 2021. [Google Scholar]
- Simonyan, K.; Zisserman, A. Very Deep Convolutional Networks for Large-Scale Image Recognition. arXiv 2014, arXiv:1409.1556. [Google Scholar]
- He, K.; Zhang, X.; Ren, S.; Sun, J. Deep Residual Learning for Image Recognition. In Proceedings of the 2016 IEEE Conference on Computer Vision and Pattern Recognition (CVPR), Las Vegas, NV, USA, 27–30 June 2016; pp. 770–778. [Google Scholar] [CrossRef]
- Xie, S.; Girshick, R.; Dollar, P.; Tu, Z.; He, K. Aggregated Residual Transformations for Deep Neural Networks. In Proceedings of the 2017 IEEE Conference on Computer Vision and Pattern Recognition (CVPR), Honolulu, HI, USA, 21–26 July 2017; pp. 5987–5995. [Google Scholar] [CrossRef]
- Huang, G.; Liu, Z.; van der Maaten, L.; Weinberger, K.Q. Densely Connected Convolutional Networks. In Proceedings of the IEEE Conference on Computer Vision and Pattern Recognition, Honolulu, HI, USA, 21–26 July 2017. [Google Scholar]
- Dosovitskiy, A.; Beyer, L.; Kolesnikov, A.; Weissenborn, D.; Zhai, X.; Unterthiner, T.; Dehghani, M.; Minderer, M.; Heigold, G.; Gelly, S.; et al. An Image is Worth 16x16 Words: Transformers for Image Recognition at Scale. arXiv 2021, arXiv:2010.11929. [Google Scholar]
- Bishop, C.M. Pattern Recognition and Machine Learning (Information Science and Statistics); Springer: Berlin/Heidelberg, Germany, 2006. [Google Scholar]
- Mohammed, R.; Rawashdeh, J.; Abdullah, M. Machine Learning with Oversampling and Undersampling Techniques: Overview Study and Experimental Results. In Proceedings of the 2020 11th International Conference on Information and Communication Systems (ICICS), Virtual, 7–9 April 2020; pp. 243–248. [Google Scholar] [CrossRef]
- Goutte, C.; Gaussier, E. A Probabilistic Interpretation of Precision, Recall and F-Score, with Implication for Evaluation. In Advances in Information Retrieval, Proceedings of the 27th European Conference on IR Research, ECIR 2005, Santiago de Compostela, Spain, 21–23 March 2005; Losada, D.E., Fernández-Luna, J.M., Eds.; Springer: Berlin/Heidelberg, Germany, 2005; pp. 345–359. [Google Scholar]
- García, V.; Mollineda, R.A.; Sánchez, J.S. Index of Balanced Accuracy: A Performance Measure for Skewed Class Distributions. In Pattern Recognition and Image Analysis, Proceedings of the Pattern Recognition and Image Analysis: 4th Iberian Conference, IbPRIA 2009 Póvoa de Varzim, Portugal, 10–12 June 2009; Araujo, H., Mendonça, A.M., Pinho, A.J., Torres, M.I., Eds.; Springer: Berlin/Heidelberg, Germany, 2009; pp. 441–448. [Google Scholar]
- Liao, C.C.; Yang, H.T.; Chang, H.H. Denoising Techniques with a Spatial Noise-Suppression Method for Wavelet-Based Power Quality Monitoring. IEEE Trans. Instrum. Meas. 2011, 60, 1986–1996. [Google Scholar] [CrossRef]
- Tzabazis, A.; Eisenried, A.; Yeomans, D.; Moore, H. Wavelet analysis of heart rate variability: Impact of wavelet. Biomed. Signal Process. Control 2018, 40, 220–225. [Google Scholar] [CrossRef]
- Robson, A.; Frishman, L.; Grigg, J.; Hamilton, R.; Jeffrey, B.; Kondo, M.; Li, S.; McCulloch, D. ISCEV Standard for full-field clinical electroretinography (2022 update). Doc. Ophthalmol. 2022, 144, 165–177. [Google Scholar] [CrossRef] [PubMed]
- Guo, J.; Han, K.; Wu, H.; Tang, Y.; Chen, X.; Wang, Y.; Xu, C. CMT: Convolutional Neural Networks Meet Vision Transformers. In Proceedings of the IEEE/CVF Conference on Computer Vision and Pattern Recognition (CVPR), New Orleans, LA, USA, 18–24 June 2022; pp. 12175–12185. [Google Scholar]
- Lim, J.; Hong, M.; Lam, W.; Zhang, Z.; Teo, Z.; Liu, Y.; Ng, W.; Foo, L.; Ting, D. Novel technical and privacy-preserving technology for artificial intelligence in ophthalmology. Curr. Opin. Ophthalmol. 2022, 33, 174–187. [Google Scholar] [CrossRef]
- Bouaziz, M.; Cheng, T.; Minuti, A.; Denisova, K.; Barmettler, A. Shared Decision Making in Ophthalmology: A Scoping Review. Am. J. Ophthalmol. 2022, 237, 146–153. [Google Scholar] [CrossRef]
- Zhdanov, A.E.; Borisov, V.I.; Dolganov, A.Y.; Lucian, E.; Bao, X.; Kazaijkin, V.N. OculusGraphy: Norms for Electroretinogram Signals. In Proceedings of the 2021 IEEE 22nd International Conference of Young Professionals in Electron Devices and Materials (EDM), Souzga, Russia, 30 June–4 July 2021; pp. 399–402. [Google Scholar] [CrossRef]
- Zhdanov, A.E.; Borisov, V.I.; Lucian, E.; Kazaijkin, V.N.; Bao, X.; Ponomarev, V.O.; Dolganov, A.Y.; Lizunov, A.V. OculusGraphy: Description of Electroretinograms Database. In Proceedings of the 2021 Third International Conference Neurotechnologies and Neurointerfaces (CNN), Kaliningrad, Russia, 13–15 September 2021; pp. 132–135. [Google Scholar] [CrossRef]
- Lu, Z.; Zhou, M.; Guo, T.; Liang, J.; Wu, W.; Gao, Q.; Li, L.; Li, H.; Chai, X. An in-silico analysis of retinal electric field distribution induced by different electrode design of trans-corneal electrical stimulation. J. Neural Eng. 2022, 19, 055004. [Google Scholar] [CrossRef]
- Goodfellow, I.; Pouget-Abadie, J.; Mirza, M.; Xu, B.; Warde-Farley, D.; Ozair, S.; Courville, A.; Bengio, Y. Generative adversarial nets. In Proceedings of the Neural Information Processing Systems 27 (NIPS 2014), Montreal, QC, Canada, 8–13 December 2014; pp. 2672–2680. [Google Scholar]


| Unbalanced Dataset | Balanced Dataset | ||
|---|---|---|---|
| Healthy | Unhealthy | Healthy | Unhealthy |
| Maximum 2.0 ERG Response | |||
| 60 | 143 | 60 | 62 |
| Scotopic 2.0 ERG Response | |||
| 48 | 52 | 48 | 52 |
| Photopic 2.0 ERG Response | |||
| 68 | 171 | 68 | 63 |
Disclaimer/Publisher’s Note: The statements, opinions and data contained in all publications are solely those of the individual author(s) and contributor(s) and not of MDPI and/or the editor(s). MDPI and/or the editor(s) disclaim responsibility for any injury to people or property resulting from any ideas, methods, instructions or products referred to in the content. |
© 2023 by the authors. Licensee MDPI, Basel, Switzerland. This article is an open access article distributed under the terms and conditions of the Creative Commons Attribution (CC BY) license (https://creativecommons.org/licenses/by/4.0/).
Share and Cite
Kulyabin, M.; Zhdanov, A.; Dolganov, A.; Maier, A. Optimal Combination of Mother Wavelet and AI Model for Precise Classification of Pediatric Electroretinogram Signals. Sensors 2023, 23, 5813. https://doi.org/10.3390/s23135813
Kulyabin M, Zhdanov A, Dolganov A, Maier A. Optimal Combination of Mother Wavelet and AI Model for Precise Classification of Pediatric Electroretinogram Signals. Sensors. 2023; 23(13):5813. https://doi.org/10.3390/s23135813
Chicago/Turabian StyleKulyabin, Mikhail, Aleksei Zhdanov, Anton Dolganov, and Andreas Maier. 2023. "Optimal Combination of Mother Wavelet and AI Model for Precise Classification of Pediatric Electroretinogram Signals" Sensors 23, no. 13: 5813. https://doi.org/10.3390/s23135813
APA StyleKulyabin, M., Zhdanov, A., Dolganov, A., & Maier, A. (2023). Optimal Combination of Mother Wavelet and AI Model for Precise Classification of Pediatric Electroretinogram Signals. Sensors, 23(13), 5813. https://doi.org/10.3390/s23135813