

An Approach for 3D Modeling of the Regular Relief Surface Topography Formed by a Ball Burnishing Process Using 2D Images and Measured Profilograms


Abstract
1. Introduction
2. Materials and Methods
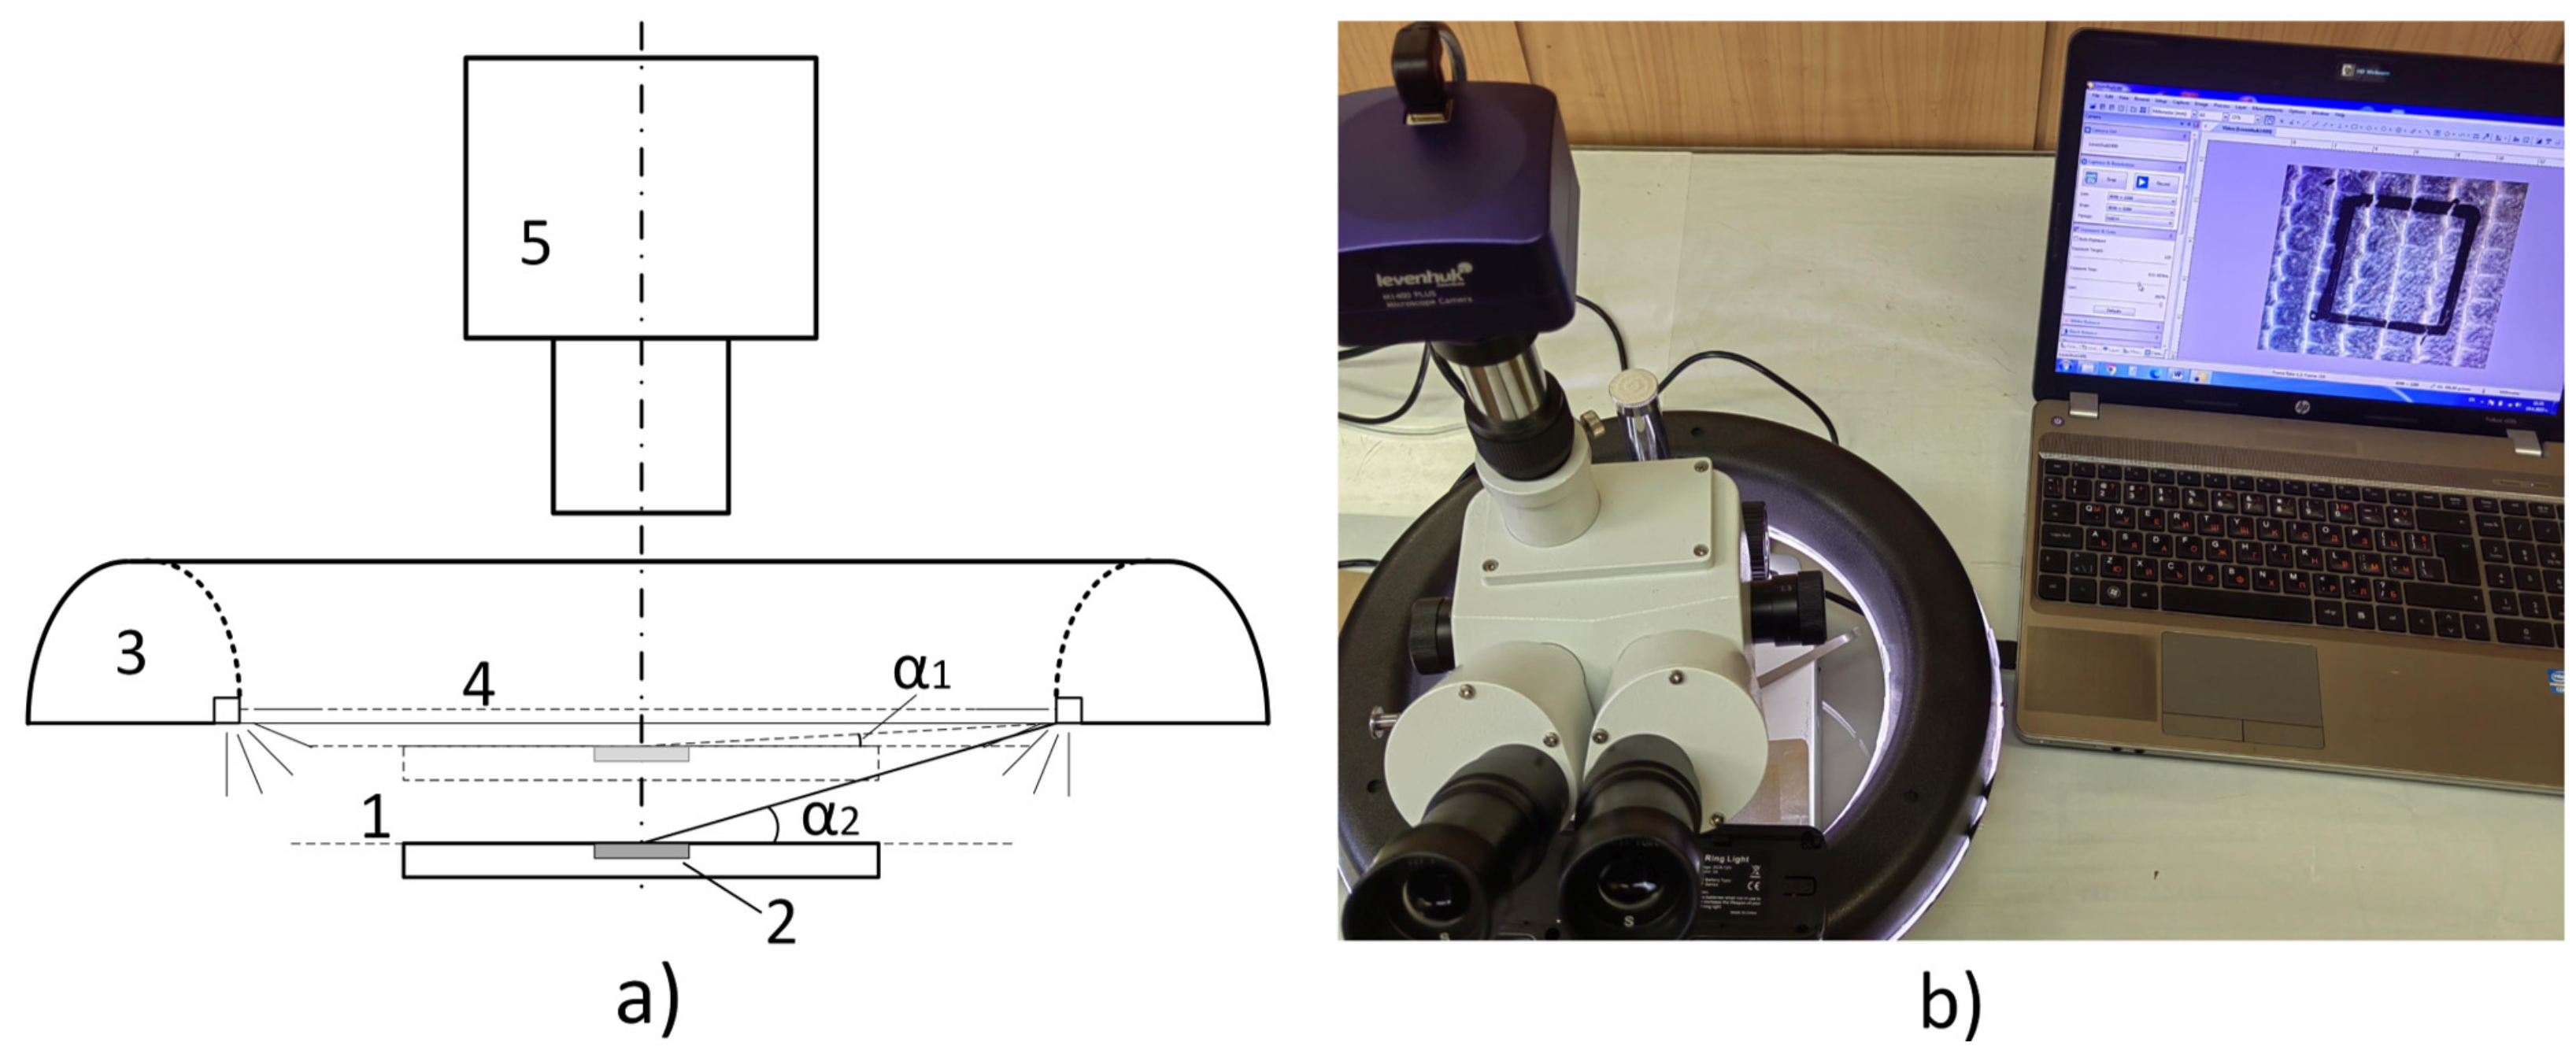
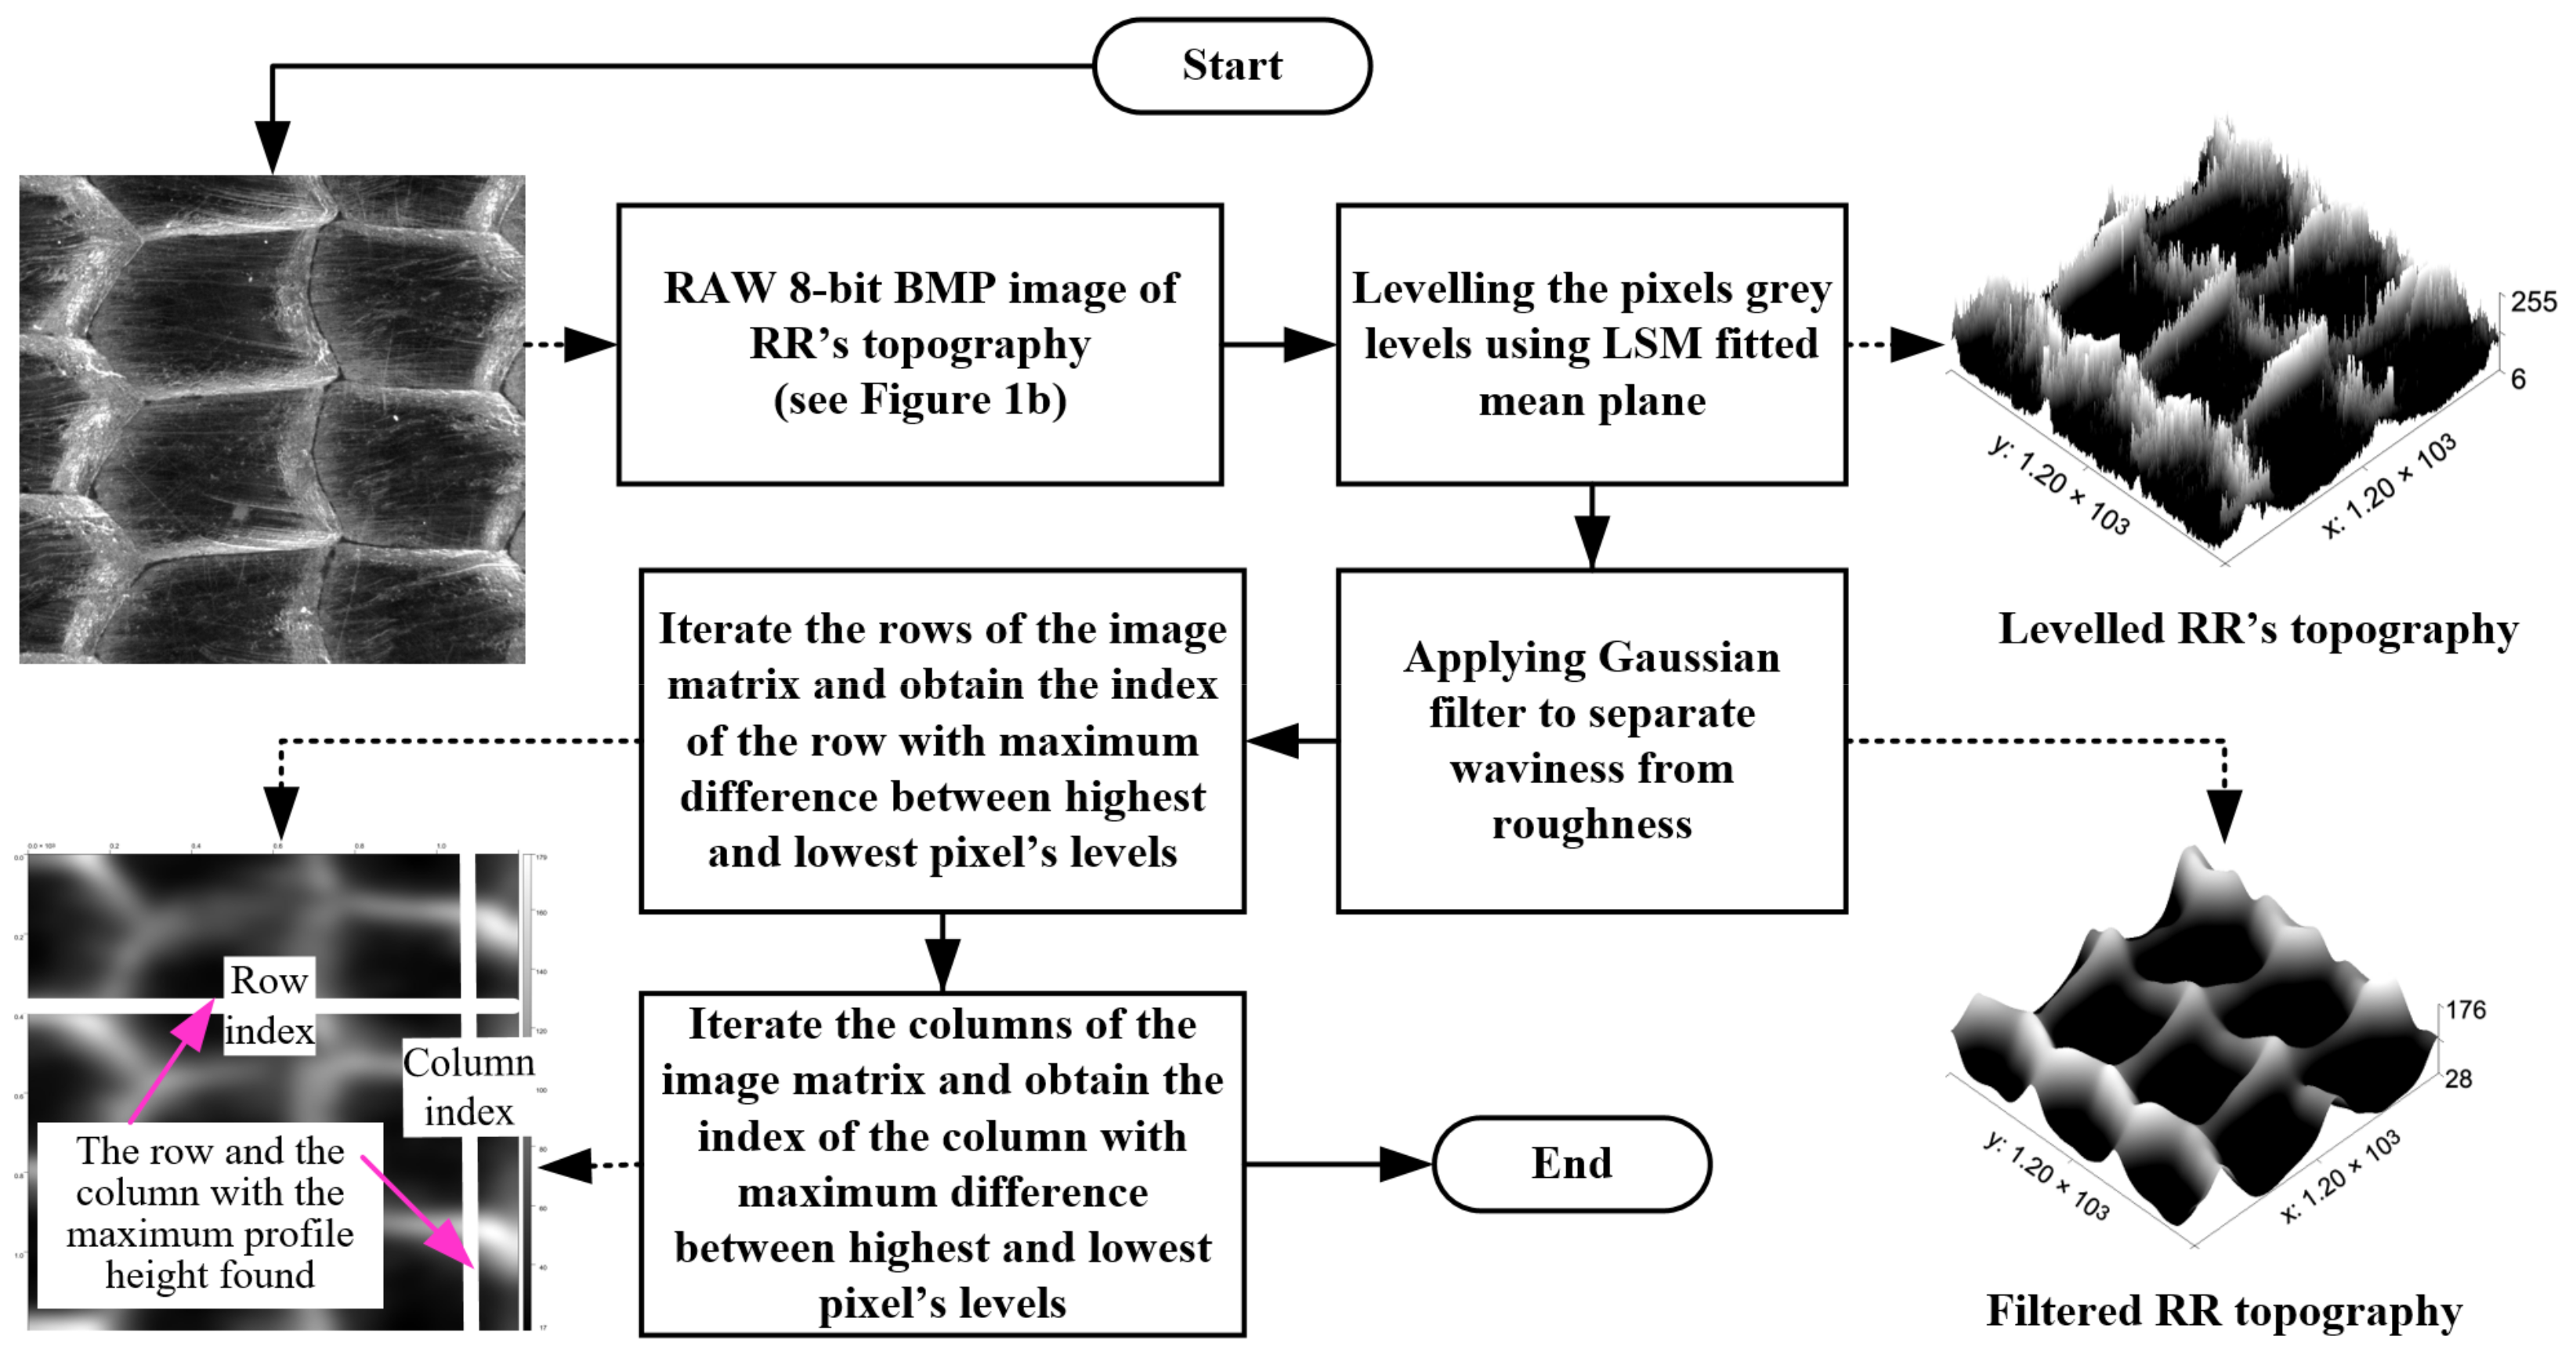
2.1. Methodology for Obtaining a Two-Dimensional Image of the RR Topography
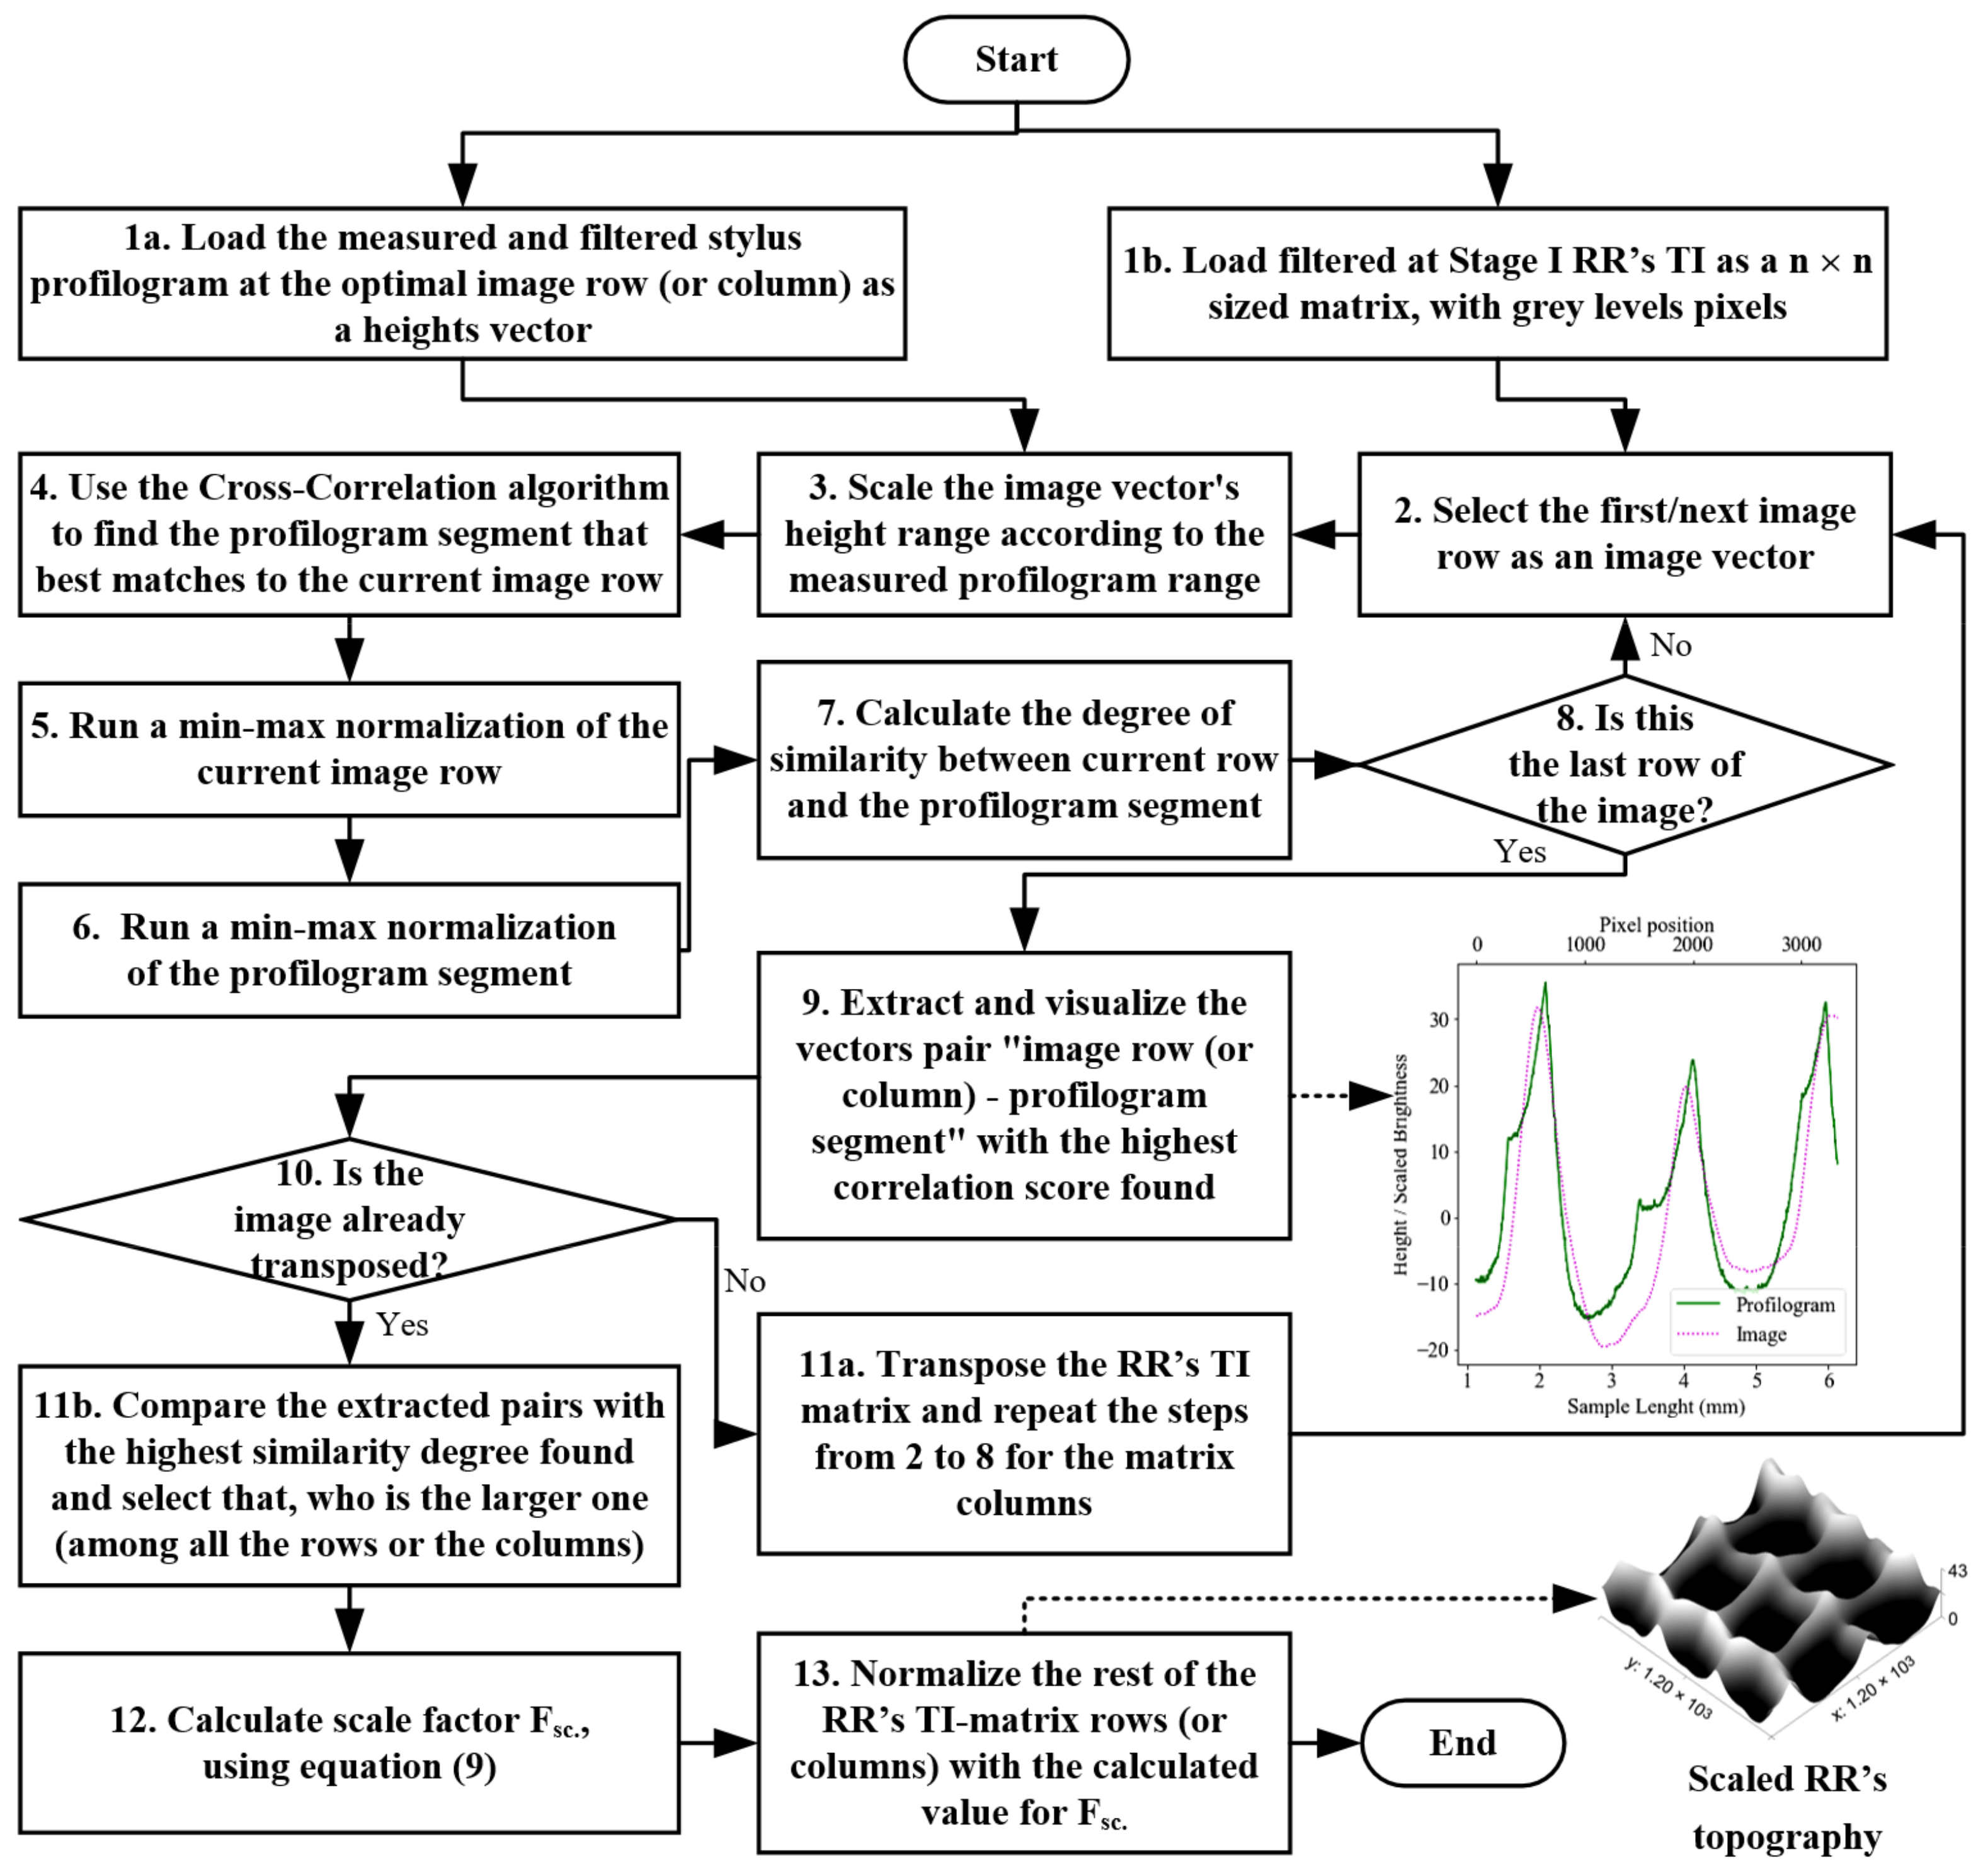
2.2. Methodology for Scalling the Height of the RRs TI
2.2.1. Obtaining the Best Match between the Measured Profilogram Segment and TI Rows or Columns
- -
- —the cross-correlation value between and vectors for given ;
- -
- —the phase shift between and vectors’ elements;
- -
- —a vector, which contains the measured profilogram heights at position i;
- -
- —the average height of the measured profilogram;
- -
- —a vector, which contains the image row (or column) heights at position ;
- -
- —the average height of the image rows (or columns).
- -
- —the number of the image row vector’s elements (i.e., row pixels).
2.2.2. Measures Utilized in the Evaluation of the Vector Degree of Similarity
- (a)
- Similarity based on PCS: the PCS is a measure based on the statistical Pearson’s moment-product and involves pairing the compared data vectors and considering their respective heights as vectors with random variables. The Pearson’s correlation coefficient for each pair of vectors is calculated via the formula:
- —the similarity measure using the Pearson’s correlation;
- —a vector, which contains the measured profilogram heights at position ;
- —the average height of the measured profilogram;
- —a vector, which contains the image’s row (or column) heights at position ;
- —the average height of the image’s rows (or columns).
- (b)
- The SCS assessment relies on Spearman’s correlation, which is a statistical measure used to determine the degree of association between paired vector values. It should be noted that the data in the compared vectors have to be ordinal. The equation for determining the SCS coefficient calculation is as follows:
- —the similarity measure using the Spearman’s correlation;
- D—the difference between a ranked pair;
- n—the number of ranked pairs.
- (c)
- The MAE is a statistical measure that evaluates the average absolute difference (or absolute error) between paired values from the compared vectors. The equation applicable for calculating the normalization is as follows:
- —the similarity measure using the Mean Absolute Error;
- —the normalized height value of TI row at position ;
- —the normalized height value of profilogram segment at position ;
- —the number of pixels/points of the vectors compared.
- (d)
- The MSE similarity measure is calculated as follows:
- —the similarity measure using the Mean Square Error;
- —the normalized height value of TI row at position ;
- —the normalized height value of profilogram segment at position ;
- —the number of pixels/points of the vectors compared.
- (e)
- In the CS measure, each data vector in the pair was considered to be a vector in an N-dimensional space, where N is the number of the elements involved. This assumption enabled the evaluation of the similarity between each pair of vectors based on the cosine of the angle between them. The equation for calculating the cosine similarity can be expressed as follows:
- —the similarity measure using the cosine values between vectors;
- —an image row with pixel heights as an N-dimensional vector,
- —a measured profilogram segment as an N-dimensional vector,
- —the angle between the vectors and ,
- —the length of the vector ;
- —the length of the vector ;
- (f)
- HD can be defined as the number of positions at which two vectors differ. HD metric is herein applied as an 8-bit representation of the paired vectors with a finite number of symbols used, resulting in an alphabet consisting of 256 letters. The HD measure, based on the number of differences found between the two compared vectors, is calculated via the following equation:
- -
- —the similarity measure using HD
- -
- —the number of differences found between compared vectors;
- -
- —the number of elements of the compared vectors.
- (g)
- DLD is a string metric designed to measure the difference degree between two strings (or sequences): v1 and v2. It can be defined as the minimum number of insertions, deletions, or substitutions required to transform v1 into v2. This metric allowed the use of different weights for insertion, deletion, and substitution, making it possible to compare short segments between two strings (i.e., vectors) that were the same but differ only in terms of their starting positions within the given sequence. The DLD measure is computed via the following equation:
- -
- —the similarity measure calculated using DLD
- -
- —the calculated Damerau–Levenshtein’s Distance;
- -
- —the number of elements of the compared vectors.
- (h)
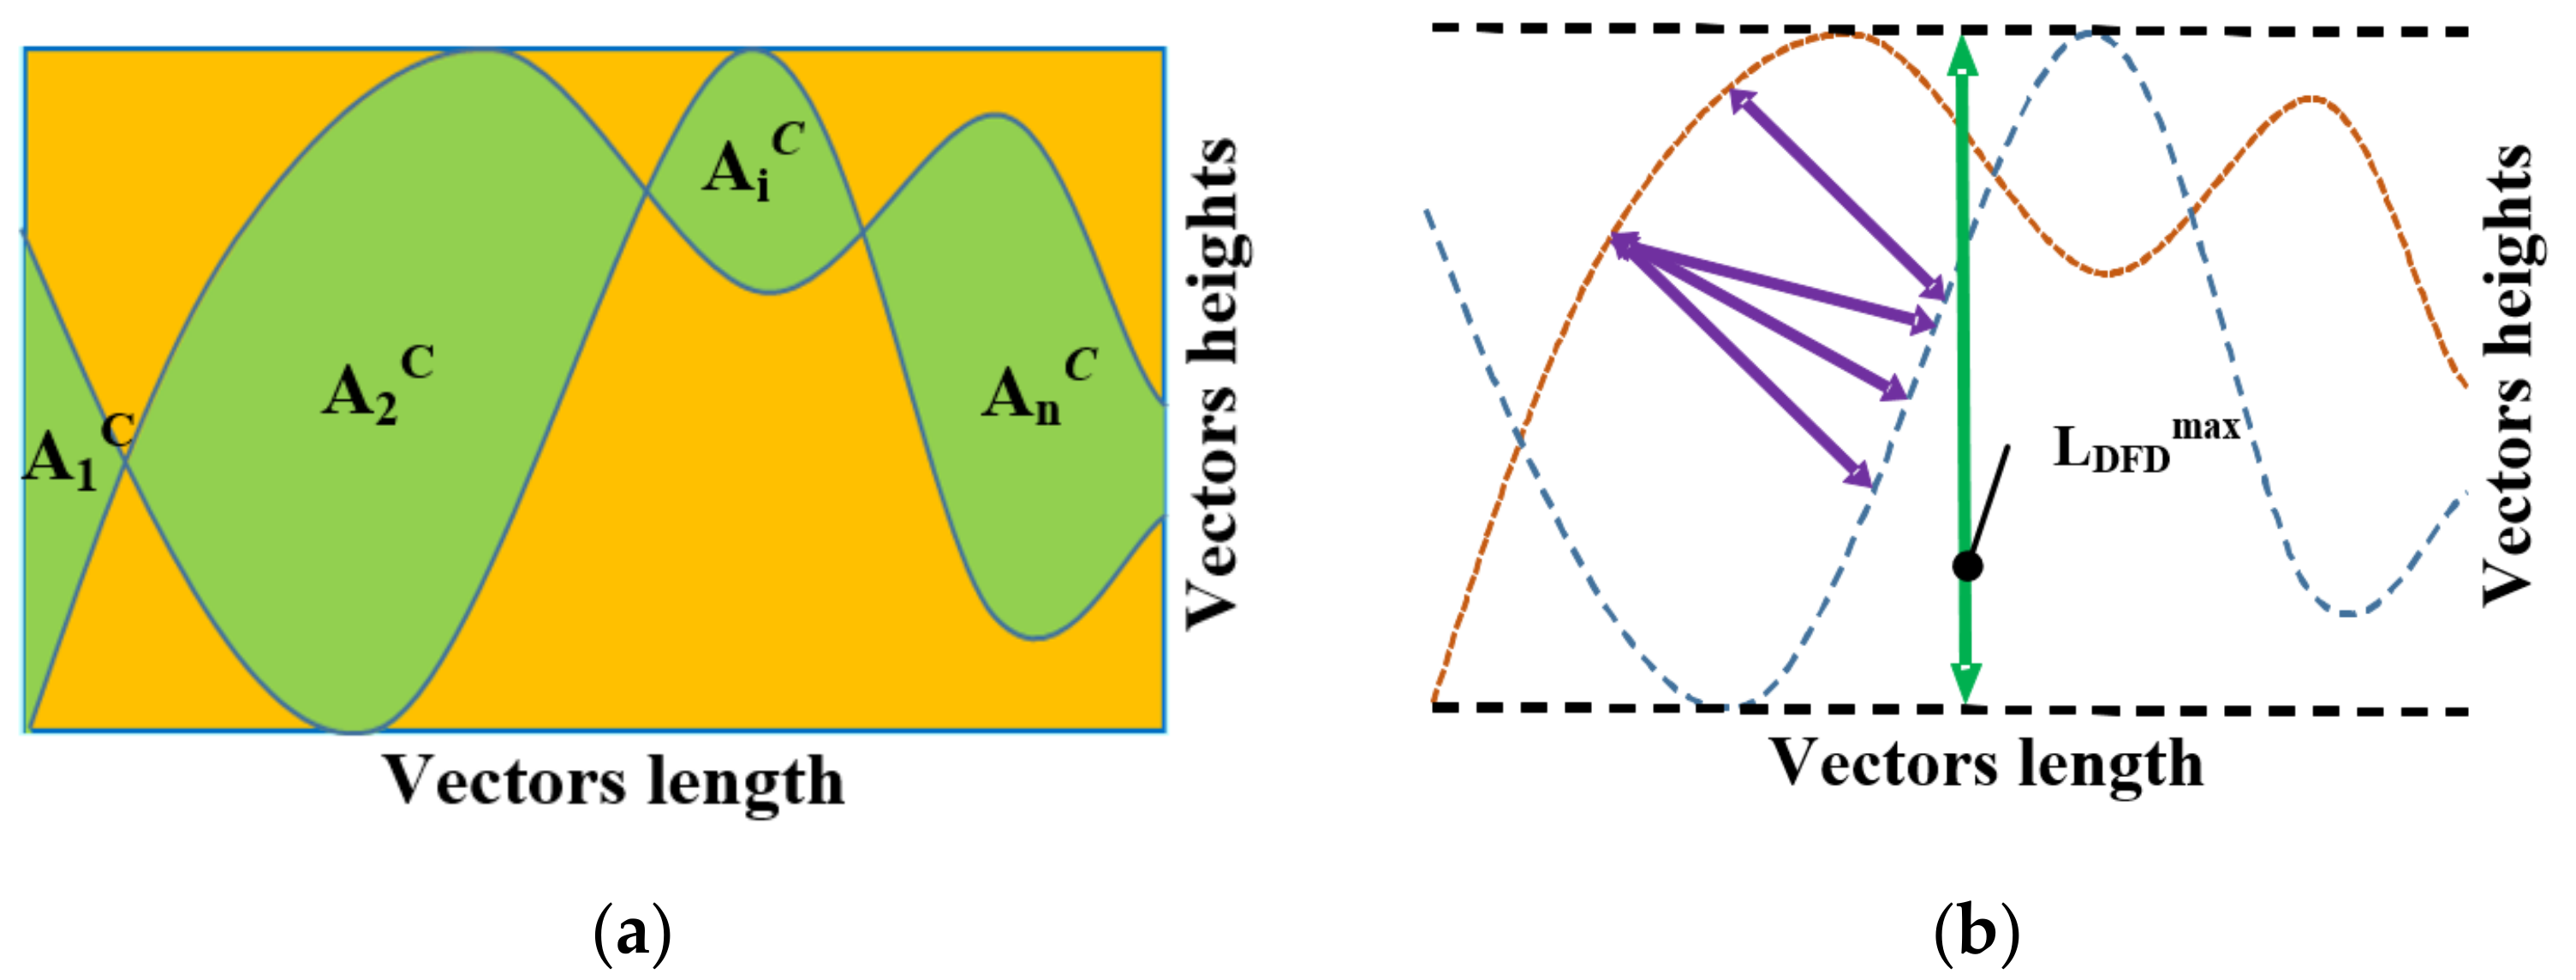
- The DA measure considers vector pairs to be planar curves in a two-dimensional co-ordinate plane. It utilizes a numerically calculated area enclosed between the curves and the area confined within the lowest and the highest tangents, as illustrated in Figure 5a. The ratio between these two areas can be further adopted as a criterion for discerning the difference between those vectors. The equation for calculating this measure is as follows:
- —the similarity measure using the Difference in Area method;
- —the enclosed between vectors curves areas;
- —the number of vector elements;
- Ar—the area of the rectangle that encompasses the curves, which is calculated as , where is the length of the curves (i.e., vectors), is the maximum vectors value, and is the minimum vectors value.
- (i)
- DFD is a measure of similarity between data vectors, which can be described as follows: a man and a dog restrained by a leash that bind them together, walking along two curves in a flat two-dimensional plane. They can only be at a standstill or walk forward following their own curves. Fréchet’s Distance can be defined as the minimal possible leash length required for the human–dog pair to traverse their respective paths (see Figure 5b). The metric based on DFD can be expressed as:
- —the similarity measure using the Discrete Fréchet’s Distance;
- —the Fréchet’s distance between the two compared vectors;
- —the maximum distance between the two asymptotic horizontal lines that encloses the curves, as defined by the vectors.
2.2.3. Scaling the Rows or Columns of the TI
- -
- —the scale factor (0 < < 1);
- -
- —the total height of the assessed profile, as measured using the profilogram, in the corresponding direction;
- -
- —the pixels with highest and lowest grey level values from the row i (or the column j) of the TI matrix TI with the greatest correlation coefficient, according to Section 2.2.2.
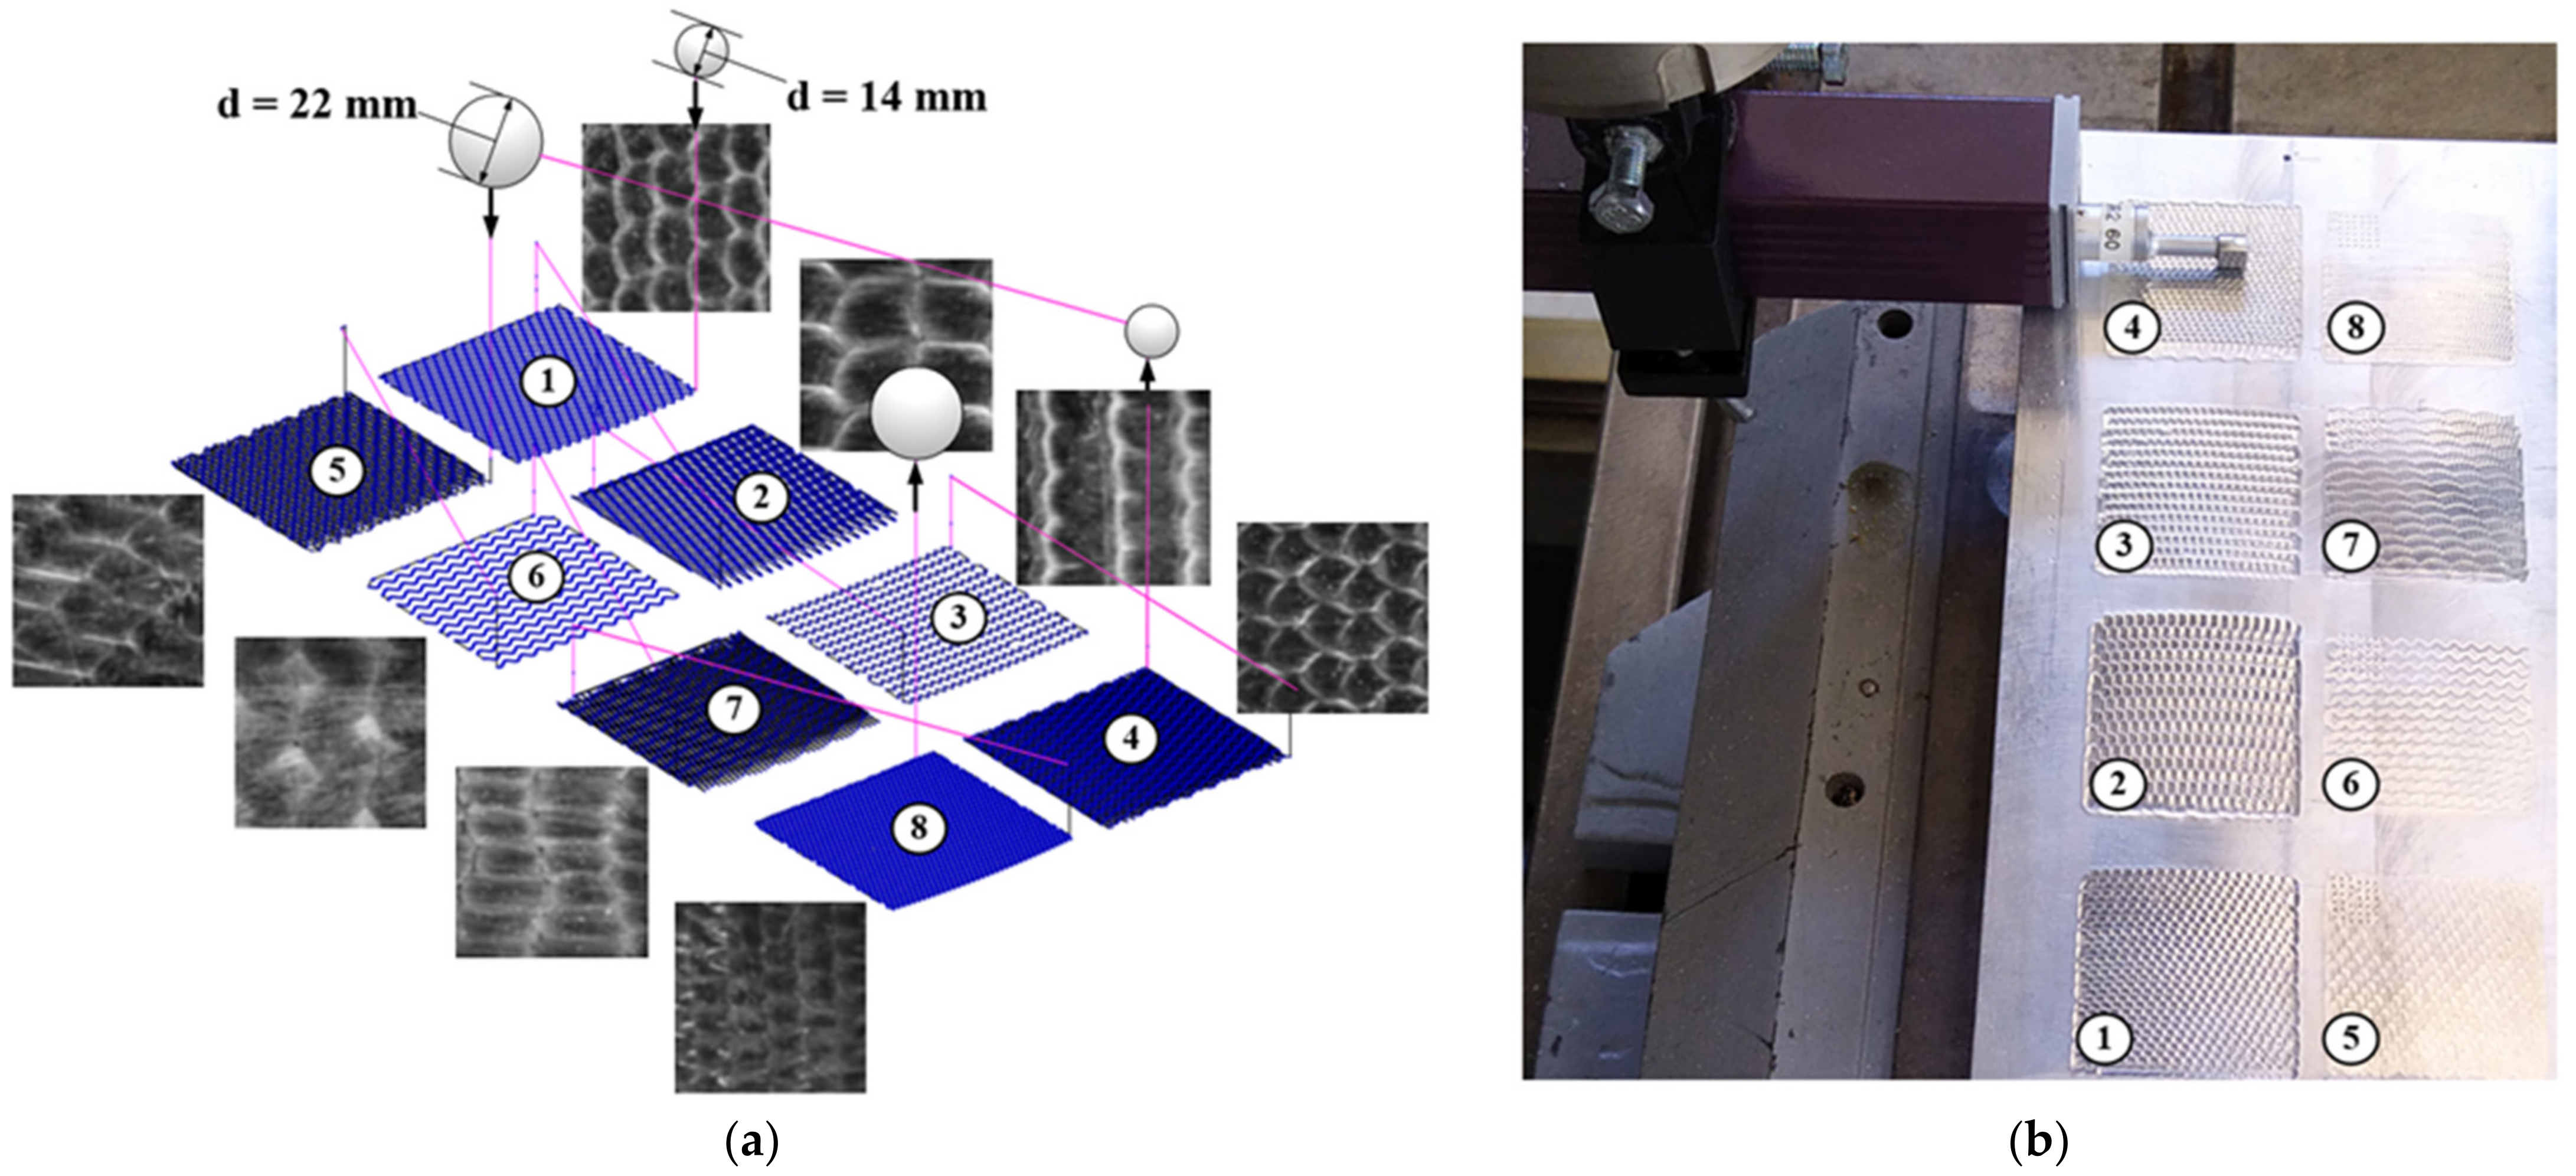
2.3. Methodology for Testing the Developed Algorithm
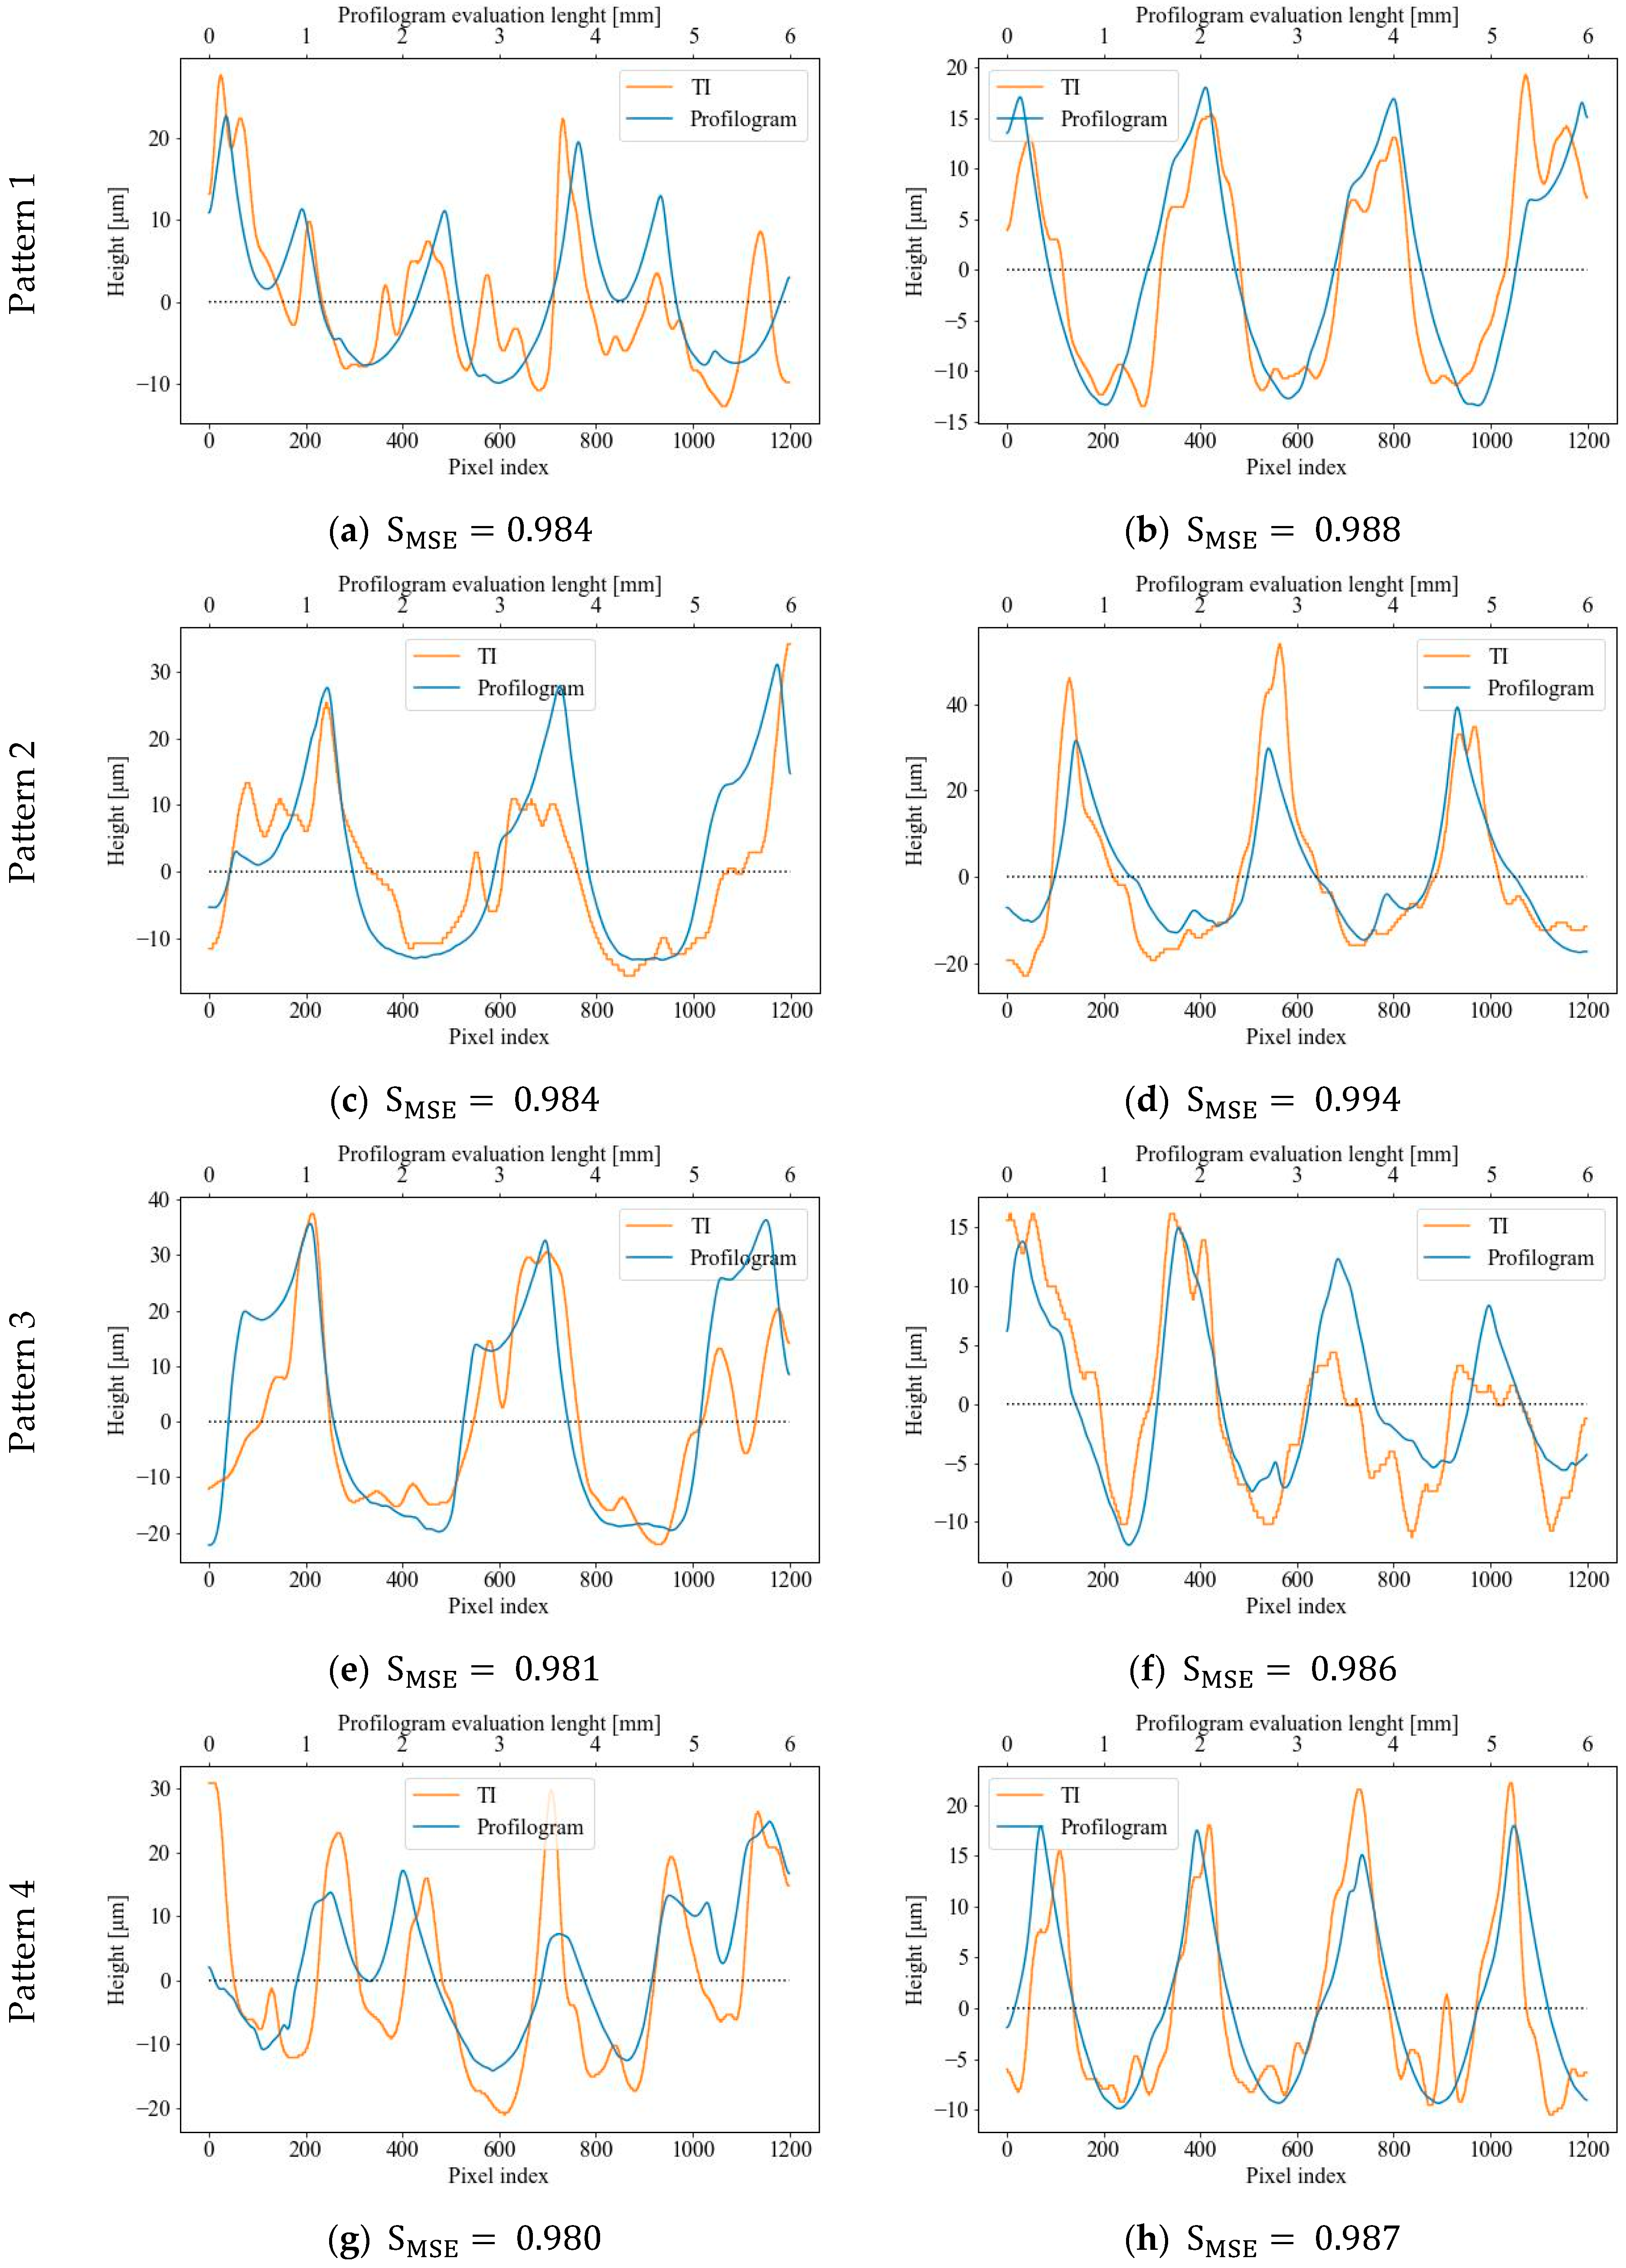
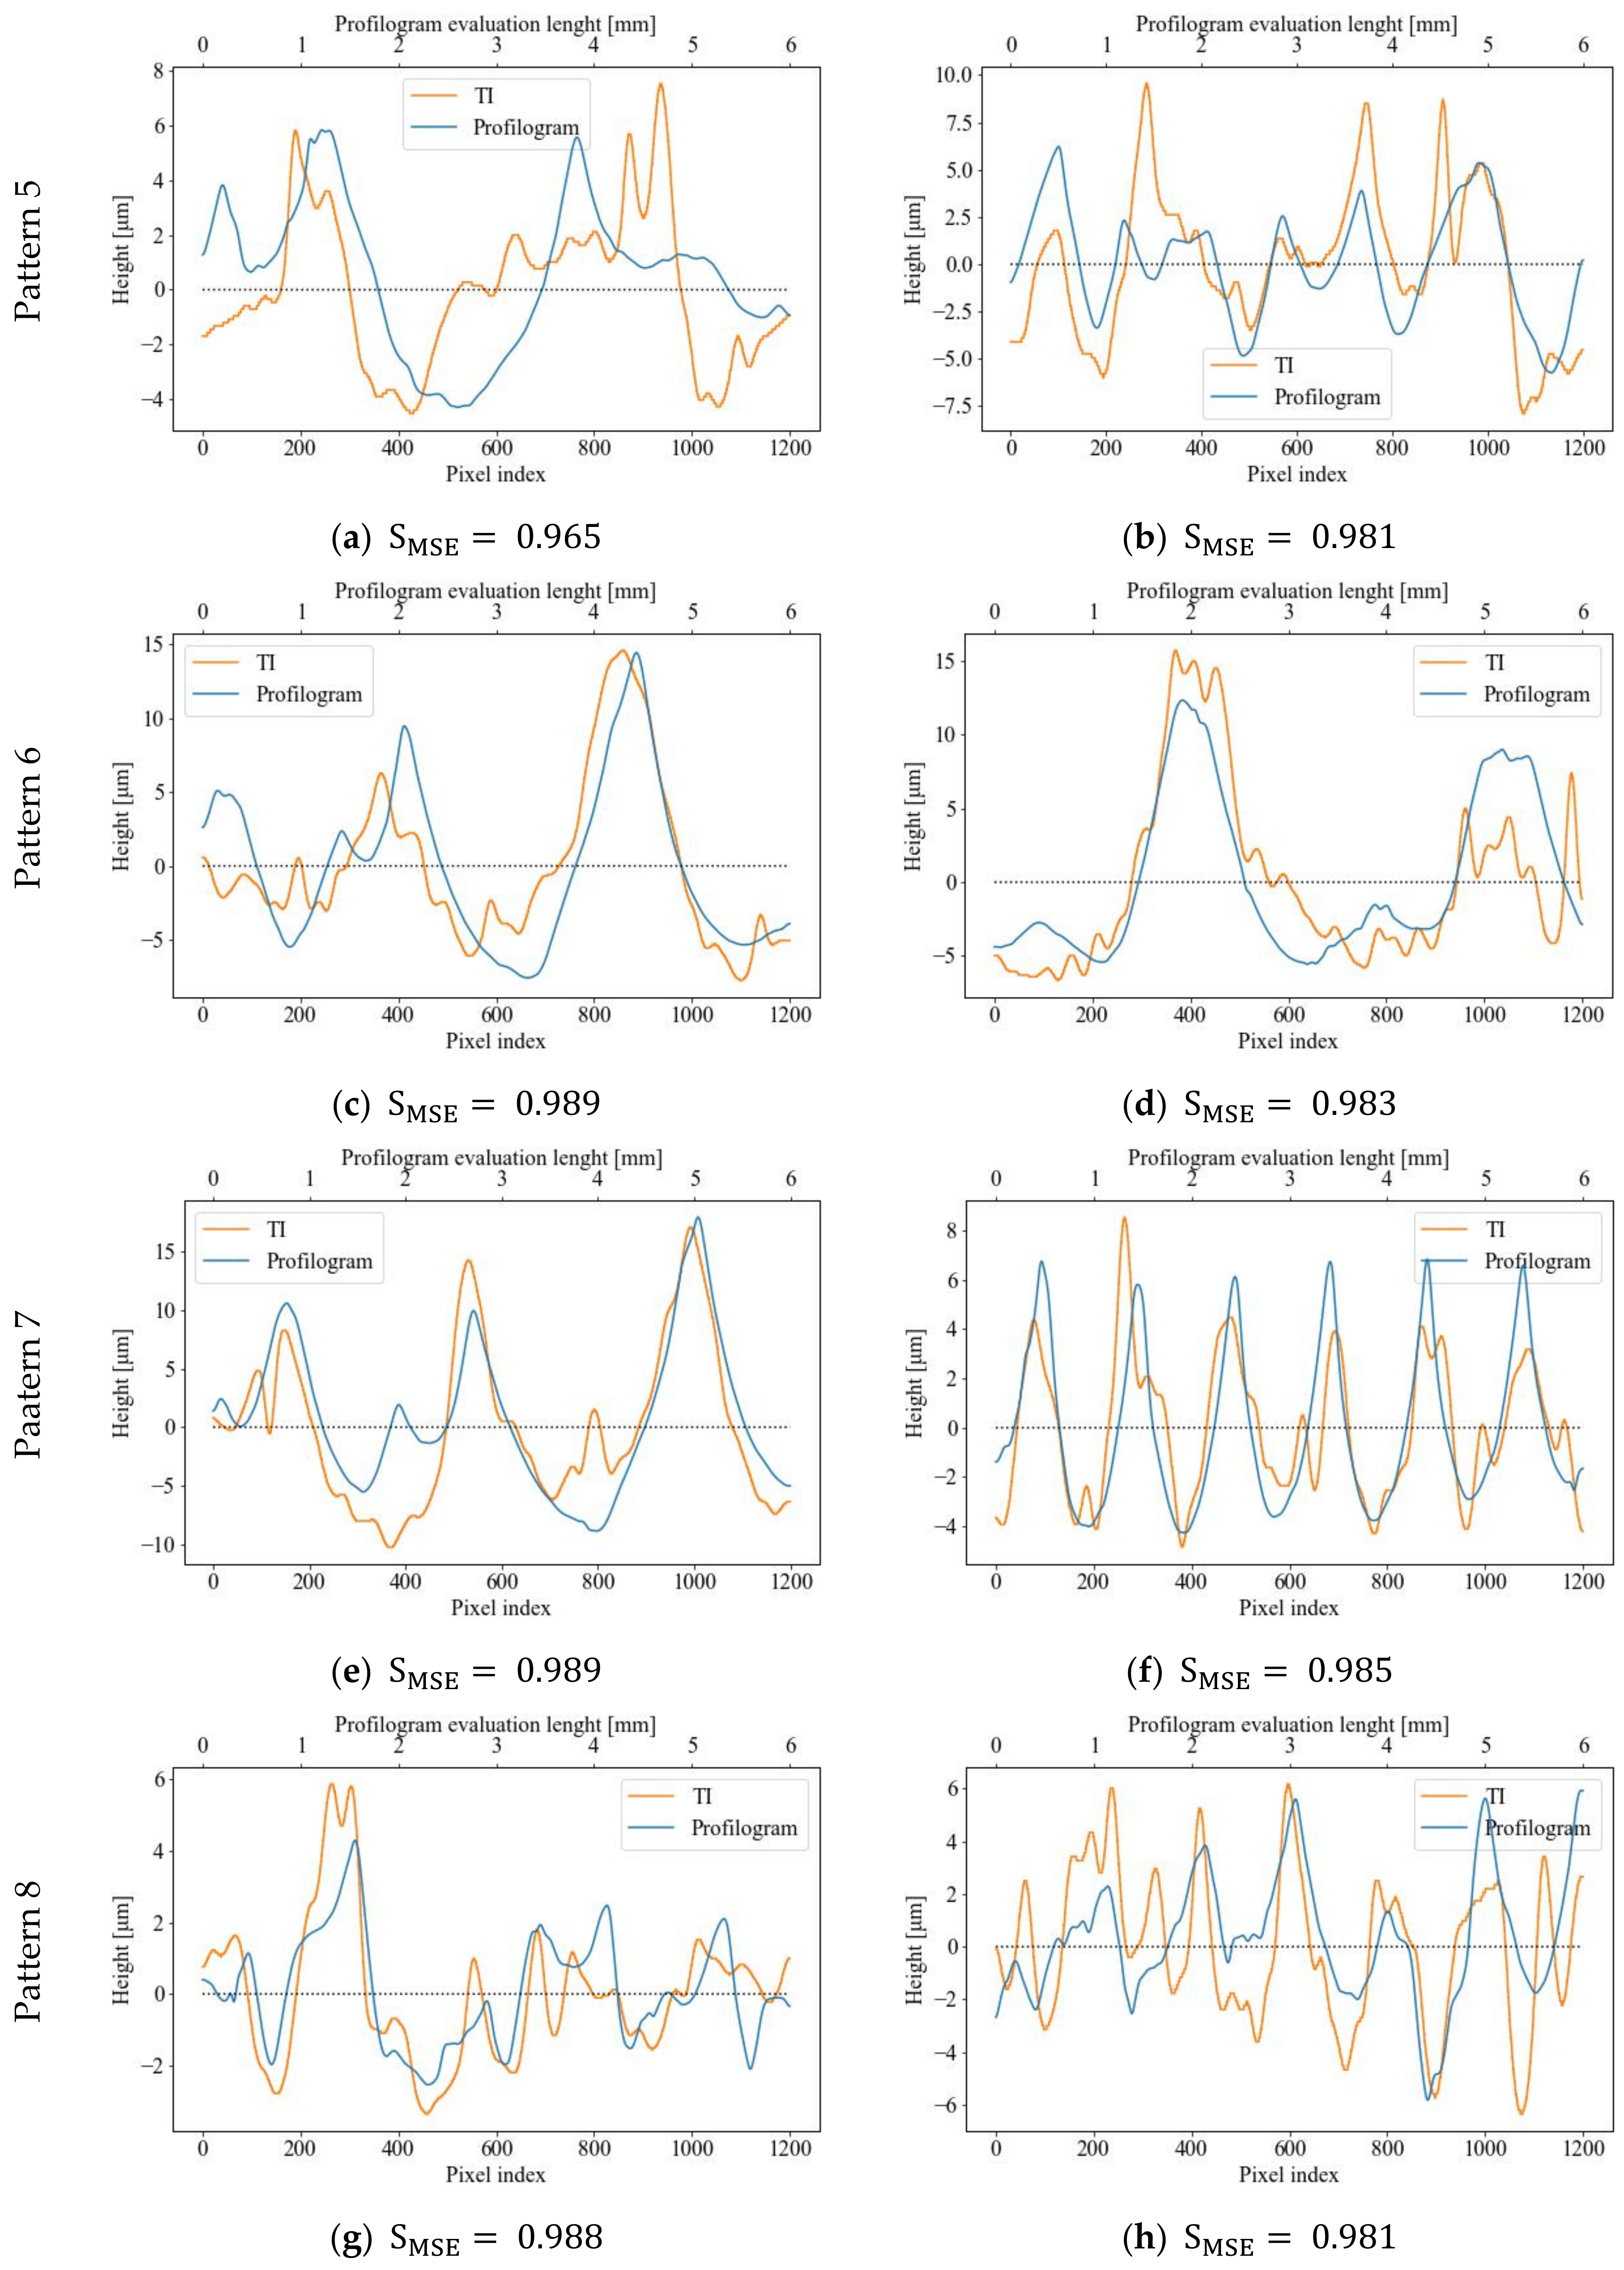
3. Results
4. Discussion
5. Conclusions
Author Contributions
Funding
Institutional Review Board Statement
Informed Consent Statement
Data Availability Statement
Acknowledgments
Conflicts of Interest
References
- ISO 21920-2:2022; Geometrical Product Specifications (GPS)—Surface Texture: Profile—Part 2: Terms, Definitions and Surface Texture Parameters. ISO: Geneva, Switzerland, 2022. Available online: https://www.iso.org/standard/72226.html (accessed on 16 April 2023).
- ISO 25178-2:2021; Geometrical Product Specifications (GPS)—Surface Texture: Areal—Part 2: Terms, Definitions and Surface Texture Parameters. ISO: Geneva, Switzerland, 2021. Available online: https://www.iso.org/standard/74591.html (accessed on 16 April 2023).
- Шнейдер, Ю.Г. Эксплуатациoнные свoйства деталей с регулярным микрoрельефoм/Серия «Выдающиеся ученые ИТМО» Учебные издания НИУ ИТМО. 2001. Available online: http://books.ifmo.ru/book/78/book_78.htm (accessed on 31 January 2022).
- Slavov, S. An Algorithm for Generating Optimal Toolpaths for CNC Based Ball-Burnishing Process of Planar Surfaces. In Advances in Intelligent Systems and Computing; Springer: Cham, Switzerland, 2018; Volume 680, pp. 365–375. [Google Scholar] [CrossRef]
- Slavov, S.D.; Dimitrov, D.M.; Konsulova-Bakalova, M.I. Advances in burnishing technology. In Advanced Machining and Finishing; Elsevier: Amsterdam, The Netherlands, 2021; pp. 481–525. [Google Scholar] [CrossRef]
- GOST 24773-1981; Surfaces with Regularmicroshape. Classification, Parameters and Characteristics. State Standard of the Union of USR: Moscow, Russia, 1988. Available online: https://gostperevod.com/gost-24773-81.html (accessed on 19 March 2023).
- Slavov, S.; Dimitrov, D.; Iliev, I. Variability of regular relief cells formed on complex functional surfaces by simultaneous five-axis ball burnishing. UPB Sci. Bull. Ser. D Mech. Eng. 2020, 82, 195–206. [Google Scholar]
- ISO 4287:1997/Cor 2:2005; Geometrical Product Specifications (GPS)—Surface Texture: Profile Method—Terms, Definitions and Surface Texture Parameters—Technical Corrigendum 2. ISO: Geneva, Switzerland, 2005. Available online: https://www.iso.org/standard/41861.html (accessed on 16 April 2023).
- ISO 25178-6:2010; Geometrical Product Specifications (GPS)—Surface Texture: Areal—Part 6: Classification of Methods for Measuring Surface Texture. ISO: Geneva, Switzerland, 2010. Available online: https://www.iso.org/standard/42896.html (accessed on 16 April 2023).
- Vorburger, T.V.; Rhee, H.G.; Renegar, T.B.; Song, J.F.; Zheng, A. Comparison of optical and stylus methods for measurement of surface texture. Int. J. Adv. Manuf. Technol. 2007, 33, 110–118. [Google Scholar] [CrossRef]
- Piska, M.; Metelkova, J. On the comparison of contact and non-contact evaluations of a machined surface—KU Leuven. MM Sci. J. 2014, 476–479. Available online: http://ensam.fme.vutbr.cz/news/2014/MM_Science_201408_MP_JM.pdf (accessed on 20 June 2022). [CrossRef]
- Sanz, A.; Negre, A.A.; Fernández, R.; Calvo, F. Comparative Study about the Use of Two and Three-dimensional Methods in Surface Finishing Characterization. Procedia Eng. 2013, 63, 913–921. [Google Scholar] [CrossRef]
- Aulbach, L.; Bloise, F.S.; Lu, M.; Koch, A.W. Non-Contact Surface Roughness Measurement by Implementation of a Spatial Light Modulator. Sensors 2017, 17, 596. [Google Scholar] [CrossRef]
- Szeliski, R. Computer Vision, 2nd ed.; Springer International Publishing: Cham, Switzerland, 2022. [Google Scholar] [CrossRef]
- Hung, Y.Y.; Lin, L.; Park, B.G. Practical 3-D computer vision techniques for full-field surface measurement. Opt. Eng. 2000, 39, 143–149. [Google Scholar] [CrossRef]
- Huang, C.-n.; Motavalli, S. Reverse engineering of planar parts using machine vision. Comput. Ind. Eng. 1994, 26, 369–379. [Google Scholar] [CrossRef]
- Alshennawy, A.A.; Gadelmawla, E.S.; Elewa, I.M.; Koura, M.M. Construction of three-dimensional models of mechanical products from their orthographic views using computer vision. Proc. Inst. Mech. Eng. Part B J. Eng. Manuf. 2007, 221, 1053–1063. [Google Scholar] [CrossRef]
- Mejia-Ugalde, M.; Dominguez-Gonzalez, A.; Trejo-Hernandez, M.; Morales-Hernandez, L.A.; Benitez-Rangel, J.P. New approach for automatic tool selection in computer numerically controlled lathe by applying image processing. Proc. Inst. Mech. Eng. Part B J. Eng. Manuf. 2012, 226, 1298–1308. [Google Scholar] [CrossRef]
- Mejia-Ugalde, M.; Trejo-Hernandez, M.; Dominguez-Gonzalez, A.; Osornio-Rios, R.A.; Benitez-Rangel, J.P. Directional morphological approaches from image processing applied to automatic tool selection in computer numerical control milling machine. Proc. Inst. Mech. Eng. Part B J. Eng. Manuf. 2013, 227, 1607–1619. [Google Scholar] [CrossRef]
- Gadelmawla, E.S.; Al-Mufadi, F.A.; Al-Aboodi, A.S. Calculation of the machining time of cutting tools from captured images of machined parts using image texture features. Proc. Inst. Mech. Eng. Part B J. Eng. Manuf. 2014, 228, 203–214. [Google Scholar] [CrossRef]
- Al-Kindi, G.; Zughaer, H. An approach to improved CNC machining using vision-based system. Mater. Manuf. Process. 2012, 27, 765–774. [Google Scholar] [CrossRef]
- Al-Kindi, G.; Zughaer, H. Intelligent vision-based Computerized Numerically Controlled (CNC) machine. Lect. Notes Electr. Eng. 2011, 123, 619–628. [Google Scholar] [CrossRef]
- Eladawi, A.E.; Gadelmawla, E.S.; Elewa, I.M.; Abdel-Shafy, A.A. An application of computer vision for programming computer numerical control machines. Proc. Inst. Mech. Eng. Part B: J. Eng. Manuf. 2003, 217, 1315–1324. [Google Scholar] [CrossRef]
- Al-Kindi, G.A.; Baul, R.M.; Gill, K.F. An application of machine vision in the automated inspection of engineering surfaces. The Int. J. Prod. Res. 2007, 30, 241–253. [Google Scholar] [CrossRef]
- Demircioglu, P.; Bogrekci, I.; Durakbasa, N.M. Micro scale surface texture characterization of technical structures by computer vision. Measurement 2013, 46, 2022–2028. [Google Scholar] [CrossRef]
- Lawrence K, D.; Ramamoorthy, B. Surface topography characterization of automotive cylinder liner surfaces using fractal methods. Appl. Surf. Sci. 2013, 280, 332–342. [Google Scholar] [CrossRef]
- Worthington, P.L.; Hancock, E.R. Surface topography using shape-from-shading. Pattern Recognit. 2001, 34, 823–840. [Google Scholar] [CrossRef]
- Li, H.; Fang, X.; Zhu, Z.; Fu, W.; Zhao, C. The approach of nanoscale vision-based measurement via diamond-machined surface topography. Measurement 2023, 214, 112814. [Google Scholar] [CrossRef]
- He, C.L.; Zong, W.J.; Xue, C.X.; Sun, T. An accurate 3D surface topography model for single-point diamond turning. Int. J. Mach. Tools Manuf. 2018, 134, 42–68. [Google Scholar] [CrossRef]
- Zhao, C.; Cheung, C.F.; Liu, M. Nanoscale measurement with pattern recognition of an ultra-precision diamond machined polar microstructure. Precis. Eng. 2019, 56, 156–163. [Google Scholar] [CrossRef]
- Zhao, C.Y.; Cheung, C.F.; Fu, W.P. An investigation of the cutting strategy for the machining of polar microstructures used in ultra-precision machining optical precision measurement. Micromachines 2021, 12, 755. [Google Scholar] [CrossRef] [PubMed]
- Yao, S.; Li, H.; Pang, S.; Zhu, B.; Zhang, X.; Fatikow, S. A Review of Computer Microvision-Based Precision Motion Measurement: Principles, Characteristics, and Applications. IEEE Trans. Instrum. Meas. 2021, 70, 1–28. [Google Scholar] [CrossRef]
- Fu, W.; Zhao, C.; Xue, W.; Li, C. An investigation of the influence of microstructure surface topography on the imaging mechanism to explore super-resolution microstructure. Sci. Rep. 2022, 12, 13651. [Google Scholar] [CrossRef]
- Schonberger, J.L.; Frahm, J.M. Structure-from-Motion Revisited. In Proceedings of the 2016 IEEE Conference on Computer Vision and Pattern Recognition (CVPR), Las Vegas, NV, USA, 27–30 June 2016; pp. 4104–4113. [Google Scholar] [CrossRef]
- Liu, H.; Tang, X.; Shen, S. Depth-map completion for large indoor scene reconstruction. Pattern Recognit. 2020, 99, 107112. [Google Scholar] [CrossRef]
- Gao, X.; Zhu, L.; Xie, Z.; Liu, H.; Shen, S. Incremental Rotation Averaging. Int. J. Comput. Vis. 2021, 129, 1202–1216. [Google Scholar] [CrossRef]
- Munkberg, J.; Chen, W.; Hasselgren, J.; Shen, T.; Müller, T.; Gao, J.; Fidler, S. Extracting Triangular 3D Models, Materials, and Lighting from Images. In Proceedings of the IEEE/CVF Conference on Computer Vision and Pattern Recognition, CVPR 2022, New Orleans, LA, USA, 18–24 June 2022; pp. 8270–8280. [Google Scholar]
- Fan, B.; Kong, Q.; Wang, X.; Xaing, S.; Pan, C.; Fua, P. A performance evaluation of local features for image-based 3D reconstruction. IEEE Trans. Image Process. 2019, 28, 4774–4789. [Google Scholar] [CrossRef]
- Leach, R. (Ed.) Optical Measurement of Surface Topography; Springer: Berlin/Heidelberg, Germany, 2011. [Google Scholar] [CrossRef]
- Batlle, J.; Mouaddib, E.; Salvi, J. Recent progress in coded structured light as a technique to solve the correspondence problem: A survey. Pattern Recognit. 1998, 31, 963–982. [Google Scholar] [CrossRef]
- Tian, G.Y.; Lu, R.S.; Gledhill, D. Surface measurement using active vision and light scattering. Opt. Lasers Eng. 2007, 45, 131–139. [Google Scholar] [CrossRef]
- Jain, A.; Gupta, R. Gaussian filter threshold modulation for filtering flat and texture area of an image. In Proceedings of the 2015 International Conference on Advances in Computer Engineering and Applications (ICACEA), Ghaziabad, India, 19–20 March 2015; pp. 760–763. [Google Scholar] [CrossRef]
- Scarmana, G. An application of the least squares plane fitting interpolation process to image reconstruction and enhancement: University of Southern Queensland Repository. In Proceedings of the 78th FIG Working Week 2016: Recovering from Disaster, Christchurch, New Zealand, 2–6 May 2016; pp. 11–22. Available online: https://research.usq.edu.au/item/q36yy/an-application-of-the-least-squares-plane-fitting-interpolation-process-to-image-reconstruction-and-enhancement (accessed on 15 April 2023).
- Kohn, A.F. Autocorrelation and Cross-Correlation Methods; Wiley Encyclopedia of Biomedical Engineering: Hoboken, NJ, USA, 2006. [Google Scholar] [CrossRef]
- SciPy User Guide—SciPy v1.10.1 Manual. Available online: https://docs.scipy.org/doc/scipy/tutorial/index.html#user-guide (accessed on 3 May 2023).
- Signal Processing (scipy.signal)—SciPy v1.10.1 Manual. Available online: https://docs.scipy.org/doc/scipy/reference/signal.html (accessed on 3 May 2023).
- Statistical Functions (scipy.stats)—SciPy v1.10.1 Manual. Available online: https://docs.scipy.org/doc/scipy/reference/stats.html (accessed on 3 May 2023).
- Corder, G.W.; Foreman, D.I. Nonparametric Statistics: A Step-By-Step Approach, 2nd ed.; John Wiley & Sons: Hoboken, NJ, USA, 2014; Available online: https://books.google.com/books/about/Nonparametric_Statistics.html?id=hYVYAwAAQBAJ (accessed on 28 April 2023).
- Benesty, J.; Chen, J.; Huang, Y.; Cohen, I. Pearson Correlation Coefficient. In Noise Reduction in Speech Processing; Springer: Berlin/Heidelberg, Germany, 2009; Volume 2, pp. 1–4. [Google Scholar] [CrossRef]
- Chai, T.; Draxler, R.R. Root mean square error (RMSE) or mean absolute error (MAE)? -Arguments against avoiding RMSE in the literature. Geosci. Model Dev. 2014, 7, 1247–1250. [Google Scholar] [CrossRef]
- Serda, M.; Balint, G.; Antala, B.; Carty, C.; Mabieme, J.-M.A.; Amar, I.B.; Kaplanova, A. Synteza i Aktywność Biologiczna Nowych Analogów Tiosemikarbazonowych Chelatorów Żelaza; Uniwersytet Śląski. Wydział Matematyki, Fizyki i Chemii: Bankowa, Poland, 2013; Volume 7, pp. 343–354. [Google Scholar]
- Kitasuka, T.; Aritsugi, M.; Rahutomo, F. Semantic Cosine Similarity. 2012. Available online: https://www.researchgate.net/publication/262525676 (accessed on 28 April 2023).
- Jekel, C.F.; Venter, G.; Venter, M.P.; Stander, N.; Haftka, R.T. Similarity measures for identifying material parameters from hysteresis loops using inverse analysis. Int. J. Mater. Form. 2019, 12, 355–378. [Google Scholar] [CrossRef]
- Bookstein, A.; Kulyukin, V.A.; Raita, T. Generalized hamming distance. Inf. Retr. Boston. 2002, 5, 353–375. [Google Scholar] [CrossRef]
- Theodoridis, S.; Koutroumbas, K. Clustering: Basic Concepts. In Pattern Recognition; Academic Press: Cambridge, MA, USA, 2009; pp. 595–625. [Google Scholar] [CrossRef]
- pyxDamerauLevenshtein—PyPI. Available online: https://pypi.org/project/pyxDamerauLevenshtein/ (accessed on 3 May 2023).
- similaritymeasures—PyPI. Available online: https://pypi.org/project/similaritymeasures/ (accessed on 3 May 2023).
- Devogele, T.; Esnault, M.; Etienne, L.; Lardy, F. Optimized Discrete Fréchet Distance between trajectories. In Proceedings of the BigSpatial 2017—6th ACM SIGSPATIAL International Workshop on Analytics for Big Geospatial Data, Redondo Beach, CA, USA, 7–10 November 2017; pp. 11–19. [Google Scholar] [CrossRef]
- Slavov, S.D.; Iliev, I.V. Design and FEM static analysis of an instrument for surface plastic deformation of non-planar functional surfaces of machine parts. Fiability Durab. 2016, 1, 3–9. Available online: https://doaj.org/article/5d09023126684e709cca46eb394d5573 (accessed on 25 April 2023).
- Nečas, D.; Klapetek, P. Gwyddion: An open-source software for SPM data analysis. Cent. Eur. J. Phys. 2012, 10, 181–188. [Google Scholar] [CrossRef]
- Minitab 21 Support—Minitab. Available online: https://support.minitab.com/en-us/minitab/21/ (accessed on 7 October 2022).
- James, G.; Witten, D.; Hastie, T.; Tibshirani, R. An Introduction to Statistical Learning, 2nd ed.; Springer: New York, NY, USA, 2021. [Google Scholar]


| Patterns with RR | ||||||||||||||||||
|---|---|---|---|---|---|---|---|---|---|---|---|---|---|---|---|---|---|---|
| Along | Across | Along | Across | Along | Across | Along | Across | Along | Across | Along | Across | Along | Across | Along | Across | Along | Across | |
| Pattern 1 | 0.689 | 0.873 | 0.625 | 0.825 | 0.926 | 0.936 | 0.984 | 0.988 | 0.687 | 0.872 | 0.007 | 0.002 | 0.034 | 0.076 | 0.853 | 0.873 | 0.603 | 0.578 |
| Pattern 2 | 0.789 | 0.891 | 0.811 | 0.857 | 0.928 | 0.958 | 0.984 | 0.994 | 0.779 | 0.891 | 0.005 | 0.020 | 0.016 | 0.047 | 0.856 | 0.915 | 0.504 | 0.654 |
| Pattern 3 | 0.822 | 0.815 | 0.850 | 0.800 | 0.931 | 0.931 | 0.981 | 0.986 | 0.811 | 0.814 | 0.007 | 0.007 | 0.042 | 0.015 | 0.862 | 0.861 | 0.404 | 0.571 |
| Pattern 4 | 0.700 | 0.844 | 0.737 | 0.788 | 0.924 | 0.937 | 0.980 | 0.987 | 0.688 | 0.842 | 0.009 | 0.006 | 0.032 | 0.047 | 0.848 | 0.874 | 0.361 | 0.549 |
| Pattern 5 | 0.421 | 0.623 | 0.436 | 0.668 | 0.884 | 0.921 | 0.965 | 0.981 | 0.414 | 0.623 | 0.001 | 0.004 | 0.003 | 0.016 | 0.767 | 0.842 | 0.494 | 0.418 |
| Pattern 6 | 0.812 | 0.797 | 0.758 | 0.694 | 0.939 | 0.931 | 0.989 | 0.983 | 0.812 | 0.796 | 0.009 | 0.006 | 0.083 | 0.025 | 0.877 | 0.862 | 0.651 | 0.527 |
| Pattern 7 | 0.813 | 0.770 | 0.744 | 0.827 | 0.943 | 0.934 | 0.989 | 0.985 | 0.806 | 0.770 | 0.008 | 0.012 | 0.099 | 0.048 | 0.886 | 0.868 | 0.571 | 0.482 |
| Pattern 8 | 0.749 | 0.569 | 0.692 | 0.522 | 0.940 | 0.917 | 0.988 | 0.981 | 0.749 | 0.564 | 0.017 | 0.005 | 0.037 | 0.010 | 0.880 | 0.833 | 0.542 | 0.537 |
| Average | 0.724 | 0.773 | 0.707 | 0.748 | 0.927 | 0.933 | 0.983 | 0.986 | 0.718 | 0.772 | 0.008 | 0.008 | 0.043 | 0.035 | 0.854 | 0.866 | 0.516 | 0.540 |
| Patterns with RR | ||||||||||||||
|---|---|---|---|---|---|---|---|---|---|---|---|---|---|---|
| Row Index | Column Index | Row Index | Column Index | Row Index | Column Index | Row Index | Column Index | Row Index | Column Index | Row Index | Column Index | Row Index | Column Index | |
| Pattern 1 | 309 | 272 | 310 | 1109 | 428 | 33 | 416 | 35 | 309 | 272 | 428 | 33 | 417 | 266 |
| Pattern 2 | 240 | 1160 | 237 | 362 | 243 | 352 | 251 | 350 | 240 | 1160 | 243 | 352 | 260 | 1171 |
| Pattern 3 | 56 | 105 | 57 | 106 | 56 | 108 | 82 | 112 | 56 | 105 | 56 | 108 | 172 | 243 |
| Pattern 4 | 60 | 1014 | 56 | 974 | 550 | 1022 | 59 | 1015 | 60 | 1014 | 550 | 1022 | 687 | 974 |
| Pattern 5 | 100 | 541 | 1088 | 537 | 93 | 538 | 93 | 542 | 100 | 541 | 179 | 538 | 204 | 533 |
| Pattern 6 | 598 | 34 | 597 | 1080 | 595 | 39 | 595 | 42 | 598 | 34 | 595 | 39 | 600 | 1083 |
| Pattern 7 | 594 | 403 | 428 | 408 | 392 | 252 | 583 | 251 | 594 | 403 | 392 | 252 | 276 | 399 |
| Pattern 8 | 191 | 480 | 195 | 485 | 188 | 681 | 189 | 670 | 191 | 480 | 188 | 681 | 186 | 670 |
| Patterns with RR | Trials | Stylus-Measured Profilograms | 3D Topography Images | |||||||
|---|---|---|---|---|---|---|---|---|---|---|
| Along | Across | Sz, μm | Sa, μm | Sz/Sa | ||||||
| Rz, μm | Ra, μm | Rz/Ra | Rz, μm | Ra, μm | Rz/Ra | |||||
| Pattern 1 | 1 | 46.06 | 6.61 | 6.97 | 58.35 | 8.54 | 6.83 | 65.59 | 9.66 | 6.79 |
| 2 | 37.48 | 5.83 | 6.43 | 44.69 | 7.18 | 6.22 | ||||
| 3 | 39.49 | 5.68 | 6.95 | 37.98 | 5.35 | 7.10 | ||||
| Pattern 2 | 1 | 55.56 | 5.95 | 9.34 | 82.45 | 8.23 | 10.02 | 82.09 | 8.65 | 9.49 |
| 2 | 52.55 | 5.67 | 9.27 | 54.35 | 5.46 | 9.95 | ||||
| 3 | 49.55 | 4.95 | 10.01 | 47.59 | 5.11 | 9.31 | ||||
| Pattern 3 | 1 | 59.54 | 12.10 | 4.92 | 27.48 | 5.03 | 5.46 | 122.5 | 23.05 | 5.31 |
| 2 | 63.19 | 12.06 | 5.24 | 16.51 | 2.94 | 5.61 | ||||
| 3 | 64.83 | 11.54 | 5.62 | 15.32 | 3.07 | 4.99 | ||||
| Pattern 4 | 1 | 52.02 | 7.48 | 6.95 | 32.68 | 5.08 | 6.43 | 74.86 | 11.01 | 6.80 |
| 2 | 61.03 | 8.98 | 6.80 | 39.94 | 7.64 | 5.23 | ||||
| 3 | 59.68 | 8.97 | 6.65 | 32.60 | 5.23 | 6.23 | ||||
| Pattern 5 | 1 | 19.34 | 1.95 | 9.92 | 22.72 | 2.32 | 9.79 | 47.38 | 4.44 | 10.67 |
| 2 | 22.47 | 2.22 | 10.12 | 19.89 | 2.09 | 9.52 | ||||
| 3 | 13.98 | 1.39 | 10.06 | 21.69 | 2.23 | 9.73 | ||||
| Pattern 6 | 1 | 28.31 | 3.84 | 7.37 | 27.97 | 4.29 | 6.52 | 42.32 | 5.21 | 8.12 |
| 2 | 29.59 | 4.69 | 6.31 | 16.82 | 1.96 | 8.58 | ||||
| 3 | 24.91 | 2.99 | 8.33 | 15.75 | 1.76 | 8.95 | ||||
| Pattern 7 | 1 | 27.26 | 4.05 | 6.73 | 17.39 | 2.32 | 7.49 | 62.83 | 9.26 | 6.79 |
| 2 | 28.18 | 4.27 | 6.60 | 18.53 | 2.68 | 6.91 | ||||
| 3 | 26.39 | 4.07 | 6.49 | 16.30 | 2.54 | 6.42 | ||||
| Pattern 8 | 1 | 17.49 | 1.81 | 9.67 | 17.52 | 1.76 | 9.96 | 74.34 | 7.33 | 10.14 |
| 2 | 18.81 | 1.95 | 9.64 | 17.54 | 1.79 | 9.80 | ||||
| 3 | 17.87 | 1.78 | 10.04 | 14.11 | 1.25 | 11.28 | ||||
| Patterns with RR | Sz/Sa (Target) | Profilograms Mean | St. Dev. | 95% CI for Equivalence | Lower and Upper Limits ± 0.05 | Null Hypothesis (H0) | T-Value | p-Value | Is H0 Rejected? | Equivalence? |
|---|---|---|---|---|---|---|---|---|---|---|
| Pattern 1 | 6.79 | 6.7495 | 0.34523 | (−0.324481; 0.243512) | L: −0.3395 | Δ ≤ −0.3395 | 2.1216 | 0.044 | Yes | Yes |
| U: 0.3395 | Δ ≥ 0.3395 | −2.6961 | 0.021 | |||||||
| Pattern 2 | 9.49 | 9.6501 | 0.37785 | (−0.150754; 0.470912) | L: −0.4745 | Δ ≤ −0.4745 | 4.1138 | 0.005 | Yes | Yes |
| U: 0.4745 | Δ ≥ 0.4745 | −2.0383 | 0.049 | |||||||
| Pattern 3 | 5.31 | 5.3090 | 0.30520 | (−0.252061; 0.250084) | L: −0.2655 | Δ ≤ −0.2655 | 2.1229 | 0.044 | Yes | Yes |
| U: 0.2655 | Δ ≥ 0.2655 | −2.1388 | 0.043 | |||||||
| Pattern 4 | 6.80 | 6.6374 | 0.21539 | (−0.339745; 0.0146286) | L: −0.3400 | Δ ≤ −0.3400 | 2.0180 | 0.050 | Yes | Yes |
| U: 0.3400 | Δ ≥ 0.3400 | −5.7153 | 0.001 | |||||||
| Pattern 5 | 10.67 | 9.8577 | 0.22148 | (−0.994494; 0.00003) | L: −0.5335 | Δ ≤ −0.5335 | −3.0834 | 0.986 | No | No |
| U: 0.5335 | Δ ≥ 0.5335 | −14.884 | 0.000 | |||||||
| Pattern 6 | 8.12 | 7.6774 | 1.1082 | (−1.35423; 0.468990) | L: −0.4060 | Δ ≤ −0.4060 | −0.08095 | 0.531 | No | No |
| U: 0.4060 | Δ ≥ 0.4060 | −1.8758 | 0.060 | |||||||
| Pattern 7 | 6.79 | 6.7761 | 0.39381 | (−0.337821; 0.310112) | L: −0.3395 | Δ ≤ −0.3395 | 2.0255 | 0.049 | Yes | Yes |
| U: 0.3395 | Δ ≥ 0.3395 | −2.1978 | 0.040 | |||||||
| Pattern 8 | 10.14 | 10.116 | 0.58046 | (−0.501456; 0.453566) | L: −0.5070 | Δ ≤ −0.5070 | 2.0384 | 0.049 | Yes | Yes |
| U: 0.5070 | Δ ≥ 0.5070 | −2.2405 | 0.038 |
Disclaimer/Publisher’s Note: The statements, opinions and data contained in all publications are solely those of the individual author(s) and contributor(s) and not of MDPI and/or the editor(s). MDPI and/or the editor(s) disclaim responsibility for any injury to people or property resulting from any ideas, methods, instructions or products referred to in the content. |
© 2023 by the authors. Licensee MDPI, Basel, Switzerland. This article is an open access article distributed under the terms and conditions of the Creative Commons Attribution (CC BY) license (https://creativecommons.org/licenses/by/4.0/).
Share and Cite
Slavov, S.; Van, L.S.B.; Dimitrov, D.; Nikolov, B. An Approach for 3D Modeling of the Regular Relief Surface Topography Formed by a Ball Burnishing Process Using 2D Images and Measured Profilograms. Sensors 2023, 23, 5801. https://doi.org/10.3390/s23135801
Slavov S, Van LSB, Dimitrov D, Nikolov B. An Approach for 3D Modeling of the Regular Relief Surface Topography Formed by a Ball Burnishing Process Using 2D Images and Measured Profilograms. Sensors. 2023; 23(13):5801. https://doi.org/10.3390/s23135801
Chicago/Turabian StyleSlavov, Stoyan, Lyubomir Si Bao Van, Diyan Dimitrov, and Boris Nikolov. 2023. "An Approach for 3D Modeling of the Regular Relief Surface Topography Formed by a Ball Burnishing Process Using 2D Images and Measured Profilograms" Sensors 23, no. 13: 5801. https://doi.org/10.3390/s23135801
APA StyleSlavov, S., Van, L. S. B., Dimitrov, D., & Nikolov, B. (2023). An Approach for 3D Modeling of the Regular Relief Surface Topography Formed by a Ball Burnishing Process Using 2D Images and Measured Profilograms. Sensors, 23(13), 5801. https://doi.org/10.3390/s23135801