
HGT: A Hierarchical GCN-Based Transformer for Multimodal Periprosthetic Joint Infection Diagnosis Using Computed Tomography Images and Text


Abstract
1. Introduction
2. Related Work
2.1. PJI Diagnosis
2.2. Transformer
2.3. GCN
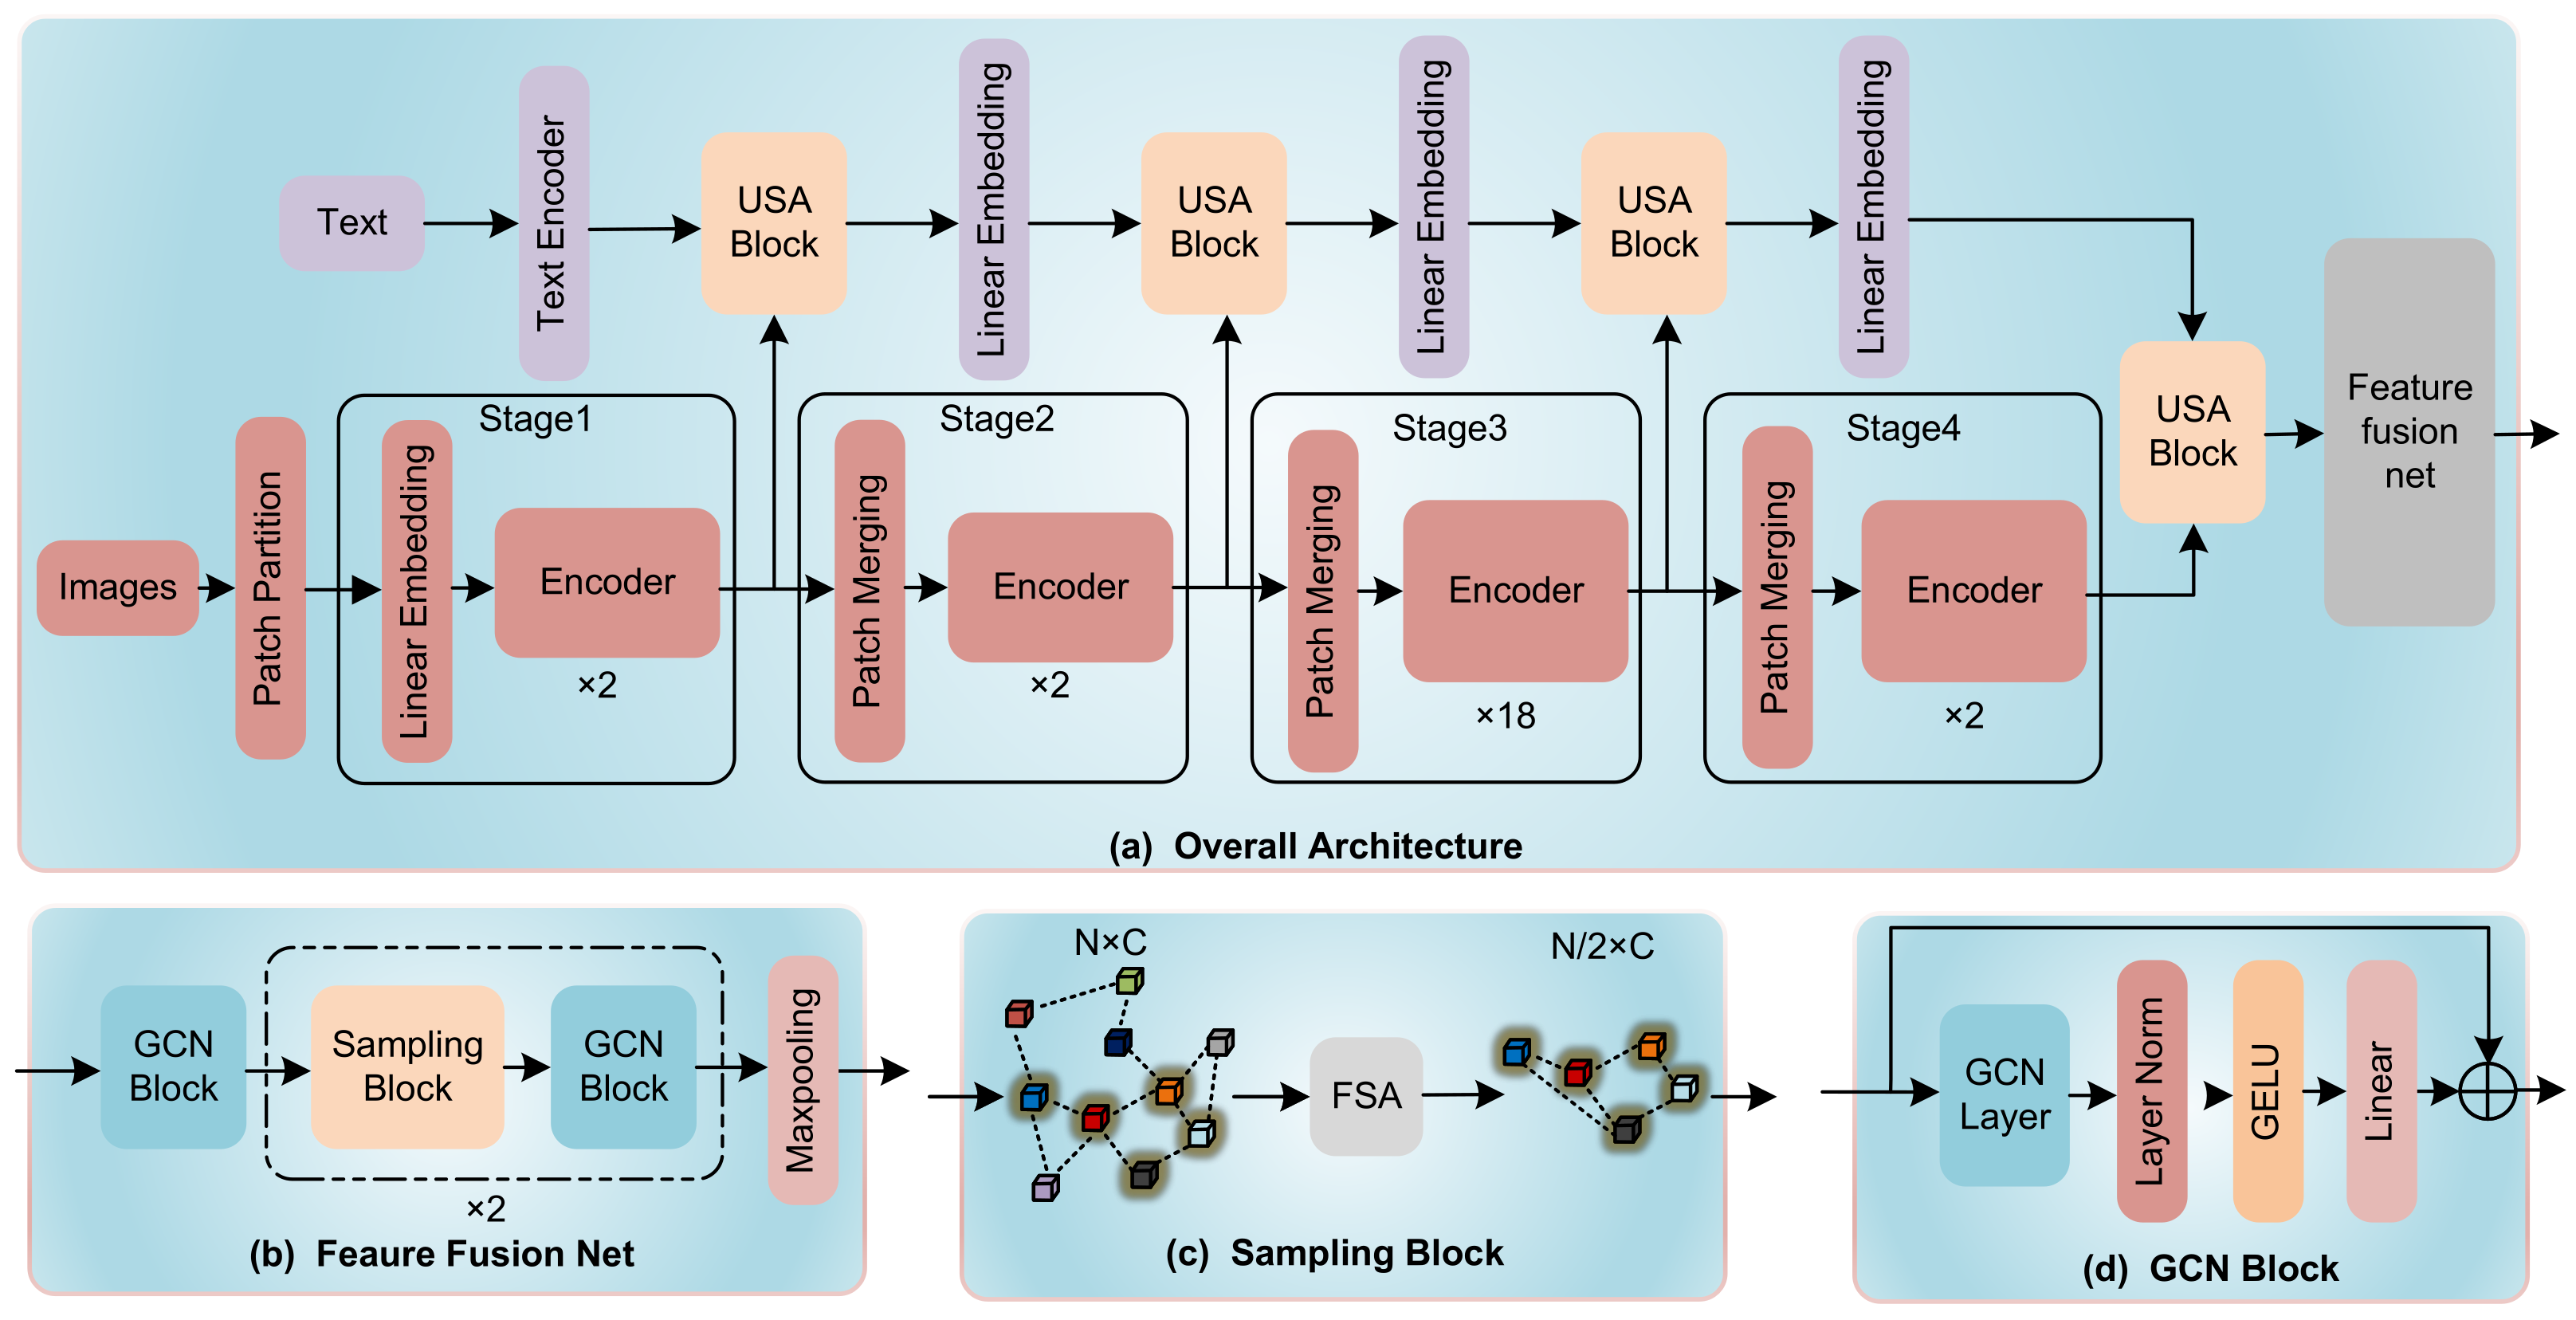
3. Methods
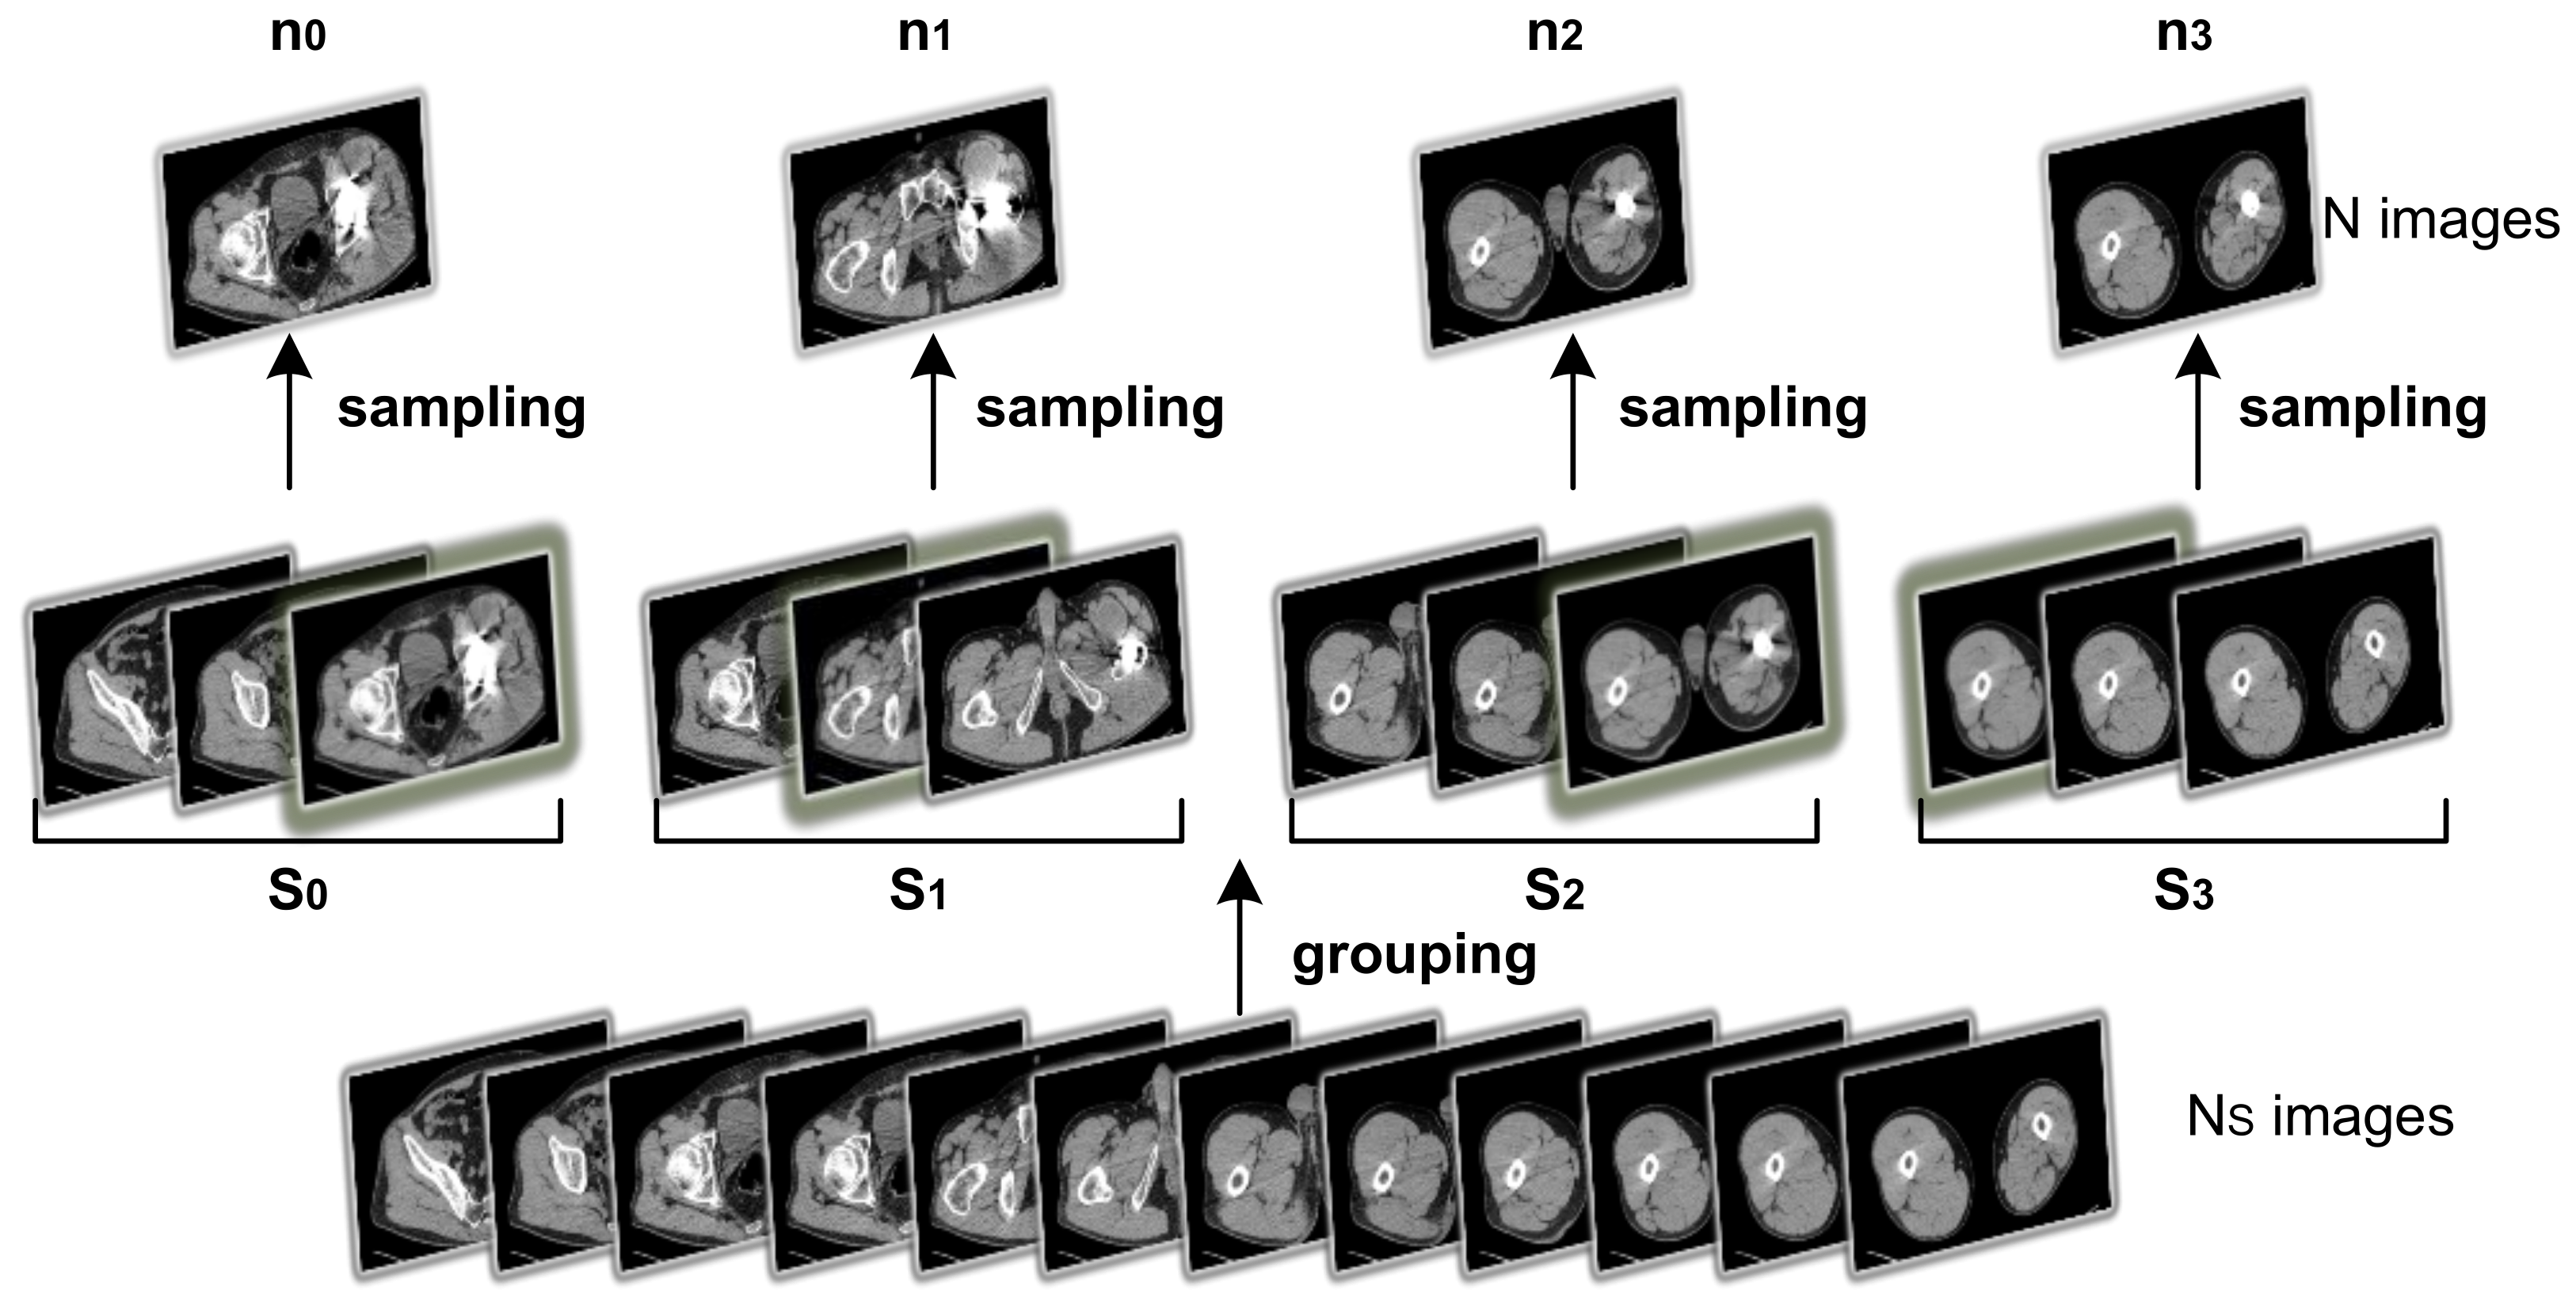
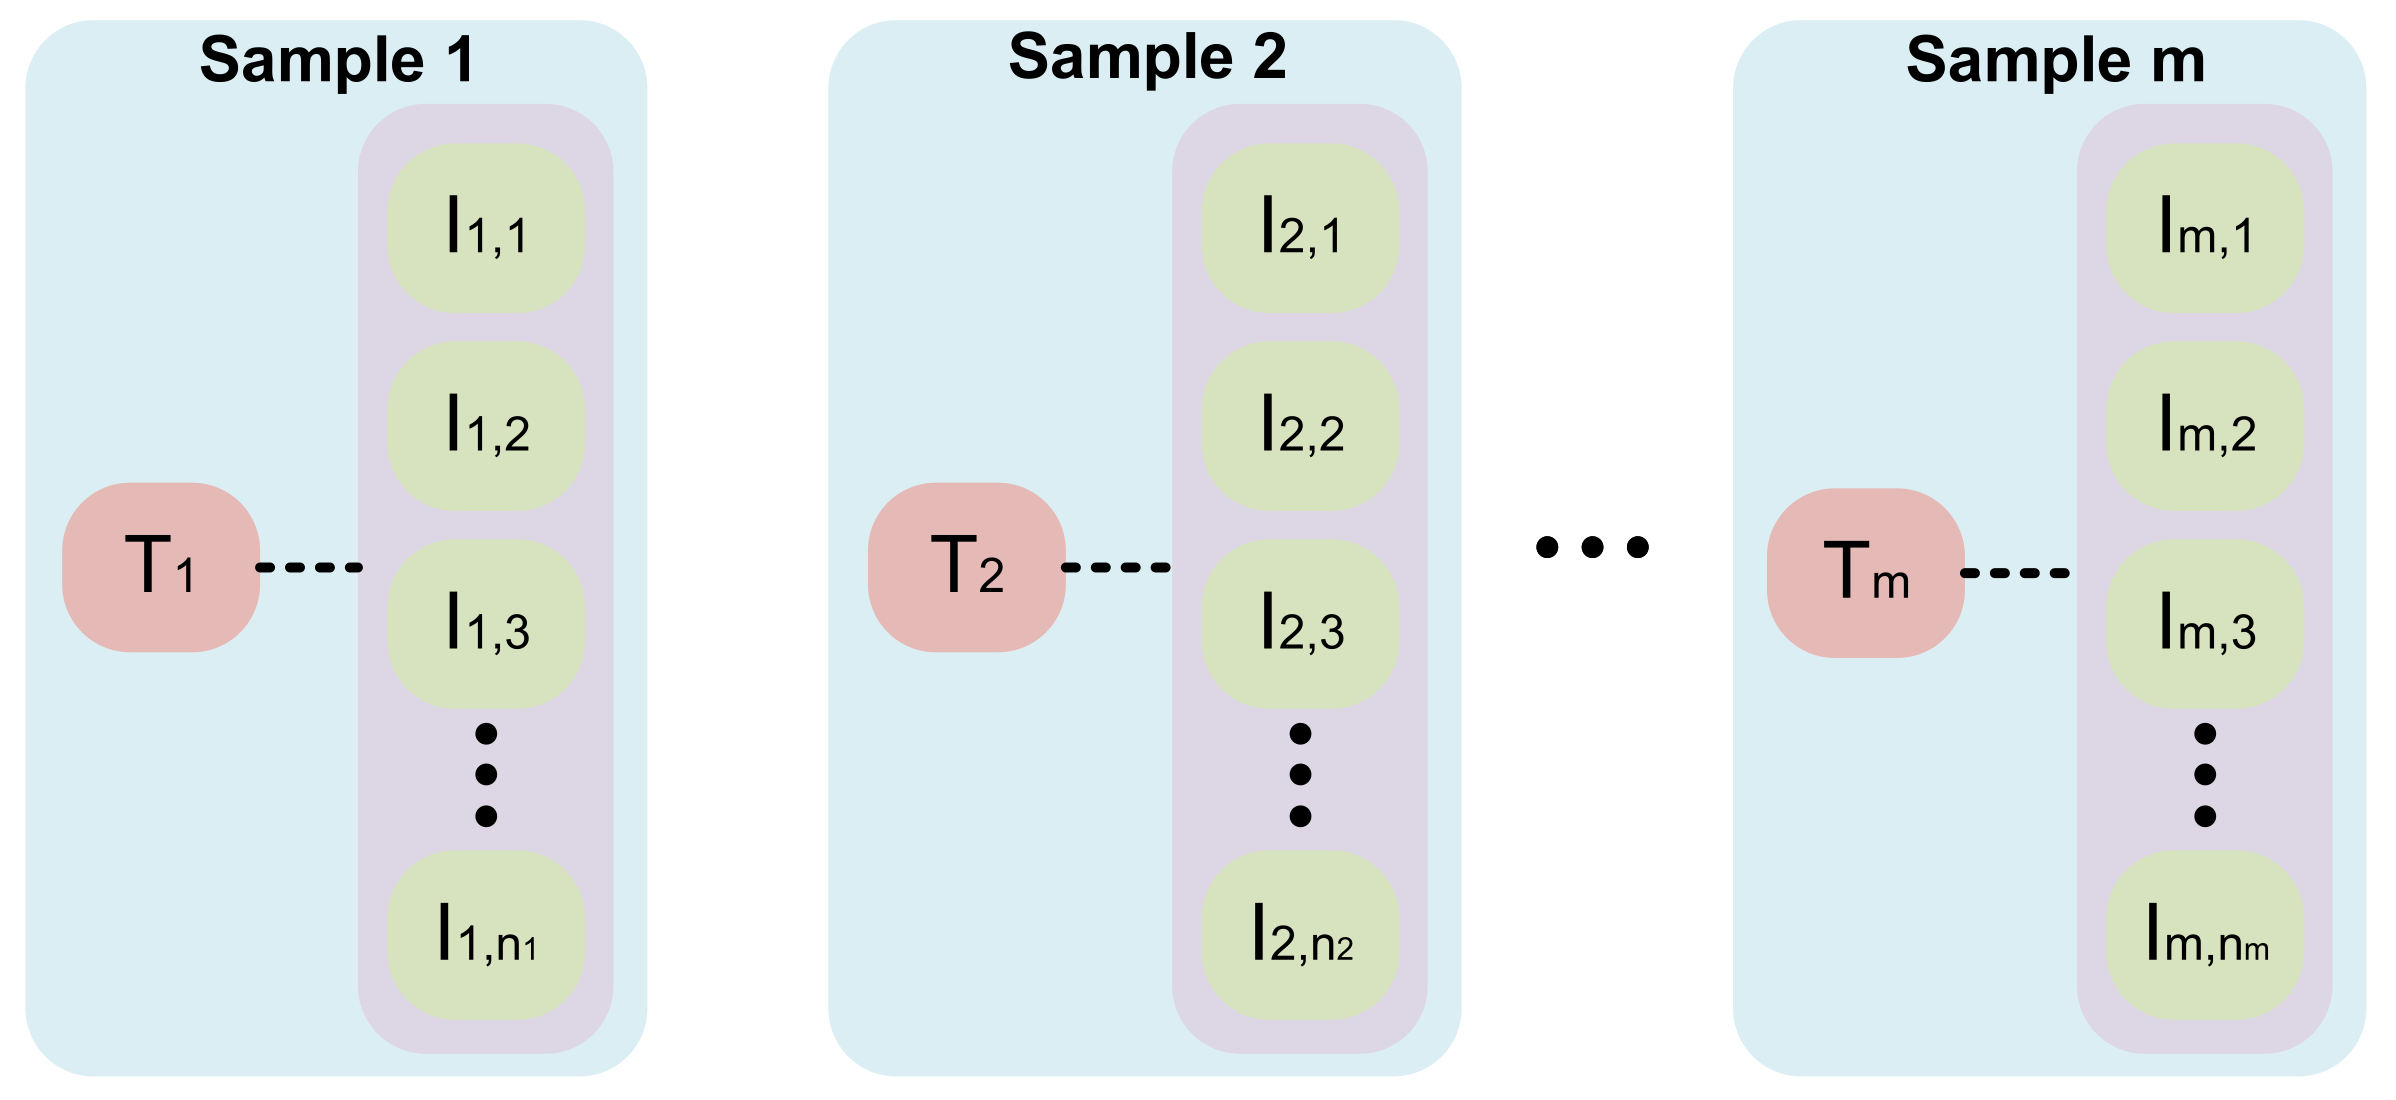
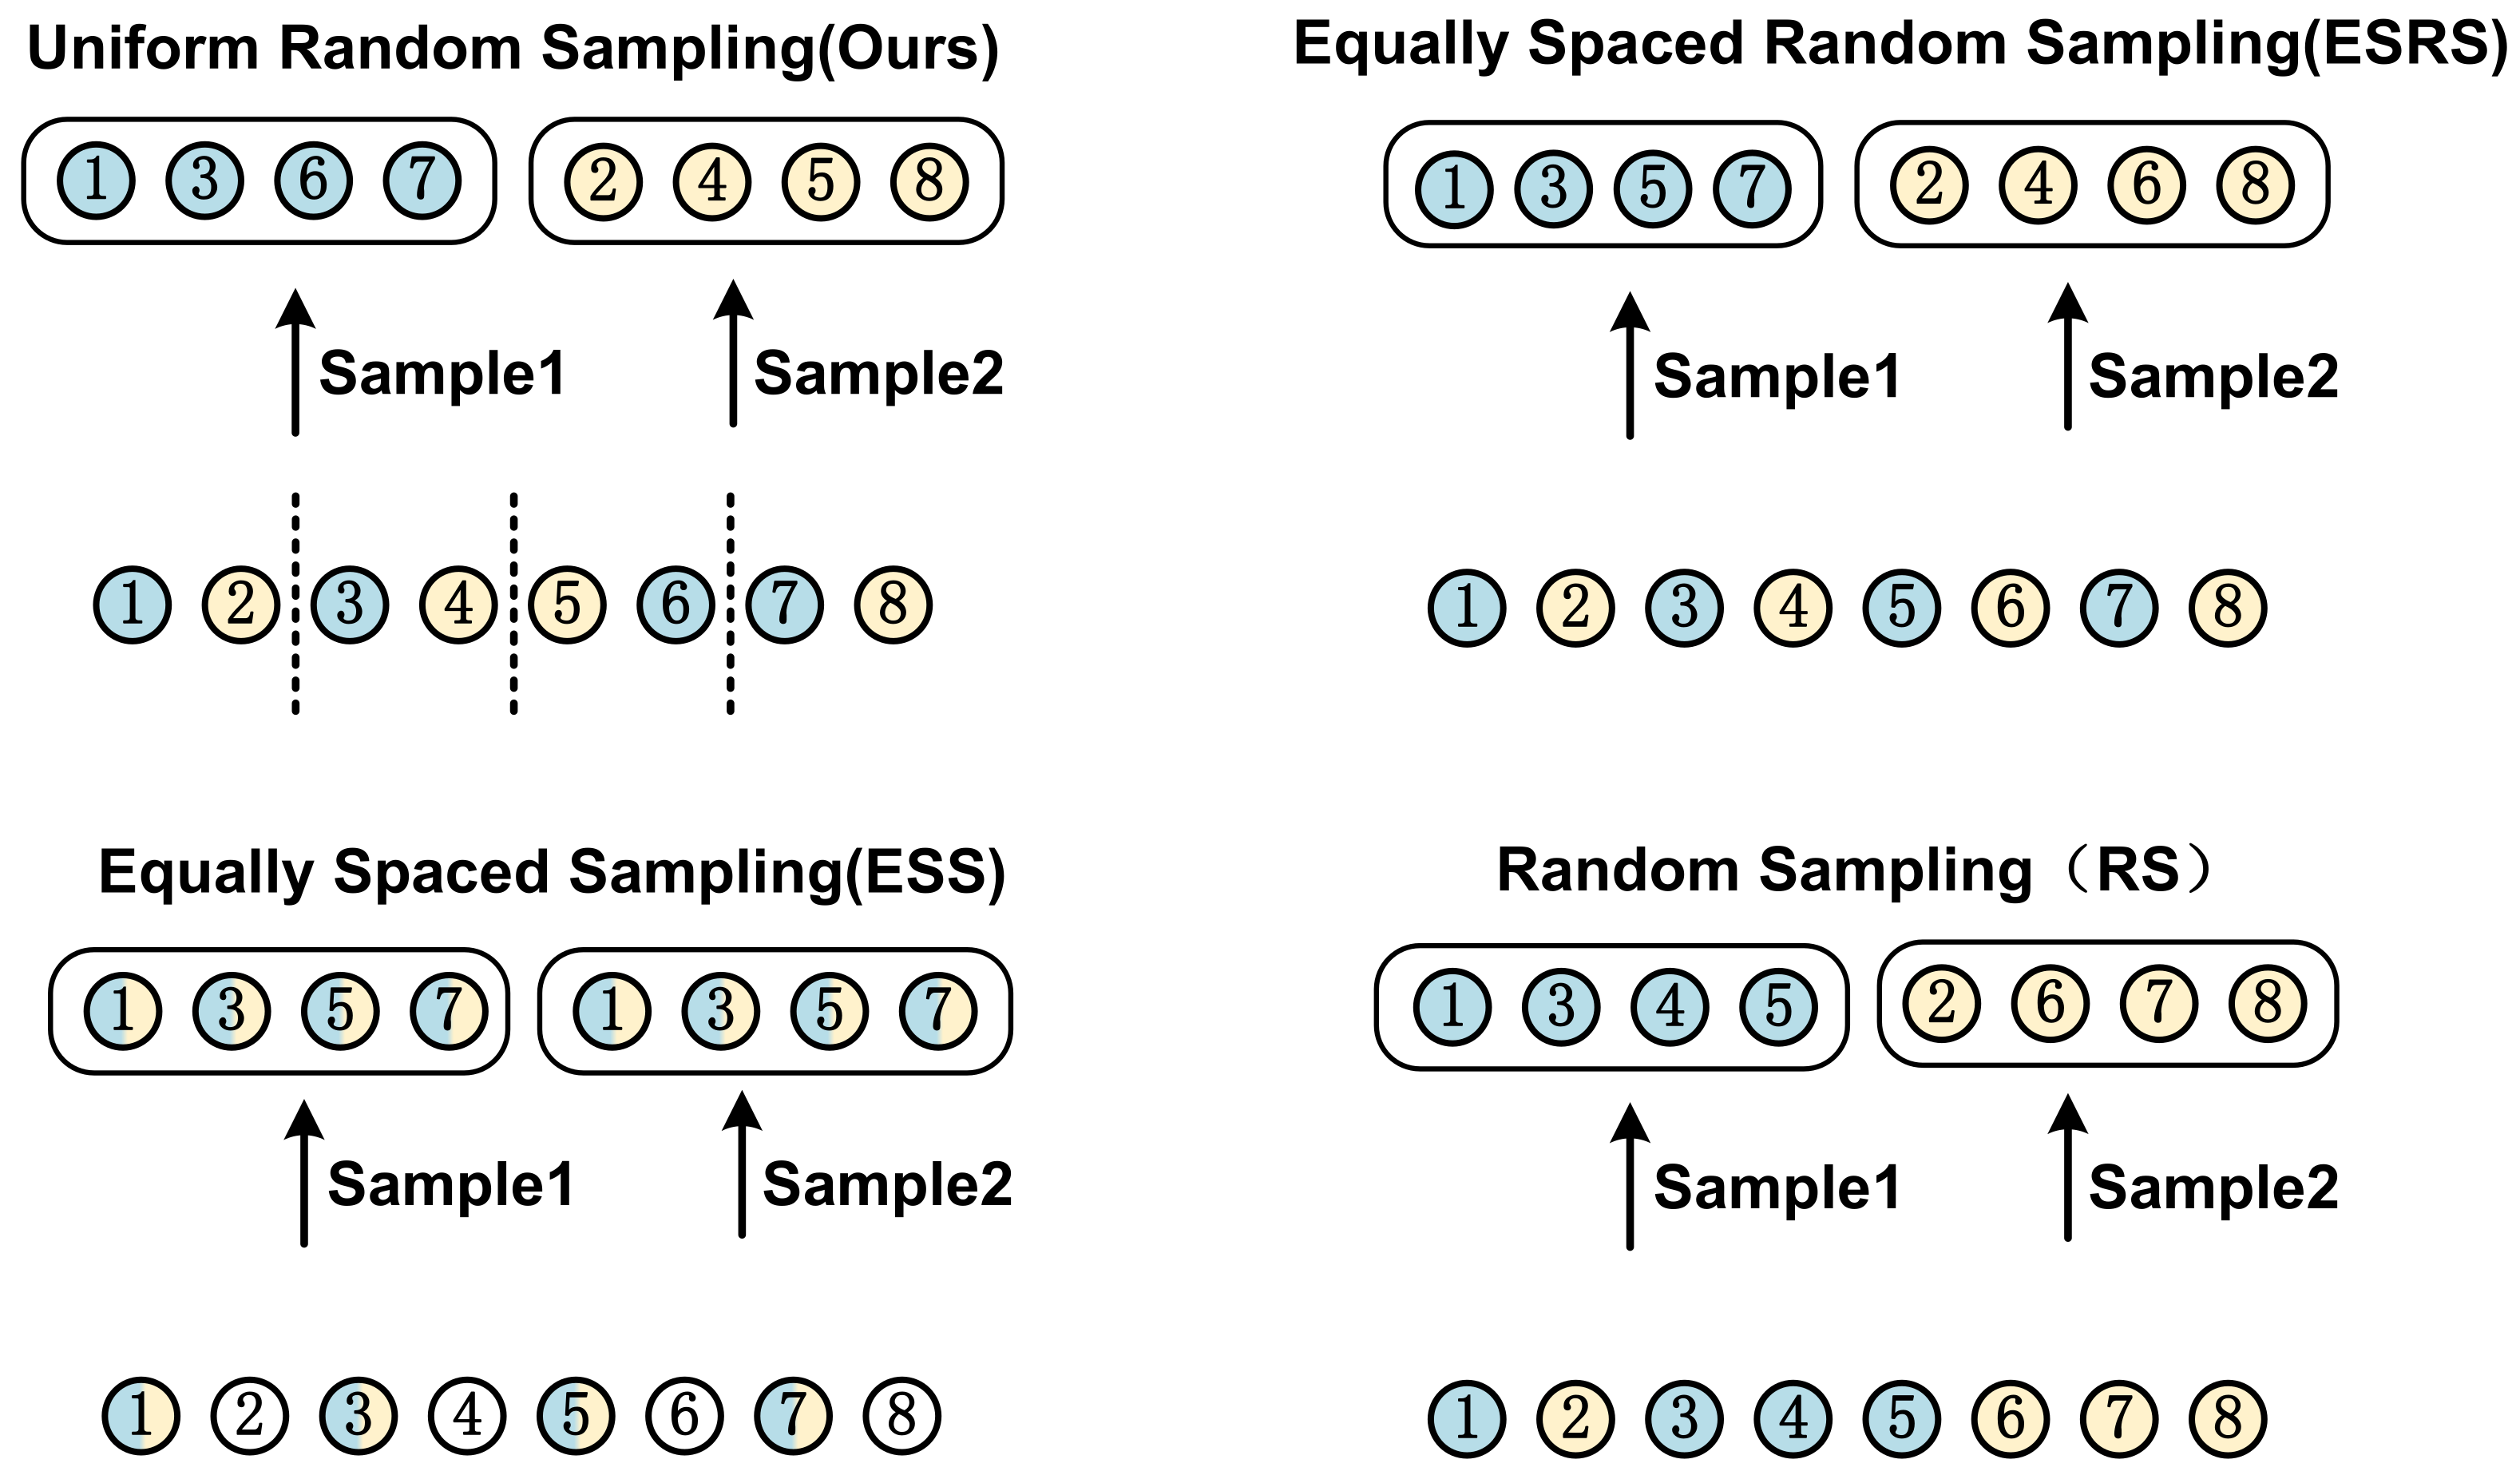
3.1. Sampling Strategy
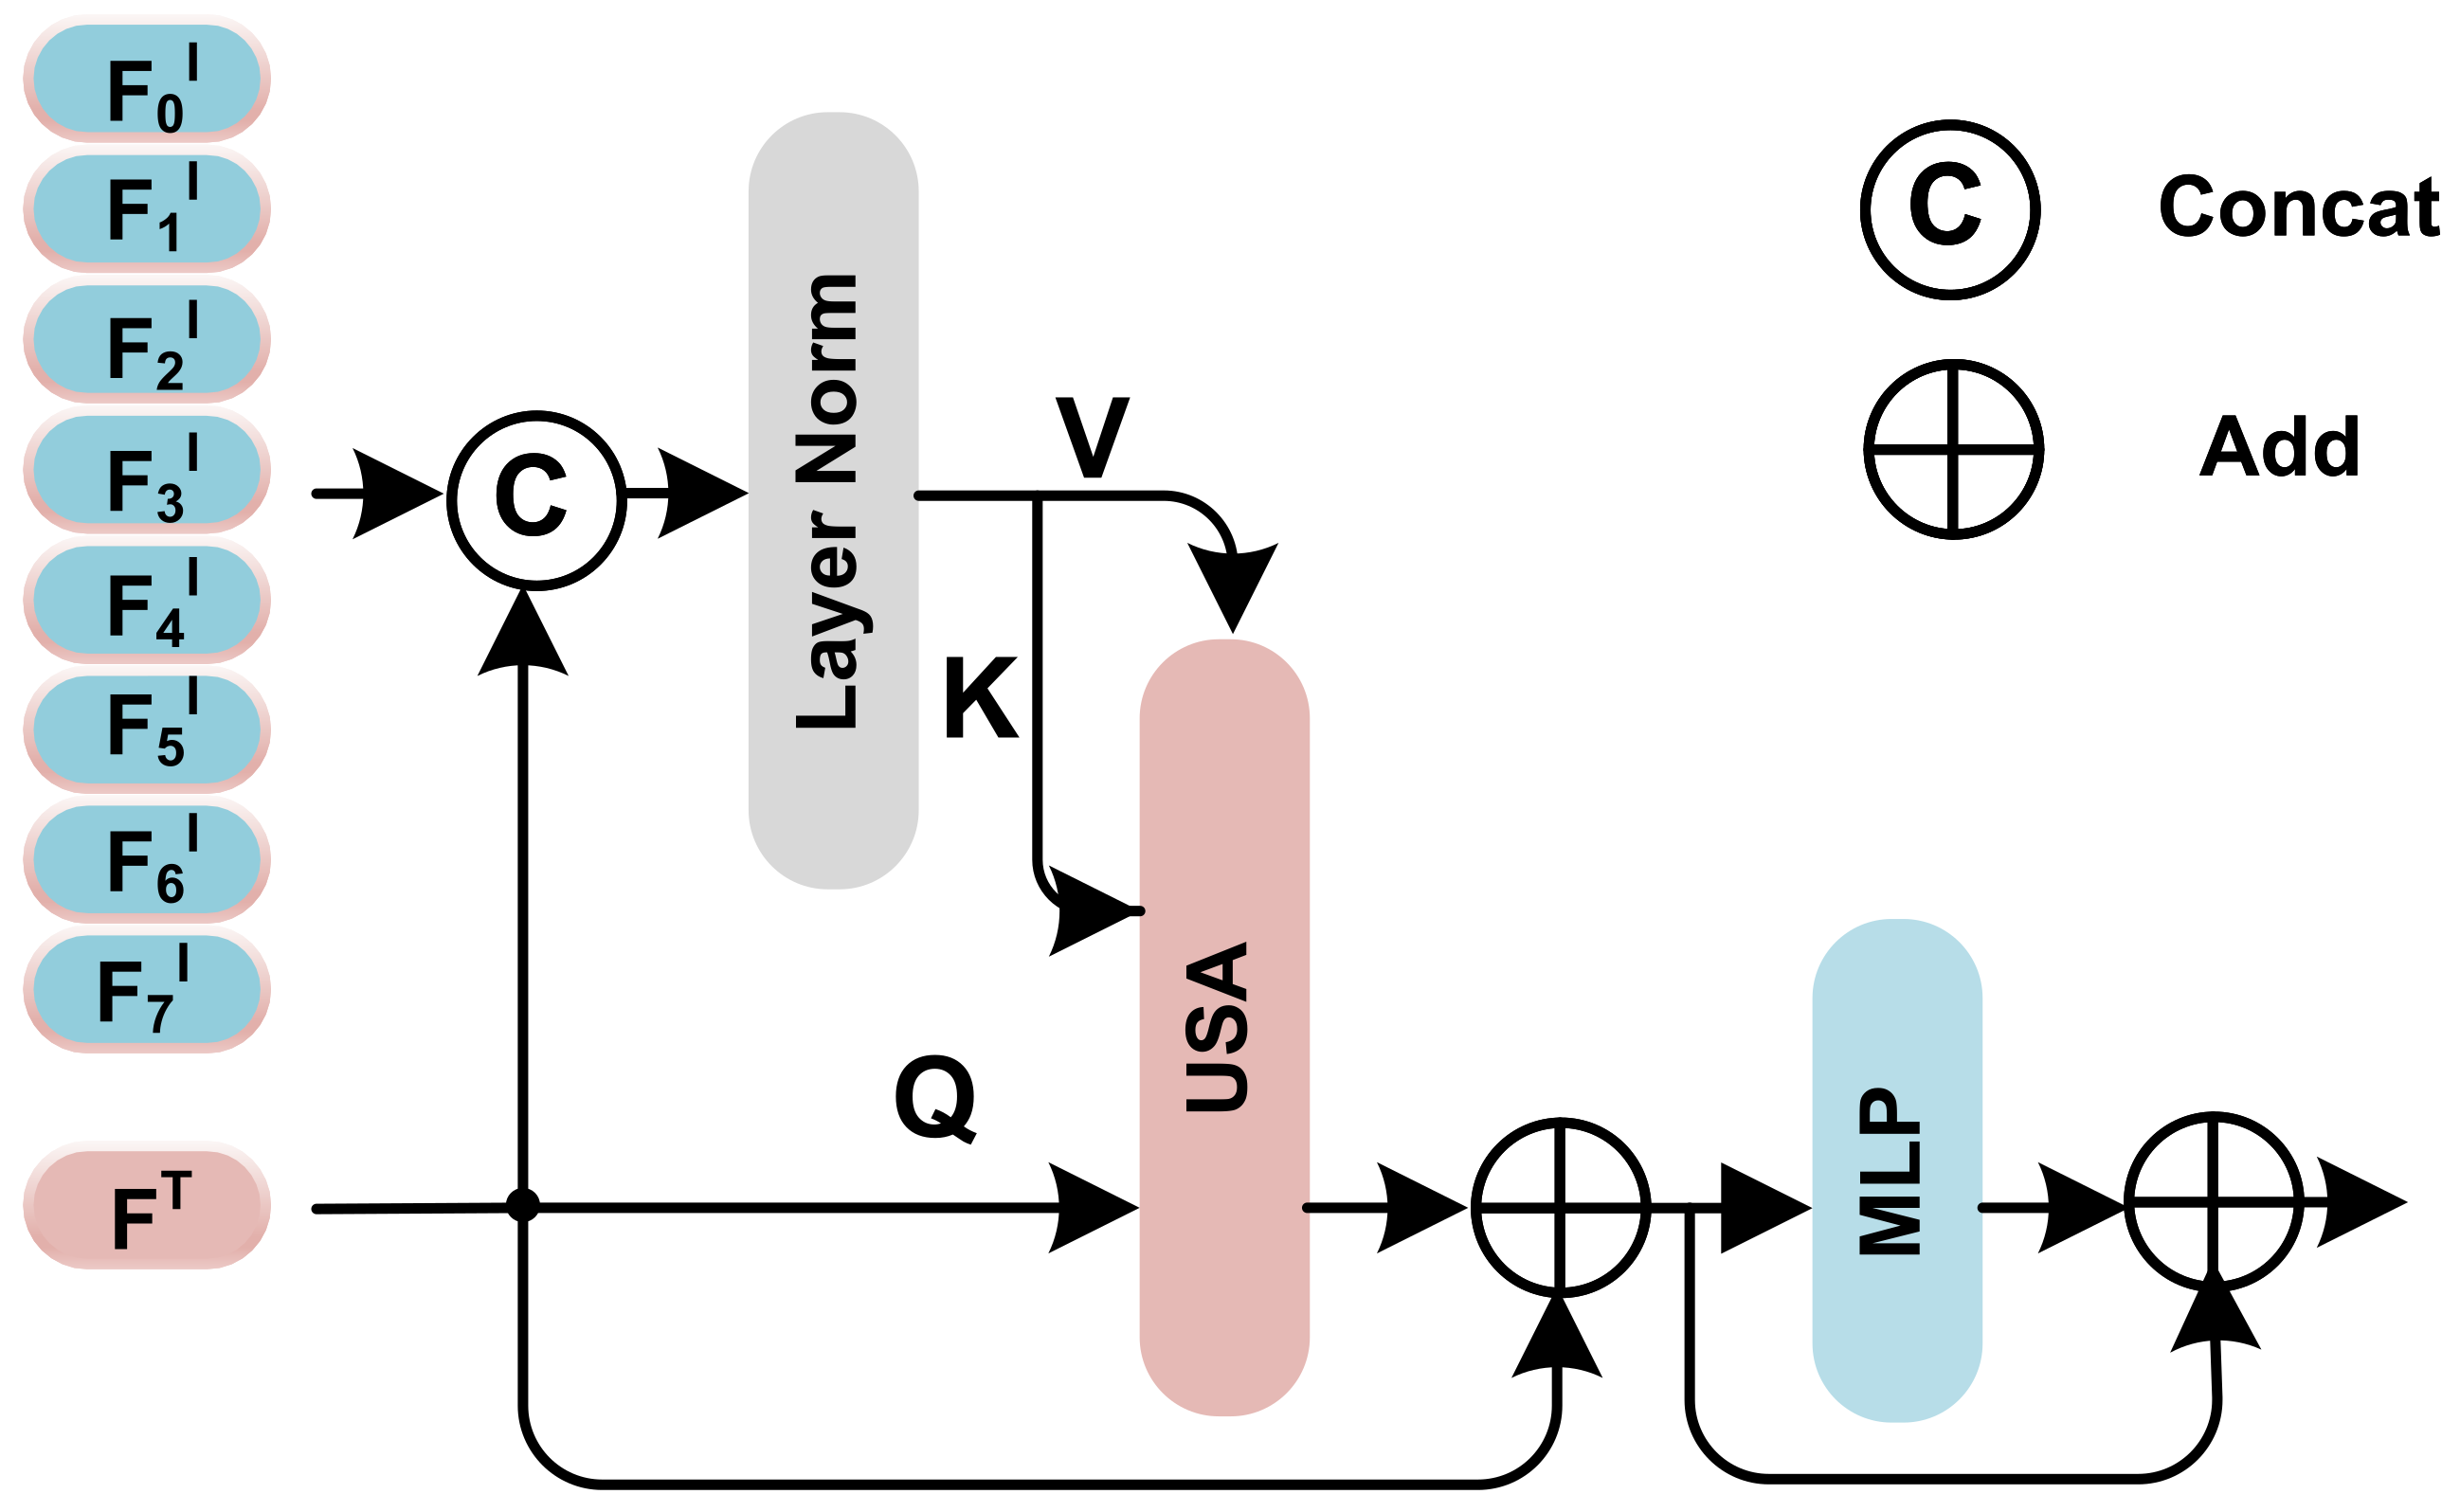
3.2. Unidirectional Selective Attention
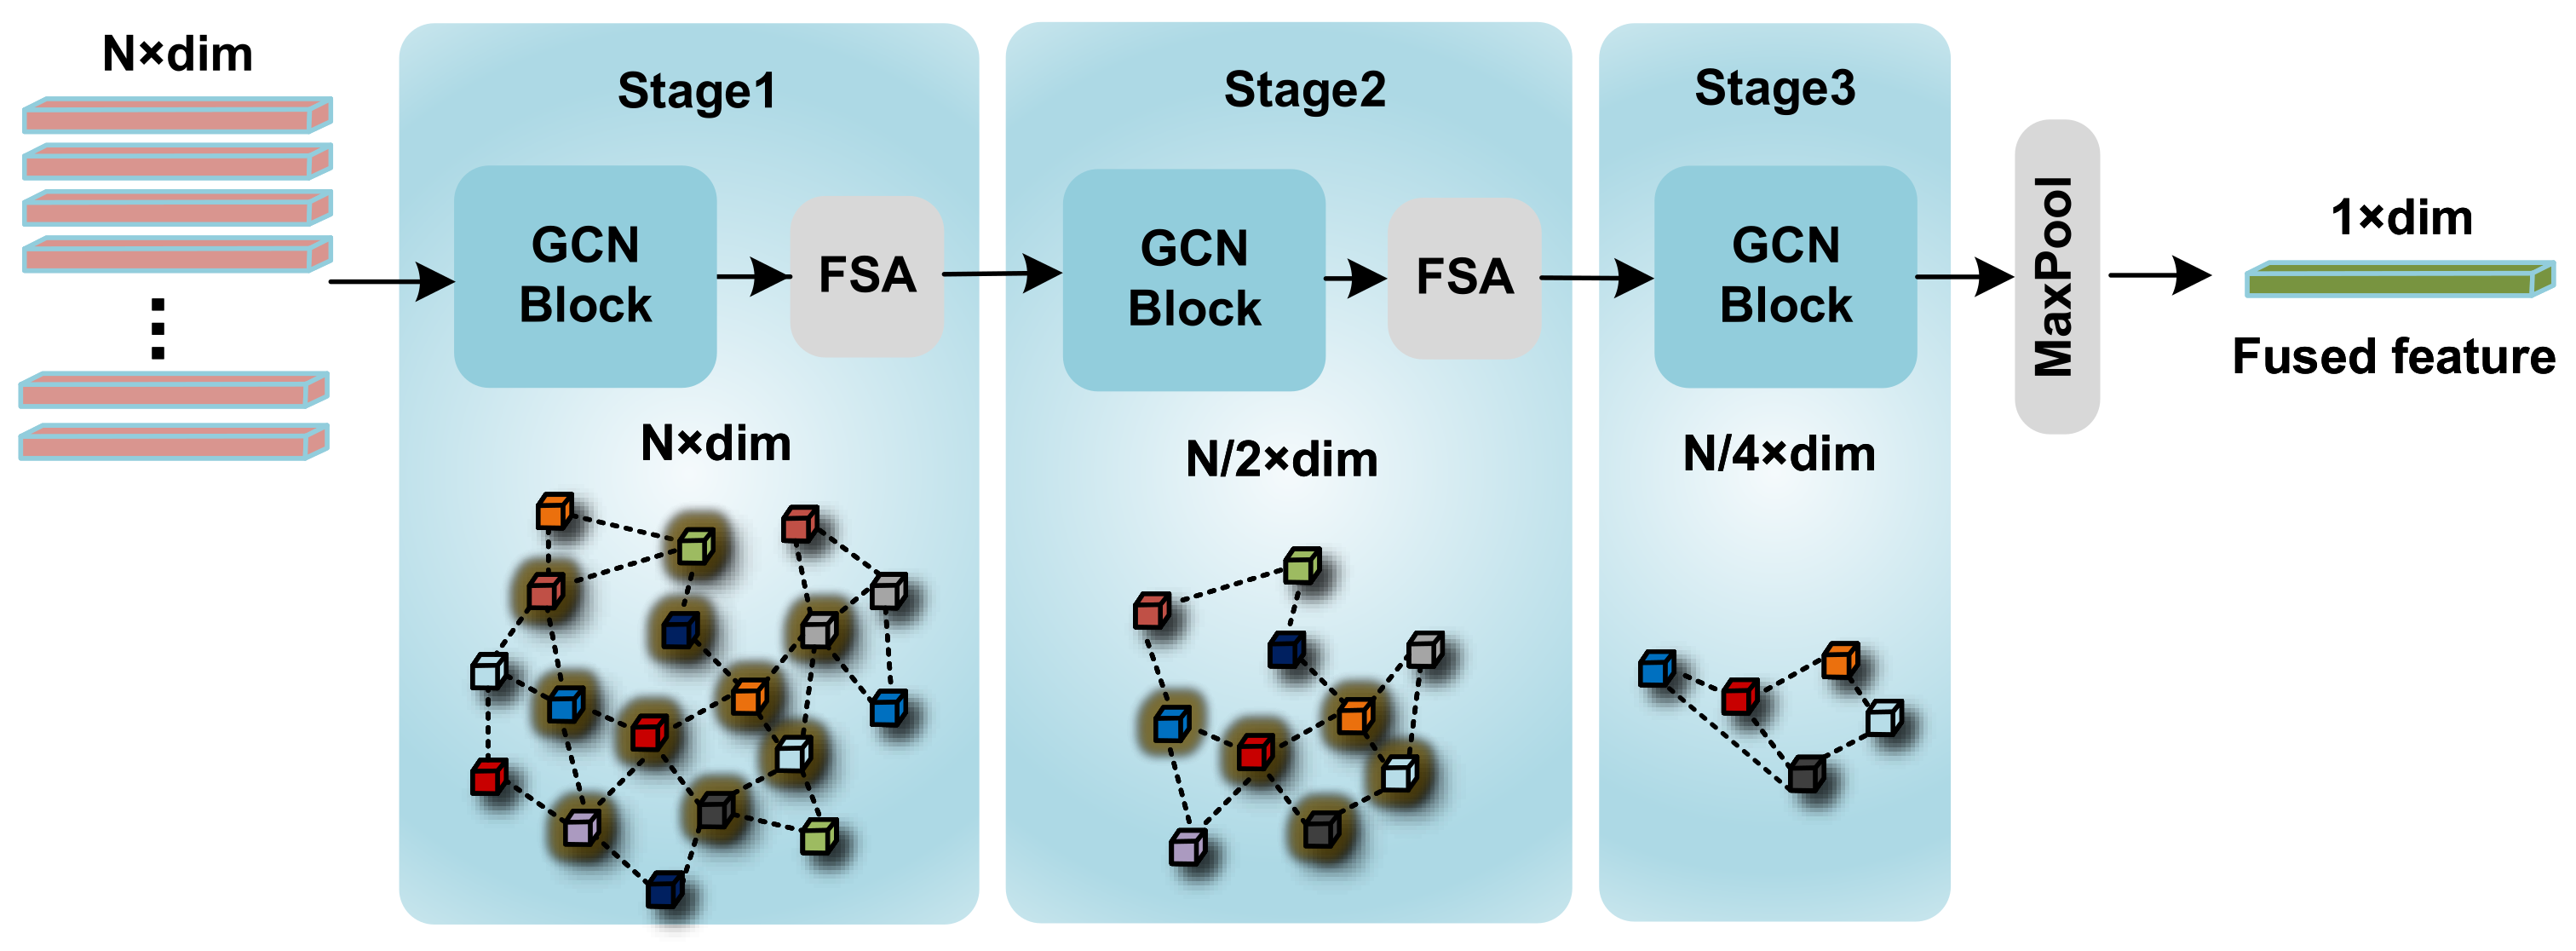
3.3. GCN Feature Fusion Net
3.4. Graph Based on Features of CT Images and Numerical Indicators
3.5. Image Feature Fusion and Sampling
4. Implementation and Results
4.1. Datasets
4.2. Training Loss and Implementation Details
4.3. Evaluation Metrics
4.4. Experiment on PJI Dataset
4.5. Ablation Study
4.5.1. Influence of k in Undirected Graph Construction
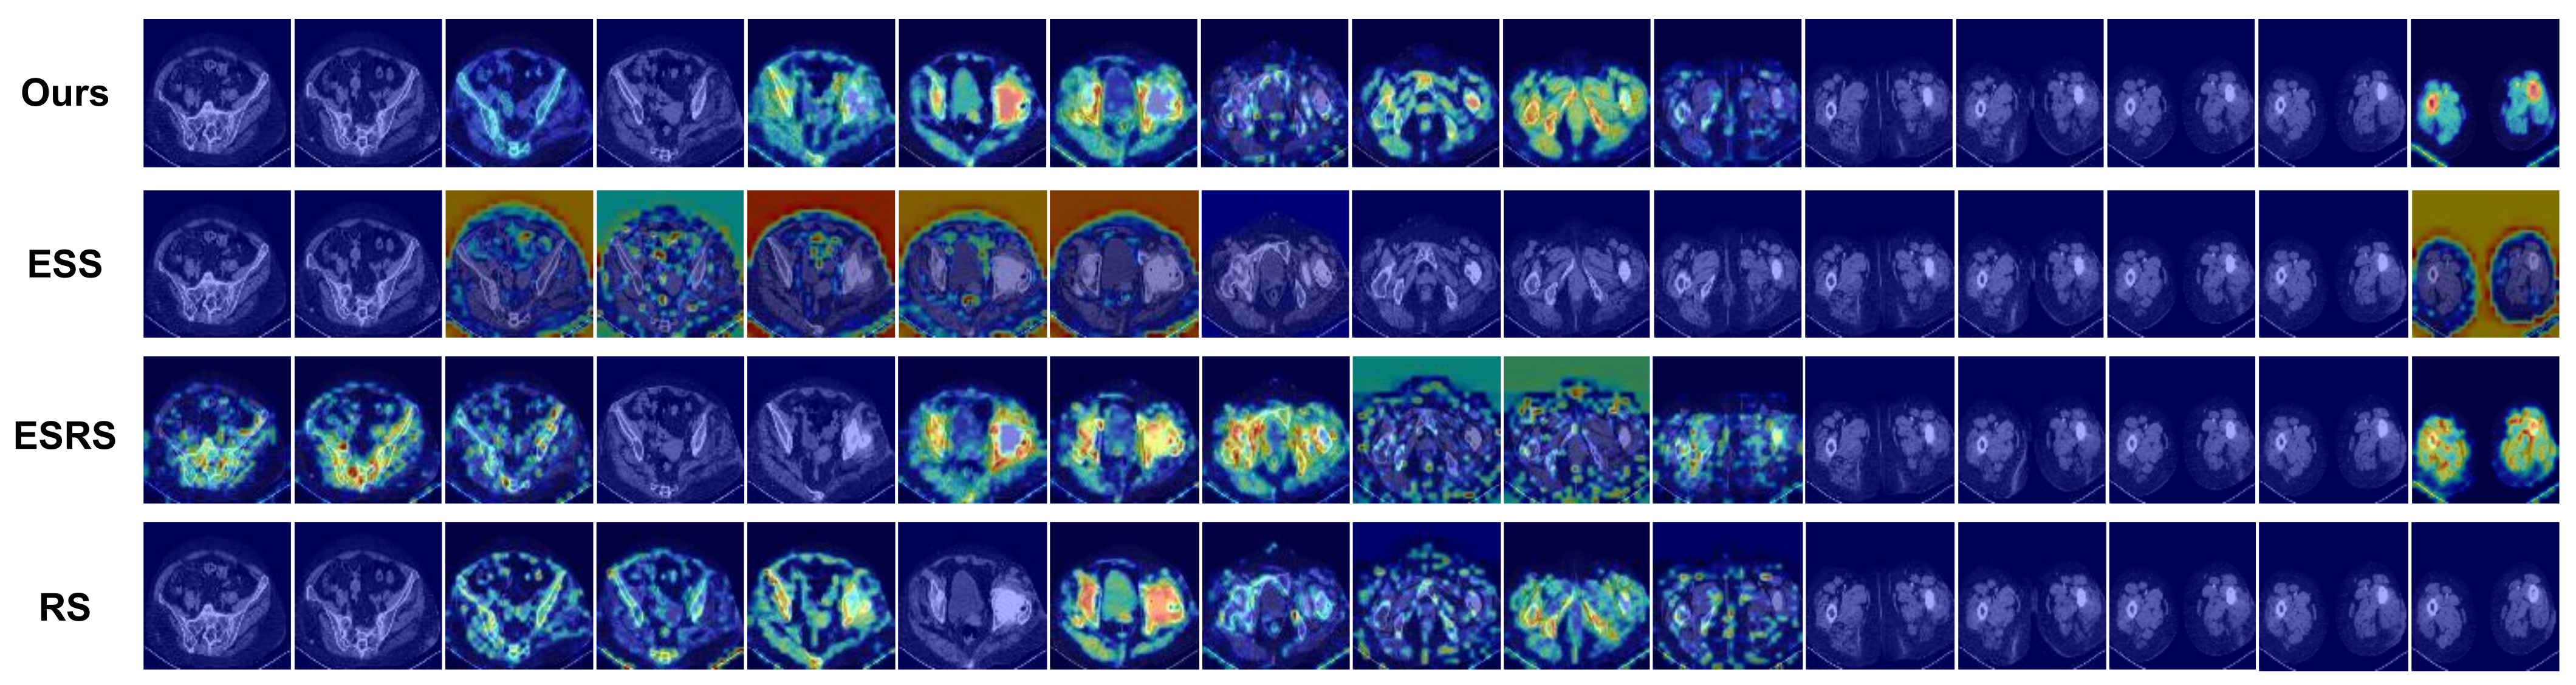
4.5.2. Impact of Sampling Strategy
4.6. Performance on Single Modality
5. Limitations
6. Conclusions
Author Contributions
Funding
Institutional Review Board Statement
Informed Consent Statement
Data Availability Statement
Conflicts of Interest
References
- Parvizi, J.; Tan, T.L.; Goswami, K.; Higuera, C.; Della Valle, C.; Chen, A.F.; Shohat, N. The 2018 definition of periprosthetic hip and knee infection: An evidence-based and validated criteria. J. Arthroplast. 2018, 33, 1309–1314. [Google Scholar] [CrossRef]
- Signore, A.; Sconfienza, L.M.; Borens, O.; Glaudemans, A.W.; Cassar-Pullicino, V.; Trampuz, A.; Winkler, H.; Gheysens, O.; Vanhoenacker, F.M.; Petrosillo, N.; et al. Consensus document for the diagnosis of prosthetic joint infections: A joint paper by the EANM, EBJIS, and ESR (with ESCMID endorsement). Eur. J. Nucl. Med. Mol. Imaging 2019, 46, 971–988. [Google Scholar] [CrossRef]
- Falstie-Jensen, T.; Lange, J.; Daugaard, H.; Vendelbo, M.; Sørensen, A.; Zerahn, B.; Ovesen, J.; Søballe, K.; Gormsen, L.; ROSA study-group. 18F FDG-PET/CT has poor diagnostic accuracy in diagnosing shoulder PJI. Eur. J. Nucl. Med. Mol. Imaging 2019, 46, 2013–2022. [Google Scholar] [CrossRef]
- Fayad, L.M.; Carrino, J.A.; Fishman, E.K. Musculoskeletal infection: Role of CT in the emergency department. Radiographics 2007, 27, 1723–1736. [Google Scholar] [CrossRef]
- Baltrušaitis, T.; Ahuja, C.; Morency, L.P. Multimodal machine learning: A survey and taxonomy. IEEE Trans. Pattern Anal. Mach. Intell. 2018, 41, 423–443. [Google Scholar] [CrossRef]
- Kim, W.; Son, B.; Kim, I. Vilt: Vision-and-language transformer without convolution or region supervision. In Proceedings of the International Conference on Machine Learning, PMLR, Virtual, 18–24 July 2021; pp. 5583–5594. [Google Scholar]
- Lu, J.; Batra, D.; Parikh, D.; Lee, S. Vilbert: Pretraining task-agnostic visiolinguistic representations for vision-and-language tasks. Adv. Neural Inf. Process. Syst. 2019, 32. [Google Scholar]
- Qi, D.; Su, L.; Song, J.; Cui, E.; Bharti, T.; Sacheti, A. Imagebert: Cross-modal pre-training with large-scale weak-supervised image-text data. arXiv 2020, arXiv:2001.07966. [Google Scholar]
- Hu, R.; Singh, A. Unit: Multimodal multitask learning with a unified transformer. In Proceedings of the IEEE/CVF International Conference on Computer Vision, Montreal, BC, Canada, 11–17 October 2021; pp. 1439–1449. [Google Scholar]
- Kipf, T.N.; Welling, M. Semi-supervised classification with graph convolutional networks. arXiv 2016, arXiv:1609.02907. [Google Scholar]
- Ghanem, E.; Antoci, V., Jr.; Pulido, L.; Joshi, A.; Hozack, W.; Parvizi, J. The use of receiver operating characteristics analysis in determining erythrocyte sedimentation rate and C-reactive protein levels in diagnosing periprosthetic infection prior to revision total hip arthroplasty. Int. J. Infect. Dis. 2009, 13, e444–e449. [Google Scholar] [CrossRef]
- Parvizi, J.; Zmistowski, B.; Berbari, E.F.; Bauer, T.W.; Springer, B.D.; Della Valle, C.J.; Garvin, K.L.; Mont, M.A.; Wongworawat, M.D.; Zalavras, C.G. New definition for periprosthetic joint infection: From the Workgroup of the Musculoskeletal Infection Society. Clin. Orthop. Relat. Res.® 2011, 469, 2992–2994. [Google Scholar] [CrossRef] [PubMed]
- Randelli, F.; Brioschi, M.; Randelli, P.; Ambrogi, F.; Sdao, S.; Aliprandi, A. Fluoroscopy-vs ultrasound-guided aspiration techniques in the management of periprosthetic joint infection: Which is the best? La Radiol. Med. 2018, 123, 28–35. [Google Scholar] [CrossRef]
- Squire, M.W.; Valle, C.J.D.; Parvizi, J. Preoperative diagnosis of periprosthetic joint infection: Role of aspiration. Am. J. Roentgenol. 2011, 196, 875–879. [Google Scholar] [CrossRef] [PubMed]
- Love, C.; Marwin, S.E.; Palestro, C.J. Nuclear medicine and the infected joint replacement. In Proceedings of the Seminars in Nuclear Medicine; Elsevier: Amsterdam, The Netherlands, 2009; Volume 39, pp. 66–78. [Google Scholar]
- Kuo, F.C.; Hu, W.H.; Hu, Y.J. Periprosthetic Joint Infection Prediction via Machine Learning: Comprehensible Personalized Decision Support for Diagnosis. J. Arthroplast. 2022, 37, 132–141. [Google Scholar] [CrossRef]
- Klemt, C.; Laurencin, S.; Uzosike, A.C.; Burns, J.C.; Costales, T.G.; Yeo, I.; Habibi, Y.; Kwon, Y.M. Machine learning models accurately predict recurrent infection following revision total knee arthroplasty for periprosthetic joint infection. Knee Surg. Sport. Traumatol. Arthrosc. 2021, 1–9. [Google Scholar] [CrossRef] [PubMed]
- Tao, Y.; Hu, H.; Li, J.; Li, M.; Zheng, Q.; Zhang, G.; Ni, M. A preliminary study on the application of deep learning methods based on convolutional network to the pathological diagnosis of PJI. Arthroplasty 2022, 4, 49. [Google Scholar] [CrossRef]
- Vaswani, A.; Shazeer, N.; Parmar, N.; Uszkoreit, J.; Jones, L.; Gomez, A.N.; Kaiser, Ł.; Polosukhin, I. Attention is all you need. arXiv 2017, arXiv:1706.0376230. [Google Scholar]
- Liu, Y. Fine-tune BERT for extractive summarization. arXiv 2019, arXiv:1903.10318. [Google Scholar]
- Dosovitskiy, A.; Beyer, L.; Kolesnikov, A.; Weissenborn, D.; Zhai, X.; Unterthiner, T.; Dehghani, M.; Minderer, M.; Heigold, G.; Gelly, S.; et al. An image is worth 16x16 words: Transformers for image recognition at scale. arXiv 2020, arXiv:2010.11929. [Google Scholar]
- Liu, Z.; Lin, Y.; Cao, Y.; Hu, H.; Wei, Y.; Zhang, Z.; Lin, S.; Guo, B. Swin transformer: Hierarchical vision transformer using shifted windows. In Proceedings of the IEEE/CVF International Conference on Computer Vision, Xi’an, China, 10–17 October 2021; pp. 10012–10022. [Google Scholar]
- Tu, Z.; Talebi, H.; Zhang, H.; Yang, F.; Milanfar, P.; Bovik, A.; Li, Y. Maxvit: Multi-axis vision transformer. In Proceedings of the Computer Vision–ECCV 2022: 17th European Conference, Tel Aviv, Israel, 23–27 October 2022; pp. 459–479. [Google Scholar]
- Zhang, L.; Wen, Y. A transformer-based framework for automatic COVID-19 diagnosis in chest CTs. In Proceedings of the IEEE/CVF International Conference on Computer Vision, Xi’an, China, 10–17 October 2021; pp. 513–518. [Google Scholar]
- Jafari, M.; Shoeibi, A.; Ghassemi, N.; Heras, J.; Khosravi, A.; Ling, S.H.; Alizadehsani, R.; Beheshti, A.; Zhang, Y.D.; Wang, S.H.; et al. Automatic Diagnosis of Myocarditis Disease in Cardiac MRI Modality using Deep Transformers and Explainable Artificial Intelligence. arXiv 2022, arXiv:2210.14611. [Google Scholar]
- Ye, X.; Xiao, M.; Ning, Z.; Dai, W.; Cui, W.; Du, Y.; Zhou, Y. NEEDED: Introducing Hierarchical Transformer to Eye Diseases Diagnosis. In Proceedings of the 2023 SIAM International Conference on Data Mining (SDM), Minneapolis, MI, USA, 27–29 April 2023; pp. 667–675. [Google Scholar]
- Xing, X.; Liang, G.; Zhang, Y.; Khanal, S.; Lin, A.L.; Jacobs, N. Advit: Vision transformer on multi-modality pet images for Alzheimer disease diagnosis. In Proceedings of the 2022 IEEE 19th International Symposium on Biomedical Imaging (ISBI), Kolkata, India, 28–31 March 2022; pp. 1–4. [Google Scholar]
- Dai, Y.; Gao, Y.; Liu, F. Transmed: Transformers advance multi-modal medical image classification. Diagnostics 2021, 11, 1384. [Google Scholar] [CrossRef]
- Cai, G.; Zhu, Y.; Wu, Y.; Jiang, X.; Ye, J.; Yang, D. A multimodal transformer to fuse images and metadata for skin disease classification. Vis. Comput. 2022, 1–13. [Google Scholar] [CrossRef]
- Hamilton, W.; Ying, Z.; Leskovec, J. Inductive representation learning on large graphs. Adv. Neural Inf. Process. Syst. 2017, 30. [Google Scholar]
- Duvenaud, D.K.; Maclaurin, D.; Iparraguirre, J.; Bombarell, R.; Hirzel, T.; Aspuru-Guzik, A.; Adams, R.P. Convolutional networks on graphs for learning molecular fingerprints. Adv. Neural Inf. Process. Syst. 2015, 28. [Google Scholar]
- Wang, Y.; Sun, Y.; Liu, Z.; Sarma, S.E.; Bronstein, M.M.; Solomon, J.M. Dynamic graph cnn for learning on point clouds. Acm Trans. Graph. (Tog) 2019, 38, 1–12. [Google Scholar] [CrossRef]
- Ying, R.; He, R.; Chen, K.; Eksombatchai, P.; Hamilton, W.L.; Leskovec, J. Graph convolutional neural networks for web-scale recommender systems. In Proceedings of the 24th ACM SIGKDD International Conference on Knowledge Discovery & Data Mining, London, UK, 19–23 August 2018; pp. 974–983. [Google Scholar]
- Zhang, Z.; Zhang, X.; Peng, C.; Xue, X.; Sun, J. Exfuse: Enhancing feature fusion for semantic segmentation. In Proceedings of the European Conference on Computer Vision (ECCV), Munich, Germany, 8–14 September 2018; pp. 269–284. [Google Scholar]
- Liu, Q.; Xiao, L.; Yang, J.; Wei, Z. CNN-enhanced graph convolutional network with pixel-and superpixel-level feature fusion for hyperspectral image classification. IEEE Trans. Geosci. Remote Sens. 2020, 59, 8657–8671. [Google Scholar] [CrossRef]
- Ding, Y.; Zhang, Z.; Zhao, X.; Hong, D.; Cai, W.; Yu, C.; Yang, N.; Cai, W. Multi-feature fusion: Graph neural network and CNN combining for hyperspectral image classification. Neurocomputing 2022, 501, 246–257. [Google Scholar] [CrossRef]
- Li, Z.; Xiong, G.; Tian, Y.; Lv, Y.; Chen, Y.; Hui, P.; Su, X. A multi-stream feature fusion approach for traffic prediction. IEEE Trans. Intell. Transp. Syst. 2020, 23, 1456–1466. [Google Scholar] [CrossRef]
- Wang, S.H.; Govindaraj, V.V.; Górriz, J.M.; Zhang, X.; Zhang, Y.D. COVID-19 classification by FGCNet with deep feature fusion from graph convolutional network and convolutional neural network. Inf. Fusion 2021, 67, 208–229. [Google Scholar] [CrossRef]
- Zhang, Q.; Zhou, J.; Zhang, B. Graph based multichannel feature fusion for wrist pulse diagnosis. IEEE J. Biomed. Health Inform. 2020, 25, 3732–3743. [Google Scholar] [CrossRef]
- Song, X.; Zhou, F.; Frangi, A.F.; Cao, J.; Xiao, X.; Lei, Y.; Wang, T.; Lei, B. Multi-center and multi-channel pooling GCN for early AD diagnosis based on dual-modality fused brain network. IEEE Trans. Med. Imaging 2022, 42, 354–367. [Google Scholar] [CrossRef]
- Gardner, M.W.; Dorling, S. Artificial neural networks (the multilayer perceptron)—A review of applications in the atmospheric sciences. Atmos. Environ. 1998, 32, 2627–2636. [Google Scholar] [CrossRef]
- Ba, J.L.; Kiros, J.R.; Hinton, G.E. Layer normalization. arXiv 2016, arXiv:1607.06450. [Google Scholar]
- Loshchilov, I.; Hutter, F. Decoupled Weight Decay Regularization. arXiv 2017, arXiv:1711.05101. [Google Scholar]
- Li, J.; Li, D.; Xiong, C.; Hoi, S. Blip: Bootstrapping language-image pre-training for unified vision-language understanding and generation. In Proceedings of the International Conference on Machine Learning, Baltimore, MA, USA, 1–23 July 2022; pp. 12888–12900. [Google Scholar]
- Li, J.; Selvaraju, R.; Gotmare, A.; Joty, S.; Xiong, C.; Hoi, S.C.H. Align before fuse: Vision and language representation learning with momentum distillation. Adv. Neural Inf. Process. Syst. 2021, 34, 9694–9705. [Google Scholar]
- Chattopadhay, A.; Sarkar, A.; Howlader, P.; Balasubramanian, V.N. Grad-cam++: Generalized gradient-based visual explanations for deep convolutional networks. In Proceedings of the 2018 IEEE Winter Conference on Applications of Computer Vision (WACV), Lake Tahoe, NV, USA, 12–15 March 2018; pp. 839–847. [Google Scholar]


| Modality | Positive Samples | Negative Samples | Total Samples | ||||
|---|---|---|---|---|---|---|---|
| Train | Test | Valid | Train | Test | Valid | ||
| image | 25,303 | 5517 | 13,222 | 42,106 | 5365 | 11,536 | 103,049 |
| text | 98 | 20 | 50 | 168 | 20 | 50 | 489 |
| Total Positive Samples | Total Negative Samples | ||||||
| image | 44,042 | 59,007 | |||||
| text | 221 | 268 | |||||
| Data Type | Value Range | Relationship with PJI |
|---|---|---|
| C-reactive Protein (CRP) | [0,120] | Serology indicators related with PJI |
| Erythrocyte Sedimentation Rate (ESR) | [0,120] | |
| Lesion Site | 0 or 1 | Site of prosthetic join |
| Sex | 0 or 1 | Basic information about patient |
| Age | [0,100] | |
| Hypertension | 0 or 1 | Diseases history may related with PJI |
| Diabetes | 0 or 1 | |
| Rheumatoid Arthritis | 0 or 1 | |
| Anemia | 0 or 1 | |
| Osteoporosis | 0 or 1 | |
| Cerebral Infarction | 0 or 1 | |
| Hypoalbuminemia | 0 or 1 | |
| Hypothyroidism | 0 or 1 | |
| Liver Disease | 0 or 1 |
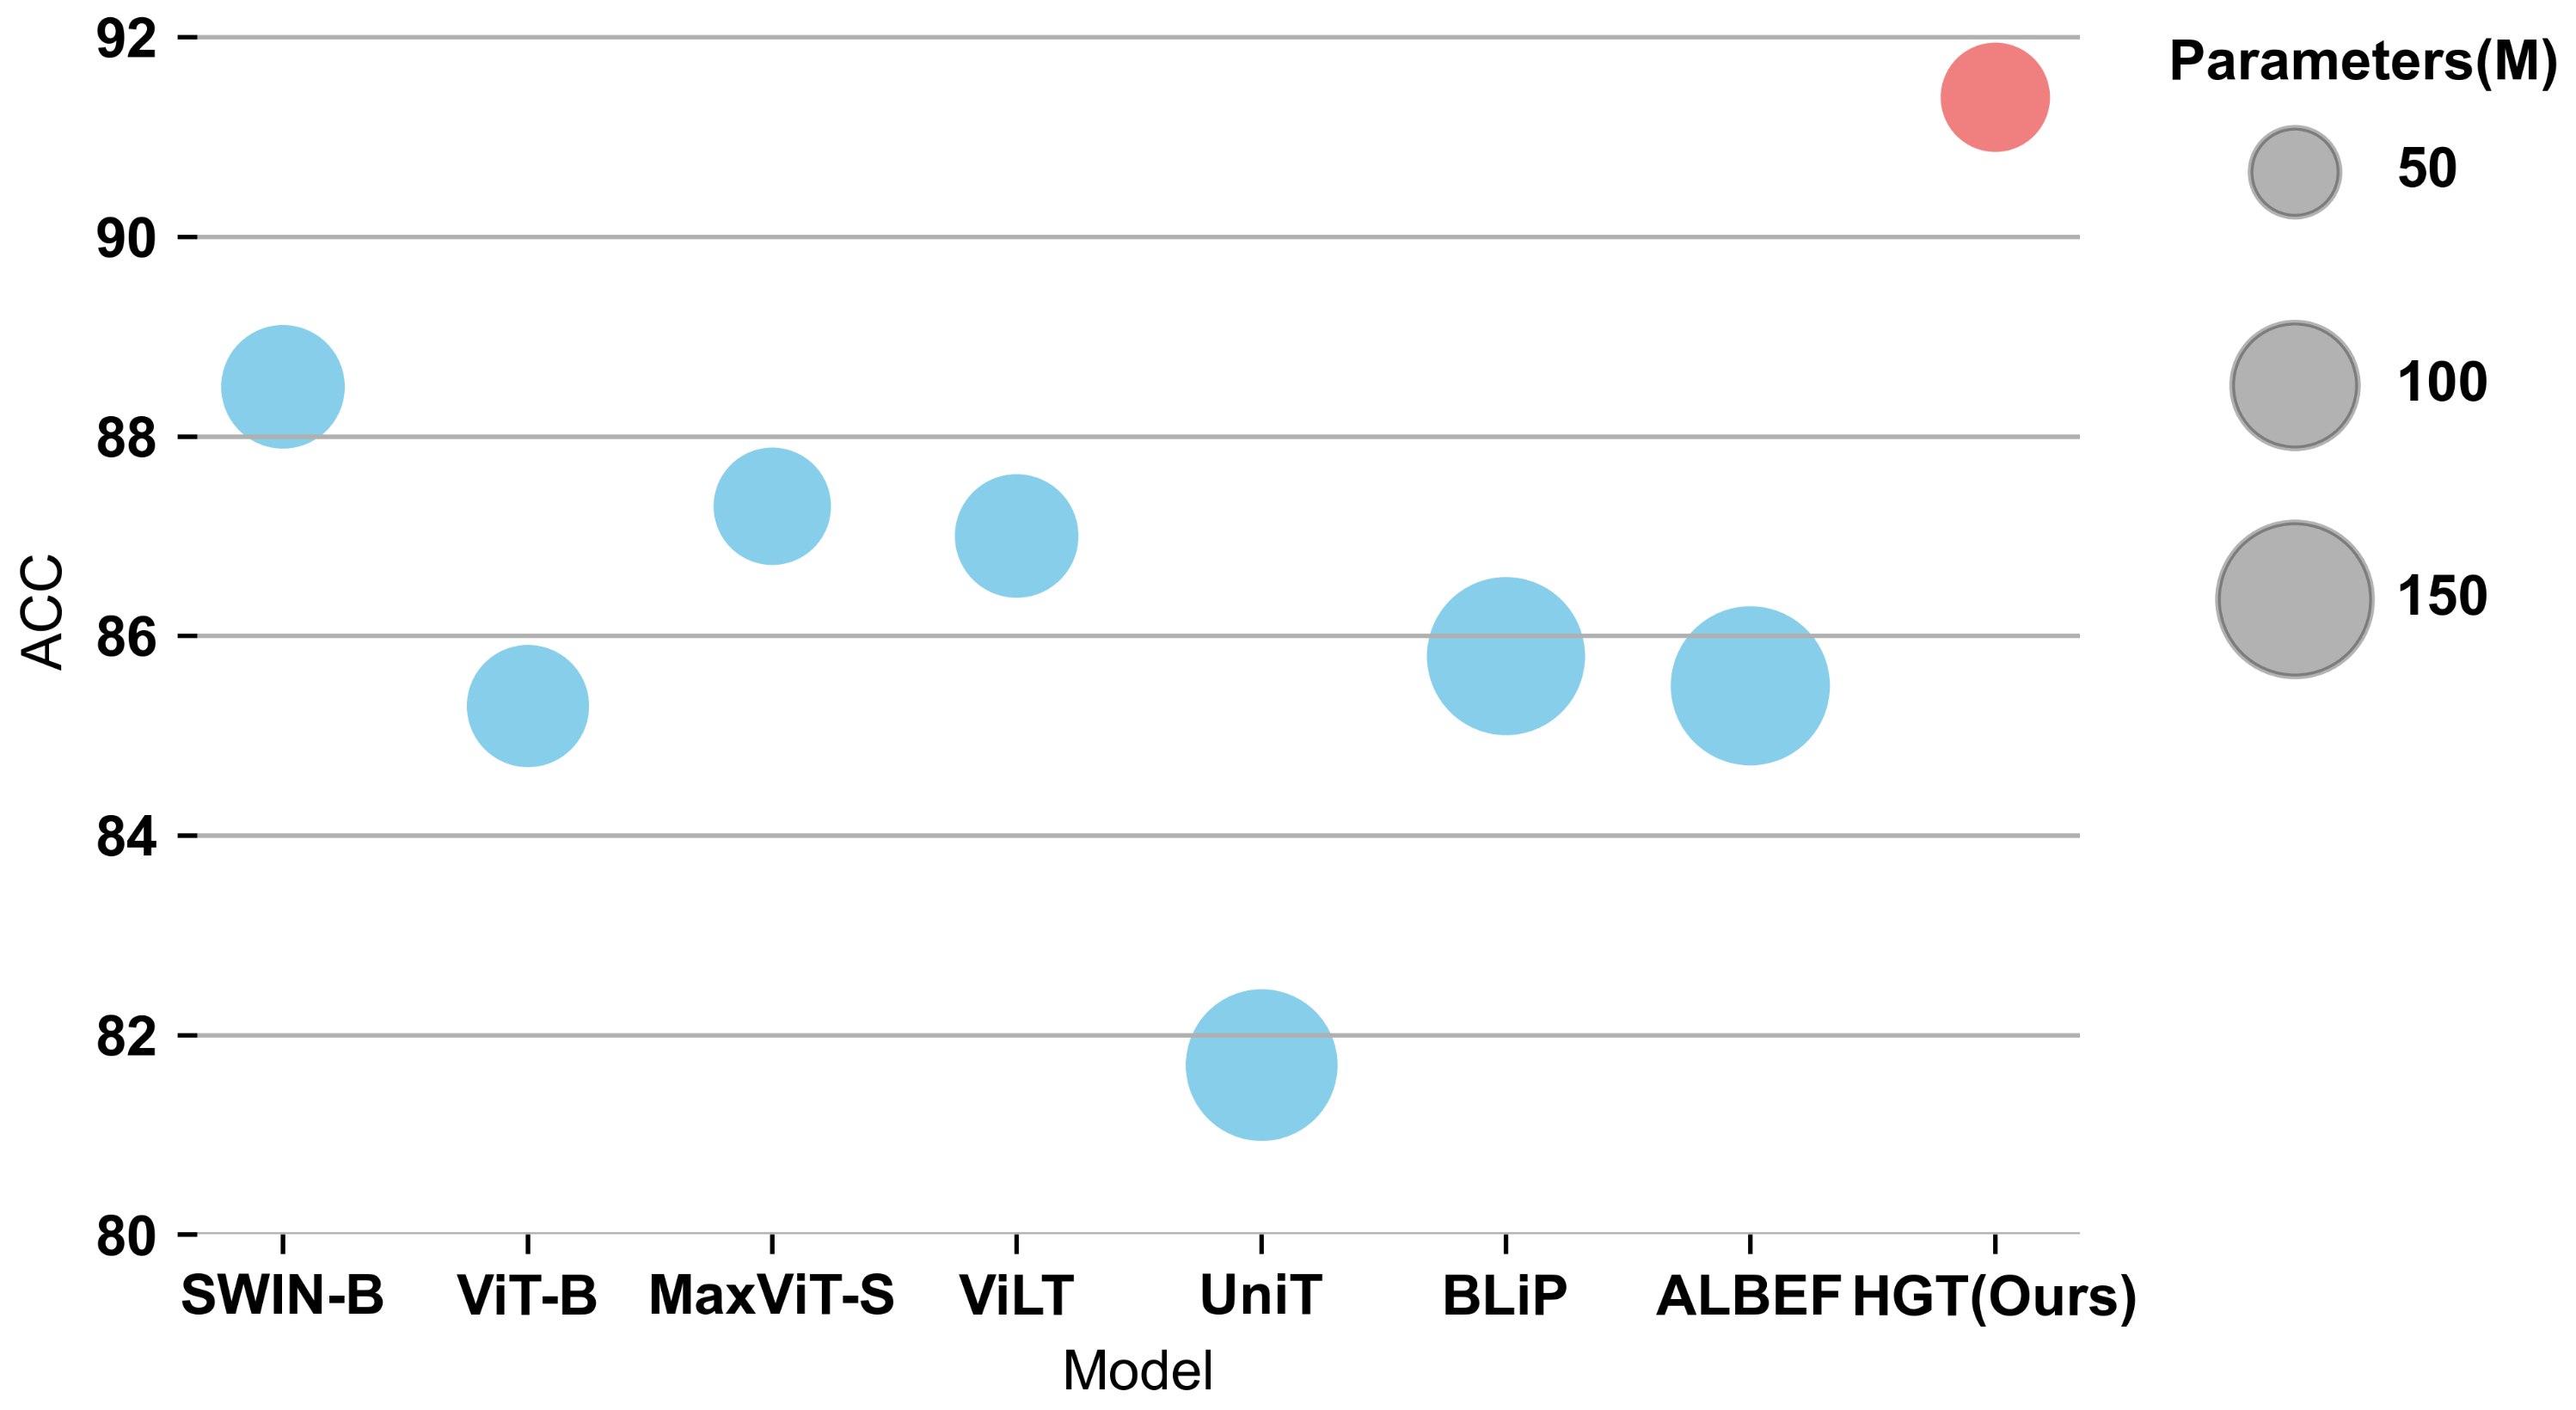
| Model | Eval Size | Multimodal Fusion | Parameters | Throughput (Image/s) | ACC | AUC |
|---|---|---|---|---|---|---|
| SWIN-B [22] | MLP | 88 M | 483 | 88.5 | 92.6 | |
| ViT-B [21] | 86 M | 630 | 85.3 | 91.5 | ||
| MaxViT-S [23] | 79 M | 428 | 87.3 | 93.7 | ||
| ViLT [6] | Merged-attn. | 88 M | 624 | 87.0 | 93.7 | |
| UniT [9] | Cross-attn. | 135 M | 556 | 81.7 | 91.2 | |
| BLiP [44] | 147 M | 549 | 85.8 | 93.1 | ||
| ALBEF [45] | 149 M | 547 | 85.5 | 93.2 | ||
| HGT | USA+GCN | 68 M | 552 | 91.4 | 95.9 |
| Feature Fusion Method | ACC | AUC |
|---|---|---|
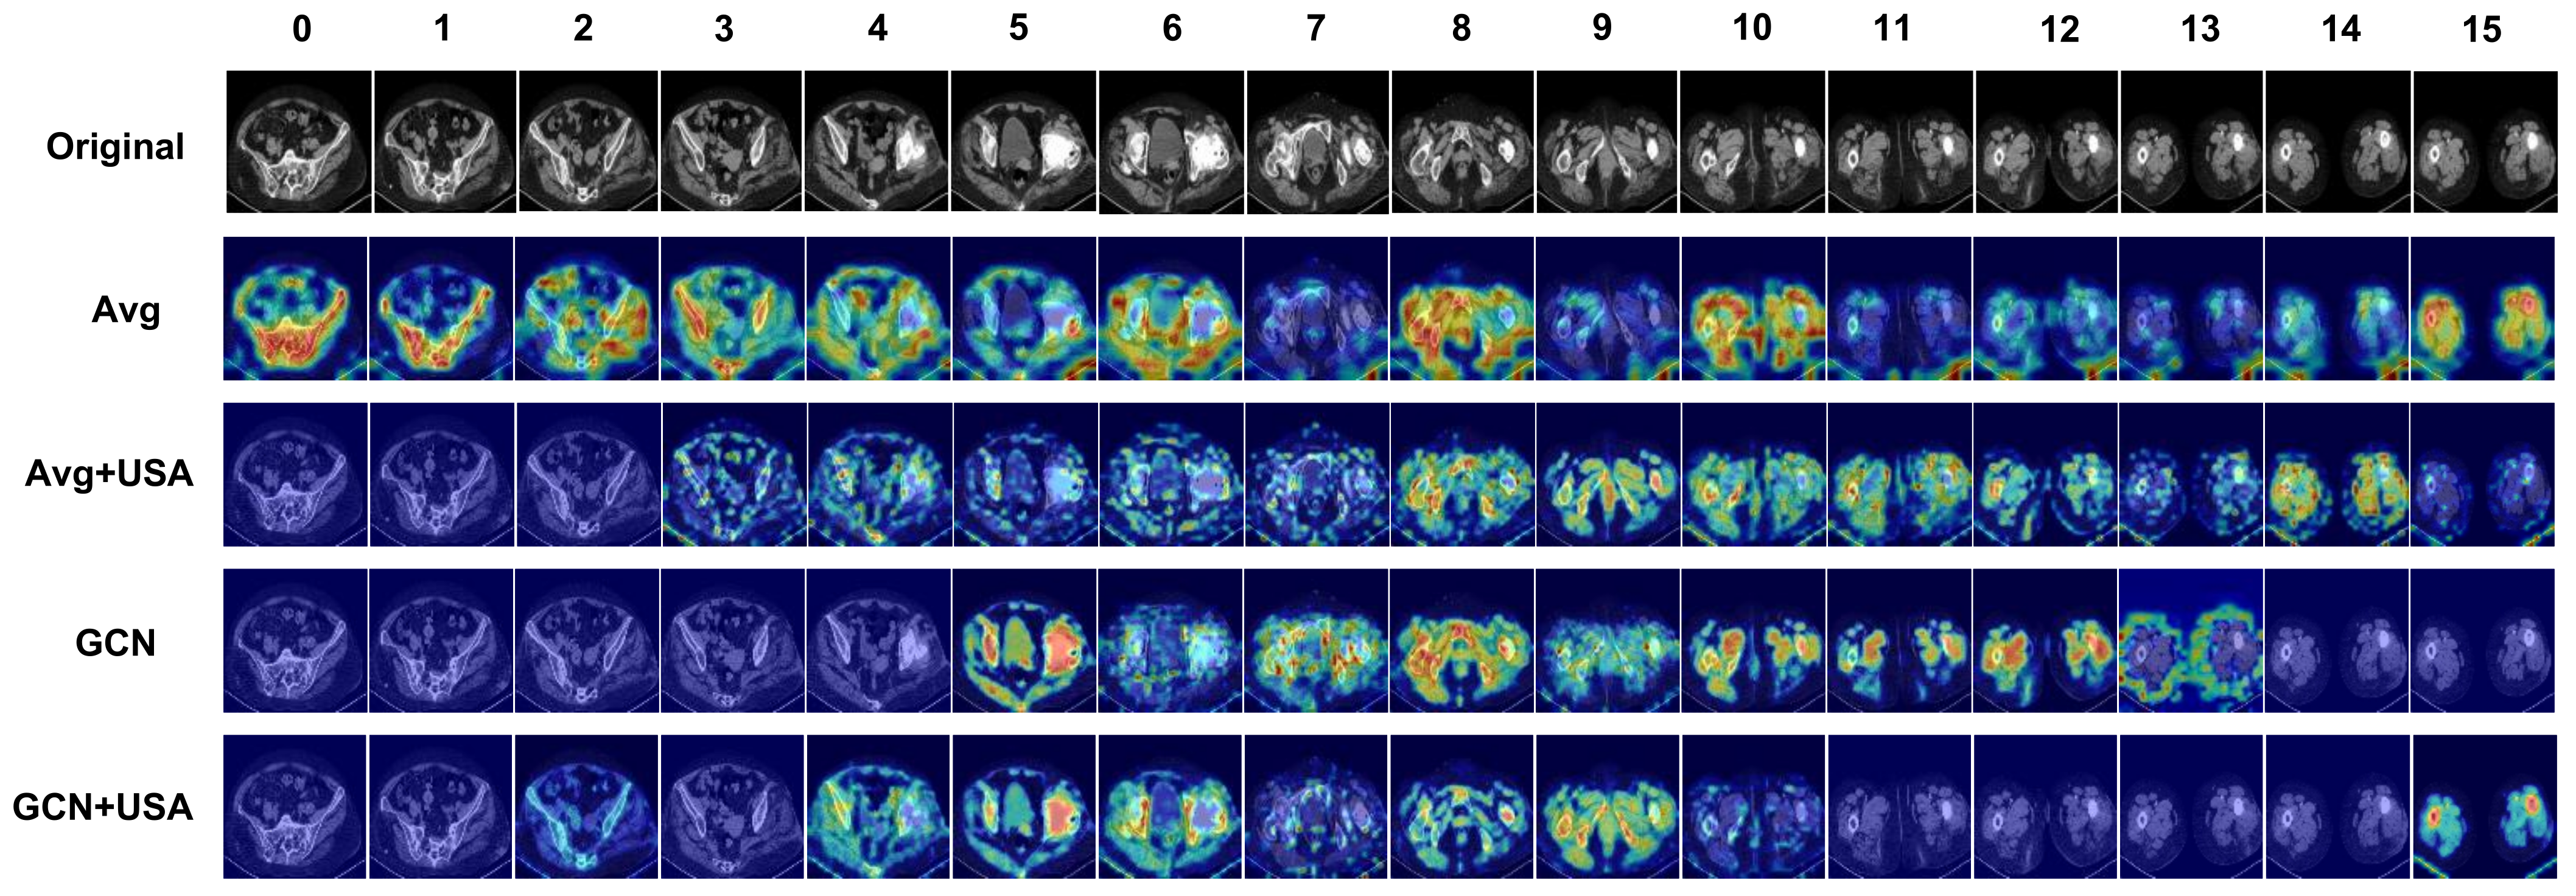
| Avg | 87.9 | 90.3 |
| GCN | 90.3 | 93.9 |
| USA+Avg | 90.0 | 92.9 |
| USA+GCN | 91.4 | 95.9 |
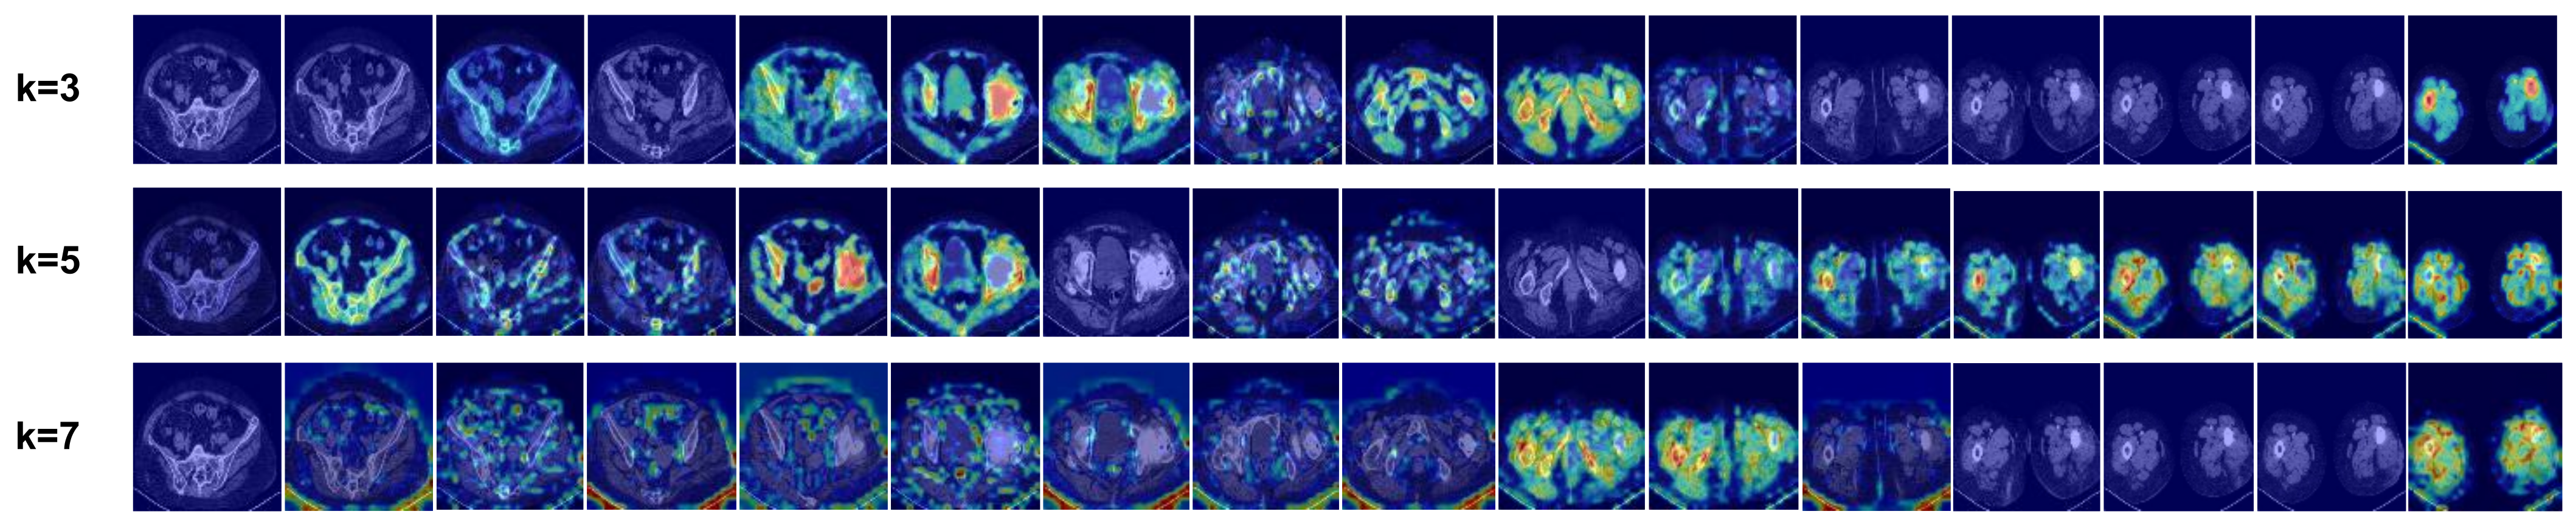
| k | Feature Fusion Method | ACC | AUC |
|---|---|---|---|
| 2 | USA + GCN | 91.4 | 95.9 |
| 4 | USA + GCN | 90.6 | 94.1 |
| 6 | USA + GCN | 89.4 | 92.4 |
| Sample Strategy | Uniform Random Sampling (Ours) | Equally Spaced Random Sampling (ESRS) | Equally Spaced Sampling (ESS) | Random Sampling (RS) |
|---|---|---|---|---|
| ACC | 91.4 | 90.9 | 88.5 | 89.4 |
| AUC | 95.9 | 92.8 | 92.3 | 93.4 |
| Method Type | Text Only | Image Only | ||
|---|---|---|---|---|
| Methods | UGT (Text) | MLP | UGT (Image) | SwinS |
| ACC | 87.0 | 87.3 | 83.5 | 81.1 |
| AUC | 92.6 | 93.5 | 88.2 | 85.9 |
Disclaimer/Publisher’s Note: The statements, opinions and data contained in all publications are solely those of the individual author(s) and contributor(s) and not of MDPI and/or the editor(s). MDPI and/or the editor(s) disclaim responsibility for any injury to people or property resulting from any ideas, methods, instructions or products referred to in the content. |
© 2023 by the authors. Licensee MDPI, Basel, Switzerland. This article is an open access article distributed under the terms and conditions of the Creative Commons Attribution (CC BY) license (https://creativecommons.org/licenses/by/4.0/).
Share and Cite
Li, R.; Yang, F.; Liu, X.; Shi, H. HGT: A Hierarchical GCN-Based Transformer for Multimodal Periprosthetic Joint Infection Diagnosis Using Computed Tomography Images and Text. Sensors 2023, 23, 5795. https://doi.org/10.3390/s23135795
Li R, Yang F, Liu X, Shi H. HGT: A Hierarchical GCN-Based Transformer for Multimodal Periprosthetic Joint Infection Diagnosis Using Computed Tomography Images and Text. Sensors. 2023; 23(13):5795. https://doi.org/10.3390/s23135795
Chicago/Turabian StyleLi, Ruiyang, Fujun Yang, Xianjie Liu, and Hongwei Shi. 2023. "HGT: A Hierarchical GCN-Based Transformer for Multimodal Periprosthetic Joint Infection Diagnosis Using Computed Tomography Images and Text" Sensors 23, no. 13: 5795. https://doi.org/10.3390/s23135795
APA StyleLi, R., Yang, F., Liu, X., & Shi, H. (2023). HGT: A Hierarchical GCN-Based Transformer for Multimodal Periprosthetic Joint Infection Diagnosis Using Computed Tomography Images and Text. Sensors, 23(13), 5795. https://doi.org/10.3390/s23135795