Review

IoT Sensor Challenges for Geothermal Energy Installations Monitoring: A Survey

by
Michal Prauzek
1,*,
Tereza Kucova
1,
Jaromir Konecny
1,
Monika Adamikova
1,
Karolina Gaiova
1,
Miroslav Mikus
1,
Pavel Pospisil
2,
Darius Andriukaitis
3,
Mindaugas Zilys
3,
Birgitta Martinkauppi
4 and
Jiri Koziorek
1
1
Department of Cybernetics and Biomedical Engineering, VSB—Technical University of Ostrava, 708 00 Ostrava, Czech Republic
2
Department of Geotechnics and Underground Engineering, VSB—Technical University of Ostrava, 708 00 Ostrava, Czech Republic
3
Department of Electronics Engineering, Kaunas University of Technology, 44249 Kaunas, Lithuania
4
School of Technology and Innovations, University of Vaasa, 65200 Vaasa, Finland
*
Author to whom correspondence should be addressed.
Sensors 2023, 23(12), 5577; https://doi.org/10.3390/s23125577
Submission received: 17 April 2023 / Revised: 25 May 2023 / Accepted: 7 June 2023 / Published: 14 June 2023
(This article belongs to the Special Issue Energy Harvesting in Environmental Wireless Sensor Networks)

Abstract

:
Geothermal energy installations are becoming increasingly common in new city developments and renovations. With a broad range of technological applications and improvements in this field, the demand for suitable monitoring technologies and control processes for geothermal energy installations is also growing. This article identifies opportunities for the future development and deployment of IoT sensors applied to geothermal energy installations. The first part of the survey describes the technologies and applications of various sensor types. Sensors that monitor temperature, flow rate and other mechanical parameters are presented with a technological background and their potential applications. The second part of the article surveys Internet-of-Things (IoT), communication technology and cloud solutions applicable to geothermal energy monitoring, with a focus on IoT node designs, data transmission technologies and cloud services. Energy harvesting technologies and edge computing methods are also reviewed. The survey concludes with a discussion of research challenges and an outline of new areas of application for monitoring geothermal installations and innovating technologies to produce IoT sensor solutions.

1. Introduction

Geothermal energy is characterized by two types, one with high enthalpy and the other with low enthalpy. High-enthalpy energy is found in specific regions and rock masses that contain high temperatures and high heat potential, especially volcanic areas and deep faults. High-enthalpy energy is used for power and heat generation, while low-enthalpy energy is used only for heat generation and can be found in most shallow rock mass zones around the world. Underground geothermal structures have been used for various applications, for example, electricity production or district heating. Heat pumps for geothermal applications and geothermal plants produce both electricity and hot water for district heating. To provide the data required for the proper functioning and control of systems, it is necessary to monitor various parameters within specific volumes of rock [1]. Monitoring the conditions of the rock environment provides the information required to manage and control processes to prolong the lifetimes of systems and avoid outages in operating underground geothermal structures [2]. To control a geothermal system, the key monitoring parameters are the fluid temperature, ambient rock environment temperature, volumetric flow rate, and physical characteristics of underground structures; minor monitoring parameters include scale formation [3] and slope movement [4]. Monitoring the specific characteristics and behaviors of underground structures assists in detecting problems and failures that prevent optimal system operation and energy management. The monitoring focus for an underground geothermal structure is dependent on the geothermal application area, examples of which include heat pumps [5], mines or wells [6], pipelines [7], reservoirs [8] and borehole exchangers [9].
Monitoring aims to determine or continuously update the status of key parameters necessary for the proper operation of an underground geothermal structure. To monitor these parameters, devices such as those connected to the Internet of Things (IoT) can be used. These devices must be able to monitor several variables and wirelessly transmit measured values to the cloud [10].
IoT technology is widely used and can also be applied to many areas of monitoring underground geothermal structures. This type of technology is especially useful in locations where wireless communications are required. These areas are generally difficult or impossible to connect to a power grid, and therefore, alternative power sources such as batteries or energy harvesting methods are necessary [11]. In this case, monitoring devices must consume low amounts of energy, and suitable technologies with powering constraints, for example, low-power wide-area network (LPWAN) technology, are therefore required. LPWAN technology was designed for reliable wireless data transmission with minimal power consumption. The commonly used LPWAN technologies include LoRaWAN, Sigfox and NB-IoT [12].
Table 1 lists recently published reviews of monitoring performed in specific underground geothermal structures. The listed studies examined a variety of systems that monitor different parameters, are deployed in specific types of geothermal structures and employ IoT technology. In Refs. [13,14,15], the authors discussed temperature monitoring and the temperature measurement methods, sensors and tools suitable for geothermal applications, such as vertical borehole heat exchangers, downholes and power plant devices. In Refs. [1,2], the authors discussed flow rate sensing techniques, providing comprehensive descriptions and comparisons of the two-phase flow monitoring methods applied in geothermal pipelines and geothermal wells. In addition to monitoring temperature and flow parameters, geothermal applications also use sensors to monitor mechanical parameters, such as scale formation [3] and slope movement [4]. In Ref. [4], the authors provided an overview of wireless sensor networks (WSNs) combined with IoT devices for monitoring slopes. The monitoring of other mechanical parameters has not yet been summarized in any recently published survey. The authors of [7,9] discussed the use of WSNs in underground coal mine monitoring systems and methods for monitoring leakage and sinkholes. The motivation for the current review is the lack of comprehensive studies on IoT applications for monitoring underground geothermal structures. To our best knowledge, no reviews have summarized the use of IoT technology in relation to monitoring geothermal parameters, such as temperature, pressure, flow rate and mechanical parameters.
The main contributions of this article are:
  • A comprehensive analysis of methods for monitoring specific parameters in underground geothermal structures and the currently available monitoring technologies and sensors;
  • A description of the state-of-the-art IoT technologies and sensors suitable for deployment in underground geothermal structures, including sensor node designs, energy harvesting methods, communication interfaces and cloud services;
  • Proposals for new, promising application areas and innovations in technology for monitoring underground geothermal structures.
The scheme of the article is illustrated in Figure 1. The article discusses sensing methods for detecting temperature, flow rate and other mechanical parameters in underground structures. Section 2 of the article provides a deeper analysis of the methods applied to monitor these parameters. Section 3 discusses IoT technology, data transmission and cloud services in relation to the systems deployed to monitor underground geothermal structures. Section 4 discusses research challenges. Section 5 summarizes and concludes the article.

2. Sensor Technologies

Sensors containing specific technologies are necessary for monitoring the subterranean environment of a geothermal structure. The ability to continuously monitor such structures at a reasonable cost is desirable in terms of improving efficiency and allowing the immediate detection of problems and faults [2]. This section examines the technologies for measuring temperature, flow rate and other mechanical parameters, such as pressure and slope movement, in these specific environments.

2.1. Temperature Measurement

Temperature monitoring technologies enable the study of geological processes and the investigation of subsurface thermal properties. Table 2 lists some of the temperature measurement technologies applied in complex systems. The principles of these specific temperature measurement technologies are further described in this subsection.
Depending on the installation method, temperature sensing technologies fall into two categories: static installations and mobile sensing. Static installation systems are fixed and permanently installed. These systems include optical fibres, distributed temperature sensing (DTS) technology, thermistors and thermocouples. Static installation sensors are used for temperature measurements in geothermal wells, downholes or borehole heat exchangers. Mobile sensing uses wireless technology and is not fixed or permanently installed. Mobile sensing systems are used, for example, to monitor the temperature of geothermal fluid in borehole heat exchangers.

2.1.1. Static Installations

Static installations deploy thermistors, thermocouples, fibre optic thermometers or DTS technology. Thermistors are sensors capable of measuring high-quality temperature–depth information from boreholes up to 100 m or more below the Earth’s surface [19]. Thermocouples are installed to measure temperatures at the inlets and outlets of geothermal heat exchangers [20]. Wired optical sensors provide continuous measurements with high-resolution temperature profiles along pipelines [18] and are often attached to the outer surface of the pipe wall or located within the underground structure itself [21].
DTS technology is used for temperature measurements along various types of underground geothermal structures. Measurements are based on detecting light from Rayleigh, Raman or Brillouin backscattering phenomena [15]. DTS technology measures temperatures using optical fibres that provide a continuous temperature distribution profile of the entire cable [22]. This method is able to achieve highly accurate temperature measurements over long distances, up to 30 km. This technology is very sensitive for monitoring temperature, as it is characterized by a spatial resolution of 1 m at an accuracy of ± 1 C and a resolution of 0.01 C [23]. This technology works by detecting thermal changes along the optical fibre that manifest as molecular or lattice vibrations in the material. In addition, thermal changes cause local changes in the refractive index. Changes in the refractive index are then manifested as the inelastic scattering of transmitted light. Molecular vibrations at high frequencies around 10 THz cause Raman scattering. Brillouin scattering is caused by low-frequency vibrations in the range of 10 to 30 GHz. This scattering can then be used to measure the temperature along the fibre [24].
DTS technology is widely applied to inspect subsurface thermal properties. DTS can be used in various applications, such as investigating the hydro-geological conditions of downholes or determining the geological properties of aquifers. Especially in deep boreholes, its application provides notable benefits over discrete-point temperature measurements [5]. DTS is widely used in long-term monitoring to determine the contribution of groundwater flow and thermophysical characteristics to subsurface heat transfer and storage [16]. This type of technology is used to monitor the conditions inside well bores to optimize expensive workover procedures [17].

2.1.2. Mobile Sensing

Mobile sensing systems such as Geoball and Geosniff are small spheres 25 mm in diameter and 8 g in weight that have an embedded transceiver, microcontroller, temperature sensor and power supply. These miniaturized sensors are inserted into the pipes of a geothermal underground structure and are then carried by the thermal fluid in order to monitor the thermal parameters of the fluid along the borehole heat exchanger. These sensor systems allow the acquisition of information on the thermal properties of the subsurface geological structure and their influence on the thermal properties of the borehole. A wireless data processing unit sends data and acquires configurational information prior to measurement and retrieves measured thermal data from a sensor inside the U-tube of the borehole heat exchanger [18].
These types of sensors have demonstrable advantages of higher reliability and lower cost over standard sensors and fibre optics [13]. Fibre optic technologies such as high-temperature distributed acoustic sensors [25] are used for their unparalleled ability to discriminate and measure environmental variables such as strain, temperature and vibrations [26]. The purpose of the method is to improve the conventional thermal response test [18]. Compared to Pt100 sensors, mobile sensing systems are highly accurate and do not produce large, statistically significant measurement deviations [13].

2.2. Flow Rate Measurement

The measurement of liquid and gaseous flow rates in underground geothermal structures is performed to manage and control various processes [1]. Flow rate measurement in geothermal structures applies techniques that differ in complexity, cost and the capability to perform real-time surveys. Table 3 summarizes the differences between individual methods of flow rate measurement on the basis of four attributes: the ability to provide real-time measurements (real-time), the operational status of the underground structure (out of operation), direct contact between the medium and the sensing device (direct contact) and a list of the types of underground structures where the flow rate measurement method is used (application location).
In summary, each method, except for the calorimeter and tracer dilution, provides real-time measurements. The calorimeter and lip pressure are the only two methods used in decommissioned underground structures. Each method, except for compression load cells and the ultrasonic meter, has direct contact with the sensing medium. The application location includes geothermal power plants, open Venturi channels, geothermal pipelines and geothermal wells.
Flow rate measurement can apply single flow rate methods or hybrid flow rate methods. Hybrid methods combine two basic methods to reduce any deficiencies that single methods may introduce. Hybrid techniques are frequently used to measure two-phase fluid flow. The following subsections describe the individual methods listed in Table 3 for flow rate measurement and estimation.

2.2.1. Ultrasonic Meter

Ultrasonic meters are devices that are composed of a receiver and transmitter and that use the phenomenon of sonic waves. The device is attached to the exterior of a pipeline and used to determine the flow rate. The transmitted waves are detected by the receiver. The modification of the wave frequency and amplitude is indicative of the properties of the fluid/gas. There exist several methods that can be used to calculate the final flow rate, for example, based on the time of transit of the sonic waves [36], the Doppler Effect [37], cross-correlation [37] or changes in wave amplitude [38]. Ultrasonic sensors are used in many areas of industry. In underground structures, at least three sensors are used at different points [28], for example, at different locations along a channel [27]. The advantage of an ultrasonic meter is that it does not come into contact with the fluid/gas medium and is positioned on the outside of the pipeline [27].

2.2.2. Calorimeter

Figure 2 depicts a typical calorimeter configuration that is used to measure enthalpy in geothermal wells in addition to the flow rate. This method works on the principle of measuring the time that it takes to fill a partially water-filled tank with geothermal fluid. The time is then used to calculate the flow rate [2].
The disadvantage of this technique is that it requires the geothermal well to halt production [1]. Another disadvantage is that it is only suitable for low-output wells, as the amount of discharge is restricted by the volume of the tank that can be delivered to the site. Another constraint is the limit on the maximum measurable flow rate of 10 kg/s [39]. Measuring the flow rate in this manner is also very noisy and cannot be performed in real time [40].

2.2.3. Sharp-Edged Orifice Plate

An orifice plate is a well-known alternative method that has been implemented in several geothermal applications all over the world [1]. The orifice plate consists of a central circular hole that measures differential pressure by establishing pressure taps upstream and downstream. Figure 3 [2] illustrates a typical orifice plate setup.
Orifice plates are frequently used to measure the flow of geothermal steam; extracting steam from the ground is the first crucial step in converting geothermal steam energy into electricity [41]. The devices also measure brine flow [2] and can identify the mass flow rate of the well [42].

2.2.4. Tracer Dilution Method

Tracer dilution is used to measure the enthalpy of geothermal fluid in addition to the flow rate. To determine the well performance, two different chemical tracers are injected into the fluid stream in the pipe and mixed with water. Fluid tracers disperse into a liquid phase; gas tracers mainly disperse into a gaseous phase, but also partially into a liquid phase. Samples of vapor and water are then collected from the pipeline and tested to identify the dilution of the tracer in both phases and the background concentration. From this information, the flow rate and enthalpy can be estimated [1]. The advantages of this method are the ability to keep the well online during measurement and the lack of an effect on the flow; they are outweighed, however, by the large costs for lab testing [1], the poor precision of the results [2] and the lack of real-time measurement capability [43].

2.2.5. Lip Pressure Method

This method entails the use of a small hole measuring 6 mm in diameter and located 6 mm away from the pipe lip. Empirical measurements of pressure are taken at this hole, and using the size of the pipe, an empirical correlation is used to calculate the flow rate. Enthalpy and the total flow can be determined based on information obtained from the flow rate and lip pressure [32]. Two arrangements are available for this method, one in which fluid is discharged into the atmosphere through a vertical lip pressure pipe and another in which it is discharged horizontally into a silencer on a horizontal lip pressure pipe. In the vertical arrangement, the pipe is connected to the top valve in a vertical position, and the fluid’s enthalpy must be estimated based on the temperature of the primary supply zone [1]. In the horizontal arrangement, the pipe discharges into the silencer, and the weir box located immediately downstream of the silencer monitors the water flow. The method’s advantages include low running costs and real-time measurements, but it also has drawbacks, such as high noise levels and interruptions in operations during measurement [44].

2.2.6. Venturi Tube

The Venturi tube method is based on Bernoulli’s principle and is a very precise method used for measuring steam flow [34]. The method can be used for online or real-time measurement, and its main advantage is a low and constant pressure drop. Its construction is complicated and expensive, however [2,45].

2.2.7. Coriolis Flow Meter

A Coriolis flow meter consists of two curved tubes that vibrate symmetrically. The flow of the medium is directed through these pipes, and any local changes in the vibration frequency due to the flow rate are monitored. To calculate the flow rate, changes in the frequency are measured by sensors, and empirical correlations are applied. Although this method enables real-time and online measurement, it is highly inaccurate and therefore an unpopular option [2,46].

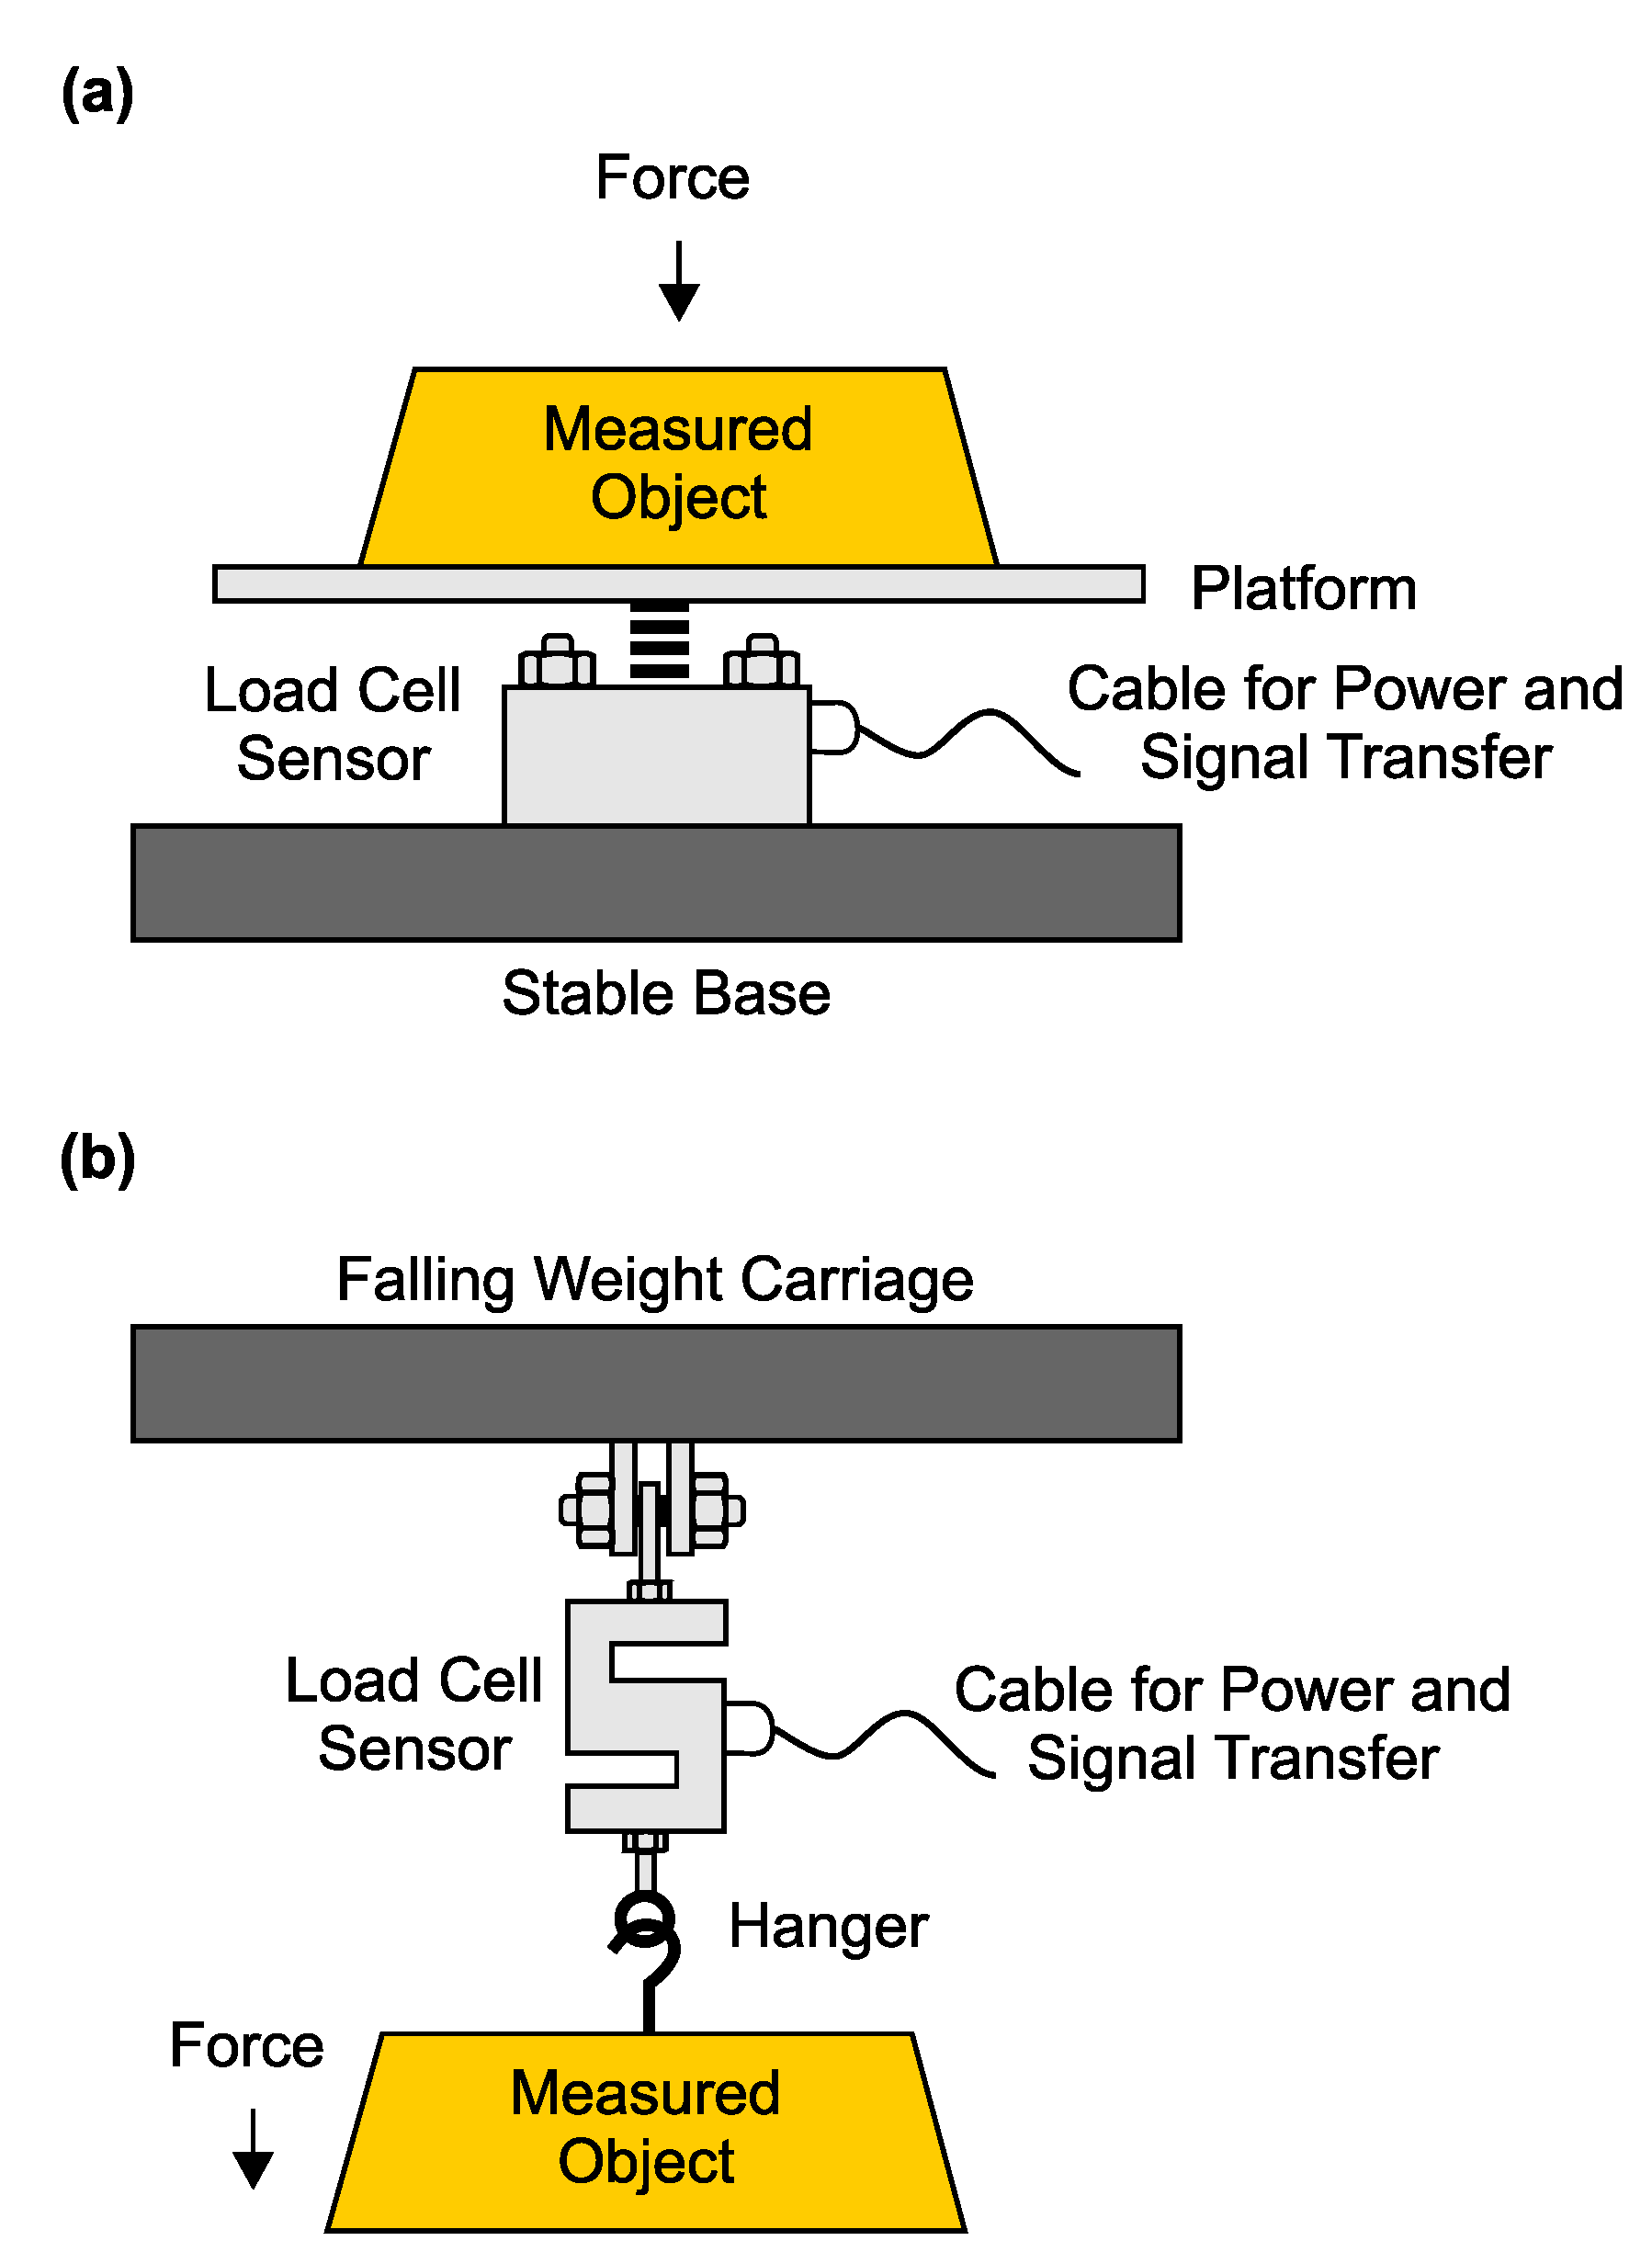
2.2.8. Compression Load Cells

Compression load cells use strain gauge sensors to determine the flow rate and enthalpy in geothermal pipelines and wells. The sensor is based on the piezoelectric effect, which is based on converting the mechanical power applied by the object (pipeline, well) to an electrostatic signal. The load sensor is positioned above a platform (compression type, Figure 4a) or above the object (tension type, Figure 4b) [35,47].
The advantages of this method are simple construction, measurement in real time and the lack of direct contact with the fluid medium [35,47].

2.2.9. Separator with Orifice Plate and Silencer

This hybrid method determines the flow of a two-phase fluid and consists of a separator, an orifice plate and a silencer with a weir. The fluid separates into vapor and a liquid in a separator vessel at a pressure greater than atmospheric. The separate steam flow is measured with an orifice plate, while the separate liquid flow is determined with either an orifice plate or a silencer with a weir box. Because orifice plates may produce unstable measurements due to flash evaporation induced in the liquid, silencers are more commonly used for measuring the separate liquid flow. The separator method is expensive to implement, but it enables high accuracy and online or real-time measurement [1,2].

2.3. Measurement of Mechanical Parameters

In addition to measuring temperature and flow, monitoring mechanical parameters in underground structures is important for detecting potential risks. Underground structures such as borehole heat exchangers must be regularly checked for pressure to ensure that no fluid leaks into the subsurface, groundwater or process water. Geothermal applications also use sensors to monitor other mechanical parameters, such as scale formation [3] and slope movement [4]. Mechanical parameters can be monitored with fibre-optic sensors [48], tilt sensors [4], ultrasonic sensors [49], vibrating wire sensors [50] or strain gauges [51]. Table 4 summarizes these sensing methods and their areas of application.
Pressure is measured with strain gauges or optical sensors, usually in geothermal wells or reservoirs. Optical sensors are also used to detect the formation of scale in geothermal brine. In boreholes, ultrasonic sensors are deployed to detect breakouts, and tilt sensors measure information about slope movement and deformation. Vibrating wire sensors are used to measure stress in structures at geothermal or oil drilling wells.

2.3.1. Optical Sensors

Fibre-optic cables are used to measure pressure in geothermal wells [48]. Distributed acoustic sensing systems use fibre-optic cables to measure oscillatory strain rates caused by oscillatory pressure changes. These cables have significant advantages in being able to withstand harsh environments; they can be deployed for geomechanical, seismic and temperature monitoring [53]. Fibre-optic cables are capable of operating at temperatures up to 315 C and 20 MPa [51].

2.3.2. Vibrating Wire Sensors

Vibrating wire sensors can measure the stresses occurring in a structure and its surrounding environment. It is a frequency sensor with an internal metal string as the sensing component. The sensor’s output frequency signal changes according to the the stress on the metal string. The device is durable and simple in design and has a strong anti-interference ability [50]. The metal string vibrates as a result of excitation when an external force is applied, changing the tension in the wire, which changes the frequency of vibrations. The dependence between the vibration conductor and the vibration frequency is calculated from the equation:
f = 1 2 L F m ,
where m is the mass of the vibrating string, L is the length of the vibrating string, F indicates the pressure on the sensor, and f is the resonant frequency of the string [54]. These sensors are suitable for applications in geothermal or oil drilling wells [52].

2.3.3. Tilt Sensors

These sensors are used to obtain information about slope movements and deformations. Tilt monitoring systems combine tilt sensors and LPWAN technology to measure slope movement and transmit collected data wirelessly. Data from tilt sensors and other additional parameters (rainfall data, groundwater level) are analyzed to predict slope failures [55].

3. IoT Devices and Cloud Processing
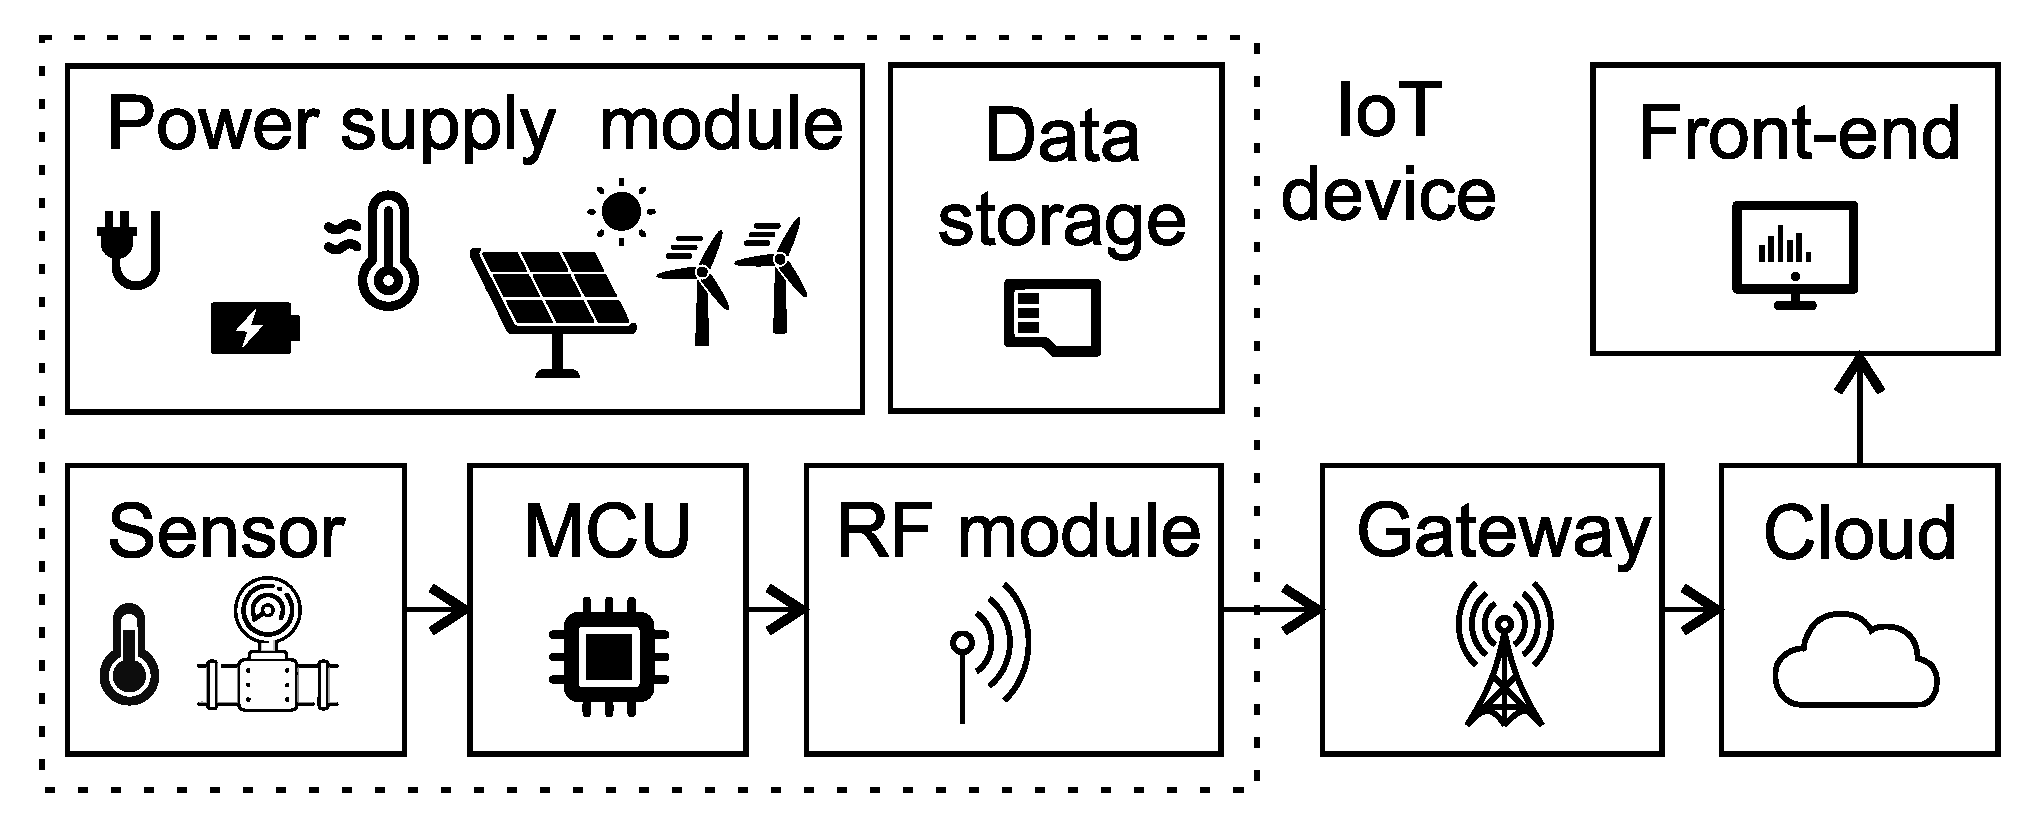
IoT technology is a growing research area. In 2021, the Web of ScienceTM library contained more than 13,000 indexed papers on the topic of IoT technology [56]. IoT technologies are deployed in many application areas, such as environmental monitoring [10], smart factories [57,58], smart cities [59] and smart grids [11,60]. Although IoT technology is widely deployed, only a few research articles cover the monitoring of geothermal energy installations.
Fundamentally, an IoT device is an internet connection. In the context of this article, an IoT device is a small item of electronic equipment that is able to supervise several variables and transmit measured values to the cloud via a wireless connection. Figure 5 illustrates the principal scheme of the IoT architecture and application areas.
Figure 6 shows a block diagram of a typical IoT solution. IoT devices generally contain the following parts: a power supply module, a sensory subsystem, a microcontroller (MCU), a transmission module (RF module) and data storage. Each block can be assembled from various components according to system requirements and deployment characteristics.

3.1. IoT Nodes

An integral component of an IoT device is a power supply. To supply the device with power, many options are available, the simplest being a connection to a power grid; an example is an AC power monitoring module with an integrated wireless connection via WiFi [61]. Power grids provide sources of stable and reliable energy, but they are mainly only available in urban locations. Another option is the use of a battery [62]. Batteries also provide stable sources of energy, but they require periodic charging and replacement. Battery-powered IoT devices can also be designed to operate for long life spans [10]. Another option for supplying electricity is through energy harvesting methods [63]. Characterized by many advantages, energy harvesting modules are small, maintenance-free and inexpensive solutions, especially compared to battery-powered options. The main drawback of energy harvesting solutions, however, is limited available energy.
Table 5 summarizes IoT power supply technologies according to the energy transducer type. Selecting a suitable power supply type is strongly dependent on the target application [64]. In many geothermal applications [65], power grids are readily available, and generally, no energy harvesting or battery technologies are required. However, IoT measurement devices are often deployed directly in geothermal boreholes, where the installation of a wired power supply is complicated [66]. Energy harvesting is therefore a highly suitable technology for these applications.
Energy harvesting using solar panels or small wind turbines is suitable only for surface deployment, where sunlight and wind are sufficient [72]. For underground structures, thermoelectric generators (TEGs) have significant potential as an energy harvesting technology. TEGs exploit the Seebeck effect to generate energy through temperature differentials [73]. The main challenge with this technology is finding suitable temperature differences or gradients directly in a borehole for exposure to the TEG.
Acting as brains, microcontrollers (MCUs) regulate IoT node behavior, such as sensor data collection, local memory storage and data transmission to the cloud. Since IoT nodes generally have only limited energy for operation [74], MCUs are also responsible for energy management. Naturally, they are selected from ultra-low-power series offered by silicon manufacturers to minimize the MCU’s own consumption. Examples of these series types are STM32L [75], NXP K32L [76] and Microchip PIC32MZ [77]. Specific models are selected according to the application, and generally, higher performance requires more energy. ULP (ultra-low-power) MCUs typically offer multiple switchable modes of operation and the ability to switch off individual peripherals (clock gating) for effective power management. Switching off all components not currently in use thus reduces the overall energy consumption [78,79].
IoT nodes are usually equipped with local data storage, which can be used for either the long-term storage of accumulated values or short-term storage (as a memory buffer). As with other IoT node components, power consumption is one of the crucial parameters in selecting memory and is dependent on the type of memory used. Ferroelectric Random-Access Memory (FRAM) is a type of memory technology with low energy consumption, but its data capacity is limited to a few dozen MB. At the other end of the spectrum of data capacity is flash memory, commonly found in SD cards, with maximum capacities of hundreds of GB. The disadvantage of flash memory is higher energy consumption and significantly slower data write speeds. Data storage memory may form either a discrete component in an IoT node or be integrated into the MCU [80].

3.2. Data Transmission Technologies

Underground geothermal structures are often situated in remote areas where no easy connection to the internet for monitoring purposes is possible (i.e., WiFi or Ethernet). In these areas, monitoring equipment is usually powered by batteries or energy obtained by harvesting (see Section 3.1), and energy consumption must be low. GSM/LTE technology does not satisfy this low-power requirement, but LPWAN technology is ideal. These types of systems were developed for the IoT and feature reliable, long-distance wireless data transmission (1–40 km), with minimal power consumption. The commonly used LPWAN technologies are currently LoRa, Sigfox and NB-IoT [81,82].

3.2.1. LoRaWAN

LoRaWAN is a wireless communication protocol based on the patented LoRa technology. The patent was granted in 2014 to Semtec, and the first LoRaWAN protocol specification was released in 2015. The standards are now managed by the LoRa Alliance. Transceivers have a low sensitivity to noise and thus a greater range thanks to forward error correction (FEC), together with a proprietary spread spectrum modulation technique. The operating radio frequency varies according to the region of deployment and its local regulations, but it always belongs to a license-free band. A LoRaWAN network typically includes the following network elements. The end device is application-dependent, provides control or measurement functions (sensor, actuator) and is wirelessly connected to the LoRaWAN network via a gateway. The gateway receives and forwards messages (usually via the internet) to a network server. The network server provides network management functions such as data processing, message deduplication, configuration and scheduling, bandwidth regulation and message routing. The application server remotely collects data from sensors and transmits commands to device actuators [83,84].
The technology has a range of 5 km (urban) to 20 km (rural) [85]. Depending on the configuration, the payload can contain up to 242 bytes of data [86].
LoRa defines three device classes:
  • Class A—End devices can start transmission (uplink) at any time, while the base station transmits data only for a short time once the uplink is complete. Each uplink time slot is followed by two downlink slots, after which the receiver switches off. This class has the lowest energy demand.
  • Class B—Devices have the same uplink and downlink slots as Class A, plus one extra downlink slot. The end-device receiver is switched on for this extra slot according to a predetermined schedule. The base station is programmed to follow this schedule.
  • Class C—Receivers can listen continuously, except in transmit mode. This class of device is ideal for applications that require many downlink transmissions because the base station broadcasts at any time. Its disadvantage is higher power consumption [87].

3.2.2. Sigfox

Sigfox is a company based in France providing network connectivity within the IoT through its eponymous wireless technology. It was founded in 2010 with a focus on low-consumption IoT devices that require the transmission of small amounts of data over longer distances [87].
Sigfox can operate in either simplex (one-way) or half-duplex (two-way) mode. An upload packet can comprise a maximum of 12 bytes of payload, while a download packet is limited to 8 bytes of payload. The operational range of this network reaches up to 40 km [87,88]. Such a value is achieved by combining several techniques. The first of them is the use of ultra-narrowband (UNB); such a narrow frequency selection increases the signal-to-noise ratio (SNR). A combination of Gaussian Frequency-Shift Keying (GFSK) and Differential Binary Phase-Shift Keying (DBPSK) is used for signal modulation in the physical layer. Delivery reliability is increased by sending the same message multiple times. Duplicate messages are sent on randomly selected frequencies with random delays from the first one. Sigfox relies on a license-free band reserved for industrial, scientific and medical (ISM) purposes. The specific frequency then depends on the deployment region. In addition to the maximum transmission power, the regulation also sets a duty cycle limit. Because of this, the end device is limited to 140 messages per day in the case of sending and 4 messages in the case of receiving [88,89].

3.2.3. NB-IoT

Narrowband IoT is another LPWAN technology available today. It was developed by the 3GPP organization, with the first NB-IoT standard defined in 2016. This communication network is based on and is directly linked to the GSM/LTE cellular network standard. Modifications consist of changes in the original technology to best meet the requirements for IoT end-device network connectivity (such as low power consumption, low cost or the transmission of small amounts of data over longer distances). Compared to the LTE protocol, NB-IoT only allows half-duplex at a bandwidth of 180 kHz. Modulation schemes more complex than π / 4 –QPSK are not supported. Not all parts of the E-UTRA specification are implemented either. Thanks to this aspect, the receiver is simpler and therefore less energy-demanding and lower in price [90,91,92].
The standard allows transmission using both unlicensed bands and licensed GSM/LTE brands in one of the following operation modes:
  • Stand-alone operation—When using this mode, NB-IoT is the exclusive user of the selected frequency band.
  • Guard-band operation—In this mode, NB-IoT data are transmitted through an unused frequency band next to, or between, LTE bands (the so-called guard band).
  • In-band operation—LTE data together with NB-IoT data share the same carrier. This can have a negative impact on the quality of both services [90,93].
The existing LTE network provider often only needs to modify the software to operate the NB-IoT network if it decides to deploy the guard-band or in-band model. This approach is also recommended by the 3GPP organization itself. The usable distance of the IoT node from the base station is up to 10 km [85]. The payload of one message is limited to 1600 bytes. There is no limit on the number of messages transferred per day when using the licensed band. NB-IoT relies, like the LTE protocol, on orthogonal frequency division multiplexing (OFDM) to transmit downlink messages. In the case of uplink transactions, OFDM is replaced by single-carrier frequency division multiple access (SC-FDMA). This reduces the value of the peak-to-average power ratio (PAPR) [94].

3.2.4. Comparison of LPWANs

The information in Table 6 indicates that the individual technologies differ, although they are all specific to LPWANs. The key advantage of Sigfox over its competitors is the size of the area covered by a single base station, up to 40 km in rural areas. Under the same conditions, the main competitors achieve a coverage of approximately 20 km with LoRaWAN and 10 km with NB-IoT [95]. NB-IoT is also limited to areas with LTE networks. In terms of deployment, LoRaWAN allows the creation of private networks, while the other two technologies rely only on the provider deployment model [96]. NB-IoT is aligned with applications that require the transfer of large amounts of data or that need a low-latency network. Sigfox offers a payload volume approximately 100 times lower than NB-IoT (maximum 1600 B). LoRaWAN provides a payload of 242 B, and latency can be reduced using class C devices [86]. All of these technologies offer sleep modes to reduce the energy consumption of a transmitter to a minimum when the end device is not transmitting. NB-IoT nodes have higher power requirements than LoRaWAN and Sigfox, drawing the highest peak currents during transmission through the use of QPSK modulation in combination with OFDM-FDMA and QoS handling [85,97]. LoRaWAN and Sigfox are ALOHA-based and operate on unlicensed frequencies. NB-IoT relies on licensed LTE bands, which ensure higher QoS through regulation, but a consequence is a higher price for the end customer due to license fees [95].

3.3. Cloud Services

Cloud services involve infrastructure, platforms and software delivered on demand to companies and customers via the internet. Cloud services employ cloud computing solutions and do not encumber the hardware or software of devices accessing the service. The variety of available cloud services may disguise the level of an organization’s ownership of the stack [98]. For clarity, cloud service models can be grouped into four main categories according to how they are managed (Figure 7).
  • On Premises (Private Cloud)—This cloud model is in fact not a genuine cloud service. It is suitable for users who require data protection and security and are willing to pay more for the service. Because data and all infrastructure, including software and hardware, are on the premises, the system is managed by the user’s own IT team. In-house maintenance requirements and fixed scalability mean that this type of deployment is the most expensive.
  • Infrastructure as a Service (IaaS)—IaaS allows customers to outsource equipment such as storage, servers and network resources. The remainder of the stack is managed by the customer. The disadvantage of IaaS is the potential for vendor outages and the cost of training personnel to manage new infrastructure.
  • Platform as a Service (PaaS)—The provider manages everything as in IaaS but is also responsible for the base software and operating system, middleware and database. The drawback of PaaS is potential security problems and greater dependency on the vendor.
  • Software as a Service (SaaS)—This model completely transfers the management of all components to the vendor service provider [99,100].
Table 7 summarizes the features of three widely used cloud services: Amazon Web Services (AWS), Microsoft Azure IoT, Google Cloud Platform [101,102,103], and IBM cloud [104]. Generally, these state-of-the-art cloud providers dedicate broad support to services and applications designed for the IoT and standard communication interfaces for connecting IoT devices to a cloud. They also feature powerful scalable data storage and support for big data analysis.

3.4. Edge Computing

Edge computing is a method with enormous potential for IoT geothermal monitoring. Edge computing allows some computation and data storage to be moved closer to the source of the data, enabling the optimization of IoT node transmissions.
Geothermal installations make use of a specific IoT domain. Table 8 provides a summary of some service-oriented architectures for edge computing methods suitable for use in geothermal installations. Early warning systems can monitor a geothermal installation and evaluate hazardous states. An example of this type of solution is an early warning system for railway bridges [105]. Edge computing also allows the real-time monitoring of natural disasters such as fires [106] or earthquakes [107]. These solutions tolerate multiple node faults and partial network disruptions and store all data locally, which also enhances privacy [107].
Other types of edge computing methods manage data compression. Data compression performed locally significantly reduces the volume of data for transmission [109]. Data compression can be lossy or lossless. The scientific literature on data compression in edge computing is vast [110].

3.5. IoT in Geothermal Applications

IoT is chosen over telemetry in geothermal installations due to its ability to provide continuous monitoring and real-time data collection of temperature, pressure, and other mechanical parameters. IoT devices are equipped with sensors that can collect data from various points in the geothermal installation, providing a more comprehensive view of the system’s performance. Additionally, IoT devices can transmit data wirelessly, eliminating the need for wired connections and reducing installation and maintenance costs [111]. Comparison of Telemetry Systems and IoT Device is sumarized in Table 9.
Compared to telemetry, IoT has several advantages in terms of temperature, pressure, or mechanical parameter measurement. Firstly, IoT devices can collect data from multiple sensors simultaneously, providing a more comprehensive view of the system’s performance [112]. Secondly, IoT devices can transmit data wirelessly, eliminating the need for wired connections and reducing installation and maintenance costs [113]. Thirdly, IoT devices can be programmed to send alerts when certain parameters exceed predefined thresholds, allowing for early detection of potential issues and timely intervention.
The lack or improper use of telemetry in geothermal installations can lead to several problems. Firstly, telemetry systems can be expensive to install and maintain, especially in remote locations. Secondly, telemetry systems can be prone to signal interference and data loss, leading to inaccurate or incomplete data. Thirdly, telemetry systems can be difficult to integrate with other monitoring systems, leading to data silos and reduced visibility of the system’s performance [114].
In contrast, IoT devices are relatively inexpensive and easy to install and maintain. Additionally, IoT devices can be integrated with other monitoring systems, providing a more comprehensive view of the system’s performance [115]. Finally, IoT devices can be programmed to send alerts when certain parameters exceed predefined thresholds, allowing for early detection of potential issues and timely intervention.
In summary, IoT is chosen over telemetry in geothermal installations due to its ability to provide continuous monitoring and real-time data collection of temperature, pressure, and other mechanical parameters. IoT devices are equipped with sensors that can collect data from various points in the geothermal installation, providing a more comprehensive view of the system’s performance. Additionally, IoT devices can transmit data wirelessly, eliminating the need for wired connections and reducing installation and maintenance costs. The lack or improper use of telemetry in geothermal installations can lead to several problems, including high costs, signal interference, and data silos [116].
IoT devices have the potential to revolutionize geothermal monitoring, but they also pose several challenges that need to be addressed to ensure reliable operation and minimize the generation of erroneous data. Here are some strategies to confront these challenges:
  • Ensure reliable operation: To ensure reliable operation of IoT devices in geothermal installations, it is essential to choose devices that are designed to withstand the harsh environmental conditions of the installation. This includes selecting devices that are rated for high temperatures, humidity, and corrosion resistance. Additionally, regular maintenance and calibration of the devices can help ensure reliable operation [117].
  • Prevent malfunctions due to exceeding recommended temperature ranges: IoT devices can malfunction if they are exposed to temperatures outside their recommended range. To prevent this, it is essential to monitor the temperature of the devices and the surrounding environment and take appropriate measures to prevent overheating. This can include installing cooling systems or using devices with built-in temperature sensors and automatic shut-off features.
  • Minimize the generation of erroneous data: IoT devices can generate erroneous data due to factors such as sensor drift, signal interference, and data loss. To minimize this, it is essential to use high-quality sensors and ensure that the devices are properly calibrated and maintained [118]. Additionally, data validation and error correction algorithms can be used to identify and correct erroneous data.
  • Transition from elementary sensors to more complex MCU-based IoT devices: The transition from elementary sensors to more complex MCU-based IoT devices can bring several implications, including increased complexity, higher costs, and the need for specialized expertise. To address these challenges, it is essential to carefully evaluate the benefits and drawbacks of using MCU-based IoT devices and ensure that the devices are properly designed, installed, and maintained. Additionally, training and support for personnel responsible for operating and maintaining the devices can help ensure their reliable operation.
In summary, confronting the challenges posed by IoT devices in geothermal installations requires careful consideration of the devices’ design, installation, and maintenance. Strategies such as ensuring reliable operation, preventing malfunctions due to exceeding recommended temperature ranges, minimizing the generation of erroneous data, and carefully evaluating the transition from elementary sensors to more complex MCU-based IoT devices can help ensure the successful implementation of IoT-based geothermal monitoring systems [119].
In the construction and electronic placement of geothermal IoT monitoring systems, careful consideration should be given to the potential high temperatures of an environment or a medium [120]. Geothermal environments can expose the equipment to extreme heat, which can pose challenges to the proper functioning of electronic components. It is crucial to protect the silicon parts used in these systems, as they have maximum temperature limits that should not be exceeded. Adequate measures and safeguards must be implemented to ensure the longevity and reliable operation of IoT devices in such high-temperature conditions [121].
The advance of IoT technology has brought about a push for standardization in various aspects of its implementation. Standardization includes the adoption of common LPWAN communication protocols, the use of standardized components on the cloud side, and the establishment of methodologies for creating IoT nodes [122]. This standardization effort aims to streamline and simplify the development and deployment process of IoT systems. In contrast, telemetry systems often lack standardization and are often proprietary, leading to increased expenses and longer development cycles. The absence of standardized approaches in telemetry results in prolonged development times and delays in bringing products to market, ultimately driving up costs. By embracing standardization in IoT, organizations can benefit from reduced development costs, shorter time to market, and improved interoperability between different IoT devices and systems [123].

4. Research Challenges

This article describes options for geothermal monitoring and recent trends in the application of IoT technologies. This section discusses research challenges for potential applications of IoT sensor technology in underground geothermal structures to extend current installations and deliver more robust solutions for future installations. Innovations for specific equipment technologies (sensors, edge-computing, energy harvesting, IoT nodes, etc.) are also discussed.
Figure 8 illustrates the research challenges outlined in this article, labeled with four different signs. Undesirable states are tagged with a warning sign (exclamation mark within a triangle), innovations for improving the design of future applications are tagged with a dollar sign, innovations for technology are tagged with a light bulb, and innovations for the cloud are tagged with gear wheels. The figure highlights key research challenges and provides ideas for addressing them in the field. Implementation of advanced sensors holds the potential to significantly enhance the design and performance of geothermal installations. The figure introducing the content of the following sections. The Section 4.1 on new potential applications explores emerging uses of technology in innovative ways, opening up exciting possibilities for industries and individuals alike. Technology innovations discussed in the Section 4.2 showcase the latest advancements and breakthroughs that have the potential to revolutionize various fields and create new opportunities for development.

4.1. New Potential Applications

Underground geothermal structures are designed for long-term use; therefore, the proper management of the installation’s operational life is required. As mentioned in Section 1, eliminating undesirable states (e.g., thermal imbalance, the absence of turbulent fluid flow and the unforced operation of heat pumps during cooling) during the operation of an underground geothermal structure is beneficial. Long-term monitoring with IoT sensors can facilitate the optimal operation of underground geothermal structures, prolong system endurance and optimize standard operations. Table 10 lists several undesirable states and potential solutions.
Thermal imbalance during the operation of an underground geothermal structure is caused by the heterogeneity of the rock environment. To eliminate thermal imbalances, the monitoring of individual boreholes is a potential solution. The absence of turbulent fluid flow can be avoided with higher flow rates. Low flow rates in the geothermal structure can be specifically addressed with turbocollectors (pipes with spiral ribbing), which guarantee that the Reynolds number of the flow is exceeded. The last undesirable state is the operation of the heat pump during cooling.
The thermal stress of the pile must be monitored for mechanical property stability (strength and deformation parameters). A change in concrete temperature due to heat transfer (charging and discharging) produces a change in the stresses experienced by the concrete in the pile. This change in stress consequently produces volumetric changes in the concrete. In critical cases, the brittle failure of the concrete occurs, and the bearing capacity of the pile as a whole is reduced.
Another benefit of the long-term monitoring of currently deployed geothermal installations is the continuous data collection of operational parameters. Large datasets describing geothermal installation behavior during regular operation and also non-standard conditions can be created. IoT technologies allow the extensive monitoring of existing structures, and therefore, the knowledge base will contain new and important information that is useful for design work for future underground geothermal structures. Table 11 lists parameters whose monitoring could aid in producing improved designs for future applications.
Utilizing measurement and monitoring techniques for borehole properties, particularly temperature and flow rate, presents an opportunity to enhance future applications. Flow rate monitoring could aid in techno-economic optimization through the selection of suitable pipe diameters and optimal energy consumption models. Temperature monitoring could be applied to optimize designs for the well depth (the length of the borehole).
Many underground geothermal structure walls do not permit the use of sensor technologies due to wired sensor limitations or the absence of power grid connections. Such installations may include sensors that are installed during the construction process and are subsequently inaccessible or insular systems where a power supply connection is difficult to build. Energy harvesting technologies have excellent potential as solutions for such cases through their ability to generate electricity for sensor operation directly from the ambient environment.
IoT monitoring systems for geothermal structures can be powered by harvesting energy from the environment. Table 12 lists energy harvesting methods suitable for powering these types of IoT sensors. The most promising energy harvesting method is the use of TEG technology, whose main advantage is the absence of moving mechanical parts and the possibility of placing the device directly into a borehole. Another option is to use water pipeline energy harvesting. This type of energy harvesting system can also be placed into a borehole, but only inside a pipe. Water pipeline energy harvesting modules also have the disadvantage of moving mechanical parts. The third energy harvesting option is solar and wind energy. Solar panels or wind turbines cannot be placed into boreholes, however, and must be located on the surface and be connected to the IoT sensor inside the borehole with wires.

4.2. Technological Innovations

The process of constructing an underground geothermal structure requires many technological components. Most of these components do not support direct monitoring, and deploying sensors in existing installations is therefore problematic. The next generation of components could integrate physical sensors directly into equipment. A solution such as this not only permits IoT monitoring but also provides a sensory interface for any type of analytical equipment, such as DTS technology. In principle, components with embedded sensors add value at minimal cost. Technological improvements would involve the installation of optical fibres directly into the underground geothermal structure and the positioning of temperature sensors in the borehole at various depths. These improvements have the potential benefit of optimizing the efficiency of the installation. While this solution addresses certain aspects of the problem, such as improving functionality or performance, it does not still provide a comprehensive solution for maintenance or replacement requirements. In order to ensure sustained effectiveness, it is crucial to consider the high reliability of components involved. Moreover, a key expectation for this solution is its ability to support long-term deployment without significant interruptions or failures.
Energy harvesting transducers can power IoT sensors, but the transducer design must be optimized and aligned with the installation to establish the best energy gains. Thermoelectric generators are a promising technology, but they must be deployed in environments with effective temperature gradients. Temperature gradients for thermoelectric generator purposes are found in environments that fluctuate between medium and ambient temperatures, between warm and cold branches, and between shallow soil (50 cm below ground) and ambient air.
Underground monitoring generally faces problems with data transmission. Regular connections with the cloud can be solved in two ways: a transmission antenna can be placed on the surface, or new types of underground antennae suitable for IoT communications must be developed.
The final research challenge involves innovating the communication interface and cloud data processing. Computationally limited, low-power IoT nodes require effective data transmission solutions that can be delivered through edge computing techniques or event-based approaches (Table 13).
Edge computing allows metadata analysis in situ and provides significant benefits for data transmission; for example, IoT nodes monitoring a geothermal energy installation conserve energy and resources by transmitting data only if a hazardous state arises. The data transmission time and the volume of data stored in the cloud are reduced by storing raw sensor data locally, and the use of cloud computational resources is minimized.
IoT monitoring systems designed for the real-time collection of data from geothermal energy installations can also be optimized with edge computing data compression methods to reduce the total volume of transmitted data. Truncated data can also be uploaded when energy for transmission is limited, followed by detailed data transmission in the future when energy is sufficient.

5. Conclusions

This article identifies potential research directions for new applications in geothermal energy installations and innovations for IoT monitoring technology and cloud services. The article contributes an overview of state-of-the-art principles in the design of monitoring systems for geothermal energy installations and a review of the sensor technologies available for use with IoT devices and cloud data processing. Suitable sensor equipment includes devices for monitoring temperature, flow rates and other mechanical parameters. The article also reviews IoT technologies, sensor node composition, options for data transmission and the features of cloud services.
Future research targets and several possible directions are outlined in the Research Challenges section. State-of-the-art solutions provide the potential for new applications that address several problematic conditions in geothermal energy installations. Monitoring systems allow the collection of important datasets that can be used to improve future designs of geothermal energy installations. Several technological innovation techniques could also improve the operation of IoT monitoring devices. Operating nodes in monitoring systems can be powered from harvested ambient energy to prolong the operating time and reduce costs. Edge computing methods can optimize data transmission and power consumption and provide early warnings of faulty or inefficient operating conditions in geothermal energy installations.

Author Contributions

Conceptualization, M.P.; investigation, T.K. and J.K. (Jaromir Konecny); resources, T.K., B.M., D.A. and M.Z.; writing—original draft preparation, M.P., T.K., J.K. (Jaromir Konecny), M.A., K.G., M.M. and P.P.; writing—review and editing, M.P., T.K. and J.K. (Jaromir Konecny); visualization, J.K. (Jaromir Konecny); supervision, M.P. and J.K. (Jiri Koziorek); funding acquisition, J.K. (Jiri Koziorek). All authors have read and agreed to the published version of the manuscript.

Funding

This work was supported by the project SP2023/009, “Development of algorithms and systems for control, measurement and safety applications IX”, of the Student Grant System, VSB-TU Ostrava. This work received funding from the European Union’s Horizon 2020 research and innovation program under grant agreement no. 856670.

Institutional Review Board Statement

Not applicable.

Informed Consent Statement

Not applicable.

Data Availability Statement

Not applicable.

Conflicts of Interest

The authors declare no conflict of interest.

References

  1. Mubarok, M.H.; Zarrouk, S.J.; Cater, J.E. Two-phase flow measurement of geothermal fluid using orifice plate: Field testing and CFD validation. Renew. Energy 2019, 134, 927–946. [Google Scholar] [CrossRef]
  2. Helbig, S.; Zarrouk, S.J. Measuring two-phase flow in geothermal pipelines using sharp edge orifice plates. Geothermics 2012, 44, 52–64. [Google Scholar] [CrossRef]
  3. Okazaki, T.; Seto, R.; Watanabe, T.; Ueda, A.; Kuramitz, H. U-Shaped Polymer Cladding and Hetero-Core Fiber Optic Sensors for Monitoring Scale Formation in Geothermal Brine. Anal. Lett. 2020, 53, 2160–2169. [Google Scholar] [CrossRef]
  4. Yadav, D.K.; Jayanthu, S.; Das, S.K.; Chinara, S.; Mishra, P. Critical review on slope monitoring systems with a vision of unifying WSN and IoT. IET Wirel. Sens. Syst. 2019, 9, 167–180. [Google Scholar] [CrossRef]
  5. Bense, V.; Read, T.; Bour, O.; Le Borgne, T.; Coleman, T.; Krause, S.; Chalari, A.; Mondanos, M.; Ciocca, F.; Selker, J. Distributed Temperature S ensing as a downhole tool in hydrogeology. Water Resour. Res. 2016, 52, 9259–9273. [Google Scholar] [CrossRef] [Green Version]
  6. Challener, W.; Palit, S.; Jones, R.; Airey, L.; Craddock, R.; Knobloch, A. MOEMS pressure sensors for geothermal well monitoring. In Proceedings of the MOEMS and Miniaturized Systems XII, San Francisco, CA, USA, 2–7 February 2013. [Google Scholar]
  7. Ali, H.; Choi, J.H. A review of underground pipeline leakage and sinkhole monitoring methods based on wireless sensor networking. Sustainability 2019, 11, 4007. [Google Scholar] [CrossRef] [Green Version]
  8. Kim, J.W.; Lee, C.; Park, S. Real-time health monitoring of pipeline structures using piezoelectric guided wave propagation. Adv. Sci. Lett. 2011, 4, 696–701. [Google Scholar] [CrossRef]
  9. Muduli, L.; Mishra, D.P.; Jana, P.K. Application of wireless sensor network for environmental monitoring in underground coal mines: A systematic review. J. Netw. Comput. Appl. 2018, 106, 48–67. [Google Scholar] [CrossRef]
  10. Grimsley, R.; Marineau, M.; Iannucci, B. Experiences in LP-IoT: EnviSense Deployment of Remotely Reprogrammable Environmental Sensors. In Proceedings of the 1st ACM Workshop on No Power and Low Power Internet-of-Things, New Orleans, LA, USA, 31 January–4 February 2022; pp. 1–7. [Google Scholar]
  11. Adhya, S.; Saha, D.; Das, A.; Jana, J.; Saha, H. An IoT based smart solar photovoltaic remote monitoring and control unit. In Proceedings of the 2nd International Conference on Control, Instrumentation, Energy and Communication, CIEC 2016, Kolkata, India, 28–30 January 2016; IEEE: Piscataway, NJ, USA, 2016; pp. 432–436. [Google Scholar]
  12. Hossain, M.I.; Markendahl, J.I. Comparison of LPWAN Technologies: Cost Structure and Scalability. Wirel. Pers. Commun. 2021, 121, 887–903. [Google Scholar] [CrossRef]
  13. Aranzabal, N.; Martos, J.; Steger, H.; Blum, P.; Soret, J. Temperature measurements along a vertical borehole heat exchanger: A method comparison. Renew. Energy 2019, 143, 1247–1258. [Google Scholar] [CrossRef]
  14. Sanjuan, B.; Béchu, E.; Braibant, G.; Lebert, F. High Temperature-High Pressure Rated Sensors and Tools Useful for Geothermal Purposes. Bibliographical Review. 2009, Final Report, BRGM/RP-57342-FR, pp. 44. Available online: http://infoterre.brgm.fr/rapports/RP-57342-FR.pdf (accessed on 2 May 2023).
  15. Ukil, A.; Braendle, H.; Krippner, P. Distributed temperature sensing: Review of technology and applications. IEEE Sens. J. 2011, 12, 885–892. [Google Scholar] [CrossRef] [Green Version]
  16. McDaniel, A.; Fratta, D.; Tinjum, J.M.; Hart, D.J. Long-term district-scale geothermal exchange borefield monitoring with fiber optic distributed temperature sensing. Geothermics 2018, 72, 193–204. [Google Scholar] [CrossRef]
  17. Reinsch, T.; Henninges, J.; Ásmundsson, R. Thermal, mechanical and chemical influences on the performance of optical fibres for distributed temperature sensing in a hot geothermal well. Environ. Earth Sci. 2013, 70, 3465–3480. [Google Scholar] [CrossRef] [Green Version]
  18. Martos, J.; Montero, Á.; Torres, J.; Soret, J.; Martínez, G.; García-Olcina, R. Novel wireless sensor system for dynamic characterization of borehole heat exchangers. Sensors 2011, 11, 7082–7094. [Google Scholar] [CrossRef]
  19. Erkan, K.; Akkoyunlu, B.; Balkan, E.; Tayanç, M. A portable borehole temperature logging system using the four-wire resistance method. J. Geophys. Eng. 2017, 14, 1413–1419. [Google Scholar] [CrossRef] [Green Version]
  20. Becerra, G.; Picazo, M.; Aguilar, J.; Xamán, J.; Osorio, E.; Hernandez, J.; Ledesma-Alonso, R. Experimental study of a geothermal earth-to-air heat exchanger in Chetumal, Quintana Roo, Mexico. Energy Effic. 2022, 15, 20. [Google Scholar] [CrossRef]
  21. Aranzabal, N.; Radioti, G.; Martos, J.; Soret, J.; Nguyen, F.; Charlier, R. Enhanced thermal response test using fiber optics for a double U-pipe borehole heat exchanger analysed by numerical modeling. In Proceedings of the 29th International Conference on Efficiency, Cost, Optimisation, Simulation and Environmental Impact of Energy Systems, Portoroz, Slovenia, 19–23 June 2016. [Google Scholar]
  22. Gehlin, S.E.; Hellstrom, G. Comparison of four models for thermal response test evaluation. ASHRAE Trans. 2003, 109, 131. [Google Scholar]
  23. Ouyang, L.B.; Belanger, D.L. Flow profiling by distributed temperature sensor (DTS) system-expectation and reality. SPE Prod. Oper. 2006, 21, 269–281. [Google Scholar] [CrossRef]
  24. Patterson, J.R.; Cardiff, M.; Coleman, T.; Wang, H.; Feigl, K.L.; Akerley, J.; Spielman, P. Geothermal reservoir characterization using distributed temperature sensing at Brady Geothermal Field, Nevada. Lead. Edge 2017, 36, 1024a1–1024a7. [Google Scholar] [CrossRef] [Green Version]
  25. Wu, H.; Feder, K.S.; Stolov, A.A.; Shenk, S.D.; Monberg, E.M.; Simoff, D.A. High-temperature enhanced Rayleigh scattering optical fiber sensor for borehole applications. In Proceedings of the Optical Components and Materials XVII, San Francisco, CA, USA, 1–6 February 2020; Volume 11276, pp. 167–172. [Google Scholar]
  26. Wu, H.; Stolov, A.A.; Feder, K.S. Optical fiber as distributed acoustic sensing element with improved Rayleigh backscattering sensitivity and robustness under elevated temperature. In Proceedings of the Optical Fibers and Sensors for Medical Diagnostics, Treatment and Environmental Applications XXI, Online, CA, USA, 6–12 March 2021; Volume 11635, pp. 51–57. [Google Scholar]
  27. Ilko, J.; Rusko, M.; Halper, C.; Majernik, M.; Majernik, S. Flow Measurement on Hot Water Lines at Geothermal Power Plant Using Ultrasonic Method. In Proceedings of the 31st DAAAM International Symposium, Mostar, Bosnia and Herzegovina, 21–24 October 2020; Volume 7. [Google Scholar]
  28. Chhantyal, K.; Viumdal, H.; Mylvaganam, S.; Elseth, G. Ultrasonic level sensors for flowmetering of non-Newtonian fluids in open Venturi channels: Using data fusion based on Artificial Neural Network and Support Vector Machines. In Proceedings of the 2016 IEEE Sensors Applications Symposium (SAS), Catania, Italy, 20–22 April 2016; IEEE: Piscataway, NJ, USA, 2016; pp. 1–6. [Google Scholar]
  29. de Zuquim, M.P.S.; Zarrouk, S.J. Nursery greenhouses heated with geothermal energy–A case study from Rotorua New Zealand. Geothermics 2021, 95, 102123. [Google Scholar] [CrossRef]
  30. Agamata-Lu, C. Chemical Tracer Dilution Test Using Isopropanol, Benzoate and Bromide at the Broadlands-Ohaaki Geothermal Field. Trans.-Geotherm. Resour. Counc. 2000, 24, 549–554. [Google Scholar]
  31. Mella, M.; Olsen, S.; Rose, P.; Bour, D.; Petty, S.; Harris, J. A Downhole Fluorimeter for Measuring Flow Processes in Geothermal and EGS Wellbores. Geotherm. Resour. Counc. Trans. 2010, 34, 1161–1166. [Google Scholar]
  32. Sugiharto, M.P.; Marastio, F.E.; Fanani, A.F.; Pasaribu, F.; Silaban, M.; Maulana, D.T.; Saptadji, N.M. The Implementation of Flow Performance Test to Monitor Well Performance in Geothermal Field. Iop Conf. Ser. Earth Environ. Sci. 2021, 732, 012020. [Google Scholar] [CrossRef]
  33. Ruliandi, D. Geothermal power plant system performance prediction using artificial neural networks. In Proceedings of the 2015 IEEE Conference on Technologies for Sustainability, Ogden, UT, USA, 30 July–1 August 2015; pp. 216–223. [Google Scholar]
  34. Mubarok, M.H.; Cater, J.E.; Zarrouk, S.J. Comparative CFD modelling of pressure differential flow meters for measuring two-phase geothermal fluid flow. Geothermics 2020, 86, 101801. [Google Scholar] [CrossRef]
  35. Mubarok, M.H.; Zarrouk, S.J.; Cater, J.E.; Mundakir, A.; Bramantyo, E.A.; Lim, Y.W. Real-time enthalpy measurement of two-phase geothermal fluid flow using load cell sensors: Field testing results. Geothermics 2021, 89, 101930. [Google Scholar] [CrossRef]
  36. Shen, J. Measurement of Fluid Properties of Two-Phase Fluids Using an Ultrasonic Meter. U.S. Patent 5,115,670, 26 May 1992. [Google Scholar]
  37. Sanderson, M.; Yeung, H. Guidelines for the use of ultrasonic non-invasive metering techniques. Flow Meas. Instrum. 2002, 13, 125–142. [Google Scholar] [CrossRef]
  38. Uhlmann, M.; Bertsch, S. Measurement and Simulation of Startup and Shut Down of Heat Pumps. In Proceeding of the International Refrigeration and Air Conditioning Conference, West Lafayette, IN, USA, 12–15 July 2010. [Google Scholar]
  39. Bixley, P.; Dench, N.; Wilson, D. Development of well testing methods at Wairakei 1950–1980. In Proceedings of the 20th Geothermal Workshop, Auckland, New Zealand, 1998. [Google Scholar]
  40. Siitonen, H.J. Output tests of shallow Rotorua wells. In Proceedings of the 8th New Zealand Geothermal Workshop, Auckland, New Zealand, 5–7 November 1986; pp. 63–67. [Google Scholar]
  41. Sanchez-Velasco, R.A.; Canchola-Felix, I. Geothermal Steam Measurement with Orifice Plates, According with the ISO 5167—The Cerro Prieto Case. 2018; ISBN 0-934412-90-1. ISSN 0193-5933. [Google Scholar]
  42. López, J.; Martínez, A.; Pérez, A.; Medina, A. Geological Results, Drilling and Mass Flow of the Well AZ-89, the Geothermal Field of Los Azufres, Mich. Resultados Geológicos, de Perforación y Produción del Pozo AZ-89, del Campo Geotérmico de los Azufres, Mich. 2018. Available online: https://www.researchgate.net/publication/296708344_Geological_results_drilling_and_mass_flow_of_the_well_AZ-89_the_geothermal_field_of_Los_Azufres_Mich (accessed on 2 May 2023).
  43. Lovelock, B. Steam flow measurement in two-phase pipelines using volatile organic liquid tracers. In The 19th New Zealand Geothermal Workshop; University of Auckland: Auckland, New Zealand, 1997; pp. 75–80. [Google Scholar]
  44. Armenta, M. Validation of Hiriart Equation to Compute Steam Production by the Lip Pressure Method; Technical Report; Geothermal Resources Council: Davis, CA, USA, 1997. [Google Scholar]
  45. Spencer, E. Progress on international standardization of orifice plates for flow measurement. Int. J. Heat Fluid Flow 1982, 3, 59–66. [Google Scholar] [CrossRef]
  46. O’Banion, T. Coriolis: The direct approach to mass flow measurement. Chem. Eng. Prog. 2013, 109, 41–46. [Google Scholar]
  47. Sisler, J.R.; Zarrouk, S.J.; Urgel, A.; Lim, Y.W.; Adams, R.; Martin, S. Measurement of two phase flows in geothermal pipelines using load-cells: Field trial results. In Proceedings of the 37th New Zealand Geothermal Workshop, Taupo, New Zealand, 18–20 November 2015; Volume 18, p. 20. [Google Scholar]
  48. Leven, C.; Barrash, W. Fiber optic pressure measurements open up new experimental possibilities in hydrogeology. Groundwater 2021, 60, 125–136. [Google Scholar] [CrossRef]
  49. Dresen, G.; Stanchits, S.; Rybacki, E. Borehole breakout evolution through acoustic emission location analysis. Int. J. Rock Mech. Min. Sci. 2010, 47, 426–435. [Google Scholar] [CrossRef]
  50. Simonetti, A. A measurement technique for the vibrating wire sensors. In Proceedings of the NORCHIP 2012, Copenhagen, Denmark, 12–13 November 2012; IEEE: Piscataway, NJ, USA, 2012; pp. 1–6. [Google Scholar]
  51. Stevens, L. Pressure, temperature and flow logging in geothermal wells. In Proceedings of the World Geothermal Congress, Kyushu-Tohoku, Japan, 28 May–10 June 2000; pp. 2435–2437. [Google Scholar]
  52. Doetsch, J.; Gischig, V.S.; Villiger, L.; Krietsch, H.; Nejati, M.; Amann, F.; Jalali, M.; Madonna, C.; Maurer, H.; Wiemer, S.; et al. Subsurface fluid pressure and rock deformation monitoring using seismic velocity observations. Geophys. Res. Lett. 2018, 45, 10–389. [Google Scholar] [CrossRef] [Green Version]
  53. Becker, M.; Coleman, T.; Ciervo, C.; Cole, M.; Mondanos, M. Fluid pressure sensing with fiber-optic distributed acoustic sensing. Lead. Edge 2017, 36, 1018–1023. [Google Scholar] [CrossRef]
  54. Liu, H.; Gao, Z.; Shao, L.; Li, J. Design of monitoring system based on vibrating wire sensor. In Proceedings of the 2019 Chinese Control And Decision Conference (CCDC), Nanchang, China, 3–5 June 2019; IEEE: Piscataway, NJ, USA, 2019; pp. 2457–2461. [Google Scholar]
  55. Putra, A.D.; Toda, H.; Hafidz, A.; Matsuba, K.; Kimikado, Y.; Takahashi, Y.; Tsuzuki, S.; Kinoshita, N.; Yasuhara, H. Development of slope deformation monitoring system based on tilt sensors with low-power wide area network technology and its application. J. Civ. Struct. Health Monit. 2021, 11, 1037–1053. [Google Scholar] [CrossRef]
  56. Clarivate. Web of Science. Available online: https://www.webofscience.com (accessed on 14 July 2022).
  57. Papaioannou, P.; Tzanis, N.; Tranoris, C.; Denazis, S.; Birbas, A. A Prototype 5G/IoT Implementation for Transforming a Legacy Facility to a Smart Factory. In Proceedings of the Artificial Intelligence Applications and Innovations. AIAI 2021 IFIP WG 12.5 International Workshops: 5G-PINE 2021, AI-BIO 2021, DAAI 2021, DARE 2021, EEAI 2021, and MHDW 2021, Hersonissos, Crete, Greece, 25–27 June 2021. [Google Scholar]
  58. Lee, J.; Lee, J.; Jeong, J. Design and Implementation of Injection Data Preprocessing Monitoring System Based on Node-RED. In Proceedings of the International Symposium on Medical Information and Communication Technology, ISMICT, 2021, Xiamen, China, 14–16 April 2021; pp. 19–23. [Google Scholar]
  59. Ali, A. Framework for Air Pollution Monitoring in Smart Cities by Using IoT and Smart Sensors. ARPN J. Eng. Appl. Sci. 2022, 17, 670–674. [Google Scholar] [CrossRef]
  60. Jabbar, W.A.; Annathurai, S.; Rahim, T.A.A.; Mohd Fauzi, M.F. Smart energy meter based on a long-range wide-area network for a stand-alone photovoltaic system. Expert Syst. Appl. 2022, 197, 116703. [Google Scholar] [CrossRef]
  61. Lin, J.Y.; Tsai, H.L.; Lu, G.H. Development of Wireless AC Power-Monitoring Module. In Proceedings of the 8th International Conference on Applied System Innovation, ICASI 2022, Nantou, Taiwan, 22–23 April 2022; pp. 1–4. [Google Scholar]
  62. Civerchia, F.; Bocchino, S.; Salvadori, C.; Rossi, E.; Maggiani, L.; Petracca, M. Industrial Internet of Things monitoring solution for advanced predictive maintenance applications. J. Ind. Inf. Integr. 2017, 7, 4–12. [Google Scholar] [CrossRef]
  63. Shim, H.K.; Sun, S.; Kim, H.S.; Lee, D.G.; Lee, Y.J.; Jang, J.S.; Cho, K.H.; Baik, J.M.; Kang, C.Y.; Leng, Y.; et al. On a nonlinear broadband piezoelectric energy harvester with a coupled beam array. Appl. Energy 2022, 328, 120129. [Google Scholar] [CrossRef]
  64. Elahi, H.; Munir, K.; Eugeni, M.; Atek, S.; Gaudenzi, P. Energy harvesting towards self-powered IoT devices. Energies 2020, 13, 5528. [Google Scholar] [CrossRef]
  65. Ryan, E.; Kosanovic, D.; McDaniel, B. Application of thermal energy storage with electrified heating and cooling in a cold climate. Appl. Energy 2022, 328, 120147. [Google Scholar] [CrossRef]
  66. Yazawa, K.; Feng, Y.; Lu, N. Conformal heat energy harvester on Steam4 pipelines for powering IoT sensors. Energy Convers. Manag. 2021, 244, 114487. [Google Scholar] [CrossRef]
  67. Das, P.; Ghosh, S.; Chatterjee, S.; De, S. A Low Cost Outdoor Air Pollution Monitoring Device With Power Controlled Built-In PM Sensor. IEEE Sens. J. 2022, 22, 13682–13695. [Google Scholar] [CrossRef]
  68. Wang, P.; Gao, M.; Sun, Y.; Zhang, H.; Liao, Y.; Xie, S. A vibration-powered self-contained node by profiling mechanism and its application in cleaner agricultural production. J. Clean. Prod. 2022, 366, 132897. [Google Scholar] [CrossRef]
  69. Tran, L.G.; Cha, H.K.; Park, W.T. RF power harvesting: A review on designing methodologies and applications. Micro Nano Syst. Lett. 2017, 5, 14. [Google Scholar] [CrossRef] [Green Version]
  70. Twaha, S.; Zhu, J.; Yan, Y.; Li, B. A comprehensive review of thermoelectric technology: Materials, applications, modelling and performance improvement. Renew. Sustain. Energy Rev. 2016, 65, 698–726. [Google Scholar] [CrossRef]
  71. Roy, S.; Kabir, M.H.; Salauddin, M.; Halim, M.A. An Electromagnetic Wind Energy Harvester Based on Rotational Magnet Pole-Pairs for Autonomous IoT Applications. Energies 2022, 15, 5725. [Google Scholar] [CrossRef]
  72. Sandhu, M.M.; Khalifa, S.; Jurdak, R.; Portmann, M. Task Scheduling for Energy-Harvesting-Based IoT: A Survey and Critical Analysis. IEEE Internet Things J. 2021, 8, 13825–13848. [Google Scholar] [CrossRef]
  73. Paterova, T.; Prauzek, M.; Konecny, J.; Ozana, S.; Zmij, P.; Stankus, M.; Weise, D.; Pierer, A. Environment-monitoring IoT devices powered by a TEG which converts thermal flux between air and near-surface soil into electrical energy. Sensors 2021, 21, 8098. [Google Scholar] [CrossRef]
  74. Shukla, S.; Jha, P.K.; Ray, K.C. An energy-efficient single-cycle RV32I microprocessor for edge computing applications. Integration 2023, 88, 233–240. [Google Scholar] [CrossRef]
  75. Pereira, F.; Correia, R.; Pinho, P.; Lopes, S.I.; Carvalho, N.B. Challenges in resource-constrained iot devices: Energy and communication as critical success factors for future iot deployment. Sensors 2020, 20, 6420. [Google Scholar] [CrossRef]
  76. NXP Semiconductors Official Site | NXP Semiconductors. Available online: https://www.nxp.com/ (accessed on 15 February 2023).
  77. Smart|Connected|Secure|Microchip Technology. Available online: https://www.microchip.com/ (accessed on 18 February 2023).
  78. Lin, L.; Tang, Z.; Tan, N.; Xiao, X. Power management in low-power MCUs for energy IoT applications. J. Sens. 2020, 2020, 8819236. [Google Scholar] [CrossRef]
  79. Khalifeh, A.; Mazunga, F.; Nechibvute, A.; Nyambo, B.M. Microcontroller Unit-Based Wireless Sensor Network Nodes: A Review. Sensors 2022, 22, 8937. [Google Scholar] [CrossRef]
  80. Lanza, M.; Sebastian, A.; Lu, W.D.; Le Gallo, M.; Chang, M.F.; Akinwande, D.; Puglisi, F.M.; Alshareef, H.N.; Liu, M.; Roldan, J.B. Memristive technologies for data storage, computation, encryption, and radio-frequency communication. Science 2022, 376, eabj9979. [Google Scholar] [CrossRef]
  81. Ayoub, W.; Samhat, A.E.; Nouvel, F.; Mroue, M.; Prévotet, J.C. Internet of Mobile Things: Overview of LoRaWAN, DASH7, and NB-IoT in LPWANs Standards and Supported Mobility. IEEE Commun. Surv. Tutor. 2019, 21, 1561–1581. [Google Scholar] [CrossRef] [Green Version]
  82. Raza, U.; Kulkarni, P.; Sooriyabandara, M. Low Power Wide Area Networks: An Overview. IEEE Commun. Surv. Tutor. 2017, 19, 855–873. [Google Scholar] [CrossRef] [Green Version]
  83. Alghamdi, A.M.; Khairullah, E.F.; Al Mojamed, M.M. LoRaWAN Performance Analysis for a Water Monitoring and Leakage Detection System in a Housing Complex. Sensors 2022, 22, 7188. [Google Scholar] [CrossRef]
  84. Haxhibeqiri, J.; De Poorter, E.; Moerman, I.; Hoebeke, J. A survey of LoRaWAN for IoT: From technology to application. Sensors 2018, 18, 3995. [Google Scholar] [CrossRef] [Green Version]
  85. Mekki, K.; Bajic, E.; Chaxel, F.; Meyer, F. A comparative study of LPWAN technologies for large-scale IoT deployment. ICT Express 2019, 5, 1–7. [Google Scholar] [CrossRef]
  86. Sousa, D.; Hernandez, D.; Oliveira, F.; Luís, M.; Sargento, S. A platform of unmanned surface vehicle swarms for real time monitoring in aquaculture environments. Sensors 2019, 19, 4695. [Google Scholar] [CrossRef] [Green Version]
  87. Lykov, Y.; Paniotova, A.; Shatalova, V.; Lykova, A. Energy Efficiency Comparison LPWANs: LoRaWan vs Sigfox. In Proceedings of the 2020 IEEE International Conference on Problems of Infocommunications. Science and Technology (PIC S&T), Kharkiv, Ukraine, 6–9 October 2020; IEEE: Piscataway, NJ, USA, 2020; pp. 485–490. [Google Scholar]
  88. Gomez, C.; Veras, J.C.; Vidal, R.; Casals, L.; Paradells, J. A sigfox energy consumption model. Sensors 2019, 19, 681. [Google Scholar] [CrossRef] [Green Version]
  89. Aernouts, M.; Berkvens, R.; Van Vlaenderen, K.; Weyn, M. Sigfox and LoRaWAN datasets for fingerprint localization in large urban and rural areas. Data 2018, 3, 13. [Google Scholar] [CrossRef] [Green Version]
  90. Popli, S.; Jha, R.K.; Jain, S. A Survey on Energy Efficient Narrowband Internet of Things (NBIoT): Architecture, Application and Challenges. IEEE Access 2019, 7, 16739–16776. [Google Scholar] [CrossRef]
  91. Sun, R.; Chang, W.; Talarico, S.; Niu, H.; Yang, H. Design and performance of unlicensed NB-IoT. In Proceedings of the International Symposium on Wireless Communication Systems, Oulu, Finland, 27–30 August 2019; pp. 469–473. [Google Scholar]
  92. Alobaidy, H.A.H.; Singh, M.J.; Nordin, R.; Abdullah, N.F.; Gze Wei, C.; Siang Soon, M.L. Real-World Evaluation of Power Consumption and Performance of NB-IoT in Malaysia. IEEE Internet Things J. 2022, 9, 11614–11632. [Google Scholar] [CrossRef]
  93. Jewel, M.K.H.; Zakariyya, R.S.; Lin, F. On channel estimation in LTE–based downlink narrowband internet of things systems. Electronics 2021, 10, 1246. [Google Scholar] [CrossRef]
  94. Olejniczak, A.; Błaszkiewicz, O.; Cwalina, K.K.; Rajchowski, P.; Sadowski, J. Software-defined NB-IoT uplink framework—The design, implementation and use cases. Sensors 2021, 21, 8234. [Google Scholar] [CrossRef] [PubMed]
  95. Lalle, Y.; Fourati, L.C.; Fourati, M.; Barraca, J.P. A Comparative Study of LoRaWAN, SigFox, and NB-IoT for Smart Water Grid. In Proceedings of the 2019 Global Information Infrastructure and Networking Symposium, GIIS 2019, Paris, France, 18–20 December 2019. [Google Scholar]
  96. Almuhaya, M.A.M.; Jabbar, W.A.; Sulaiman, N.; Abdulmalek, S. A Survey on LoRaWAN Technology: Recent Trends, Opportunities, Simulation Tools and Future Directions. Electronics 2022, 11, 164. [Google Scholar] [CrossRef]
  97. Durand, T.; Visagie, L.; Booysen, M.T. Evaluation of next-generation low-power communication technology to replace GSM in IoT-applications. IET Commun. 2019, 13, 2533–2540. [Google Scholar] [CrossRef]
  98. Manvi, S.S.; Shyam, G.K. Resource management for Infrastructure as a Service (IaaS) in cloud computing: A survey. J. Netw. Comput. Appl. 2014, 41, 424–440. [Google Scholar] [CrossRef]
  99. Papacharalambous, B. Cloud services vs. On–premise solutions cost comparison calculator. In Proceedings of the Business Information Systems Workshops: BIS 2014 International Workshops, Larnaca, Cyprus, 22–23 May 2014; Springer: Cham, Switzerland, 2014; Volume 183, pp. 318–325. [Google Scholar]
  100. Parast, F.K.; Sindhav, C.; Nikam, S.; Yekta, H.I.; Kent, K.B.; Hakak, S. Cloud computing security: A survey of service–based models. Comput. Secur. 2022, 114, 102580. [Google Scholar] [CrossRef]
  101. Pierleoni, P.; Concetti, R.; Belli, A.; Palma, L. Amazon, Google and Microsoft Solutions for IoT: Architectures and a Performance Comparison. IEEE Access 2019, 8, 5455–5470. [Google Scholar] [CrossRef]
  102. Muhammed, A.S.; Ucuz, D. Comparison of the IoT Platform Vendors, Microsoft Azure, AmazonWeb Services, and Google Cloud, from Users’ Perspectives. In Proceedings of the 8th International Symposium on Digital Forensics and Security, Beirut, Lebanon, 1–2 June 2020. [Google Scholar]
  103. Grados, B.; Bedon, H. Software Components of an IoT Monitoring Platform in Google Cloud Platform: A Descriptive Research and an Architectural Proposal. In Applied Technologies. ICAT 2019. Communications in Computer and Information Science; Botto-Tobar, M., Zambrano Vizuete, M., Torres-Carrión, P., Montes León, S., Pizarro Vásquez, G., Durakovic, B., Eds.; Springer: Berlin, Germany, 2020; Volume 1193, pp. 153–167. [Google Scholar]
  104. Kaya, M.C.; Nikoo, M.S.; Schwartz, M.L.; Oguztuzun, H. Internet of measurement things architecture: Proof of concept with scope of accreditation. Sensors 2020, 20, 503. [Google Scholar] [CrossRef] [Green Version]
  105. Kim, C.W.; Qi, J.; Kawabe, D. Development of vibration-based early scour warning system for railway bridge piers. In Current Perspectives and New Directions in Mechanics, Modelling and Design of Structural Systems; CRC Press: London, UK, 2022; pp. 1735–1740. [Google Scholar]
  106. Dai, H.; Shi, P.; Liu, H.; Chen, R.; Chen, Z. Electrical fire monitoring IoT framework for ancient architectural complex leveraging edge computing. Int. J. Commun. Syst. 2022, 35, e5329. [Google Scholar] [CrossRef]
  107. Bassetti, E.; Panizzi, E. Earthquake Detection at the Edge: IoT Crowdsensing Network. Information 2022, 13, 195. [Google Scholar] [CrossRef]
  108. Rivet, F.; Foucaud, L.; Ferre, G. Edge Computing Technique for a 87% Energy Saving for IoT Device Dedicated to Environmental Monitoring. In Proceedings of the 2021 IEEE 12th Latin American Symposium on Circuits and Systems, LASCAS 2021, Arequipa, Peru, 22–25 February 2021. [Google Scholar]
  109. Debski, R.; Drezewski, R. Real-time surrogate-assisted preprocessing of streaming sensor data. Comput. Netw. 2022, 219, 109422. [Google Scholar] [CrossRef]
  110. Murshed, M.S.; Murphy, C.; Hou, D.; Khan, N.; Ananthanarayanan, G.; Hussain, F. Machine Learning at the Network Edge: A Survey. ACM Comput. Surv. 2022, 54, 1–37. [Google Scholar] [CrossRef]
  111. Nourildean, S.W.; Hassib, M.D.; Mohammed, Y.A. Internet of things based wireless sensor network: A review. J. Electr. Eng. Comput. Sci. 2022, 27, 246–261. [Google Scholar] [CrossRef]
  112. Tran-Dang, H.; Krommenacker, N.; Charpentier, P.; Kim, D.S. The Internet of Things for logistics: Perspectives, application review, and challenges. IETE Tech. Rev. 2022, 39, 93–121. [Google Scholar] [CrossRef]
  113. Li, W.; Awais, M.; Ru, W.; Shi, W.; Ajmal, M.; Uddin, S.; Liu, C. Review of sensor network-based irrigation systems using IoT and remote sensing. Adv. Meteorol. 2020, 2020, 8396164. [Google Scholar] [CrossRef]
  114. Widianto, M.H.; Ranny, R. Message querying telemetry transfer on IoT applications to enhance technology: A systematic review. Int. J. Reconfig. Embed. Syst. 2022, 11, 265. [Google Scholar] [CrossRef]
  115. Ullo, S.L.; Sinha, G.R. Advances in smart environment monitoring systems using IoT and sensors. Sensors 2020, 20, 3113. [Google Scholar] [CrossRef]
  116. Yu, M. Network telemetry: Towards a top-down approach. ACM SIGCOMM Comput. Commun. Rev. 2019, 49, 11–17. [Google Scholar] [CrossRef]
  117. Zhang, W.; Yue, M. The application of building energy management system based on IoT technology in smart city. Int. J. Syst. Assur. Eng. Manag. 2021, 12, 617–628. [Google Scholar] [CrossRef]
  118. Okafor, N.U.; Alghorani, Y.; Delaney, D.T. Improving data quality of low-cost IoT sensors in environmental monitoring networks using data fusion and machine learning approach. ICT Express 2020, 6, 220–228. [Google Scholar] [CrossRef]
  119. Greco, A.; Gundabattini, E.; Solomon, D.G.; Singh Rassiah, R.; Masselli, C. A Review on Geothermal Renewable Energy Systems for Eco-Friendly Air-Conditioning. Energies 2022, 15, 5519. [Google Scholar] [CrossRef]
  120. Li, B.Q.; Zheng, S.Y. Application research of intelligent monitoring system of longsheng hot spring water temperature based on Internet of Things. Therm. Sci. 2019, 23, 2613–2622. [Google Scholar] [CrossRef] [Green Version]
  121. Chang, V.; Martin, C. An industrial IoT sensor system for high-temperature measurement. Comput. Electr. Eng. 2021, 95, 107439. [Google Scholar] [CrossRef]
  122. Onumanyi, A.J.; Abu-Mahfouz, A.M.; Hancke, G.P. Low power wide area network, cognitive radio and the Internet of Things: Potentials for integration. Sensors 2020, 20, 6837. [Google Scholar] [CrossRef]
  123. Liu, Y.; Dhakal, S. Internet of Things technology in mineral remote sensing monitoring. Int. J. Circuit Theory Appl. 2020, 48, 2065–2077. [Google Scholar] [CrossRef]
Figure 1. Scheme of the article: sensing parameters in underground structures, IoT technology and cloud processing.
Sensors 23 05577 g001
Figure 2. Block diagram of a calorimeter setup.
Sensors 23 05577 g002
Figure 3. Orifice plate installed at a geothermal well.
Sensors 23 05577 g003
Figure 4. Compression load cell method: An installation in a geothermal pipeline. (a) The load sensor is positioned above a platform. (b) The load sensor is positioned above an object.
Sensors 23 05577 g004
Figure 5. IoT architecture and application domains.
Sensors 23 05577 g005
Figure 6. Block diagram of a typical IoT solution.
Sensors 23 05577 g006
Figure 7. Cloud model types: on premises, infrastructure as a service, platform as a service and software as a service.
Sensors 23 05577 g007
Figure 8. Research challenges for various problematic areas.
Sensors 23 05577 g008
Table 1. Overview of surveys related to monitoring underground geothermal structures.
Author, SourceMonitored ParametersGeothermal StructureArticle ContentIoT
Aranzabal et al. [13]TemperatureVertical borehole heat exchangerComparison of methodsNo
Sanjuan et al. [14]Temperature and pH measurementsDownholeSensors and equipment dedicated to geothermal applicationsNo
Ukil et al. [15]TemperaturePower plant deviceReview of technology and applicationsNo
Helbig et al. [2]Two-phase flowGeothermal pipelineComparison of methodsNo
Mubarok et al. [1]Two-phase flowGeothermal wellComparison of methodsNo
Yadav et al. [4]SlopeOpen-pit mineReview of WSNs with IoT used for monitoring slopesYes
Muduli et al. [9]Temperature, air humidity, gas analysis, etc.Coal mineReview of monitoring possibilities for underground coal mines based on WSNsYes
Ali et al. [7]Leakage and sinkholeUnderground pipelineReview of methods and WSNs for monitoring leakage and sinkholesYes
Table 2. Overview of technologies applied to temperature measurement in underground geothermal structures.
Author, SourceGeothermal StructureMethodology
McDaniel et al. [16]Geothermal exchange borefieldDTS
Reinsch et al. [17]Geothermal wellDTS
Bense et al. [5]DownholeDTS
Martos et al. [18]Borehole heat exchangerAutonomous wireless sensor
Aranzabal et al. [13]Borehole heat exchangerGeoball and GEOsniff
Table 3. Summary of methods for measuring flow rate in underground geothermal structures.
MethodReal-TimeOut of OperationDirect ContactApplication Location
Ultrasonic meterYesNoNoGeothermal power plant [27],
open Venturi channel [28]
CalorimeterNoYesYesGeothermal well [29]
Sharp-edge orifice plateYesNoYesGeothermal well [1,2]
Tracer dilutionNoNoYesGeothermal well [30,31]
Lip pressureYesYesYesGeothermal well [32]
Venturi tubeYesNoYesGeothermal power plant [33],
geothermal pipeline [34]
Coriolis flow meterYesNoYesOpen Venturi channel [28]
Compression load cellsYesNoNoGeothermal pipeline [35], geothermal well [35]
Separator with orifice plate and silencerYesNoYesGeothermal well [1]
Table 4. Summary of methods for measuring mechanical parameters.
ParameterSensor TypeApplication
Pressure [51]Strain gaugeGeothermal well
Pressure [48]Fibre-opticGeothermal well and reservoir
Slope movement, deformation [4]Tilt sensorBorehole
Scale formation [3]Fibre-opticGeothermal brine
Formation of borehole breakouts [49]Ultrasonic sensorBorehole
Stress [52]Vibrating wire sensorGeothermal or oil drilling well
Table 5. SoA of IoT power supply technologies.
Author, SourcePower Supply TypeApplication
Lin et al. [61]AC power gridAC power monitoring module
Grimsley et al. [10]Primary batteryEnvironmental monitoring
Das et al. [67]Solar panelAir pollution monitoring
Civerchia et al. [62]BatteryIndustrial monitoring
Wang et al. [68]Kinetic energy—vibrationAgricultural industry
Tran et al. [69]Radio frequencyHealthcare, room temperature, tire pressure, implantable devices, environmental monitoring, air quality monitoring
Twaha et al. [70]Thermoelectric generatorIndustrial utilities, transportation tools, military devices, space applications, medical services
Roy et al. [71]WindEnvironmental monitoring, agricultural applications
Table 6. Summary of LPWAN parameters [85,95,97].
LoRaWANSigfoxNB-IoT
Range5–20 km10–40 km1–10 km
BandUnlicensed ISMUnlicensed ISMLicensed LTE
MAC layerALOHA-basedALOHA-basedLTE-based
Payload242 B [86]12 B (UL), 8 B (DL)1600 B
Authentication and encryptionAES-128NoLTE encryption
Adaptive data rateYesNoNo
ModulationLoRa (CSS)DBPSK, GFSKQPSK
Transmission speed50 kbps100 bps200 kbps
Deployment modelProvider, privateProviderProvider
Adaptive data rateYesNoNo
TopologyStar, mesh, P2PStarStar
StandardizationLoRa AllianceSigfox company with ETSI3GPP
Power consumptionLowLowHigh
Interference immunityVery highVery highLow
Table 7. Summary of parameters and features offered by major cloud providers.
AWS IoTIBMAzure IoTGCP
ConnectivityMQTT, HTTPS, LoRaWANHTTP, MQTTMQTT, AMQP, HTTPSMQTT, HTTP
SecurityTLSTLSTLSTLS
Data storageMongoDB, Amazon DynamoDBIBM cloud object/block/file storageAzure storageGoogle Cloud Storage, Cloud Bigtable, Cloud SQL
Microservicesyesyesyesyes
SDK/LanguageC++, Python, JavaScript, Java, Embedded C.NET, Python, Java, NodeJS.Net and UWP, Python Java, C, NodeJSC++, Python, Java, NodeJS, Go
Table 8. SoA for edge computing methods.
Author, SourceApplication
Early warning systems
Kim et. al. [105]Real-time scour warning system for railway bridges using remote ambient vibration monitoring.
Dai et. al. [106]IoT framework for electrical fire monitoring at ancient architectural complex.
Bassetti et. al. [107]Edge computing early warning system for earthquakes. Local probes detect quakes.
Data compression
Rivet et. al. [108]Edge computing polynomial regression data compression method for environmental monitoring.
Debski et. al. [109]Edge computing study of autonomous vehicles and robots concerning with online compression.
Table 9. Comparison of Telemetry Systems and IoT Devices.
FactorsTelemetry SystemsIoT Devices
Ease of Installation and MaintenanceComplex, requiring specialized equipment and expertiseRelatively easy, designed for plug-and-play operation
CostsExpensive, especially in remote locationsRelatively inexpensive, deployable in large numbers
Volume of InformationLimited data on a few parametersComprehensive data from multiple sensors
Transfer Rate RequirementsHigh transfer rate for real-time data transmissionWireless data transmission, reduced transfer rate requirements
Environmental ConditionsDesigned to withstand harsh conditionsImpact from temperature, humidity, and corrosion
Operational RangeLonger range, suitable for monitoring large areas or remote locationsLimited range
Device ReplacementDifficult, especially in remote locationsEasily replaced, plug-and-play operation
Table 10. Undesirable states and potential solutions.
Undesirable StateSolution
Thermal imbalanceMonitoring of individual boreholes
Absence of turbulent fluid flowHigher flow rate or pipes with spiral ribbing (to address low flow rates)
Unforced operation of the heat pump during coolingHeat pump not operational during cooling
Critical stress changeTemperature monitoring of critical limits with adequate reduction of flow rate
Volumetric change in concrete in pileApplication of pressure cell monitoring at the head of the pile between the pile and concrete slab
Table 11. List of parameters whose monitoring could aid in producing improved designs for future applications.
Monitored ParameterMonitoring Purpose
Flow rate at each boreholeTechno-economic optimization (selection of suitable pipe diameters and energy consumption)
Temperature at each boreholeOptimization of designs for well depth
Table 12. List of energy harvesting methods suitable for powering sensors used to monitor underground geothermal structure parameters.
Energy Harvesting MethodApplicationFeatures
Thermoelectric generatorUnderground IoTFixed to the current technology
Water pipeline energy harvestingIoT sensors near pipesInside pipe
Solar and windIoT sensors located on the groundExternal technology
Table 13. Summary of edge computing techniques.
Edge Computing TechniqueApplication
Metadata analysisEarly warning systems, hazardous state monitoring
Data compressionIoT monitoring
Disclaimer/Publisher’s Note: The statements, opinions and data contained in all publications are solely those of the individual author(s) and contributor(s) and not of MDPI and/or the editor(s). MDPI and/or the editor(s) disclaim responsibility for any injury to people or property resulting from any ideas, methods, instructions or products referred to in the content.

