


Multiscale Entropy Algorithms to Analyze Complexity and Variability of Trunk Accelerations Time Series in Subjects with Parkinson’s Disease
 ,
,  , ,
, ,  , , , and
Abstract
1. Introduction
2. Materials and Methods
2.1. Subjects
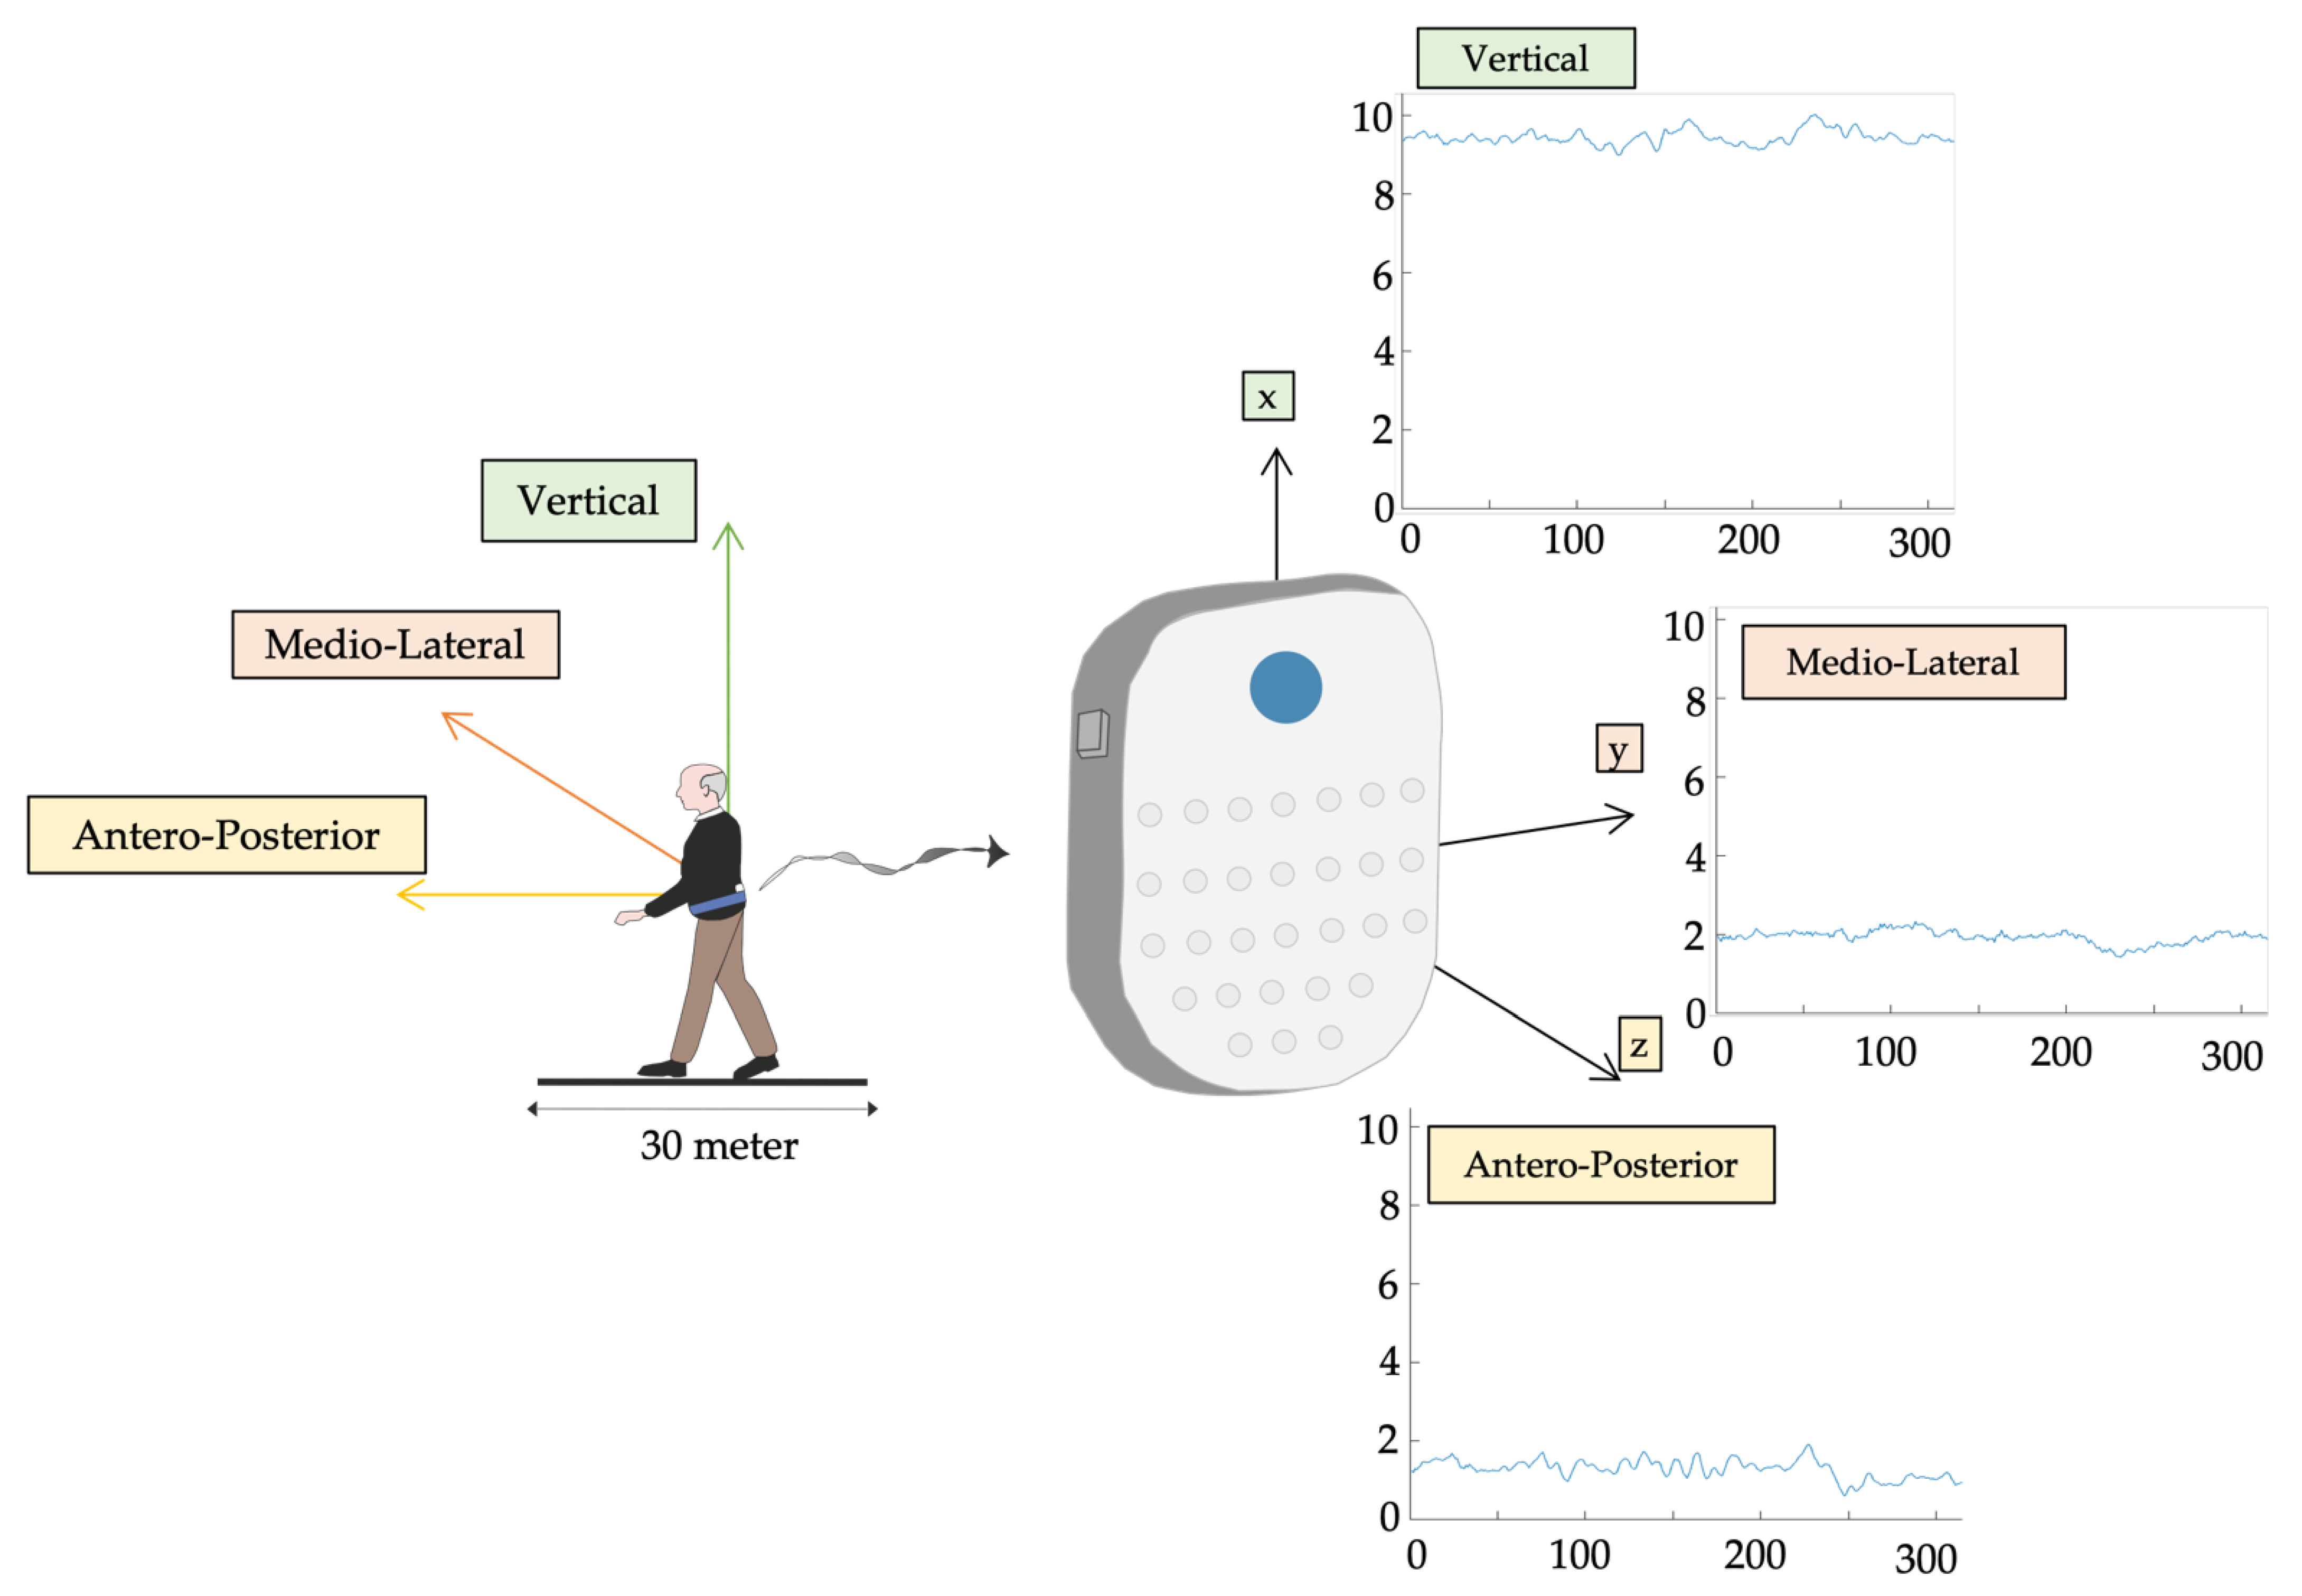
2.2. Procedures
2.3. Entropy Algorithms
2.3.1. Multiscale Entropy (MSE)
- 1.
- There will be correspondence if the distance between two vectors (xmi, xmj) is smaller than a predefined tolerance r. The distance between the two vectors was calculated using the norm of infinity:
- 2.
- If was less than or equal to the predefined tolerance r, we defined (xmi, xmj) a pair of m-dimensional matched vectors. Total number of pairs of m-dimensional matched vectors, given nm.
- 3.
- We repeated steps 1–3 for m = m + 1, where nm+1 represents the total number of (m + 1) dimensional matched vector pairs as shown in Figure 3.
- 4.
- The SampEn was defined as the logarithm of the ratio of to as in Equation (3):
2.3.2. Refined Composite Multiscale Entropy (RCMSE)
- (1)
- To obtain coarse-grained time series on different time scales, we utilized the coarse-graining process indicated in Equation (4).
- (2)
- For all coarse-grained series, the number of matched vector pairs, and , was determined at a scale factor of .
- (3)
- For , let denote the mean of . Equation (7) provides the RCMSE value at a scale factor of .where and .
2.3.3. Complexity Index (CI)
2.4. Clinical Assessment
2.5. Statistical Analysis
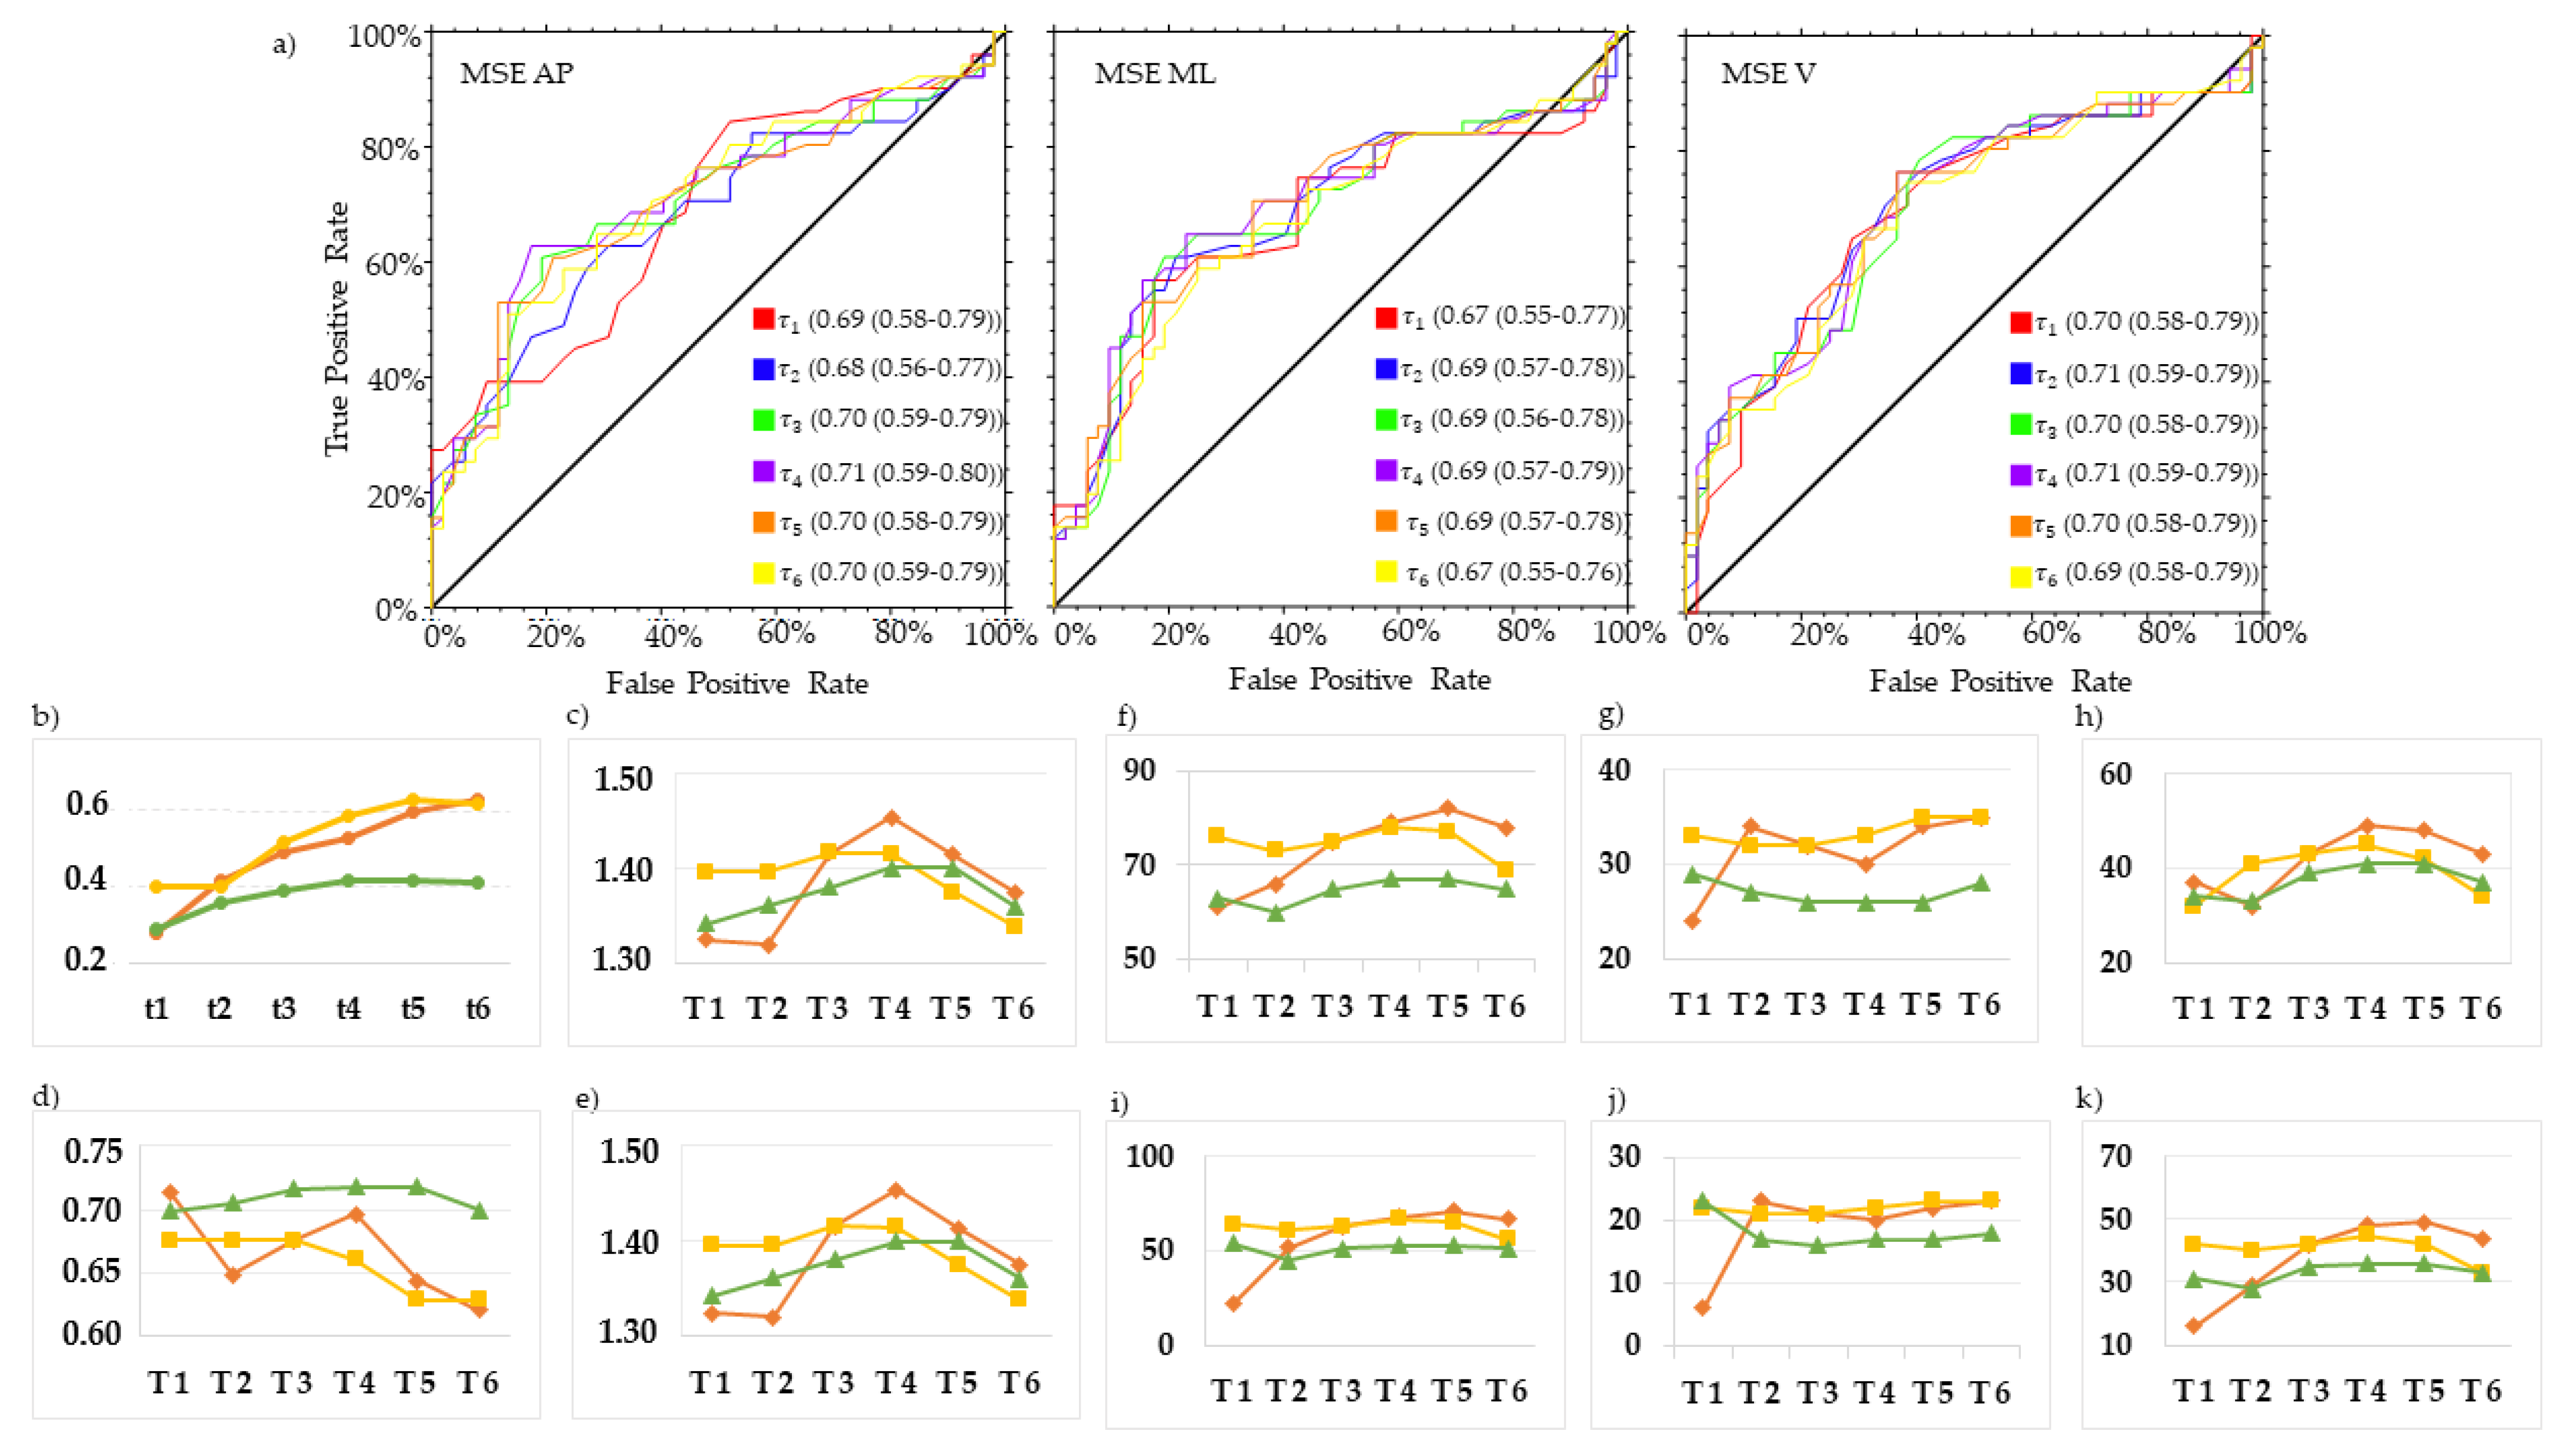
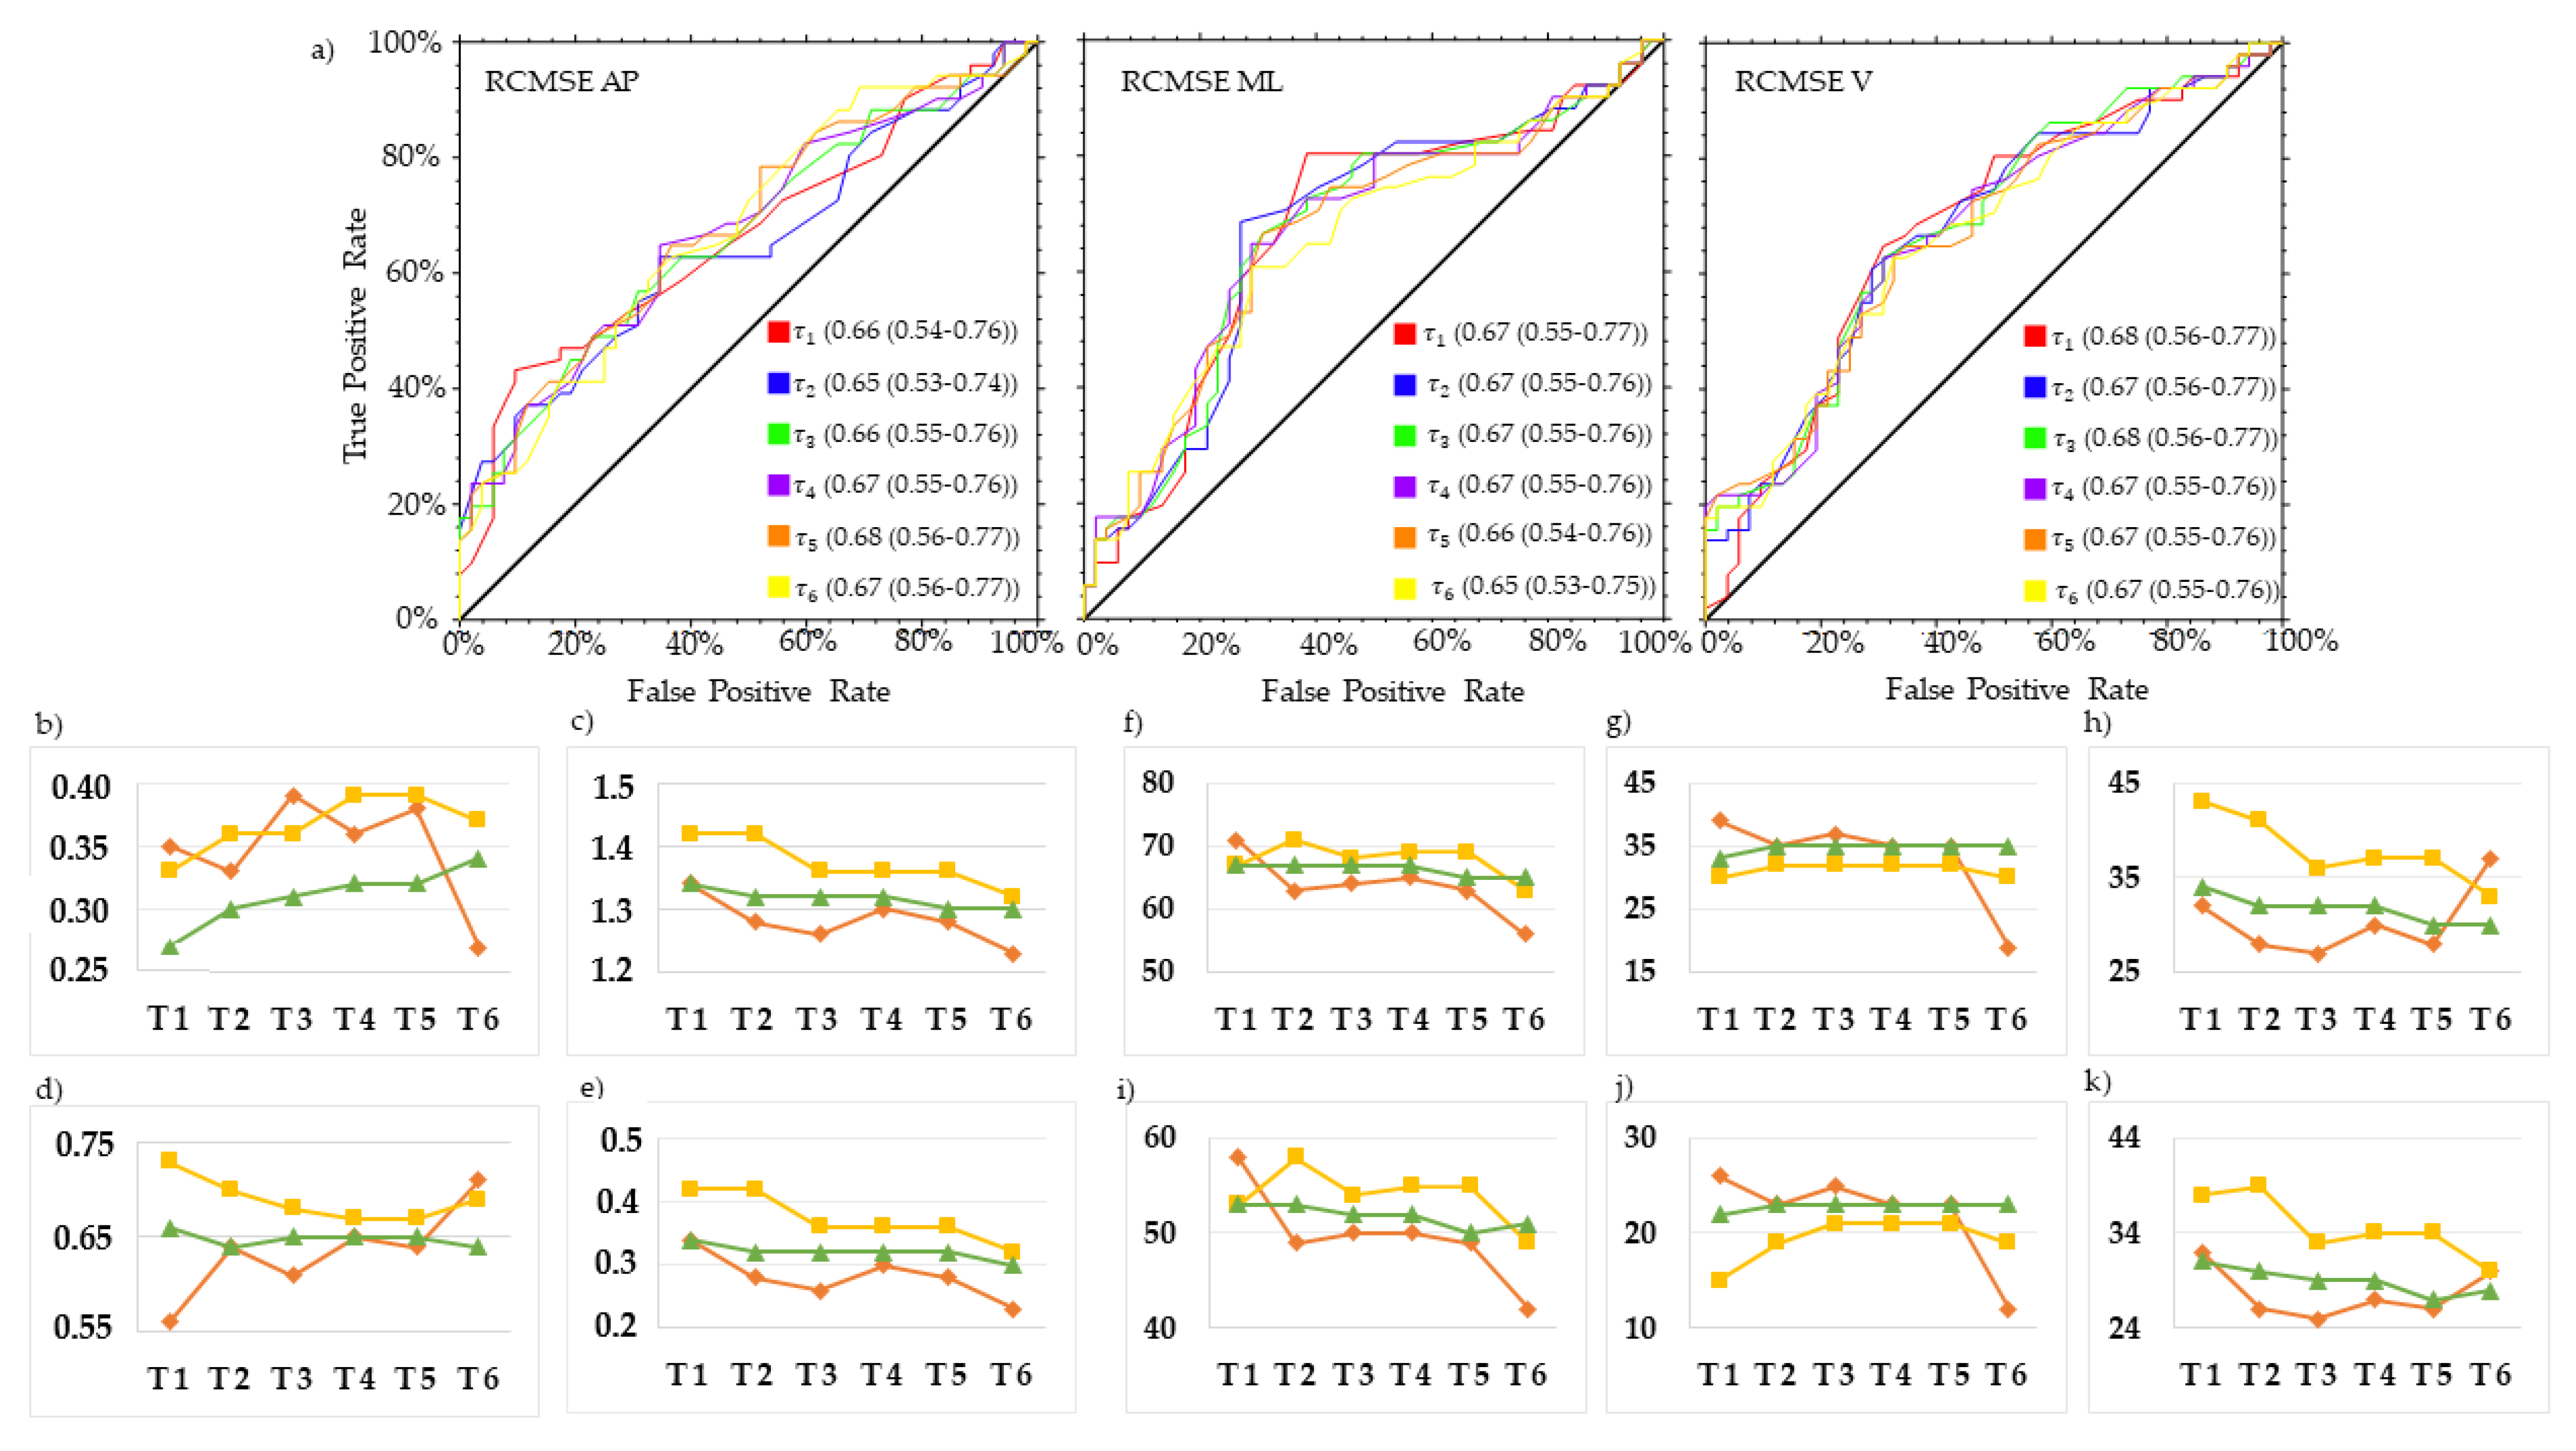
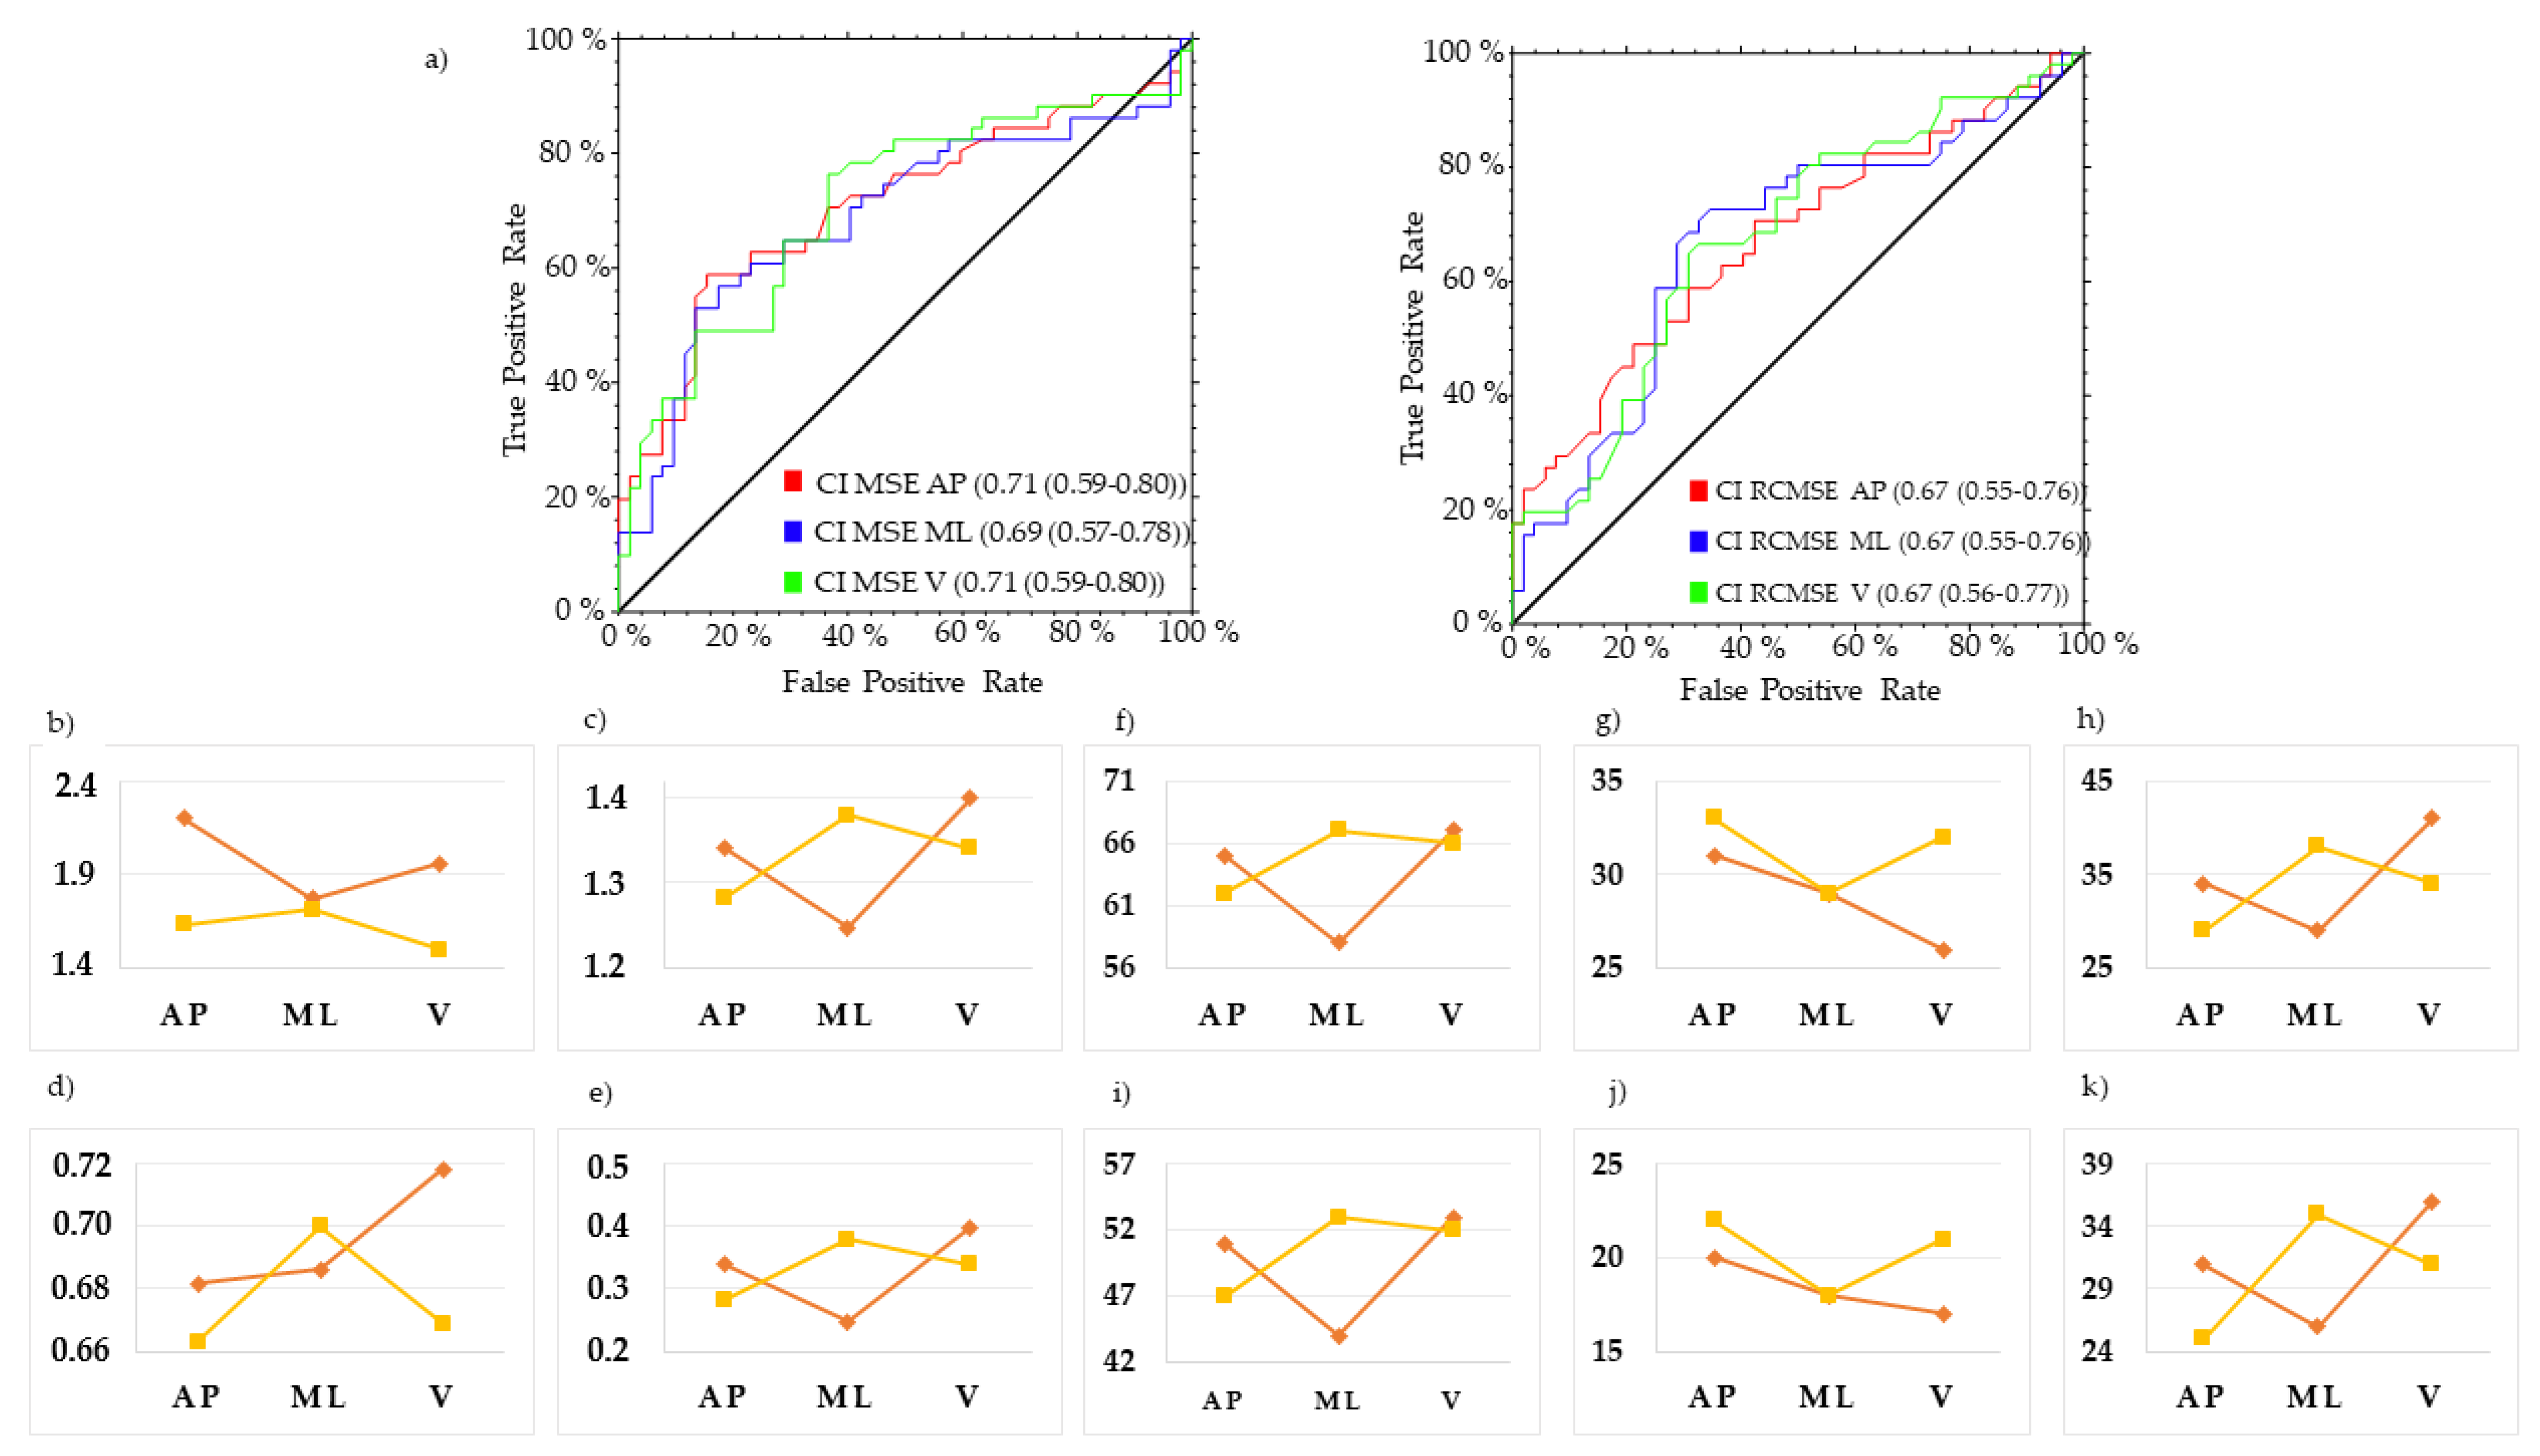
3. Results
4. Discussion
Supplementary Materials
Author Contributions
Funding
Institutional Review Board Statement
Informed Consent Statement
Data Availability Statement
Conflicts of Interest
References
- Mirelman, A.; Bonato, P.; Camicioli, R.; Ellis, T.D.; Giladi, N.; Hamilton, J.L.; Hass, C.J.; Hausdorff, J.M.; Pelosin, E.; Almeida, Q.J. Gait Impairments in Parkinson’s Disease. Lancet. Neurol. 2019, 18, 697–708. [Google Scholar] [CrossRef] [PubMed]
- Fasano, A.; Canning, C.G.; Hausdorff, J.M.; Lord, S.; Rochester, L. Falls in Parkinson’s Disease: A Complex and Evolving Picture. Mov. Disord. 2017, 32, 1524–1536. [Google Scholar] [CrossRef] [PubMed]
- Bouça-Machado, R.; Jalles, C.; Guerreiro, D.; Pona-Ferreira, F.; Branco, D.; Guerreiro, T.; Matias, R.; Ferreira, J.J. Gait Kinematic Parameters in Parkinson’s Disease: A Systematic Review. J. Parkinsons. Dis. 2020, 10, 843–853. [Google Scholar] [CrossRef] [PubMed]
- Allen, N.E.; Canning, C.G.; Almeida, L.R.S.; Bloem, B.R.; Keus, S.H.J.; Löfgren, N.; Nieuwboer, A.; Verheyden, G.S.A.F.; Yamato, T.P.; Sherrington, C. Interventions for Preventing Falls in Parkinson’s Disease. Cochrane Database Syst. Rev. 2022, 6, CD011574. [Google Scholar] [CrossRef] [PubMed]
- Ma, L.; Mi, T.M.; Jia, Q.; Han, C.; Chhetri, J.K.; Chan, P. Gait Variability Is Sensitive to Detect Parkinson’s Disease Patients at High Fall Risk. Int. J. Neurosci. 2022, 132, 888–893. [Google Scholar] [CrossRef] [PubMed]
- Hausdorff, J.M. Gait Dynamics in Parkinson’s Disease: Common and Distinct Behavior among Stride Length, Gait Variability, and Fractal-like Scaling. Chaos 2009, 19, 026113. [Google Scholar] [CrossRef]
- Bryant, M.S.; Rintala, D.H.; Hou, J.G.; Collins, R.L.; Protas, E.J. Gait Variability in Parkinson’s Disease: Levodopa and Walking Direction. Acta Neurol. Scand. 2016, 134, 83–86. [Google Scholar] [CrossRef]
- Hausdorff, J.M.; Cudkowicz, M.E.; Firtion, R.; Wei, J.Y.; Goldberger, A.L. Gait Variability and Basal Ganglia Disorders: Stride-to-Stride Variations of Gait Cycle Timing in Parkinson’s Disease and Huntington’s Disease. Mov. Disord. 1998, 13, 428–437. [Google Scholar] [CrossRef]
- Plotnik, M.; Giladi, N.; Hausdorff, J.M. A New Measure for Quantifying the Bilateral Coordination of Human Gait: Effects of Aging and Parkinson’s Disease. Exp. Brain Res. 2007, 181, 561–570. [Google Scholar] [CrossRef]
- Kroneberg, D.; Elshehabi, M.; Meyer, A.C.; Otte, K.; Doss, S.; Paul, F.; Nussbaum, S.; Berg, D.; Kühn, A.A.; Maetzler, W.; et al. Less Is More—Estimation of the Number of Strides Required to Assess Gait Variability in Spatially Confined Settings. Front. Aging Neurosci. 2019, 11, 435. [Google Scholar] [CrossRef]
- Trabassi, D.; Serrao, M.; Varrecchia, T.; Ranavolo, A.; Coppola, G.; De Icco, R.; Tassorelli, C.; Castiglia, S.F. Machine Learning Approach to Support the Detection of Parkinson’s Disease in IMU-Based Gait Analysis. Sensors 2022, 22, 3700. [Google Scholar] [CrossRef] [PubMed]
- Varrecchia, T.; Castiglia, S.F.; Ranavolo, A.; Conte, C.; Tatarelli, A.; Coppola, G.; Di Lorenzo, C.; Draicchio, F.; Pierelli, F.; Serrao, M. An Artificial Neural Network Approach to Detect Presence and Severity of Parkinson’s Disease via Gait Parameters. PLoS ONE 2021, 16, e0244396. [Google Scholar] [CrossRef] [PubMed]
- Castiglia, S.F.; Tatarelli, A.; Trabassi, D.; De Icco, R.; Grillo, V.; Ranavolo, A.; Varrecchia, T.; Magnifica, F.; Di Lenola, D.; Coppola, G.; et al. Ability of a Set of Trunk Inertial Indexes of Gait to Identify Gait Instability and Recurrent Fallers in Parkinson’s Disease. Sensors 2021, 21, 3449. [Google Scholar] [CrossRef] [PubMed]
- Gandolfi, M.; Tinazzi, M.; Magrinelli, F.; Busselli, G.; Dimitrova, E.; Polo, N.; Manganotti, P.; Fasano, A.; Smania, N.; Geroin, C. Four-Week Trunk-Specific Exercise Program Decreases Forward Trunk Flexion in Parkinson’s Disease: A Single-Blinded, Randomized Controlled Trial. Park. Relat. Disord. 2019, 64, 268–274. [Google Scholar] [CrossRef]
- Safarpour, D.; Dale, M.L.; Shah, V.V.; Talman, L.; Carlson-Kuhta, P.; Horak, F.B.; Mancini, M. Surrogates for Rigidity and PIGD MDS-UPDRS Subscores Using Wearable Sensors. Gait Posture 2022, 91, 186–191. [Google Scholar] [CrossRef]
- Borzì, L.; Mazzetta, I.; Zampogna, A.; Suppa, A.; Irrera, F.; Olmo, G. Predicting Axial Impairment in Parkinson’s Disease through a Single Inertial Sensor. Sensors 2022, 22, 412. [Google Scholar] [CrossRef]
- Serrao, M.; Chini, G.; Caramanico, G.; Bartolo, M.; Castiglia, S.F.; Ranavolo, A.; Conte, C.; Venditto, T.; Coppola, G.; Di Lorenzo, C.; et al. Prediction of Responsiveness of Gait Variables to Rehabilitation Training in Parkinson’s Disease. Front. Neurol. 2019, 10, 826. [Google Scholar] [CrossRef]
- Serrao, M.; Ranavolo, A.; Conte, C.; Davassi, C.; Mari, S.; Fasano, A.; Chini, G.; Coppola, G.; Draicchio, F.; Pierelli, F. Effect of 24-h Continuous Rotigotine Treatment on Stationary and Non-Stationary Locomotion in de Novo Patients with Parkinson Disease in an Open-Label Uncontrolled Study. J. Neurol. 2015, 262, 2539–2547. [Google Scholar] [CrossRef]
- Serrao, M.; Pierelli, F.; Sinibaldi, E.; Chini, G.; Castiglia, S.F.; Priori, M.; Gimma, D.; Sellitto, G.; Ranavolo, A.; Conte, C.; et al. Progressive Modular Rebalancing System and Visual Cueing for Gait Rehabilitation in Parkinson’s Disease: A Pilot, Randomized, Controlled Trial With Crossover. Front. Neurol. 2019, 10, 902. [Google Scholar] [CrossRef]
- Castiglia, S.F.; Trabassi, D.; De Icco, R.; Tatarelli, A.; Avenali, M.; Corrado, M.; Grillo, V.; Coppola, G.; Denaro, A.; Tassorelli, C.; et al. Harmonic Ratio Is the Most Responsive Trunk-Acceleration Derived Gait Index to Rehabilitation in People with Parkinson’s Disease at Moderate Disease Stages. Gait Posture 2022, 97, 152–158. [Google Scholar] [CrossRef]
- Putortì, A.; Corrado, M.; Avenali, M.; Martinelli, D.; Allena, M.; Cristina, S.; Grillo, V.; Martinis, L.; Tamburin, S.; Serrao, M.; et al. The Effects of Intensive Neurorehabilitation on Sequence Effect in Parkinson’s Disease Patients With and Without Freezing of Gait. Front. Neurol. 2021, 12, 723468. [Google Scholar] [CrossRef]
- Bartolo, M.; Serrao, M.; Tassorelli, C.; Don, R.; Ranavolo, A.; Draicchio, F.; Pacchetti, C.; Buscone, S.; Perrotta, A.; Furnari, A.; et al. Four-Week Trunk-Specific Rehabilitation Treatment Improves Lateral Trunk Flexion in Parkinson’s Disease. Mov. Disord. 2010, 25, 325–331. [Google Scholar] [CrossRef]
- Castiglia, S.F.; Trabassi, D.; Tatarelli, A.; Ranavolo, A.; Varrecchia, T.; Fiori, L.; Di Lenola, D.; Cioffi, E.; Raju, M.; Coppola, G.; et al. Identification of Gait Unbalance and Fallers Among Subjects with Cerebellar Ataxia by a Set of Trunk Acceleration-Derived Indices of Gait. Cerebellum 2022, 22, 46–58. [Google Scholar] [CrossRef]
- Brognara, L.; Palumbo, P.; Grimm, B.; Palmerini, L. Assessing Gait in Parkinson’s Disease Using Wearable Motion Sensors: A Systematic Review. Diseases 2019, 7, 18. [Google Scholar] [CrossRef] [PubMed]
- Hubble, R.P.; Naughton, G.; Silburn, P.A.; Cole, M.H. Trunk Exercises Improve Gait Symmetry in Parkinson Disease: A Blind Phase II Randomized Controlled Trial. Am. J. Phys. Med. Rehabil. 2018, 97, 151–159. [Google Scholar] [CrossRef] [PubMed]
- Caliandro, P.; Conte, C.; Iacovelli, C.; Tatarelli, A.; Castiglia, S.F.; Reale, G.; Serrao, M. Exploring Risk of Falls and Dynamic Unbalance in Cerebellar Ataxia by Inertial Sensor Assessment. Sensors 2019, 19, 5571. [Google Scholar] [CrossRef] [PubMed]
- Fujiwara, S.; Sato, S.; Sugawara, A.; Nishikawa, Y.; Koji, T.; Nishimura, Y.; Ogasawara, K. The Coefficient of Variation of Step Time Can Overestimate Gait Abnormality: Test-Retest Reliability of Gait-Related Parameters Obtained with a Tri-Axial Accelerometer in Healthy Subjects. Sensors 2020, 20, 577. [Google Scholar] [CrossRef]
- Tamburini, P.; Storm, F.; Buckley, C.; Bisi, M.C.; Stagni, R.; Mazzà, C. Moving from Laboratory to Real Life Conditions: Influence on the Assessment of Variability and Stability of Gait. Gait Posture 2018, 59, 248–252. [Google Scholar] [CrossRef] [PubMed]
- Lord, S.; Baker, K.; Nieuwboer, A.; Burn, D.; Rochester, L. Gait Variability in Parkinson’s Disease: An Indicator of Non-Dopaminergic Contributors to Gait Dysfunction? J. Neurol. 2011, 258, 566–572. [Google Scholar] [CrossRef]
- Del Din, S.; Galna, B.; Godfrey, A.; Bekkers, E.M.J.; Pelosin, E.; Nieuwhof, F.; Mirelman, A.; Hausdorff, J.M.; Rochester, L. Analysis of Free-Living Gait in Older Adults with and without Parkinson’s Disease and with and without a History of Falls: Identifying Generic and Disease-Specific Characteristics. J. Gerontol. Ser. A 2019, 74, 500–506. [Google Scholar] [CrossRef]
- Bovonsunthonchai, S.; Vachalathiti, R.; Pisarnpong, A.; Khobhun, F.; Hiengkaew, V. Spatiotemporal Gait Parameters for Patients with Parkinson’s Disease Compared with Normal Individuals. Physiother. Res. Int. 2014, 19, 158–165. [Google Scholar] [CrossRef] [PubMed]
- Riva, F.; Toebes, M.J.P.; Pijnappels, M.; Stagni, R.; van Dieën, J.H. Estimating Fall Risk with Inertial Sensors Using Gait Stability Measures That Do Not Require Step Detection. Gait Posture 2013, 38, 170–174. [Google Scholar] [CrossRef] [PubMed]
- Trojaniello, D.; Ravaschio, A.; Hausdorff, J.M.; Cereatti, A. Comparative Assessment of Different Methods for the Estimation of Gait Temporal Parameters Using a Single Inertial Sensor: Application to Elderly, Post-Stroke, Parkinson’s Disease and Huntington’s Disease Subjects. Gait Posture 2015, 42, 310–316. [Google Scholar] [CrossRef]
- López, A.M.; Álvarez, D.; González, R.C.; Álvarez, J.C. Validity of Four Gait Models to Estimate Walked Distance from Vertical COG Acceleration. J. Appl. Biomech. 2008, 24, 360–367. [Google Scholar] [CrossRef] [PubMed]
- González, R.C.; López, A.M.; Rodriguez-Uría, J.; Álvarez, D.; Alvarez, J.C. Real-Time Gait Event Detection for Normal Subjects from Lower Trunk Accelerations. Gait Posture 2010, 31, 322–325. [Google Scholar] [CrossRef] [PubMed]
- Riva, F.; Grimpampi, E.; Mazzà, C.; Stagni, R. Are Gait Variability and Stability Measures Influenced by Directional Changes? Biomed. Eng. Online 2014, 13, 56. [Google Scholar] [CrossRef]
- Bisi, M.C.; Stagni, R. Complexity of Human Gait Pattern at Different Ages Assessed Using Multiscale Entropy: From Development to Decline. Gait Posture 2016, 47, 37–42. [Google Scholar] [CrossRef]
- Amirpourabasi, A.; Lamb, S.E.; Chow, J.Y.; Williams, G.K.R. Nonlinear Dynamic Measures of Walking in Healthy Older Adults: A Systematic Scoping Review. Sensors 2022, 22, 4408. [Google Scholar] [CrossRef]
- Dingwell, J.B.; Cusumano, J.P. Nonlinear Time Series Analysis of Normal and Pathological Human Walking. Chaos 2000, 10, 848–863. [Google Scholar] [CrossRef]
- Yentes, J.M.; Raffalt, P.C. Entropy Analysis in Gait Research—Methodological and Recommendations. Ann. Biomed. Eng. 2021, 49, 979. [Google Scholar] [CrossRef]
- Raffalt, P.C.; Denton, W.; Yentes, J.M. On the Choice of Multiscale Entropy Algorithm for Quantification of Complexity in Gait Data. Comput. Biol. Med. 2018, 103, 93–100. [Google Scholar] [CrossRef] [PubMed]
- Pincus, S.M. Approximate Entropy as a Measure of System Complexity. Proc. Natl. Acad. Sci. USA 1991, 88, 2297–2301. [Google Scholar] [CrossRef] [PubMed]
- Richman, J.S.; Moorman, J.R. Physiological Time-Series Analysis Using Approximate Entropy and Sample Entropy. Am. J. Physiol. Heart Circ. Physiol. 2000, 278, H2039–H2049. [Google Scholar] [CrossRef]
- Costa, M.; Goldberger, A.L.; Peng, C.K. Multiscale Entropy Analysis of Complex Physiologic Time Series. Phys. Rev. Lett. 2002, 89, 068102. [Google Scholar] [CrossRef]
- de Carvalho Costa, E.; Santinelli, F.B.; Moretto, G.F.; Figueiredo, C.; von Ah Morano, A.E.; Barela, J.A.; Barbieri, F.A. A Multiple Domain Postural Control Assessment in People with Parkinson’s Disease: Traditional, Non-Linear, and Rambling and Trembling Trajectories Analysis. Gait Posture 2022, 97, 130–136. [Google Scholar] [CrossRef]
- Mengarelli, A.; Tigrini, A.; Verdini, F.; Rabini, R.A.; Fioretti, S. Multiscale Fuzzy Entropy Analysis of Balance: Evidences of Scale-Dependent Dynamics on Diabetic Patients with and without Neuropathy. IEEE Trans. Neural Syst. Rehabil. Eng. 2023, 31, 1462–1471. [Google Scholar] [CrossRef]
- Leverick, G.; Szturm, T.; Wu, C.Q. Using Entropy Measures to Characterize Human Locomotion. J. Biomech. Eng. 2014, 136, 121002. [Google Scholar] [CrossRef]
- Bisi, M.C.; Riva, F.; Stagni, R. Measures of Gait Stability: Performance on Adults and Toddlers at the Beginning of Independent Walking. J. Neuroeng. Rehabil. 2014, 11, 131. [Google Scholar] [CrossRef]
- Coates, L.; Shi, J.; Rochester, L.; Del Din, S.; Pantall, A. Entropy of Real-World Gait in Parkinson’s Disease Determined from Wearable Sensors as a Digital Marker of Altered Ambulatory Behavior. Sensors 2020, 20, 2631. [Google Scholar] [CrossRef]
- Montesinos, L.; Castaldo, R.; Pecchia, L. On the Use of Approximate Entropy and Sample Entropy with Centre of Pressure Time-Series. J. Neuroeng. Rehabil. 2018, 15, 116. [Google Scholar] [CrossRef]
- Aboy, M.; Cuesta-Frau, D.; Austin, D.; Micó-Tormos, P. Characterization of Sample Entropy in the Context of Biomedical Signal Analysis. In Proceedings of the 2007 29th Annual International Conference of the IEEE Engineering in Medicine and Biology Society, Lyon, France, 22–26 August 2007; pp. 5942–5945. [Google Scholar] [CrossRef]
- Yentes, J.M.; Hunt, N.; Schmid, K.K.; Kaipust, J.P.; McGrath, D.; Stergiou, N. The Appropriate Use of Approximate Entropy and Sample Entropy with Short Data Sets. Ann. Biomed. Eng. 2013, 41, 349–365. [Google Scholar] [CrossRef] [PubMed]
- Costa, M.; Peng, C.-K.; Goldberger, A.L.; Hausdorr, J.M. Multiscale Entropy Analysis of Human Gait Dynamics. Physica A 2003, 330, 53–60. [Google Scholar] [CrossRef] [PubMed]
- Thuraisingham, R.A.; Gottwald, G.A. On Multiscale Entropy Analysis for Physiological Data. Phys. A Stat. Mech. Its Appl. 2006, 366, 323–332. [Google Scholar] [CrossRef]
- Peng, C.K.; Costa, M.; Goldberger, A.L. Adaptive Data Analysis of Complex Fluctuations in Physiologic Time Series. Adv. Adapt. Data Anal. 2009, 1, 61–70. [Google Scholar] [CrossRef]
- Hsieh, Y.L.; Abbod, M.F. Gait Analyses of Parkinson’s Disease Patients Using Multiscale Entropy. Electron. 2021, 10, 2604. [Google Scholar] [CrossRef]
- Bizovska, L.; Svoboda, Z.; Vuillerme, N.; Janura, M. Multiscale and Shannon Entropies during Gait as Fall Risk Predictors-A Prospective Study. Gait Posture 2017, 52, 5–10. [Google Scholar] [CrossRef]
- Bisi, M.C.; Di Marco, R.; Ragona, F.; Darra, F.; Vecchi, M.; Masiero, S.; Del Felice, A.; Stagni, R. Quantitative Characterization of Motor Control during Gait in Dravet Syndrome Using Wearable Sensors: A Preliminary Study. Sensors 2022, 22, 2140. [Google Scholar] [CrossRef]
- Bizovska, L.; Svoboda, Z.; Kubonova, E.; Vuillerme, N.; Hirjakova, Z.; Janura, M. The Differences between Overground and Treadmill Walking in Nonlinear, Entropy-Based and Frequency Variables Derived from Accelerometers in Young and Older Women—Preliminary Report. Acta Bioeng. Biomech. 2018, 20, 93–100. [Google Scholar] [CrossRef]
- Riva, F.; Bisi, M.C.; Stagni, R. Gait Variability and Stability Measures: Minimum Number of Strides and within-Session Reliability. Comput. Biol. Med. 2014, 50, 9–13. [Google Scholar] [CrossRef]
- Wu, S.D.; Wu, C.W.; Lin, S.G.; Lee, K.Y.; Peng, C.K. Analysis of Complex Time Series Using Refined Composite Multiscale Entropy. Phys. Lett. A 2014, 378, 1369–1374. [Google Scholar] [CrossRef]
- Combs-Miller, S.A.; Dugan, E.L.; Beachy, A.; Derby, B.B.; Hosinski, A.L.; Robbins, K. Physiological Complexity of Gait between Regular and Non-Exercisers with Parkinson’s Disease. Clin. Biomech. 2019, 68, 23–28. [Google Scholar] [CrossRef] [PubMed]
- Powell, D.W.; Blackmore, S.E.; Puppa, M.; Lester, D.; Murray, N.G.; Reed-Jones, R.J.; Xia, R.P. Deep Brain Stimulation Enhances Movement Complexity during Gait in Individuals with Parkinson’s Disease. Neurosci. Lett. 2020, 728, 133588. [Google Scholar] [CrossRef] [PubMed]
- Ahmadi, S.; Siragy, T.; Nantel, J. Regularity of Kinematic Data between Single and Dual-Task Treadmill Walking in People with Parkinson’s Disease. J. Neuroeng. Rehabil. 2021, 18, 20. [Google Scholar] [CrossRef] [PubMed]
- Sylos Labini, F.; Meli, A.; Ivanenko, Y.P.; Tufarelli, D. Recurrence Quantification Analysis of Gait in Normal and Hypovestibular Subjects. Gait Posture 2012, 35, 48–55. [Google Scholar] [CrossRef] [PubMed]
- Ramdani, S.; Seigle, B.; Varoqui, D.; Bouchara, F.; Blain, H.; Bernard, P. Characterizing the Dynamics of Postural Sway in Humans Using Smoothness and Regularity Measures. Ann. Biomed. Eng. 2010, 39, 161–171. [Google Scholar] [CrossRef]
- Ramdani, S.; Tallon, G.; Bernard, P.L.; Blain, H. Recurrence Quantification Analysis of Human Postural Fluctuations in Older Fallers and Non-Fallers. Ann. Biomed. Eng. 2013, 41, 1713–1725. [Google Scholar] [CrossRef]
- Ahmadi, S.; Sepehri, N.; Wu, C.; Szturm, T. Sample Entropy of Human Gait Center of Pressure Displacement: A Systematic Methodological Analysis. Entropy 2018, 20, 579. [Google Scholar] [CrossRef]
- Fukuchi, C.A.; Fukuchi, R.K.; Duarte, M. Effects of Walking Speed on Gait Biomechanics in Healthy Participants: A Systematic Review and Meta-Analysis. Syst. Rev. 2019, 8, 153. [Google Scholar] [CrossRef]
- Kubota, K.J.; Chen, J.A.; Little, M.A. Machine Learning for Large-Scale Wearable Sensor Data in Parkinson’s Disease: Concepts, Promises, Pitfalls, and Futures. Mov. Disord. 2016, 31, 1314–1326. [Google Scholar] [CrossRef]
- Hughes, A.J.; Daniel, S.E.; Kilford, L.; Lees, A.J. Accuracy of Clinical Diagnosis of Idiopathic Parkinson’s Disease: A Clinico-Pathological Study of 100 Cases. J. Neurol. Neurosurg. Psychiatry 1992, 55, 181–184. [Google Scholar] [CrossRef]
- Hoehn, M.M.; Yahr, M.D. Parkinsonism: Onset, Progression and Mortality. Neurology 1967, 17, 427–442. [Google Scholar] [CrossRef] [PubMed]
- Folstein, M.F.; Folstein, S.E.; McHugh, P.R. “Mini-Mental State”. A Practical Method for Grading the Cognitive State of Patients for the Clinician. J. Psychiatr. Res. 1975, 12, 189–198. [Google Scholar] [CrossRef] [PubMed]
- Perneczky, R.; Wagenpfeil, S.; Komossa, K.; Grimmer, T.; Diehl, J.; Kurz, A. Mapping Scores onto Stages: Mini-Mental State Examination and Clinical Dementia Rating. Am. J. Geriatr. Psychiatry 2006, 14, 139–144. [Google Scholar] [CrossRef] [PubMed]
- Beck, A.T.; Ward, C.H.; Mendelson, M.; Mock, J.; Erbaugh, J. An Inventory for Measuring Depression. Arch. Gen. Psychiatry 1961, 4, 561–571. [Google Scholar] [CrossRef]
- Goodarzi, Z.; Mrklas, K.J.; Roberts, D.J.; Jette, N.; Pringsheim, T.; Holroyd-Leduc, J. Detecting Depression in Parkinson Disease: A Systematic Review and Meta-Analysis. Neurology 2016, 87, 426–437. [Google Scholar] [CrossRef] [PubMed]
- Altman, R.; Alarcón, G.; Appelrouth, D.; Bloch, D.; Borenstein, D.; Brandt, K.; Brown, C.; Cooke, T.D.; Daniel, W.; Feldman, D.; et al. The American College of Rheumatology Criteria for the Classification and Reporting of Osteoarthritis of the Hip. Arthritis Rheum. 1991, 34, 505–514. [Google Scholar] [CrossRef] [PubMed]
- Fitzgerald, G.K.; Hinman, R.S.; Zeni, J.; Risberg, M.A.; Snyder-Mackler, L.; Bennell, K.L. OARSI Clinical Trials Recommendations: Design and Conduct of Clinical Trials of Rehabilitation Interventions for Osteoarthritis. Osteoarthr. Cartil. 2015, 23, 803–814. [Google Scholar] [CrossRef]
- Damen, J.; Van Rijn, R.M.; Emans, P.J.; Hilberdink, W.K.H.A.; Wesseling, J.; Oei, E.H.G.; Bierma-Zeinstra, S.M.A. Prevalence and Development of Hip and Knee Osteoarthritis According to American College of Rheumatology Criteria in the CHECK Cohort. Arthritis Res. Ther. 2019, 21, 4. [Google Scholar] [CrossRef]
- Yao, X.I.; Wang, X.; Speicher, P.J.; Hwang, E.S.; Cheng, P.; Harpole, D.H.; Berry, M.F.; Schrag, D.; Pang, H.H. Reporting and Guidelines in Propensity Score Analysis: A Systematic Review of Cancer and Cancer Surgical Studies. J. Natl. Cancer Inst. 2017, 109, djw323. [Google Scholar] [CrossRef]
- Peterson, D.S.; Mancini, M.; Fino, P.C.; Horak, F.; Smulders, K. Speeding up Gait in Parkinson’s Disease. J. Parkinsons. Dis. 2020, 10, 245–253. [Google Scholar] [CrossRef]
- Huijben, B.; van Schooten, K.S.; van Dieën, J.H.; Pijnappels, M. The Effect of Walking Speed on Quality of Gait in Older Adults. Gait Posture 2018, 65, 112–116. [Google Scholar] [CrossRef] [PubMed]
- Hagoort, I.; Vuillerme, N.; Hortobágyi, T.; Lamoth, C.J. Outcome-Dependent Effects of Walking Speed and Age on Quantitative and Qualitative Gait Measures. Gait Posture 2022, 93, 39–46. [Google Scholar] [CrossRef] [PubMed]
- Lindemann, U. Spatiotemporal Gait Analysis of Older Persons in Clinical Practice and Research: Which Parameters Are Relevant? Z. Gerontol. Geriatr. 2020, 53, 171–178. [Google Scholar] [CrossRef] [PubMed]
- Orter, S.; Ravi, D.K.; Singh, N.B.; Vogl, F.; Taylor, W.R.; Ignasiak, N.K. A Method to Concatenate Multiple Short Time Series for Evaluating Dynamic Behaviour during Walking. PLoS ONE 2019, 14, e0218594. [Google Scholar] [CrossRef]
- Pincus, S.M.; Huang, W.-M. Approximate Entropy: Statistical Properties and Applications. Commun. Stat. Theory Methods 1992, 21, 3061–3077. [Google Scholar] [CrossRef]
- Sarlabous, L.; Torres, A.; Fiz, J.A.; Gea, J.; Martínez-Llorens, J.M.; Morera, J.; Jané, R. Interpretation of the Approximate Entropy Using Fixed Tolerance Values as a Measure of Amplitude Variations in Biomedical Signals. In Proceedings of the 2010 Annual International Conference of the IEEE Engineering in Medicine and Biology, Buenos Aires, Argentina, 31 August–4 September 2010; pp. 5967–5970. [Google Scholar] [CrossRef]
- Govindan, R.B.; Wilson, J.D.; Eswaran, H.; Lowery, C.L.; Preißl, H. Revisiting Sample Entropy Analysis. Phys. A Stat. Mech. Its Appl. 2007, 376, 158–164. [Google Scholar] [CrossRef]
- Humeau-Heurtier, A. The Multiscale Entropy Algorithm and Its Variants: A Review. Entropy 2015, 17, 3110–3123. [Google Scholar] [CrossRef]
- Kang, H.G.; Dingwell, J.B. Differential Changes with Age in Multiscale Entropy of Electromyography Signals from Leg Muscles during Treadmill Walking. PLoS ONE 2016, 11, e0162034. [Google Scholar] [CrossRef]
- Costa, M.; Goldberger, A.L.; Peng, C.K. Multiscale Entropy Analysis of Biological Signals. Phys. Rev. E Stat. Nonlin. Soft Matter Phys. 2005, 71, 021906. [Google Scholar] [CrossRef]
- Goetz, C.G.; Tilley, B.C.; Shaftman, S.R.; Stebbins, G.T.; Fahn, S.; Martinez-Martin, P.; Poewe, W.; Sampaio, C.; Stern, M.B.; Dodel, R.; et al. Movement Disorder Society-Sponsored Revision of the Unified Parkinson’s Disease Rating Scale (MDS-UPDRS): Scale Presentation and Clinimetric Testing Results. Mov. Disord. 2008, 23, 2129–2170. [Google Scholar] [CrossRef]
- Vitorio, R.; Mancini, M.; Carlson-Kuhta, P.; Horak, F.B.; Shah, V.V. Should We Use Both Clinical and Mobility Measures to Identify Fallers in Parkinson’s Disease? Park. Relat. Disord. 2023, 106. [Google Scholar] [CrossRef] [PubMed]
- Paul, S.S.; Allen, N.E.; Sherrington, C.; Heller, G.; Fung, V.S.C.; Close, J.C.T.; Lord, S.R.; Canning, C.G. Risk Factors for Frequent Falls in People with Parkinson’s Disease. J. Parkinsons. Dis. 2014, 4, 699–703. [Google Scholar] [CrossRef] [PubMed]
- Kerr, G.K.; Worringham, C.J.; Cole, M.H.; Lacherez, P.F.; Wood, J.M.; Silburn, P.A. Predictors of Future Falls in Parkinson Disease. Neurology 2010, 75, 116–124. [Google Scholar] [CrossRef] [PubMed]
- Carter, J.V.; Pan, J.; Rai, S.N.; Galandiuk, S. ROC-Ing along: Evaluation and Interpretation of Receiver Operating Characteristic Curves. Surgery 2016, 159, 1638–1645. [Google Scholar] [CrossRef]
- Kallner, A. Bayes’ Theorem, the ROC Diagram and Reference Values: Definition and Use in Clinical Diagnosis. Biochem. Medica 2018, 28, 16–25. [Google Scholar] [CrossRef]
- Baker, J.M. Gait Disorders. Am. J. Med. 2018, 131, 602–607. [Google Scholar] [CrossRef]
- Glas, A.S.; Lijmer, J.G.; Prins, M.H.; Bonsel, G.J.; Bossuyt, P.M.M. The Diagnostic Odds Ratio: A Single Indicator of Test Performance. J. Clin. Epidemiol. 2003, 56, 1129–1135. [Google Scholar] [CrossRef]
- Kent, P.; Hancock, M.J. Interpretation of Dichotomous Outcomes: Sensitivity, Specificity, Likelihood Ratios, and Pre-Test and Post-Test Probability. J. Physiother. 2016, 62, 231–233. [Google Scholar] [CrossRef]
- Martínez-Martín, P.; Rodríguez-Blázquez, C.; Alvarez, M.; Arakaki, T.; Arillo, V.C.; Chaná, P.; Fernández, W.; Garretto, N.; Martínez-Castrillo, J.C.; Rodríguez-Violante, M.; et al. Parkinson’s Disease Severity Levels and MDS-Unified Parkinson’s Disease Rating Scale. Park. Relat. Disord. 2015, 21, 50–54. [Google Scholar] [CrossRef]
- Kamath, C. A Novel Perspective to Assessment of Neurodegenerative Disorder Gait. Sci. Postprint 2015, 1, e00051. [Google Scholar] [CrossRef]
- Bisi, M.C.; Tamburini, P.; Stagni, R. A “Fingerprint” of Locomotor Maturation: Motor Development Descriptors, Reference Development Bands and Data-Set. Gait Posture 2019, 68, 232–237. [Google Scholar] [CrossRef] [PubMed]
- Bisi, M.C.; Stagni, R. Changes of Human Movement Complexity during Maturation: Quantitative Assessment Using Multiscale Entropy. Comput. Methods Biomech. Biomed. Engin. 2018, 21, 325–331. [Google Scholar] [CrossRef] [PubMed]
- Craig, J.J.; Bruetsch, A.P.; Huisinga, J.M. Coordination of Trunk and Foot Acceleration during Gait Is Affected by Walking Velocity and Fall History in Elderly Adults. Aging Clin. Exp. Res. 2019, 31, 943–950. [Google Scholar] [CrossRef] [PubMed]
- Pantall, A.; Del Din, S.; Rochester, L. Longitudinal Changes over Thirty-Six Months in Postural Control Dynamics and Cognitive Function in People with Parkinson’s Disease. Gait Posture 2018, 62, 468–474. [Google Scholar] [CrossRef] [PubMed]
- Creaby, M.W.; Cole, M.H. Gait Characteristics and Falls in Parkinson’s Disease: A Systematic Review and Meta-Analysis. Park. Relat. Disord. 2018, 57, 1–8. [Google Scholar] [CrossRef] [PubMed]
- Latt, M.D.; Menz, H.B.; Fung, V.S.; Lord, S.R. Acceleration Patterns of the Head and Pelvis During Gait in Older People With Parkinson’s Disease: A Comparison of Fallers and Nonfallers. J. Gerontol. Ser. A 2009, 64, 700–706. [Google Scholar] [CrossRef]
- Schlachetzki, J.C.M.; Barth, J.; Marxreiter, F.; Gossler, J.; Kohl, Z.; Reinfelder, S.; Gassner, H.; Aminian, K.; Eskofier, B.M.; Winkler, J.; et al. Wearable Sensors Objectively Measure Gait Parameters in Parkinson’s Disease. PLoS ONE 2017, 12, e0183989. [Google Scholar] [CrossRef]
- Lee, M.; Youm, C.; Noh, B.; Park, H.; Cheon, S.M. Gait Characteristics under Imposed Challenge Speed Conditions in Patients with Parkinson’s Disease During Overground Walking. Sensors 2020, 20, 2132. [Google Scholar] [CrossRef]
- Hamacher, D.; Singh, N.B.; Van Dieën, J.H.; Heller, M.O.; Taylor, W.R. Kinematic Measures for Assessing Gait Stability in Elderly Individuals: A Systematic Review. J. R. Soc. Interface 2011, 8, 1682–1698. [Google Scholar] [CrossRef]
- Valencia, J.F.; Porta, A.; Vallverdú, M.; Clarià, F.; Baranowski, R.; Orlowska-Baranowska, E.; Caminal, P. Multiscale Sample Entropy in Heart Rate Variability of Aortic Stenosis Patients. In Proceedings of the 2008 30th Annual International Conference of the IEEE Engineering in Medicine and Biology Society, Vancouver, BC, Canada, 20–24 August 2008; pp. 2000–2003. [Google Scholar]
- Yentes, J.M.; Denton, W.; McCamley, J.; Raffalt, P.C.; Schmid, K.K. Effect of Parameter Selection on Entropy Calculation for Long Walking Trials. Gait Posture 2018, 60, 128. [Google Scholar] [CrossRef]


| swPD | HS | p | ||
|---|---|---|---|---|
| Age [mean(SD)] | 71.15 (5.12) | 69.14 (4.80) | 0.06 | |
| Gender [n (%)] | F | 15 (29.41) | 27 (54) | 0.01 |
| M | 36 (70.58) | 23 (46) | ||
| Disease duration [mean(SD)] | 8.04 (4.70) | |||
| HY [n (%)] | 1 | 10 (19.60) | ||
| 2 | 17 (33.33) | |||
| 3 | 24 (47.05) | |||
| UPDRS III [mean(SD)] | 41.41 (18.22) | |||
| UPDRS III < 32 [n (%)] | 16 (31.27) | |||
| UPDRS III ≥ 32 [n (%)] | 22 (43.13) | |||
| UPDRS III ≥ 58 [n (%)] | 13 (25.49) | |||
| History of falls (n° of falls in the previous 6 months) [mean (SD)] | 1.35 (3.28) | |||
| Gait speed (m/s) [mean (SD)] | 1.08 (0.25) | 1.09 (0.25) | 0.91 | |
| Stance phase (% gait cycle) [mean (SD)] | 60.82 (2.27) | 61.41 (3.42) | 0.31 | |
| Swing phase (% gait cycle) [mean (SD)] | 39.18 (2.27) | 38.59 (3.42) | 0.31 | |
| Single support (% gait cycle) [mean (SD)] | 39.24 (2.92) | 37.93 (5.29) | 0.13 | |
| Double support (% gait cycle) | 10.88 (2.33) | 11.90 (4.92) | 0.19 | |
| Cadence (steps/min) [mean (SD)] | 103.37 (20.44) | 101.35 (14.06) | 0.60 | |
| Stride length (m) [mean (SD)] | 0.94 (0.21) | 1.22 (0.22) | <0.00 | |
| Pelvic tilt (°) [mean (SD)] | 3.33 (1.55) | 3.01 (1.13) | 0.25 | |
| Pelvic obliquity (°) [mean (SD)] | 3.87 (2.16) | 5.38 (2.70) | 0.01 | |
| Pelvic rotation (°) [mean (SD)] | 5.49 (3.29) | 6.68 (3.90) | 0.02 | |
| HR AP [mean (SD)] | 1.66 (0.26) | 2.32 (0.64) | <0.00 | |
| HR ML [mean (SD)] | 1.62 (0.25) | 2.23 (0.59) | <0.00 | |
| HR V [mean (SD)] | 1.68 (0.28) | 2.41 (0.76) | <0.00 | |
| stride length CV % [mean (SD)] | 39.26 (19.44) | 26.69 (13.76) | 0.00 | |
Disclaimer/Publisher’s Note: The statements, opinions and data contained in all publications are solely those of the individual author(s) and contributor(s) and not of MDPI and/or the editor(s). MDPI and/or the editor(s) disclaim responsibility for any injury to people or property resulting from any ideas, methods, instructions or products referred to in the content. |
© 2023 by the authors. Licensee MDPI, Basel, Switzerland. This article is an open access article distributed under the terms and conditions of the Creative Commons Attribution (CC BY) license (https://creativecommons.org/licenses/by/4.0/).
Share and Cite
Castiglia, S.F.; Trabassi, D.; Conte, C.; Ranavolo, A.; Coppola, G.; Sebastianelli, G.; Abagnale, C.; Barone, F.; Bighiani, F.; De Icco, R.; et al. Multiscale Entropy Algorithms to Analyze Complexity and Variability of Trunk Accelerations Time Series in Subjects with Parkinson’s Disease. Sensors 2023, 23, 4983. https://doi.org/10.3390/s23104983
Castiglia SF, Trabassi D, Conte C, Ranavolo A, Coppola G, Sebastianelli G, Abagnale C, Barone F, Bighiani F, De Icco R, et al. Multiscale Entropy Algorithms to Analyze Complexity and Variability of Trunk Accelerations Time Series in Subjects with Parkinson’s Disease. Sensors. 2023; 23(10):4983. https://doi.org/10.3390/s23104983
Chicago/Turabian StyleCastiglia, Stefano Filippo, Dante Trabassi, Carmela Conte, Alberto Ranavolo, Gianluca Coppola, Gabriele Sebastianelli, Chiara Abagnale, Francesca Barone, Federico Bighiani, Roberto De Icco, and et al. 2023. "Multiscale Entropy Algorithms to Analyze Complexity and Variability of Trunk Accelerations Time Series in Subjects with Parkinson’s Disease" Sensors 23, no. 10: 4983. https://doi.org/10.3390/s23104983
APA StyleCastiglia, S. F., Trabassi, D., Conte, C., Ranavolo, A., Coppola, G., Sebastianelli, G., Abagnale, C., Barone, F., Bighiani, F., De Icco, R., Tassorelli, C., & Serrao, M. (2023). Multiscale Entropy Algorithms to Analyze Complexity and Variability of Trunk Accelerations Time Series in Subjects with Parkinson’s Disease. Sensors, 23(10), 4983. https://doi.org/10.3390/s23104983