Article

On the Behaviour of an AC Induction Motor as Sensor for Condition Monitoring of Driven Rotary Machines

by
Mihaita Horodinca
*,
Neculai-Eduard Bumbu
,
Dragos-Florin Chitariu
,
Adriana Munteanu
,
Catalin-Gabriel Dumitras
,
Florin Negoescu
and
Constantin-Gheorghe Mihai
Faculty of Machines Manufacturing and Industrial Management; “Gheorghe Asachi” Technical University of Iasi, 700050 Iasi, Romania
*
Author to whom correspondence should be addressed.
Sensors 2023, 23(1), 488; https://doi.org/10.3390/s23010488
Submission received: 3 December 2022 / Revised: 28 December 2022 / Accepted: 28 December 2022 / Published: 2 January 2023
(This article belongs to the Special Issue Condition Monitoring of Mechanical Transmission Systems)

Abstract

:
This paper presents some advances in condition monitoring for rotary machines (particularly for a lathe headstock gearbox) running idle with a constant speed, based on the behaviour of a driving three-phase AC asynchronous induction motor used as a sensor of the mechanical power via the absorbed electrical power. The majority of the variable phenomena involved in this condition monitoring are periodical (machines having rotary parts) and should be mechanically supplied through a variable electrical power absorbed by a motor with periodical components (having frequencies equal to the rotational frequency of the machine parts). The paper proposes some signal processing and analysis methods for the variable part of the absorbed electrical power (or its constituents: active and instantaneous power, instantaneous current, power factor, etc.) in order to achieve a description of these periodical constituents, each one often described as a sum of sinusoidal components with a fundamental and some harmonics. In testing these methods, the paper confirms the hypothesis that the evolution of the electrical power (instantaneous and active) has a predominantly deterministic character. Two main signal analysis methods were used, with good, comparable results: the fast Fourier transform of short and long signal sequences (for the frequency domain) and the curve fitting estimation (in the time domain). The determination of the amplitude, frequency and phase at origin of time for each of these components helps to describe the condition (normal or abnormal) of the machine parts. Several achievements confirm the viability of this study: a characterization of a flat driving belt condition and a beating power phenomenon generated by two rotary shafts inside the gearbox. For comparison purposes, the same signal analysis methods were applied to describe the evolution of the vibration signal and the instantaneous angular speed signal at the gearbox output spindle. Many similarities in behaviour among certain mechanical parts (including their electrical power, vibration and instantaneous angular speed) were highlighted.

1. Introduction

Any asynchronous AC induction motor electrically supplied by a three-phase system that drives a rotary machine works primarily as a conversion system for changing electrical power into mechanical power. The consumption of mechanical power is precisely mirrored by the absorption of electrical power from the electrical supply system (with η < 1 as the ratio of active mechanical/active electrical power describing the power efficiency). All of the phenomena inside the motor, and especially those either within the driven rotary machine or related to it by a working process powered by the rotary machine and characterized by the variable consumption of mechanical power, should have a description in the evolution of the electrical power parameters measured at the electrical input of the motor. These parameters are mainly the instantaneous current and voltage, the instantaneous electrical power, active electrical power, power factor, reactive power, energy, etc. If these parameters are measurable, this means that any electrical motor (particularly an AC induction motor) has a secondary function as a mechanical power sensor or as a loading sensor and can be useful in condition monitoring, based on the information that flows through the motor from the driven machine (as mechanical power) to electrical system (as electrical power). It is obvious that, when a driving AC induction motor is used as a sensor, the majority of the mechanical phenomena considered for the condition monitoring of rotary machines running in idle or with a working process are better described by the evolution of the electrical power in comparison with the evolution of the electric current, contrary to the present best practices according to the literature.
With 1/η being the ratio of active electrical/active mechanical power, and η < 1, it turns out that a slight amplification increases the sensitivity of the motor used as a sensor (in other words, a variation in the mechanical power is mirrored by a variation amplified by 1/η in the electrical power).
The indirect measurement of mechanical power based on the measurement of electrical power parameters offers several important advantages. First, it is based on a simple computer-assisted experimental setup with measurement devices placed on the electrical supply system of the AC induction motor. The measurement of instantaneous current and voltage acquisition is performed utilizing this setup [1,2,3,4], which can be easily used for any other AC induction motor. This indirect measurement has a second important advantage: it makes it possible to avoid a much more complicated setup for mechanical power measurement that requires a torque sensor and an instantaneous angular speed sensor to be placed on the AC induction motor rotor. However, the behaviour as sensor of an AC induction motor as related to the evolution of the electrical power parameters should be considered as being slightly affected in a negative way by the mechanical dynamics of the rotor, by the variation of the power efficiency η, which is not constant, but depends on loading, and by motor slip.
The ability of AC induction motors to serve as mechanical power sensors based on the evolution of the active electrical power is known and is usually exploited in machine tools for: working processes monitoring (e.g., anomalies detection or faults detection on CNC machining processes [5,6,7], cutting power measurement in milling [8,9,10], drilling [11] or turning [12], peak power reduction [13]), tool condition monitoring [14,15,16,17], feed drive systems monitoring [18] or auxiliary systems monitoring [19]. Some researchers have focused on the monitoring [1,2] and optimization [20] of transient regimes on machine tools (acceleration-deceleration) using the evolution of the active electrical power. An approach to the condition monitoring of motor-operated valves was described in [21].
An alternative electric power parameter frequently used to describe the mechanical loading is the active electric energy [22,23,24] as a rate of active electric power, the power being the energy divided by time. Here, increasing the energy efficiency of machine tools [25,26,27] or impact working machines [28] is a research priority.
Because the faults of the rotary parts in rotary driven machines induce periodical mechanical loadings, in addition to the well-known resources related to vibrations, the literature indicates the availability of the instantaneous electric current delivered to the motors as a basis for condition monitoring and diagnosis in time domain and especially in frequency domain, e.g., for gearboxes [29,30,31,32]. More frequently, the instantaneous electric current is used for the diagnosis of induction rotor motors or generators [33,34,35,36]. Unexpectedly, one promising approach in this research is still unexploited: the mechanical loading introduced by a rotary machine driven by an AC induction motor is considerably better described by the evolution of active electrical power or instantaneous active electrical power in comparison with the evolution of instantaneous current, because the definition of the active electrical power involves the instantaneous current, the instantaneous voltage and—essentially—the shift of phase between them, or the power factor, as well. The instantaneous current is not strictly proportional to the instantaneous electrical power. Also, it is well known that the instantaneous current absorbed by an AC induction motor cannot describe some transient regimes, e.g., a regime characterized by negative mechanical power absorption [1].
The few papers on this topic focus mainly on electric motor condition diagnosis based on instantaneous electric power, for stator turn fault detection [37] and mechanical imbalances of the rotor [38], or based on power factor [39] evolution. It seems that, according to the literature, instantaneous electrical power is a better approach than active electric power to the description of free and forced mechanical oscillations, as periodical mechanical loading, in driven machines and systems [40], to the description of simulated vibrations [41] and experimentally revealed vibrations [42] at resonance or to the description of active damping [43] in electrically actuated mechanical systems.
The main objective of this work is to highlight the availability of the evolution for some parameters of electric power absorbed by a three-phase AC asynchronous induction motor—especially instantaneous power and instantaneous active power—in the condition monitoring of a rotary driven machine, particularly a lathe headstock gearbox running idle with a constant rotational speed at the output spindle. The rotary mechanical parts placed inside the gearbox—in normal and abnormal conditions—need to be powered with mechanical power provided by motor. The variable part of this power, which is appropriately considered to be preponderantly a sum of sinusoids, is analysed in electrical equivalent in the time domain and in the low frequency domain in order to find the mathematical descriptions for the sinusoidal components related to the condition of each of these mechanical parts, especially flat belts and shafts in this paper. For comparison purposes, in order to increase confidence in the results, some supplementary resources in condition monitoring offered by the evolutions of gearbox vibration and instantaneous angular speed of the output spindle are also exploited.
The achievements of this work focus especially on the processing and analysis of electrical power and its components in order to reveal the condition of some rotary parts inside a lathe headstock gearbox running with constant speed, due to the fact that the components of the electrical power are preponderantly deterministic signals. Some interesting phenomena inside the gearbox were revealed. Firstly, a beating vibration phenomenon supplied by a beating instantaneous power phenomenon inside the gearbox, generated by two shafts with imbalanced masses, was highlighted. Especially on this topic, contrary to the expectations, it is proved that the vibration signal is not able to produce a complete description of some of the phenomena involved in condition monitoring. Secondly, the periodical variation of power produced by a flat belt in different working conditions was revealed and investigated.
The rest of this paper is organized as follows: Section 2 presents the computer-assisted experimental setup, Section 3 presents a theoretical approach to the numerical definition of some electric power parameters, Section 4 presents the experimental results and discussion, Section 5 is dedicated to discussion and Section 6 presents the conclusions and the future work.

2. The Experimental Setup

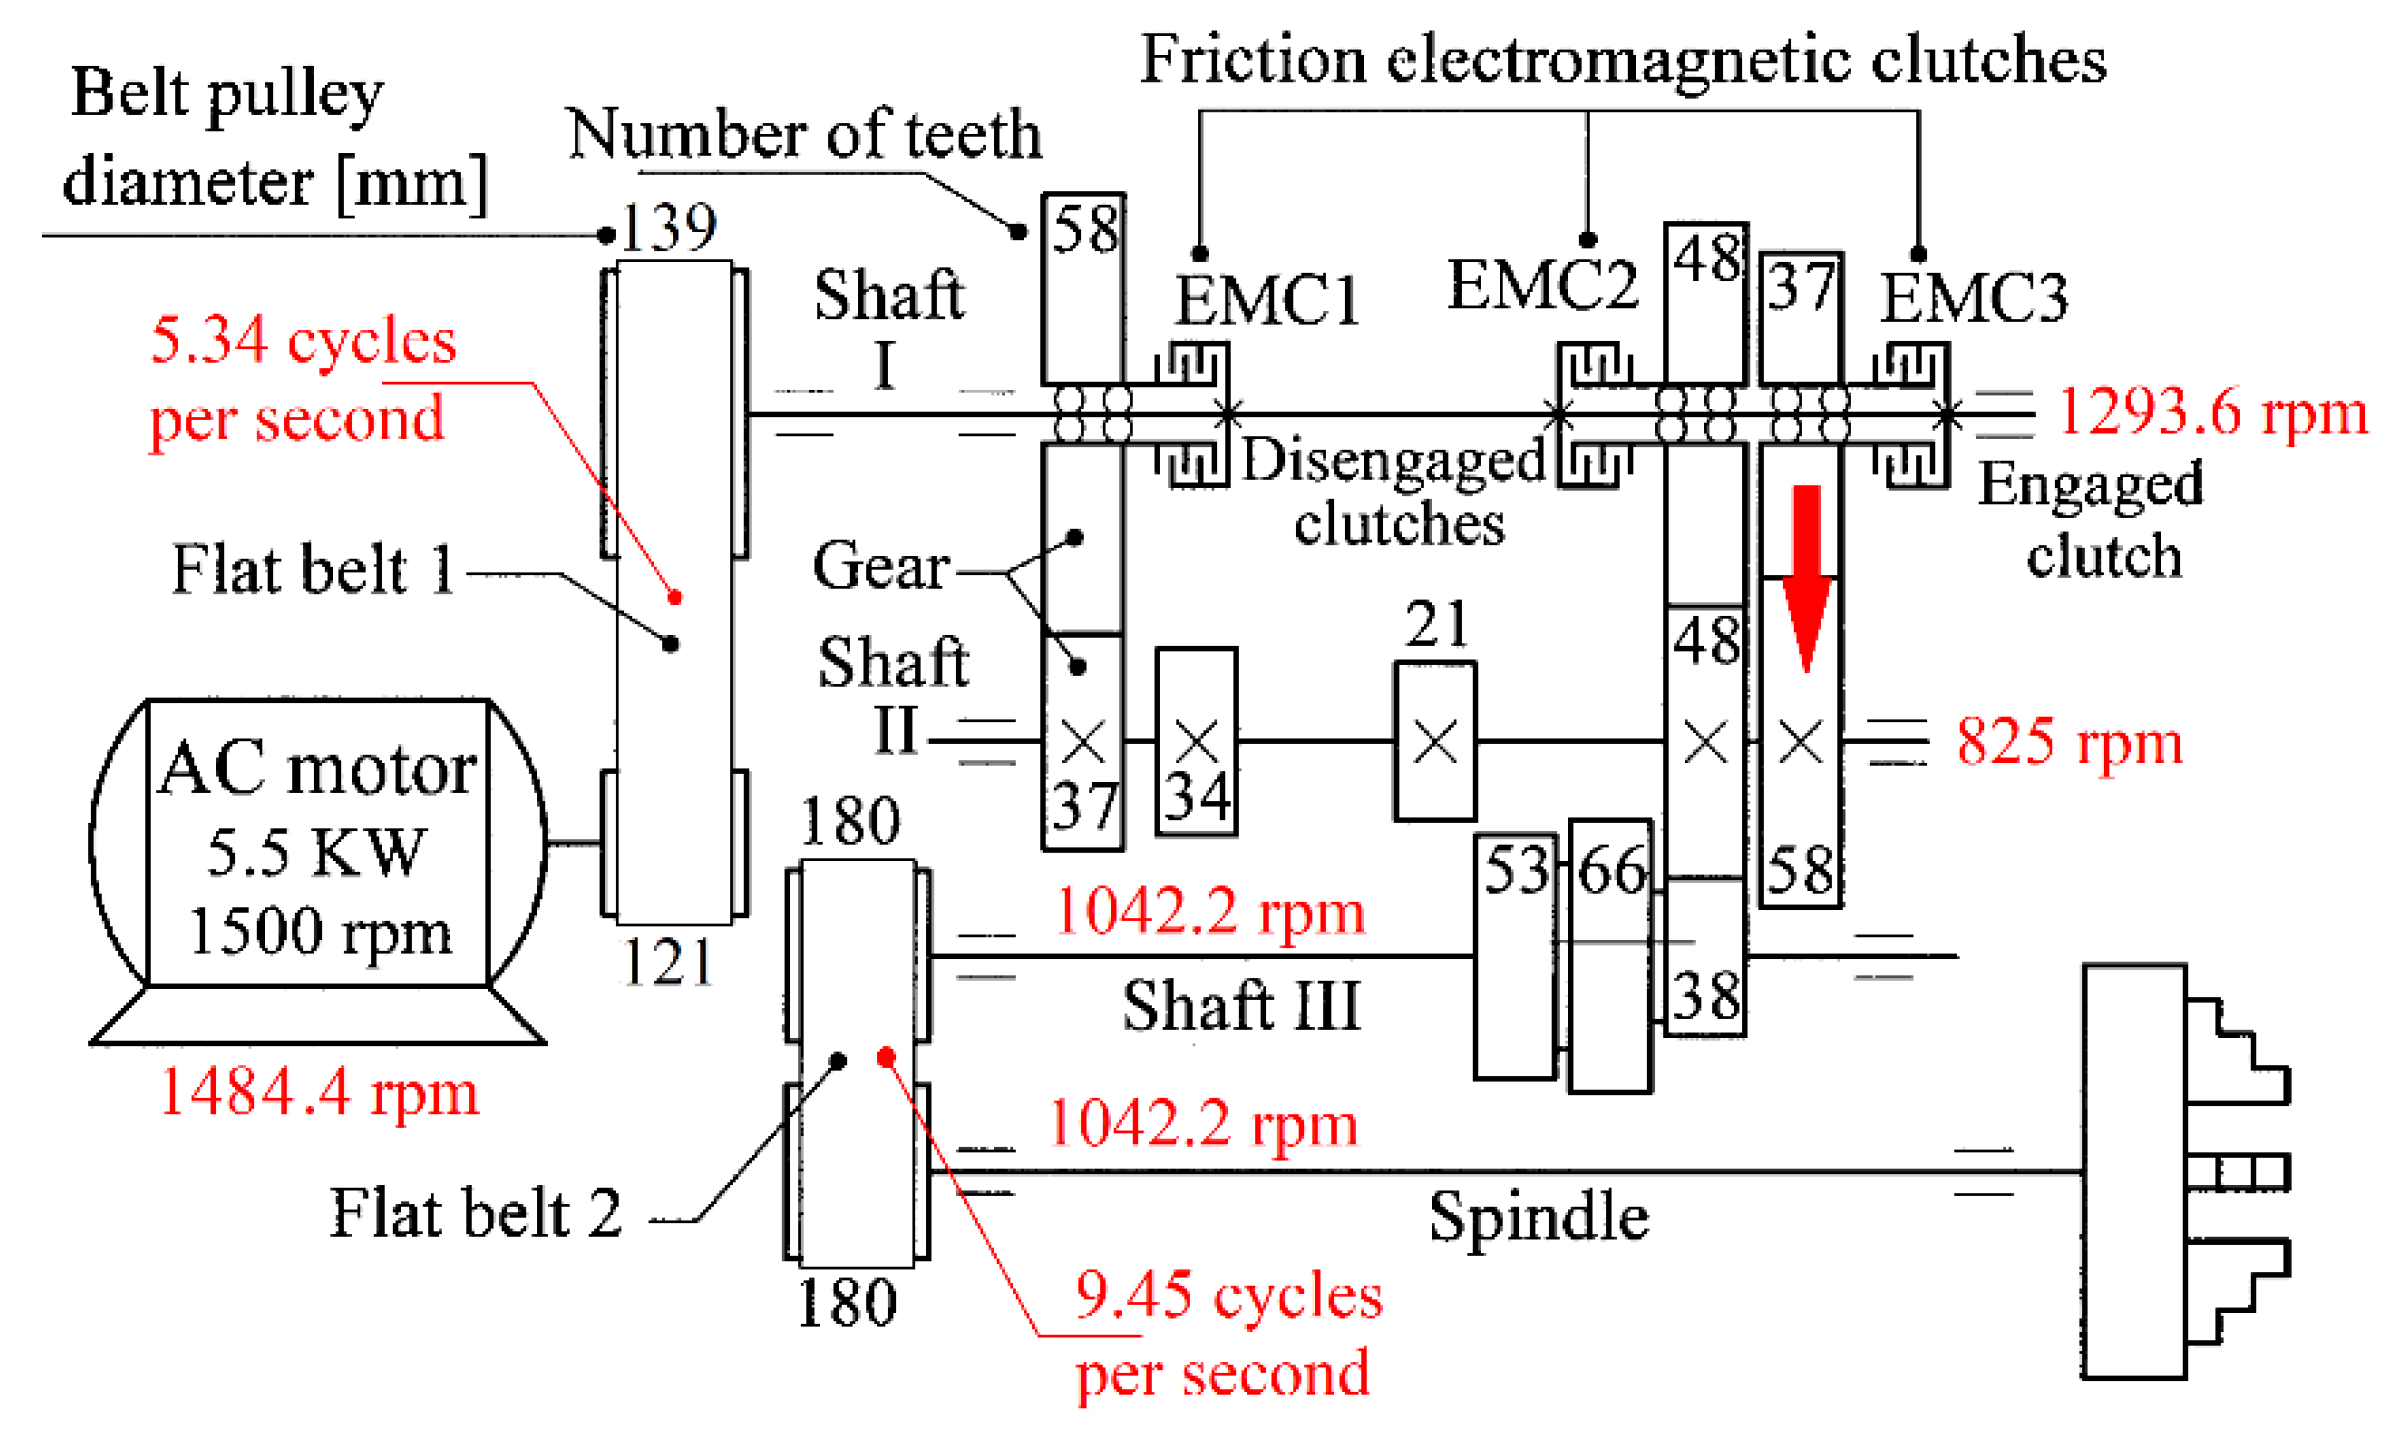
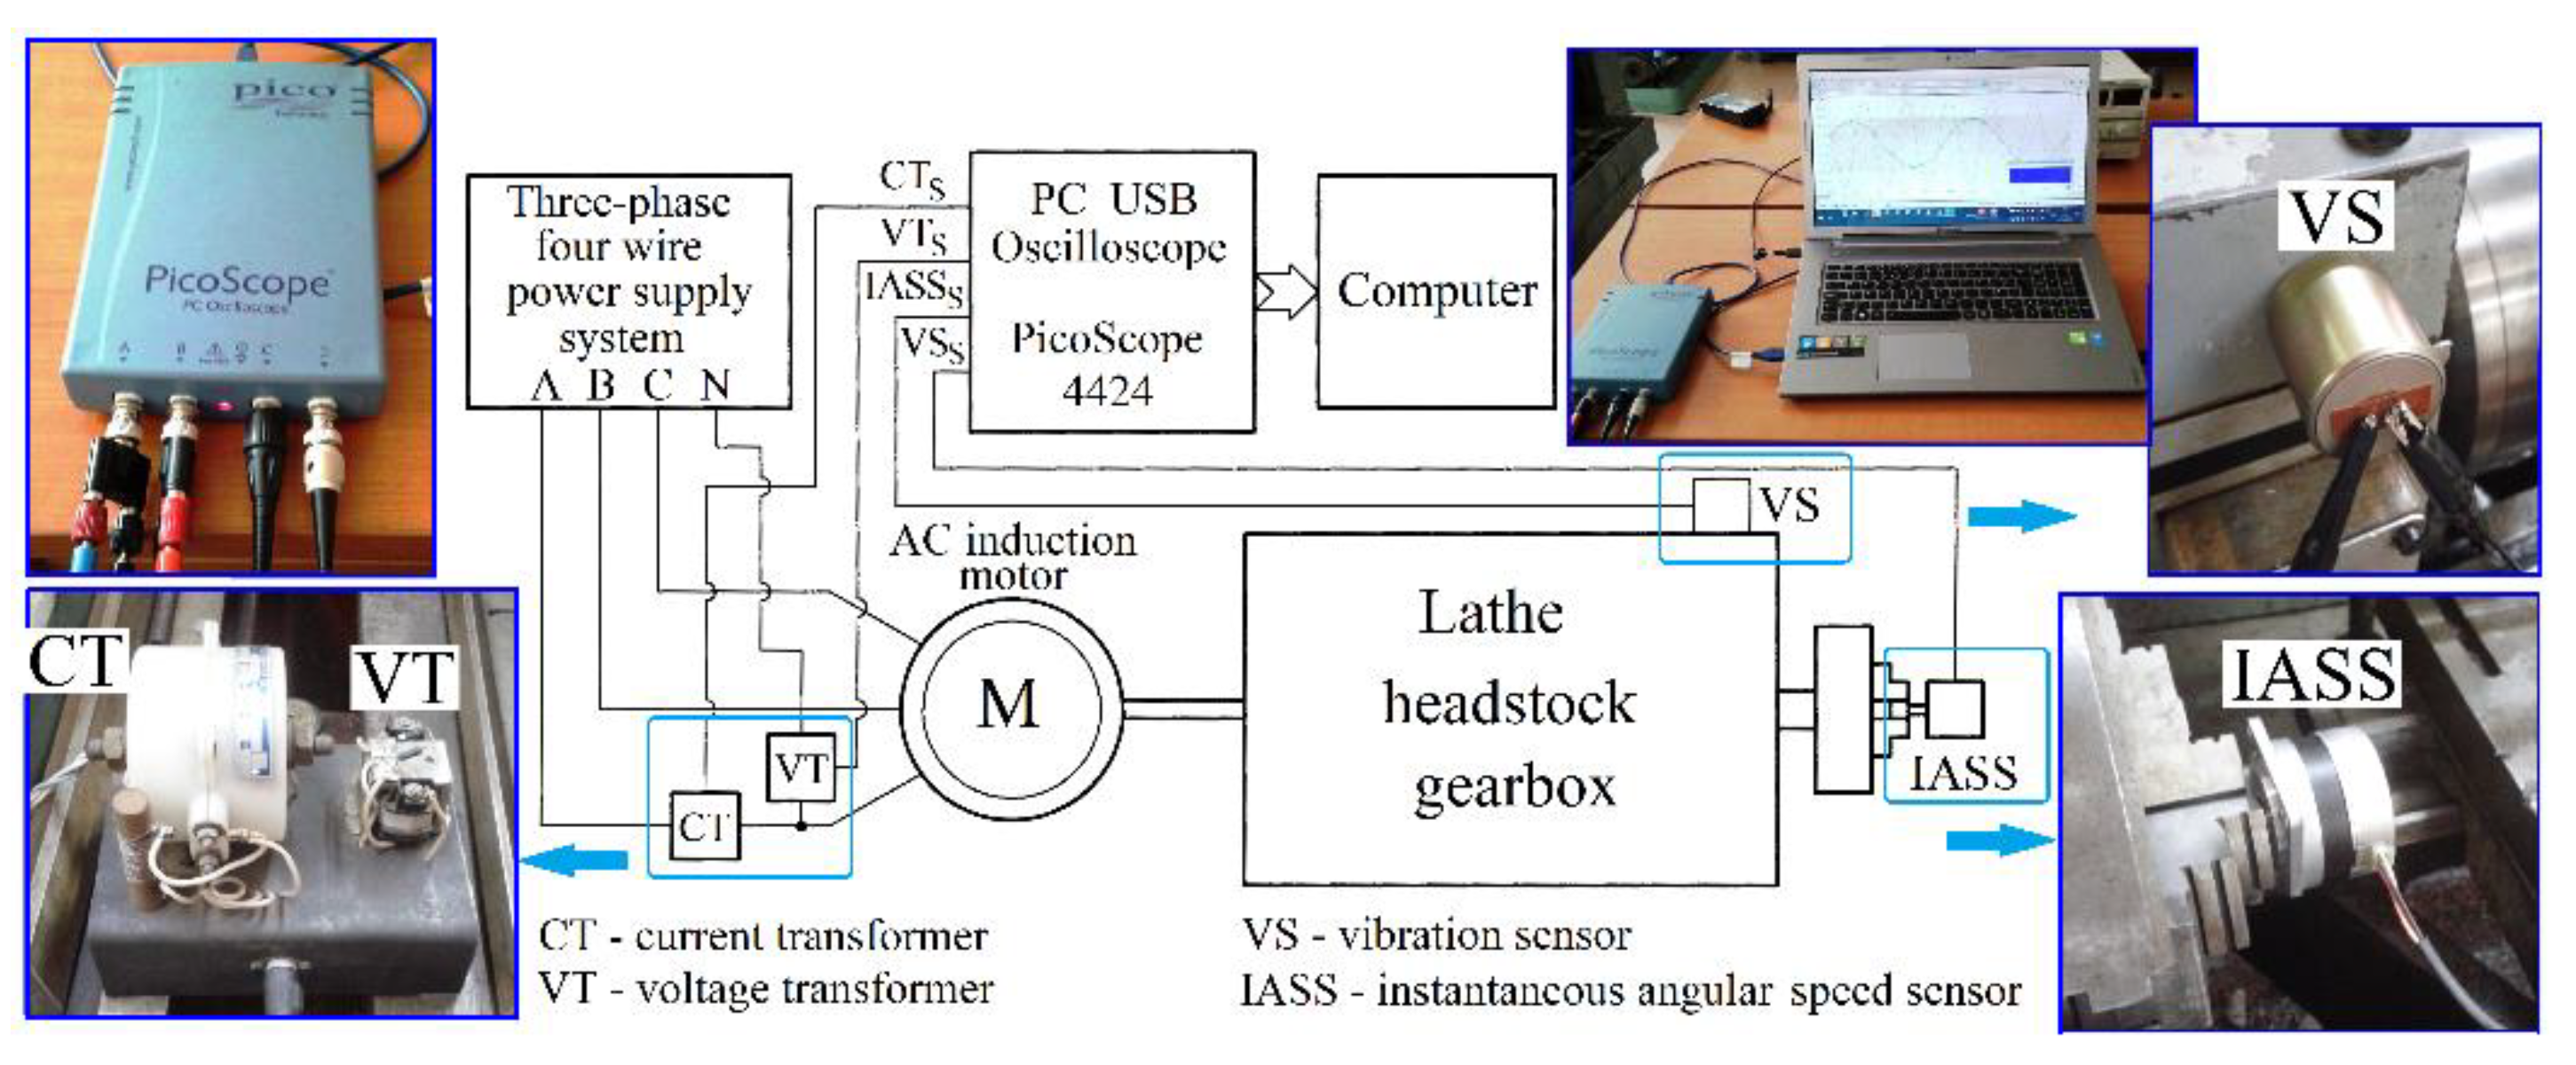
The experimental setup is briefly described in Figure 1. A three-phase AC asynchronous induction motor (5.5 KW and 1500 rpm synchronous speed, with two magnetic poles, a delta connection on stator windings and a squirrel-cage rotor placed at the input of a Romanian SNA 360 lathe headstock gearbox) is supplied with a three-phase four-wire system. A star connection on stator windings is used temporarily for motor starting.
The signals delivered to a PC USB oscilloscope (PicoScope 4424 from Pico Technology, Cambridgeshire, UK [44]) by a voltage transformer VT and a current transformer CT (both placed on phase A as sensors) are used by a computer to describe and to analyse the evolution of some electric power parameters (e.g., instantaneous current and voltage, instantaneous electrical power, instantaneous electrical active power, power factor, etc.). The signal delivered by a vibration sensor VS (self-generating velocity detector Geo Space GS 11D, now HGS Products HG4, 5 Hz natural frequency [45]) placed on the lathe gearbox headstock near the jaw chuck is used to describe the vibrations in the horizontal direction, perpendicularly on the spindle axis (also through the medium of the PC USB oscilloscope and the computer).
An instantaneous angular speed sensor (IASS, as a self-generated speed signal sensor, proposed in a previous work [46]) is placed in the jaw chuck of the spindle.
It is expected that some phenomena related with the lathe headstock condition are similarly mirrored in the evolution of the electric power parameters, gearbox vibrations and instantaneous angular speed of spindle.
According to the gearing diagram from Figure 2, a particular configuration of the lathe gearbox was chosen in order to obtain a theoretical rotational speed of 1052.18 rpm at the spindle. Inside the gearbox, there are different mechanical parts: two flat belt transmissions, spur and helical gears, three friction electromagnetic clutches, three shafts and a spindle mounted on bearings. Nine different manually and electrically selectable speeds are available. The real values of rotational speed experimentally measured for the spindle, shafts and belts are written with red fonts in the gearing diagram from Figure 2.
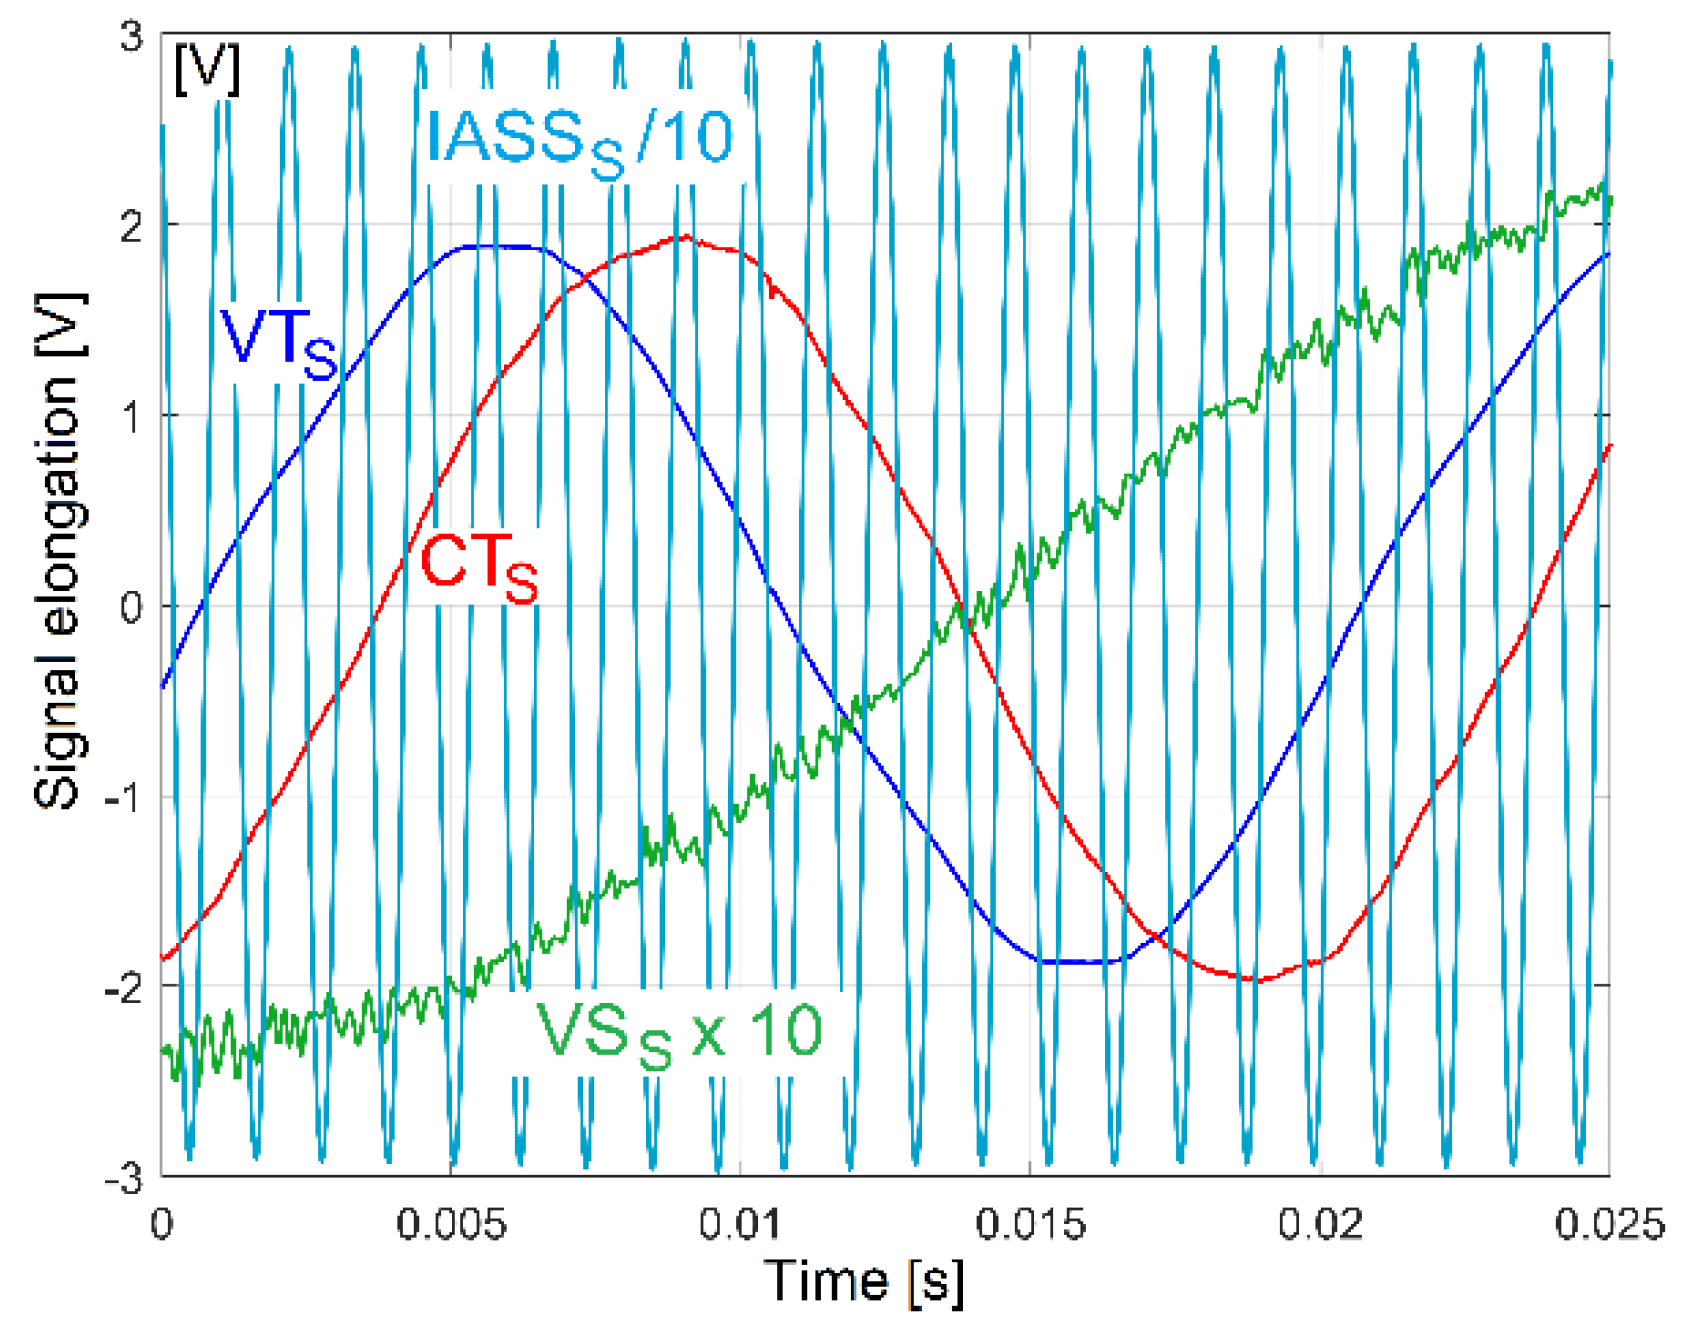
Each transformer (VT, CT) and each sensor (VS, IASS) delivers an AC signal (as VTS, CTS, VSS and IASSS signals). Figure 3 describes a short sequence in which these four AC signals are simultaneously generated when the lathe headstock gearbox runs idle (with gearing diagram described in Figure 2).
The VTS and CTS signals theoretically have a 50 Hz frequency. A time delay between the VTS and CTS signals occurs due the phase shift (this happens because the motor stator winding acts as an inductive circuit). This phase shift is variable; it depends mainly on the mechanical loading of the AC induction motor.
The IASSS signal appears [46] as an AC signal with 50 periods on each spindle rotation (nearly 868.5 Hz frequency). The VSS signal contains a major dominant quasi sinus- oidal wave component due to the excited vibration of the entire gearbox on its foundation.
The excitation is generated by the rotation of two unbalanced bodies, a shaft and the output spindle (having a rotation frequency of nearly 17.37 Hz) and slightly amplified by a resonance phenomenon.

3. The Numerical Description of Some Electric Power Parameters

The evolution of the electric power parameters of the AC induction motor depends exclusively on the evolution of the instantaneous current and voltage (and the phase shift between).
According to Figure 1, for an AC asynchronous induction motor electrically powered with a 50 Hz symmetrical three-phase (A, B, C) four-wire supply system (N being the neutral wire), the signal CTS delivered by the current transformer CT [2] is proportional with the instantaneous current iA(t), and the signal VTS delivered by the voltage transformer VT is proportional with the instantaneous voltage uA(t) on a single phase (A), both having approximately sinusoidal evolutions with the same period T = 1/50 s and a shift of phase φA between them. It is supposed that, in a balanced sinusoidal electric supply system, the evolutions of the instantaneous current (IC) and the instantaneous voltages (IV) are the same in all three phases, except for a phase shift angle of 2π/3 radians between phases. Two numerical samples iA[tk] (for IC) and uA[tk] (for IV) (described by computer, with iA[tk] and uA[tk] proportional with the numerical description of CTS and VTS signals delivered by the PC USB oscilloscope) give a definition of a numerical sample pA[tk] = uA[tk]⋯iA[tk] of the instantaneous electrical power pA(t) = uA(tiA(t) on phase A (as IPA), with Δt = tktk − 1 as sampling period and with Fs = 1/Δt being the sampling frequency. If iA(t) and uA(t) are pure sinusoidal signals, then IPA has a periodical evolution with a period equal with T/2 (or 2/T frequency as well). Otherwise, IPA has a dominant periodical component with a period equal with T/2 (as fundamental) and some harmonics. A part of this, instantaneous electrical power (as instantaneous electrical active power, IAPA) is involved in the conversion and the transfer of energy strictly in one direction: from electrical energy absorbed by the AC induction motor to mechanical energy delivered by the motor to the driven rotary machine.
If there are n samples pA[tk] on each IPA period T/2 (with Δt = T/2), then there is a first known approach to estimating a sample PA1[tl] of IAPA (as IAPA1) as the average value of IPA on the lth period, as follows:
P A 1 [ t l ] = 1 n k = n l + 1 n ( l + 1 ) p A [ t k ]    
The time tl can be described as tl = l T/2 + T/4. The sampling period of IAPA1 is T/2 >> Δt. The sampling rate of IAPA1 is Fs = 2/T, the Nyquist frequency (or Nyquist limit, involved in the fast Fourier transform currently used in this paper) is FNyquist = Fs/2 = 1/T. For a 50 Hz frequency of instantaneous voltage, or T = 20 ms, the Fs = 100 s−1 and FNyquist = 50 Hz.
There is a second approach to calculating a sample PA2[tk] of IAPA (as IAPA2), which involves completely removing the dominant component from IPA (2/T Hz frequency) and its harmonics (not involved in condition monitoring) using successively narrow band-stop notch filters with middle frequencies at 2/T Hz, 4/T Hz, 6/T Hz and so on. A simpler way [43] is to use a numerical moving average filter with n samples in the average (n being the integer part of the ratio T/(2·Δt)) having first notch frequency at 2/T Hz, as follows:
P A 2 [ t k ] = 1 n j = 1 n p A [ t k j ]
This filter has also notch frequencies at 4/T Hz, 6/T Hz, 8/T Hz and so on; consequently, it also completely removes all of the harmonics of the dominant component of IPA (200 Hz, 300 Hz, 400 Hz and so on). The IAPA2 description has a big advantage compared with IAPA1: it keeps the same sampling period Δt as IPA (for Fs = 1/Δt, FNyquist = 1/(2Δt)). However, the moving average filter has also a relatively big disadvantage: the IAPA2 description contains sinusoidal components, and the amplitudes of these components are strongly attenuated (except those with low frequencies, much lower than 2/T Hz).
It is obviously that, in order to describe the total instantaneous active power absorbed by the AC induction motor through all three phases (as IAP), in each sample of IAP (P1 and P2) a multiplication factor 3 should be used (P1 = 3·PA1 and P2 = 3·PA2).
An important electric power parameter useful in condition monitoring is the instantaneous power factor (IPF) [39], theoretically the same on all phases, as the cosine of the phase shift φA (or cos(φA)) between instantaneous voltage uA(t) and current iA(t). The time delay tdp between two successive zero-crossing moments of instantaneous voltage and current (experimentally revealed in Figure 3 by the time delay between VTS and CTS signals) is involved in the definition of the pth sample of IPF (as PF[tp]) as follows:
P F [ t p ] = cos ( 2 π t d p T )      
The time tp can be described as tp = p·T/2 + tdp/2. Similarly to that of IAPA1, the sampling period of IPF is T/2 >> Δt (because on each period T there are two zero-crossing moments for uA(t) and two zero-crossing moments for iA(t)). A high precision method for detecting the zero-crossing moments for sinusoidal signals was fully described in a previous work [46].
Some other electric power parameters are also available: the active power AP (as an average of IAP on a time interval), the active energy AE (as the definite integral of AP on a time interval), the instantaneous reactive power IRP (the result of multiplication between the samples of IAP and tan(φA)), etc.
The numerical description of these parameters is suitable for signal processing in the condition monitoring of the proposed rotary driven machine, e.g., by analysis in the frequency domain.

4. Experimental Results

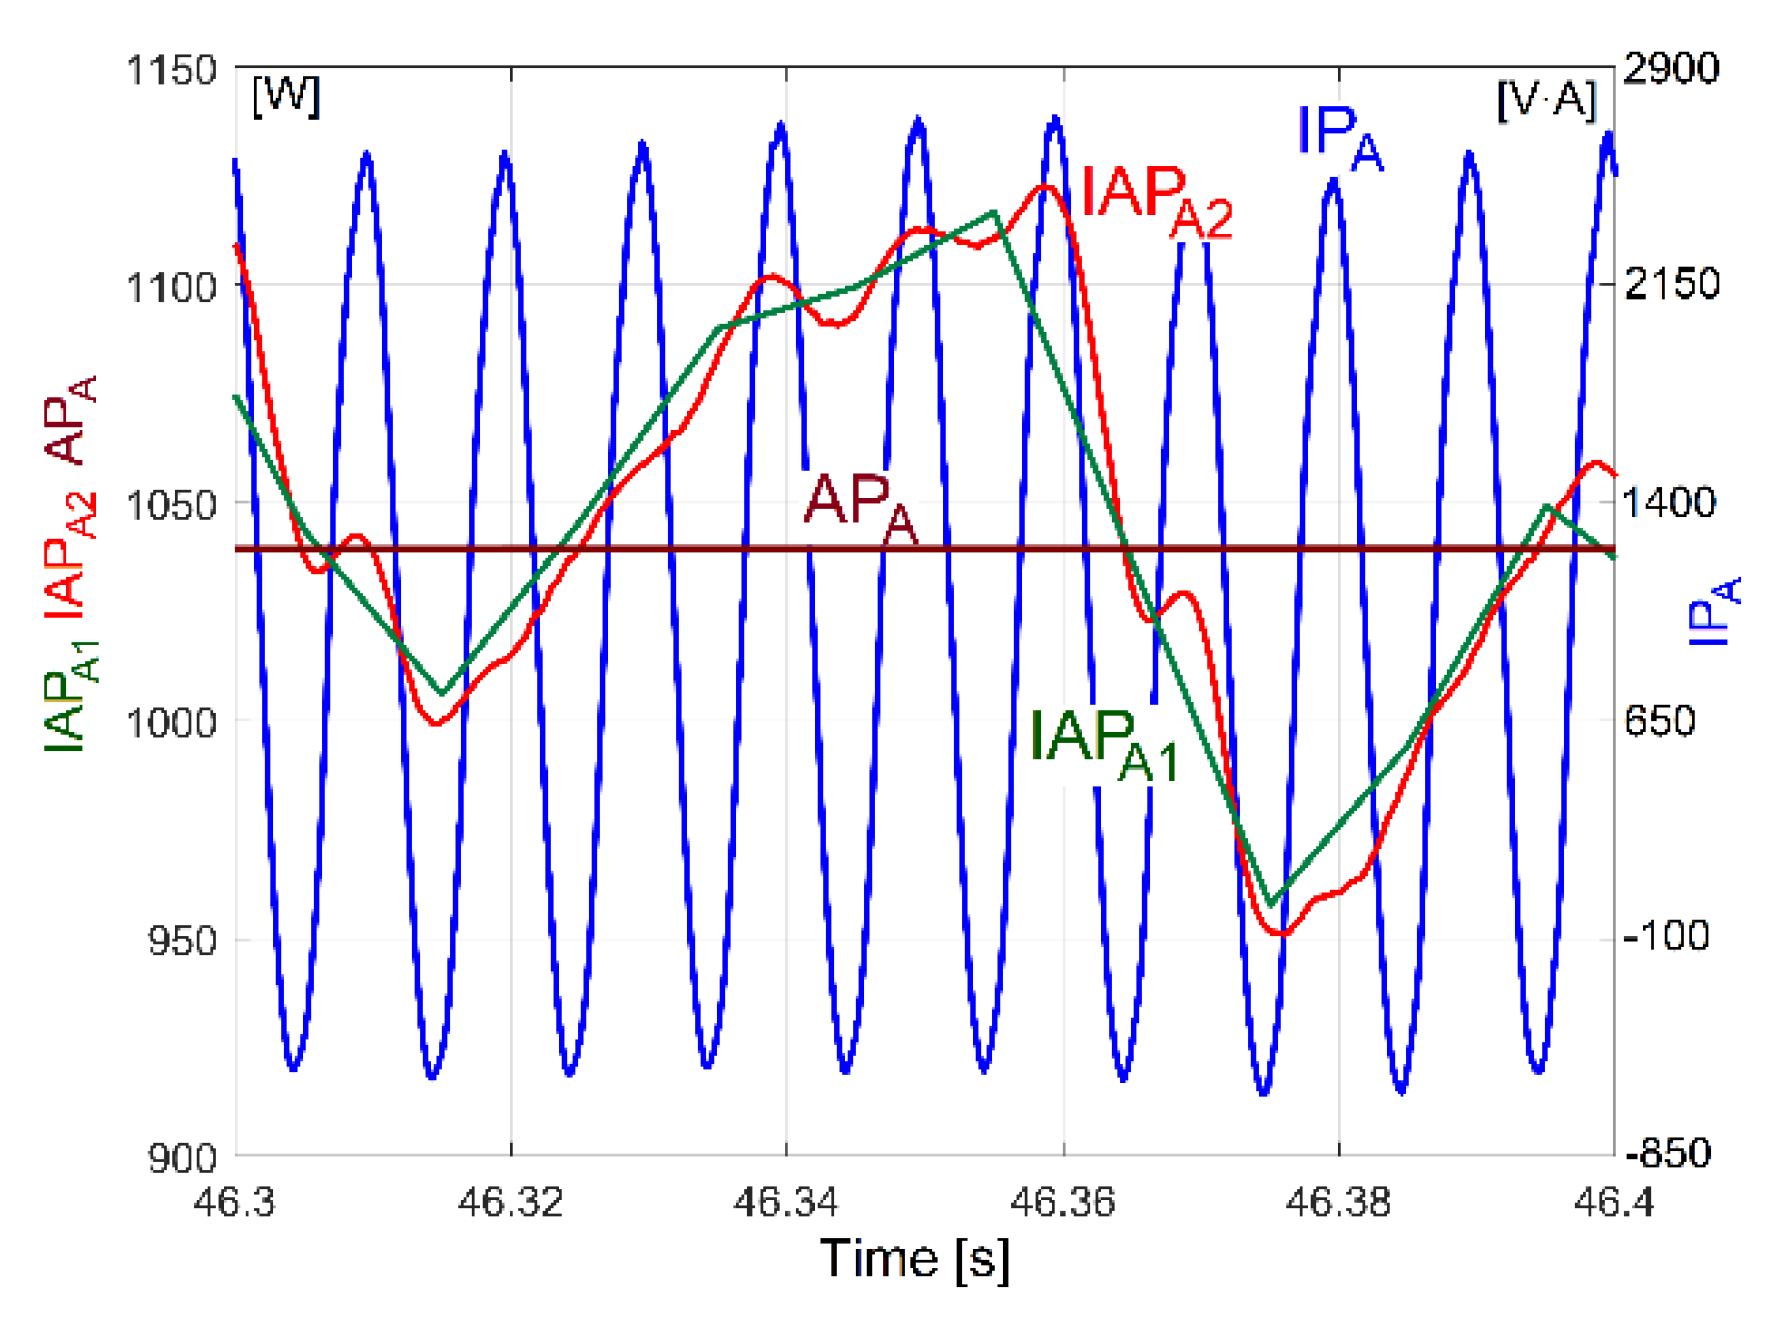
With the lathe headstock gearbox running idle and having the gearing diagram depicted in Figure 2, the evolution of instantaneous current and voltage during 100 s was acquired (with Fs = 25,000 s−1 as sampling rate and the number of samples Ns = 2,500,000 or Ns = 2.5 Ms). The evolutions of IPA, IAPA1, IAPA2 and APA were obtained (with APA being the active power on phase A, as the average of IPA, a sample on each second). A comparison between the simultaneous experimental evolutions of these four electrical power parameters is conducted in a short time sequence in Figure 4 (0.1 s, with 2500 samples on IPA or IAPA2, 10 samples on IAPA1 and 0.1 samples on APA).
The evolution of APA (as the very low frequency part of IPA, IAPA1 and IAPA2) indicates the total consumption of the AC motor, mainly as an equivalent of the total amount of active mechanical power necessary to rotate the headstock lathe gearbox running in idle regime. This mechanical power is finally lost by dry and viscous friction.

4.1. Some Resources of Signals Processing in Frequency Domain Revealed by Fast Fourier Transform

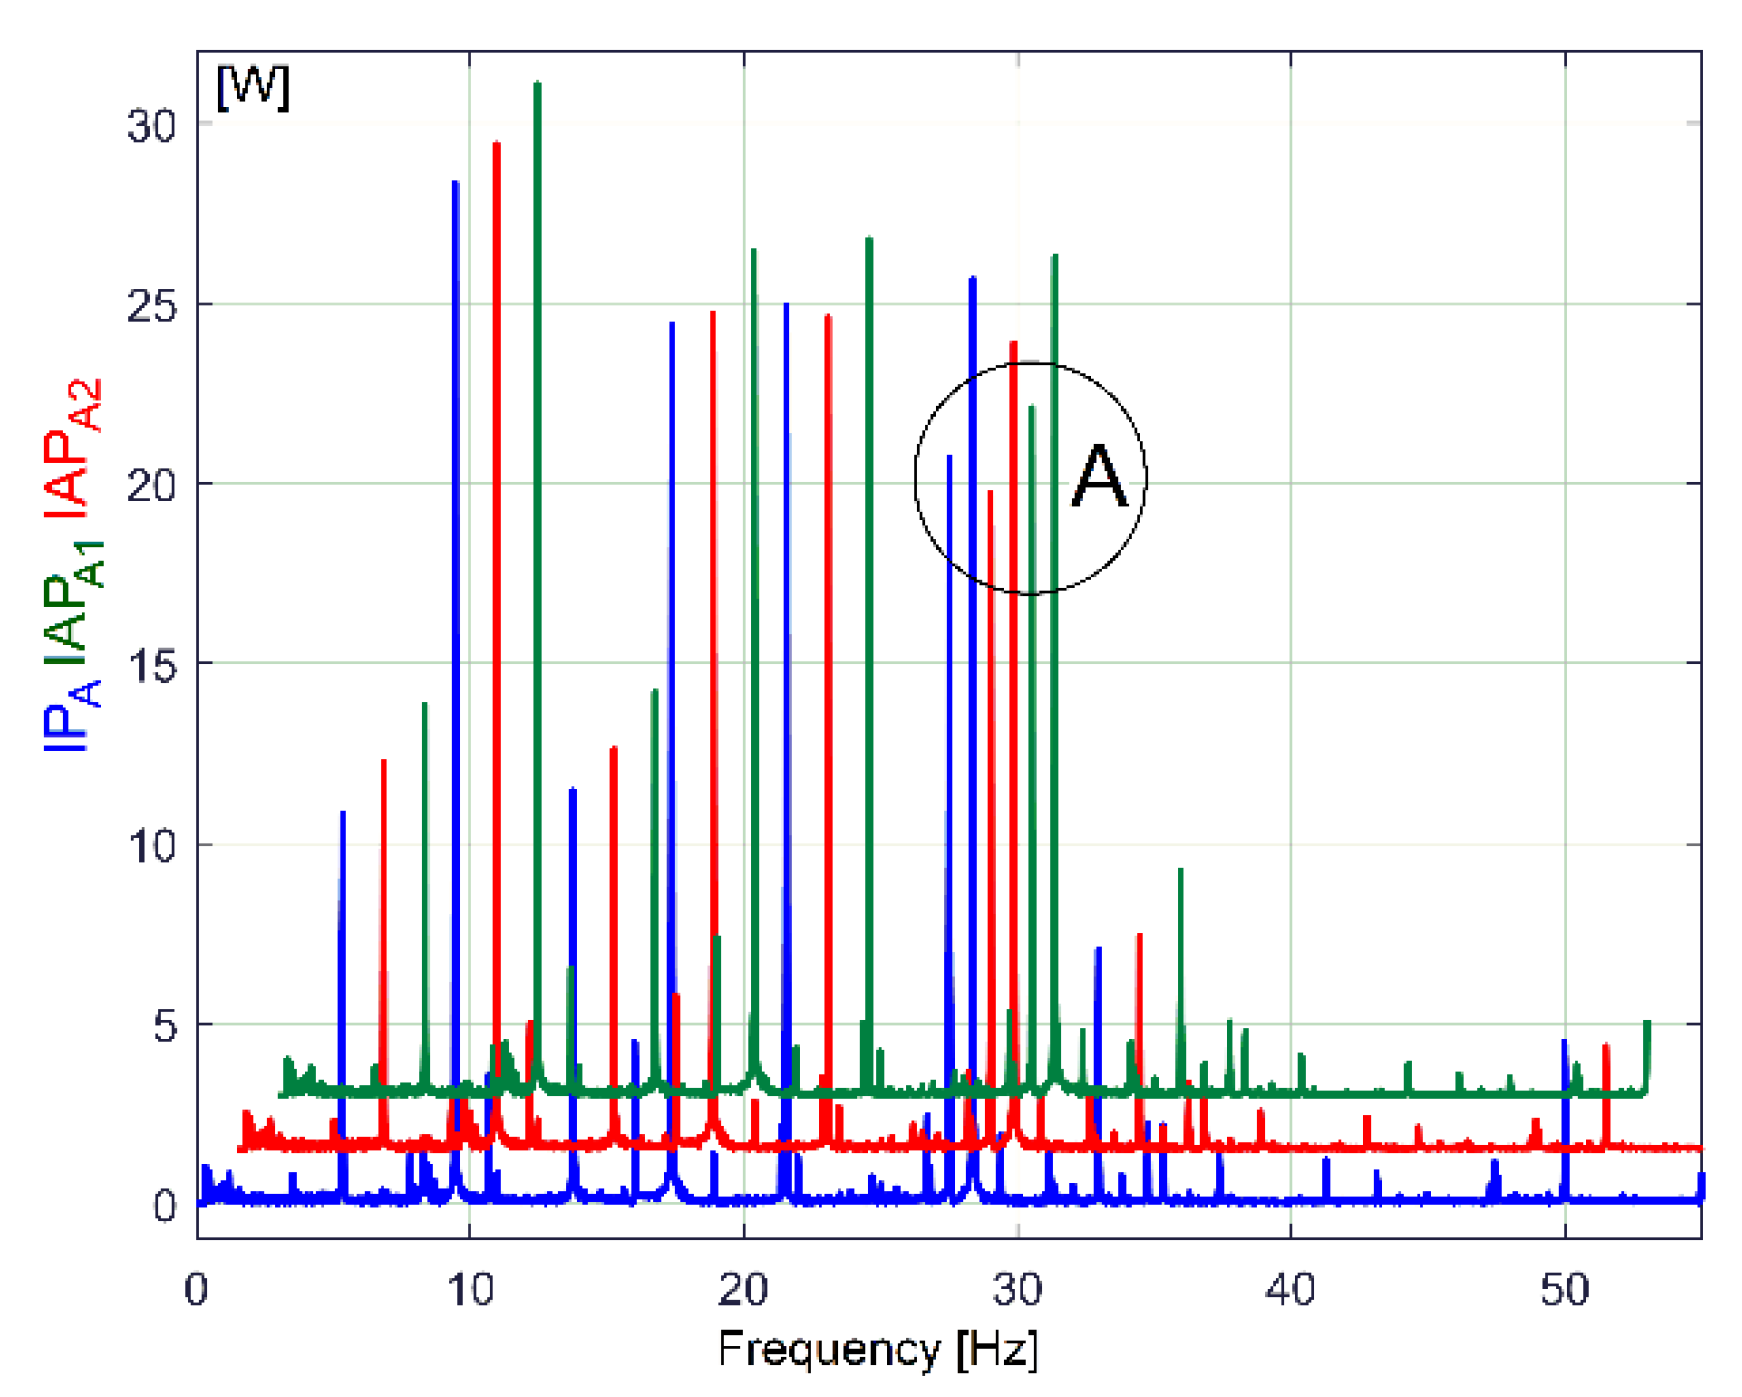
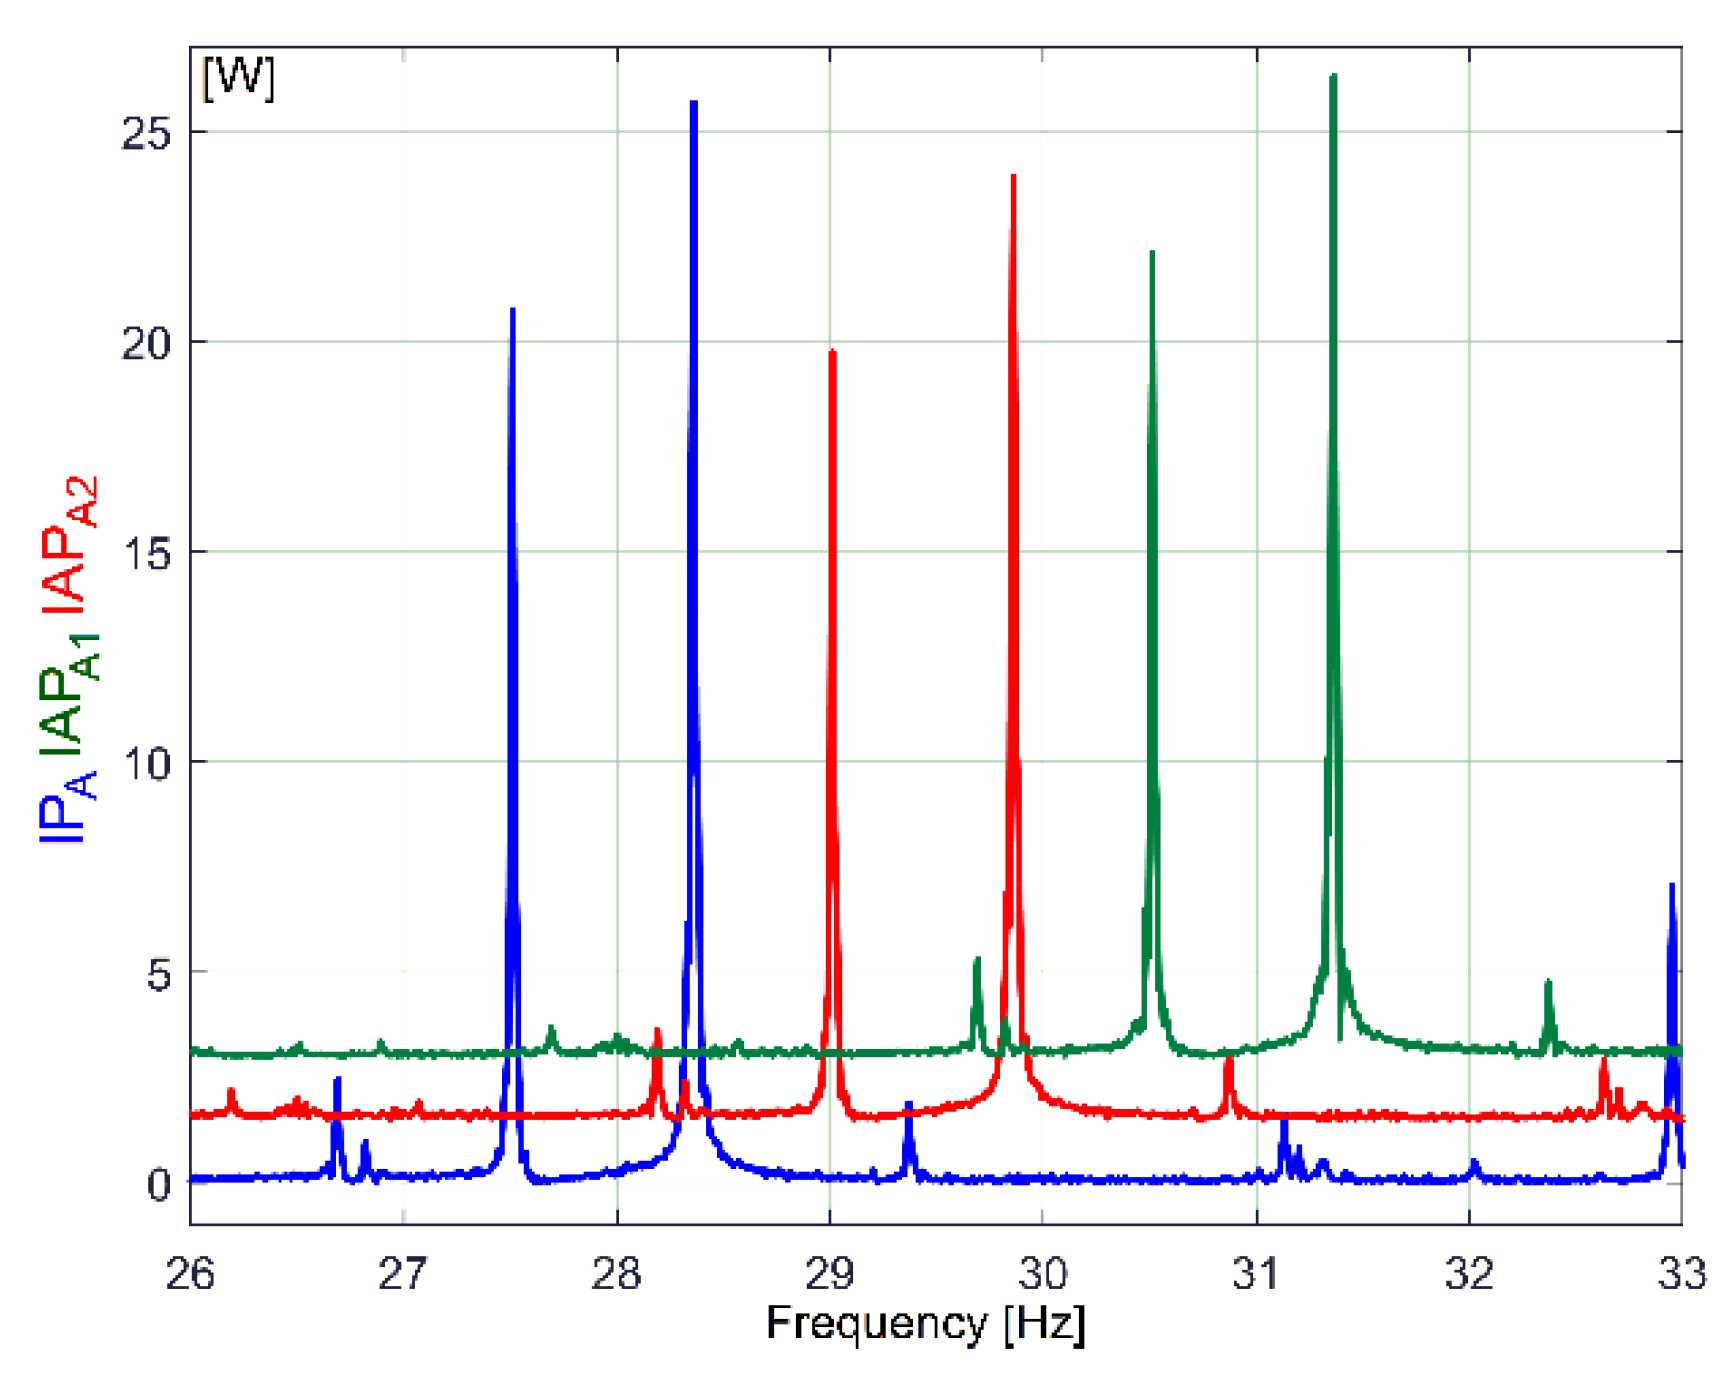
For gearbox condition monitoring purposes, it is appropriate to use the evolution of the variable parts of IPA, IAPA1 or IAPA2, which are supposed to contain periodical components. The easiest way to explore these variable parts is to use the evolutions in the frequency domain obtained by the fast Fourier transform (FFT) with Matlab. Figure 5 describes a part of the FFT spectrum evolution (0 ÷ 55 Hz) of IPA, IAPA1 and IAPA2 during the same experiment as before (the lathe headstock gearbox running idle), with IAPA2 (IAPA1) being shifted vertically by 1.5 W (3 W) and horizontally by 1.5 Hz (3 Hz), respectively, in comparison with IPA (in order to avoid the graphical overlap).
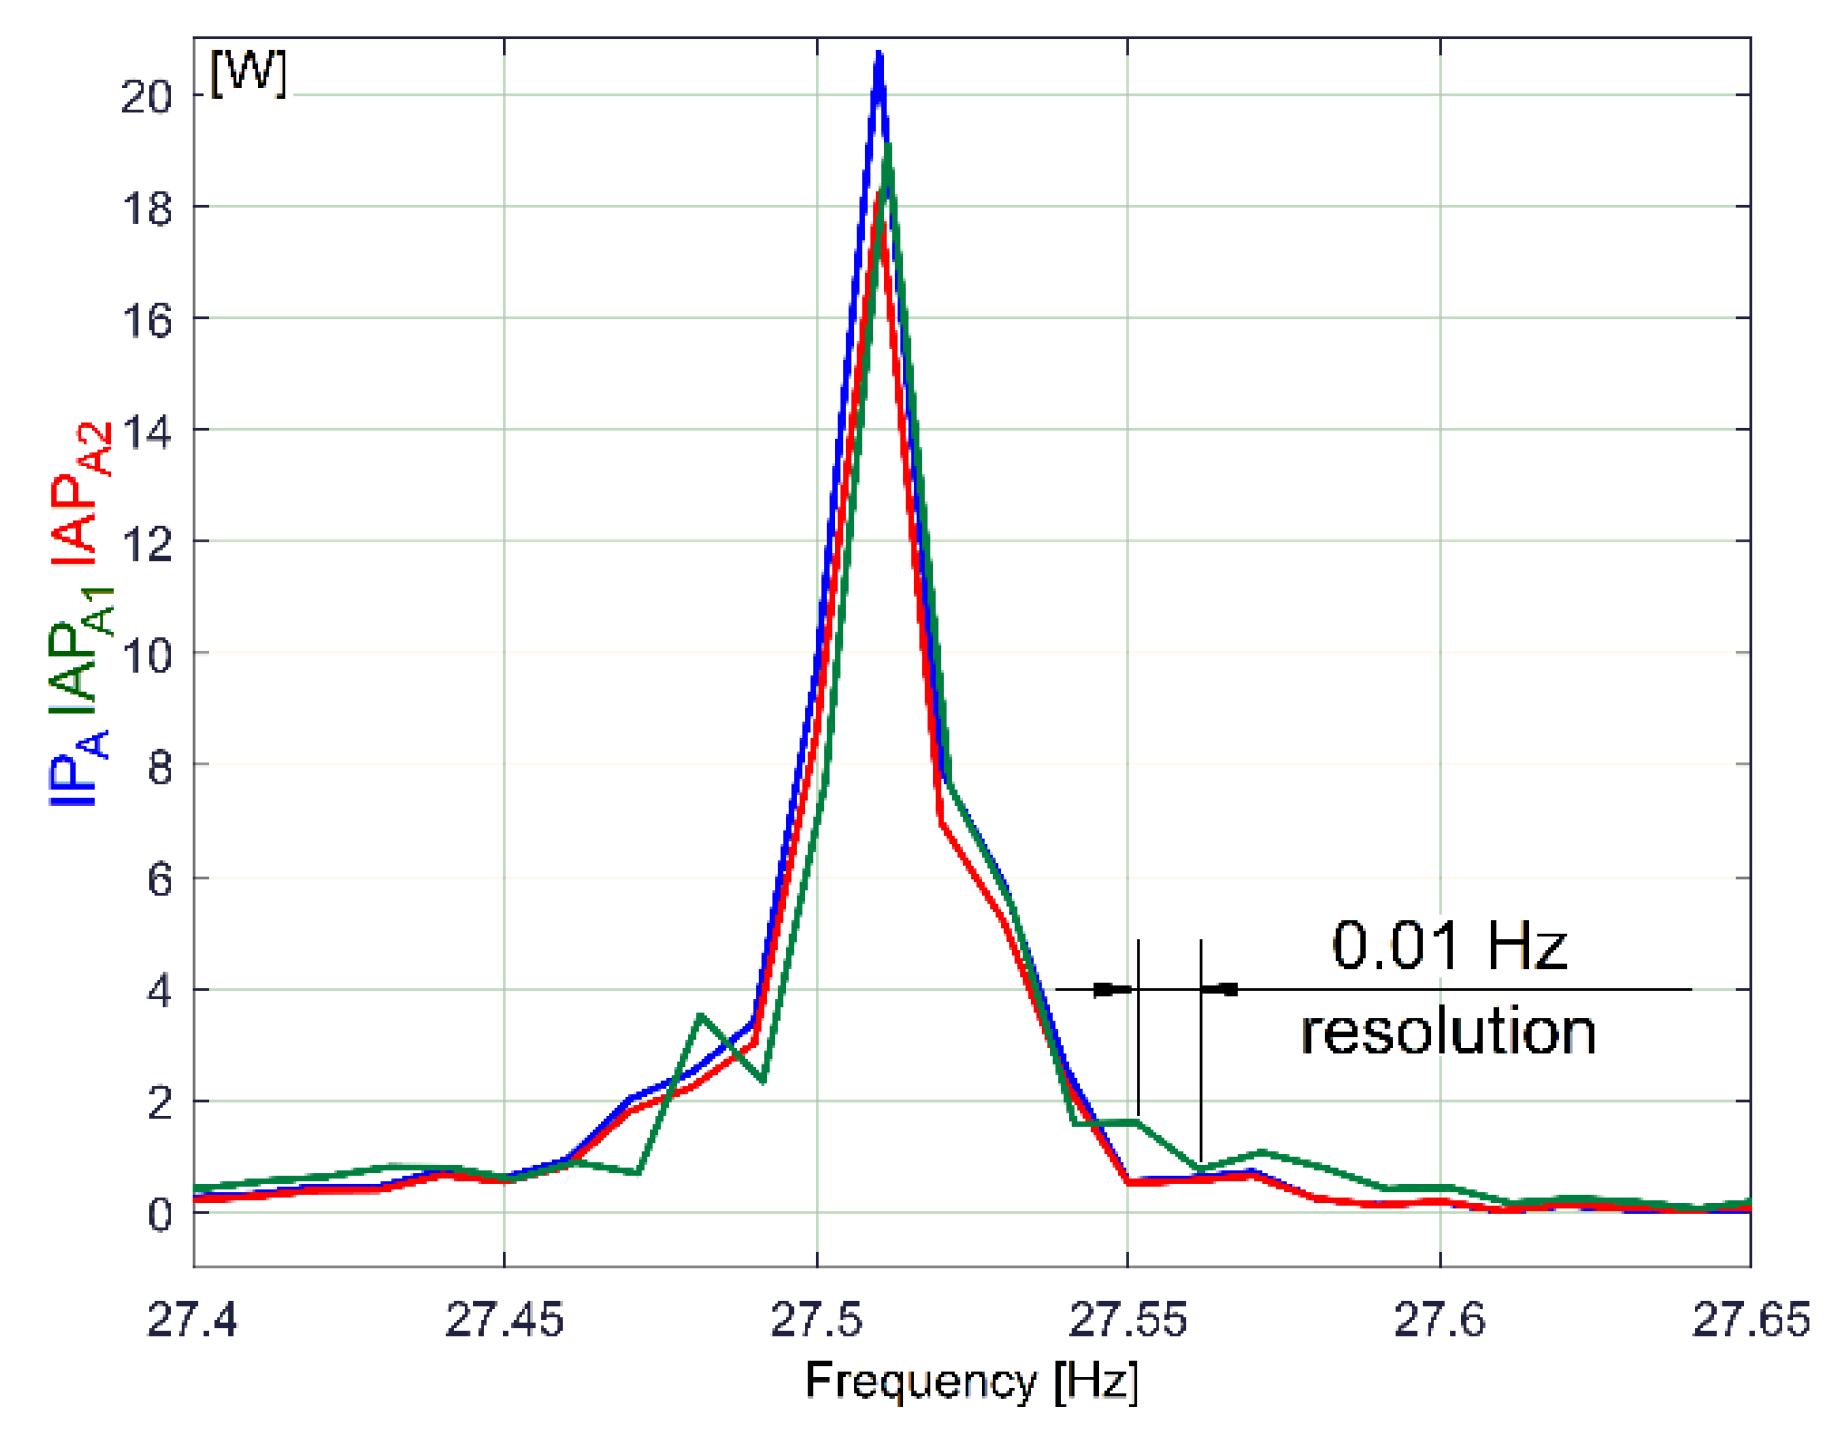
It is obvious that these three evolutions involved in the description of electric power are deterministic signals (each peak is related to a sinusoidal component of the electric power); these three FFT spectra are very similar. All of the spectra have (the same) high resolution in frequency (Fs/Ns = 0.01 Hz) with the same sampling rate (Fs = 25,000 s−1) for IP and IAPA2 (with Ns = 2.5 Ms), while the IAPA1 spectrum has the sampling rate Fs/n =100 s−1 and Ns/n = 10,000 samples. Because of a low Nyquist limit, the spectrum of IAPA1 ends at 50 Hz (Fs/(2n) = 50 Hz), while, for IPA and IAPA2, the spectra end at Fs/(2) = 12,500 Hz.
A zoomed-in detail in the area marked with A in Figure 5 is described in Figure 6.
Figure 7 describes the first major peak from Figure 6 (approx. 27.5 Hz frequency) on all three types of powers (not shifted). It is obviously that—related to amplitudes—the best description of these sinusoidal components is given by the FFT of IPA evolution (compared with IAPA1 and IAPA2).
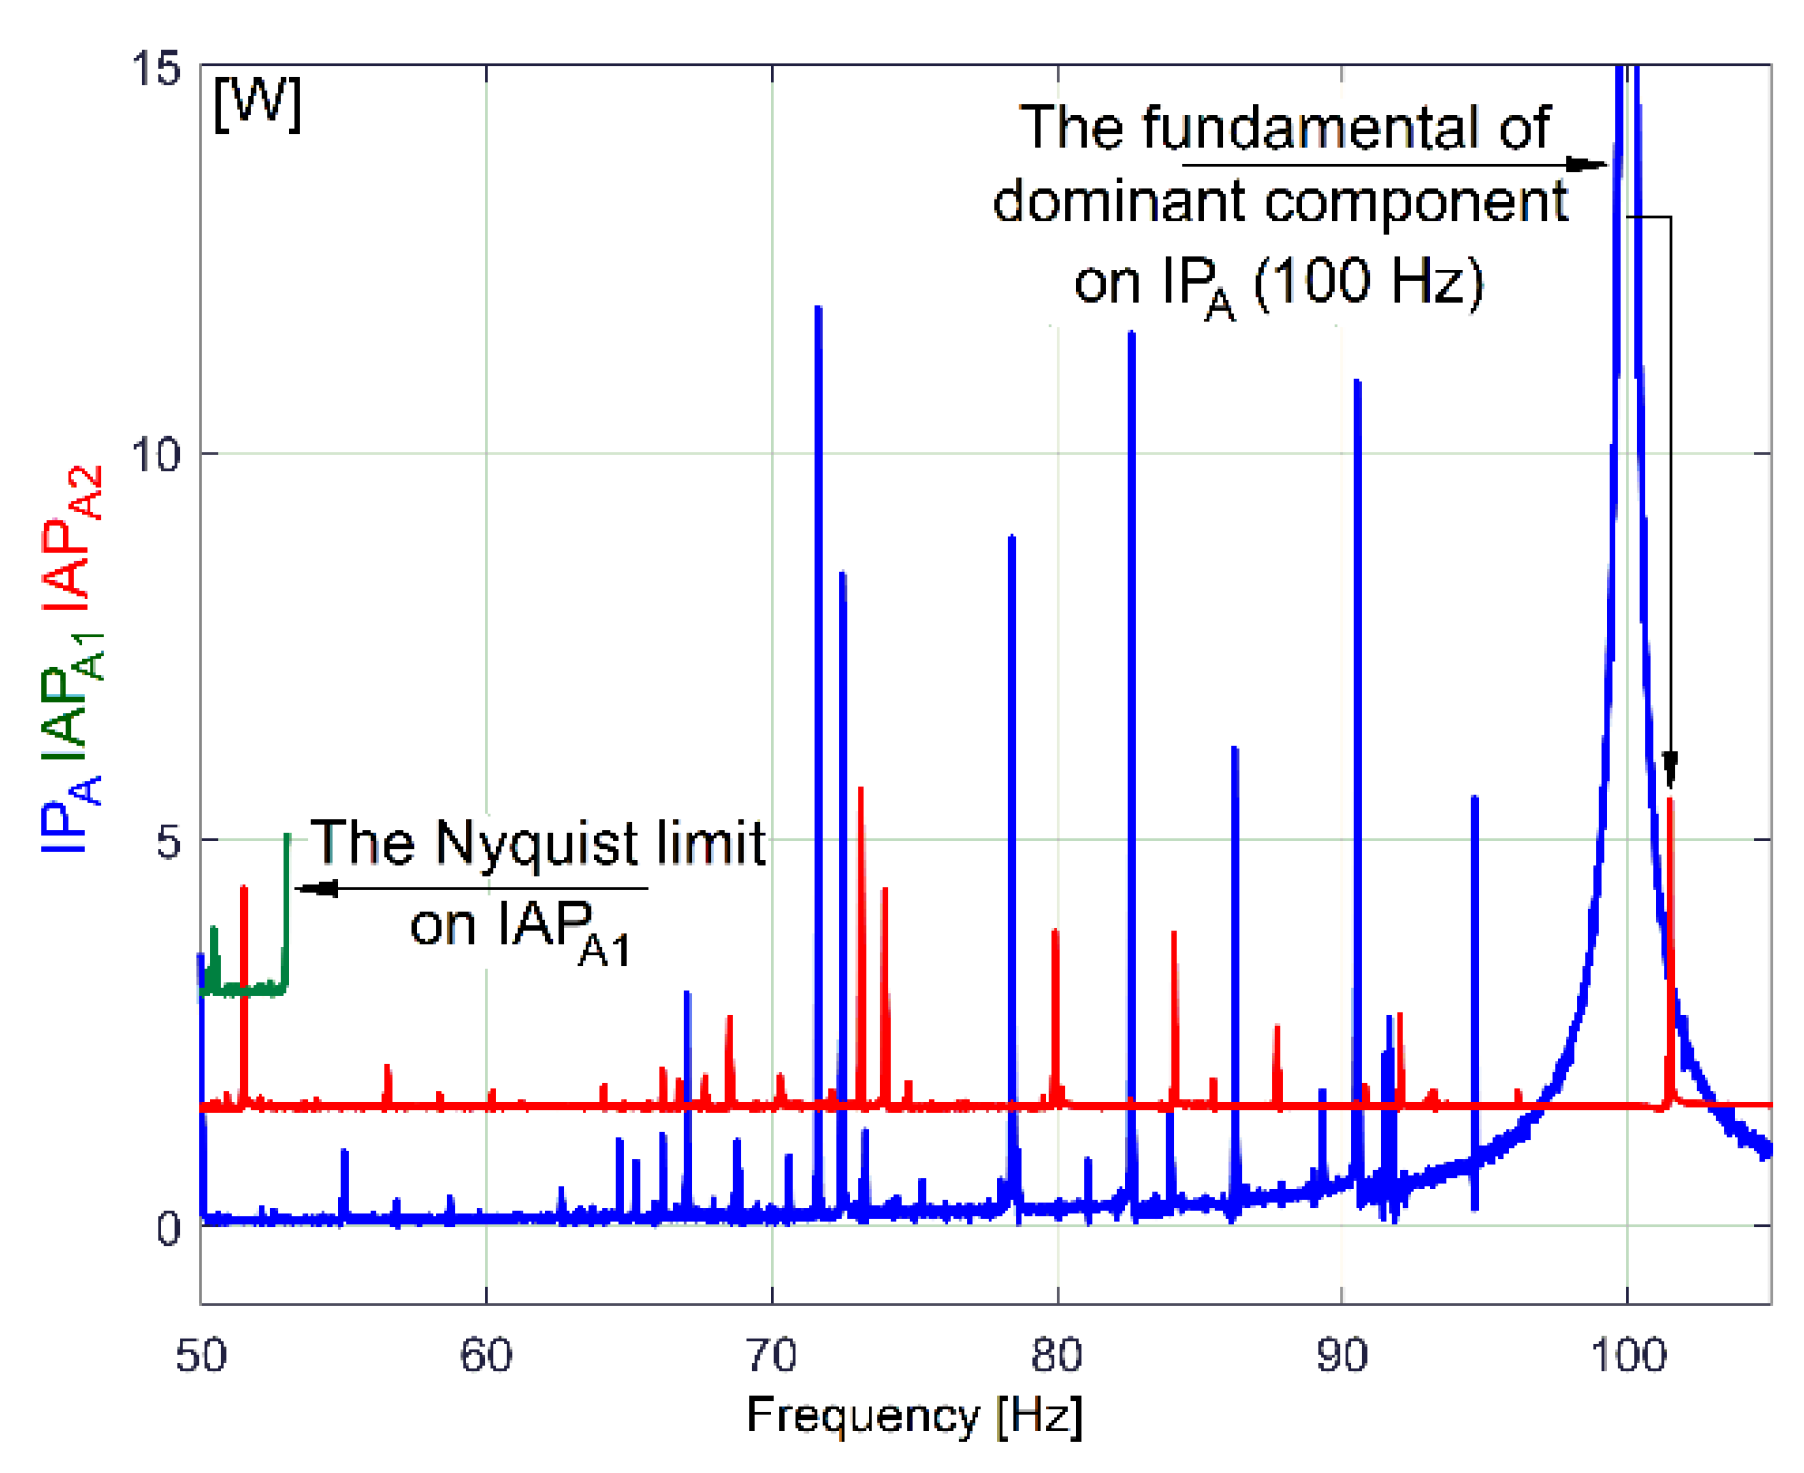
As major disadvantages, the evolution of IAPA1 has a low sampling rate and a low Nyquist limit because of its definition as an average (Equation (1)), while the amplitudes of the FFT peaks on the IAPA2 spectrum strongly decrease with frequency because of filtering (Equation (2)), as is clearly indicated in Figure 8 (a sequence of spectra between 50 ÷ 105 Hz).
Contrary to expectations, here the fundamental of the dominant component from IPA (100 Hz theoretical frequency and 99.97 Hz real frequency and 923.2 W in amplitude) is not completely eliminated by the moving average filter on IAPA2 (there is still a peak of 4.012 W in amplitude). This happens because the spectrum is calculated by averaging a long sequence (100 s). During this sequence, the frequency of the supply of instantaneous voltage (and current as well) varies slightly around 50 Hz, as we will experimentally prove later on, in Section 5. This also implies a variation in the frequency of the dominant component in IPA, leading to a slight decrease in the filtering efficiency.
There are two reasons to prefer IPA evolution for condition monitoring: firstly, it is easy to obtain the description of its evolution in time; secondly, it provides the best description of the sinusoidal components in the FFT spectrum.
In the FFT spectrum of IPA, the measurement unit for the variable components involved in condition monitoring can be considered to be the watt (due to the similarities of the FFT amplitudes with IAPA1 and IAPA2 already revealed). For a complete description of the periodical phenomena inside the lathe headstock gearbox as mirrored in the electric power evolution, it is suitable to use the total instantaneous power p(t) absorbed by the AC motor (or IP, as being three times bigger than IPA, with p(t) = 3·pA(t)).
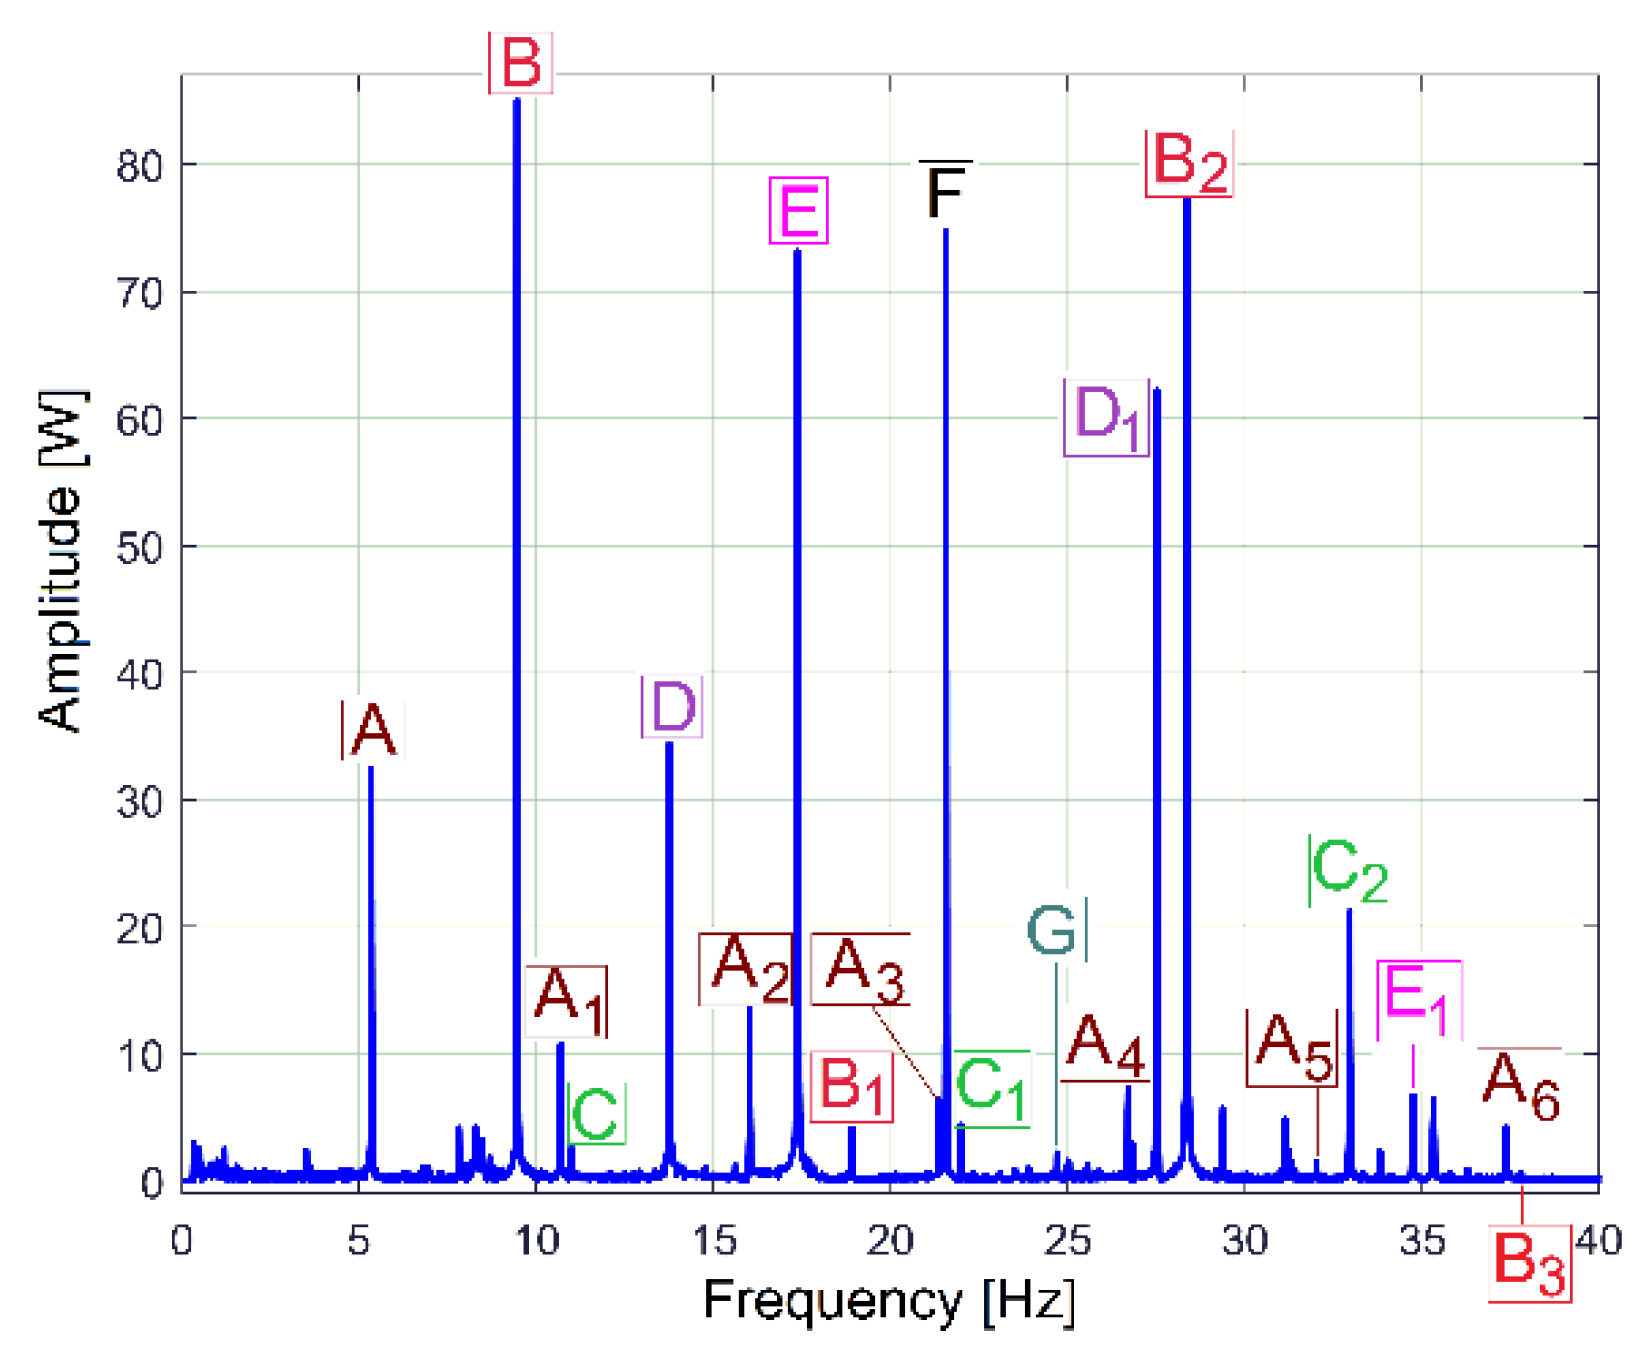
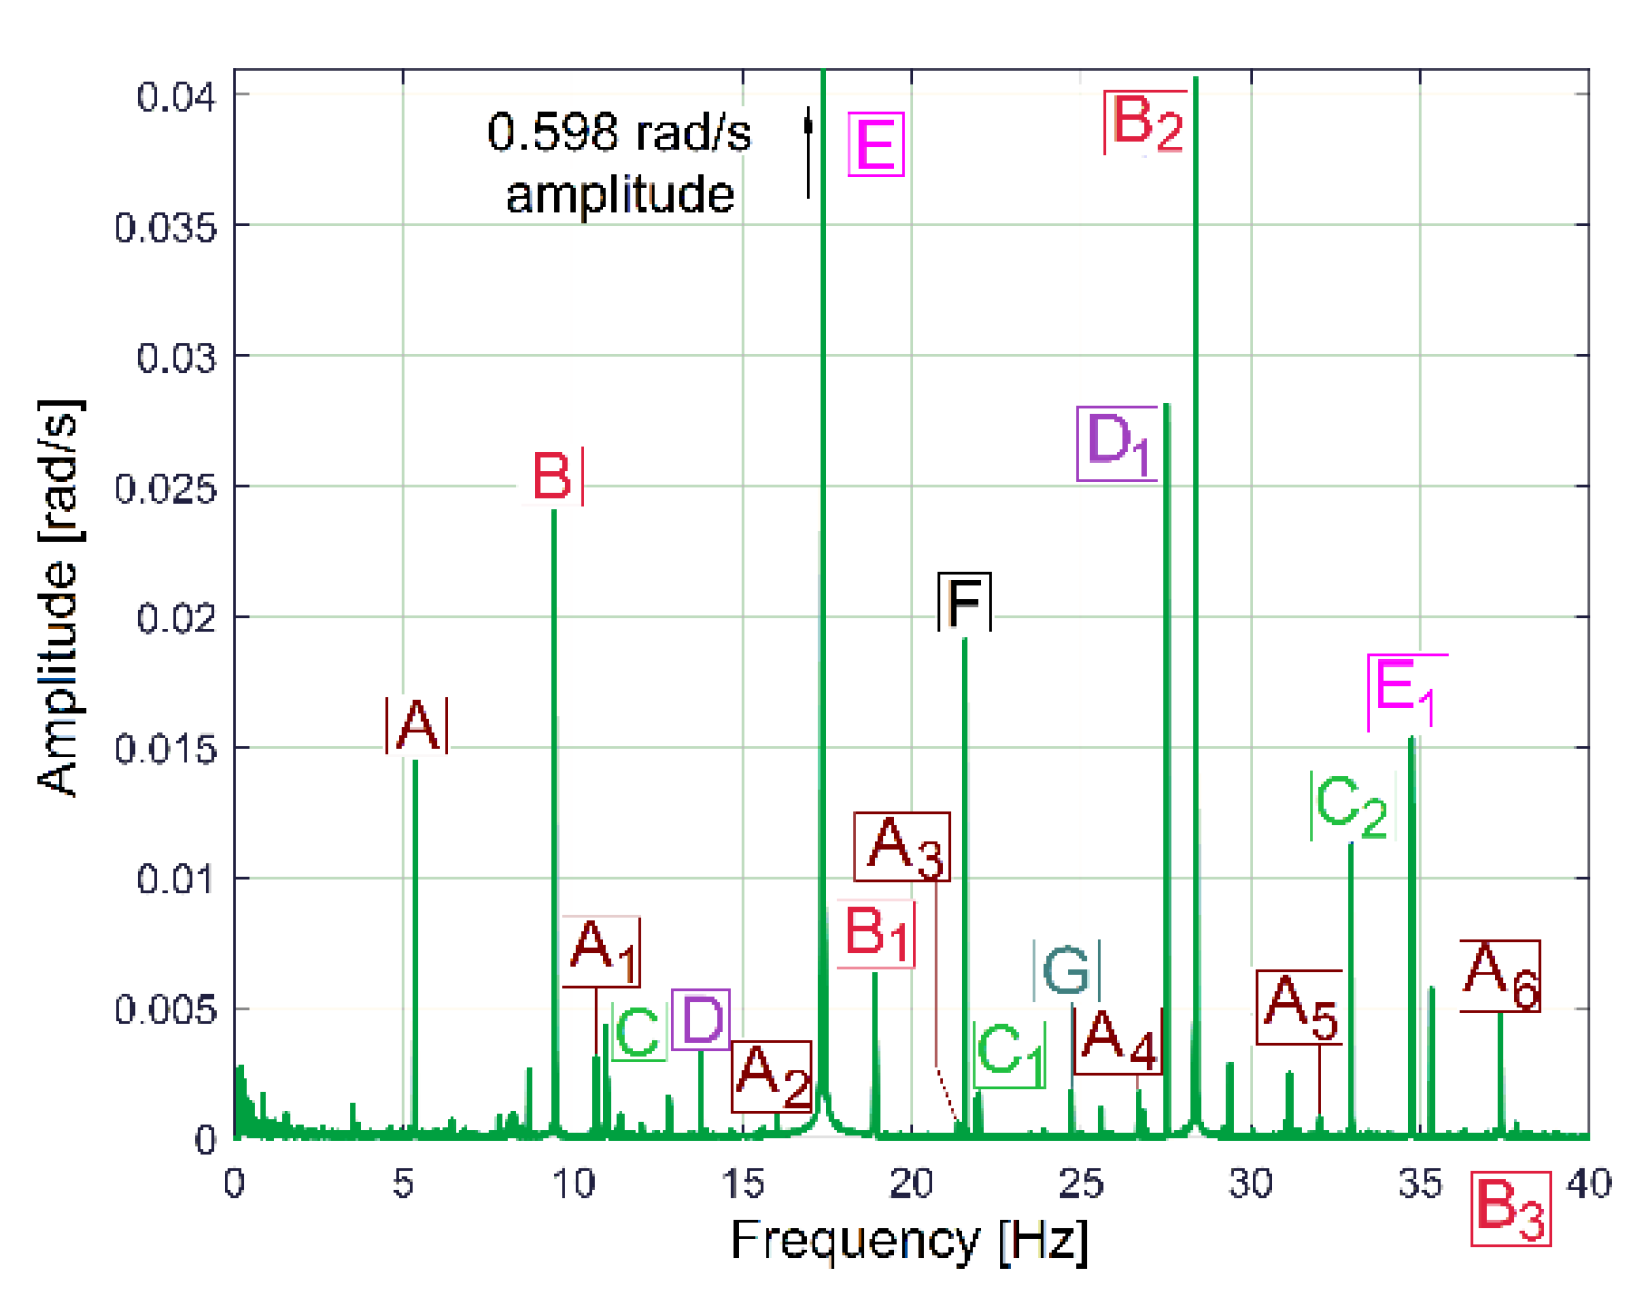
These periodical phenomena revealed before (as sums of sinusoids) can be associated with the normal behaviour (or malfunction) of gearbox mechanical parts (shafts, belts, bearings, etc.) using the relationship between the peak frequencies of fundamentals in the FFT spectrum and the rotation frequency of these parts inside the gearbox (running idle with constant rotation speed). Figure 9 and Table 1 describe the FFT spectrum of IP as having sinusoidal components (the fundamentals and some harmonics, in a frequency range of 0 ÷ 40 Hz) generated by the mechanical parts of the gearbox running idle, for the gearing diagram described in Figure 2. This spectrum, with the origins of its main peaks described in Table 1, is the first argument that IP is a predominantly deterministic signal, well distinguished from the noise.
The average value of the rotation frequency of shaft III and the spindle (17.37 s−1, or 1042.2 r.p.m., measured using the IASS sensor [46]) is exactly the value fE of the peak E. This means that these two mechanical parts (having theoretically the same frequency of rotation) produce together, for certain reasons, a mechanical loading (with the variable part revealed in Figure 9 and Table 1 by the spectrum component E as the fundamental and E1 as the first harmonic) on each rotation. This issue will be discussed later. As expected, because of the gears (and gear ratios), there are kinematic relationships between the frequencies of fundamentals fD, fE and fF (fD being the rotation frequency of the shaft II, fF the rotation frequency of the shaft I) as follows: fD = fE·38/48 and fF = fD·58/37. The ratio of flat belt 1 transmission ((139 + 2)/(121 + 2)) implies a well accomplished demonstration of the relationship fG = fF·(139 + 2)/(121 + 2). Here the thickness of the flat belt is 2 mm.
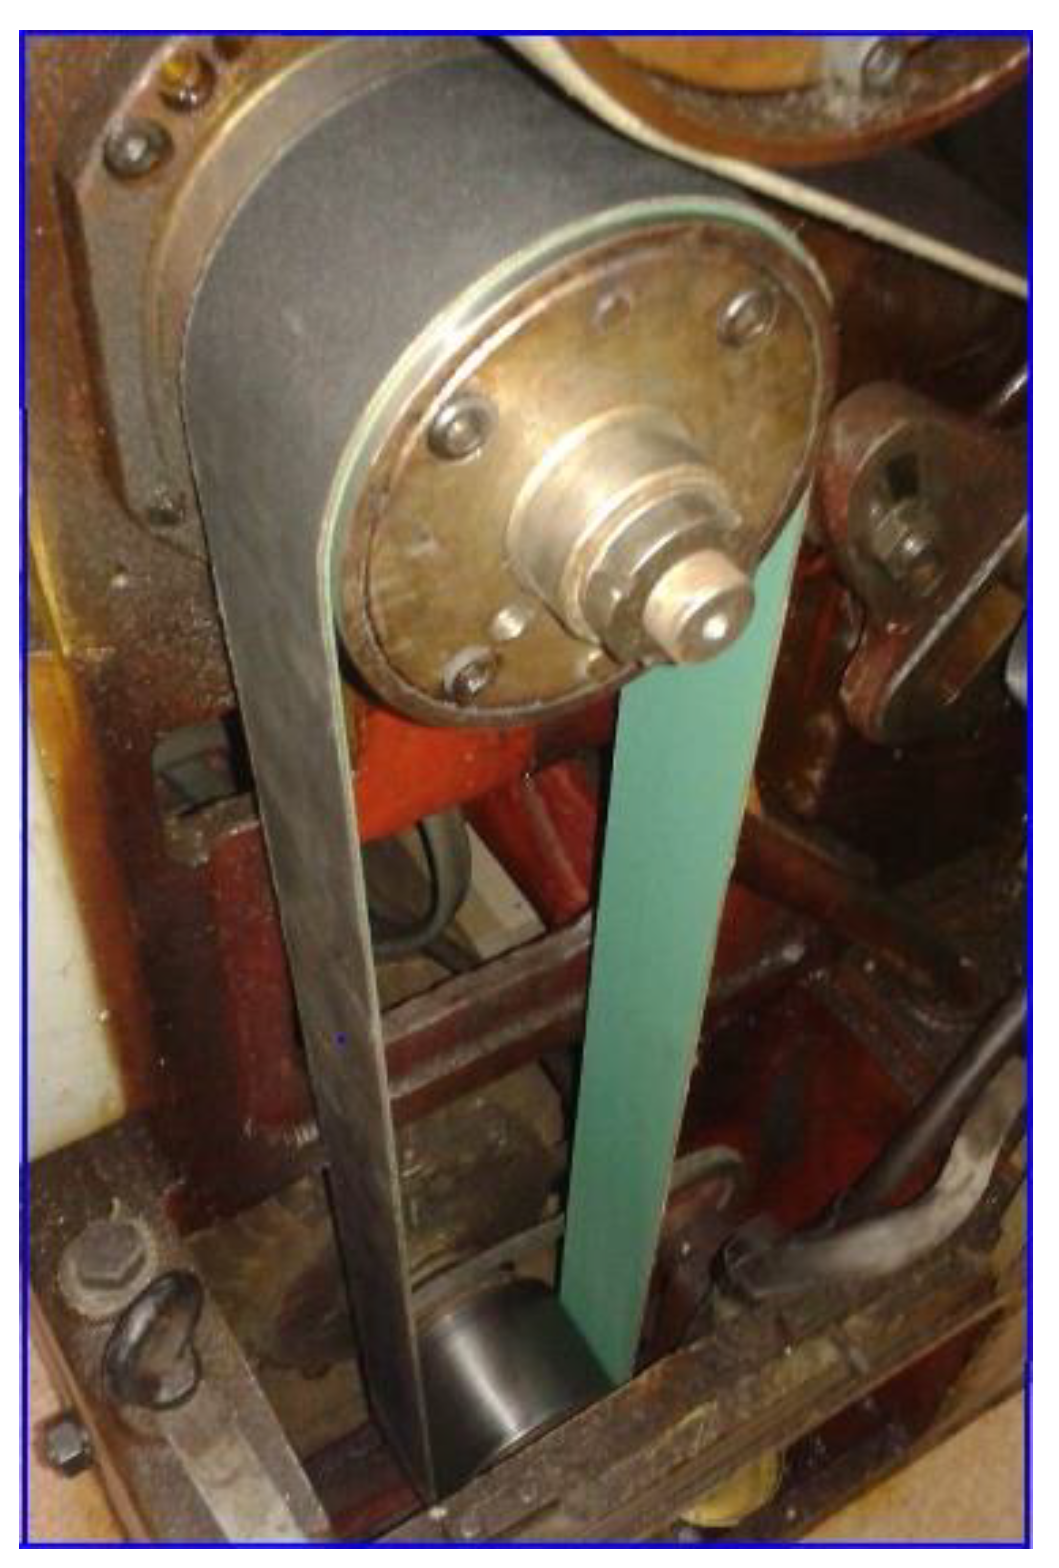
It is interesting to know why and how flat belt 1 (Figure 10) introduces a periodical instantaneous power (described in Table 1 by the components with frequencies fA, fA1 ÷ fA6). It is probably a matter of the stiffness variation of the belt along its entire length (lfb1). Flat belt 1 continuously moves with fA cycles per second.
When a portion with low stiffness (due to belt manufacturing errors or due to wear, such as a crevice or a tear) is placed on the tight side of the belt transmission, the transferred mechanical power decreases. In contrast, when this portion is not placed on the tight side, the transferred mechanical power increases.
This means that a torsional vibration is generated in the power transmission (having fA as its fundamental frequency, and fA1 ÷ fA6 as harmonics). If Dd1 is the diameter of the driven pulley, then the frequency fA of the fundamental component introduced by the first belt in the IP evolution is simply calculated as fA = fF·lfb1/(π·Dd1).
Similar comments are available for flat belt 2 (here the frequencies fB, fB1 ÷ fB3 are involved). In contrast with the first belt, flat belt 2 is 35 years older; it has bigger amplitudes for the fundamental and 2nd harmonic (on the fB and fB2 frequencies). Certainly, using the FFT of IP, structural damage to the belts can be detected and described (condition monitoring) long before they break by a severe increase in the amplitude of the fundamentals and/or some harmonics. This issue is supplementarily addressed in Section 4.2.
The amplitude of all other components (peaks) from FFT spectrum of IP revealed in Figure 9 and Table 1 are useful for condition monitoring of the shafts and the output spindle.
The behaviour of the gearbox parts can also be described by IPF spectrum, according to Figure 11, also, an FFT spectrum sequence between 0 ÷ 40 Hz. Almost all components already revealed in the FFT spectrum of the IP evolution (Figure 9) are also well described in the FFT spectrum of IPF (except B3). This means that the resources of the IPF spectrum are also useful in experimental research on condition monitoring. However, as a major disadvantage, the Nyquist limit for IPF evolution is very low: only 50 Hz.
Apparently, increasing the number of samples Ns of the IP sequence (e.g., from Ns = 2.5 Ms to Ns = 5 Ms, with the same sampling rate Fs = 25,000 s−1) decreases the frequency resolution of the FFT spectrum (from 0.01 to 0.005 Hz) while yielding better descriptions of the components in the frequency domain. Unfortunately, because of a slow fluctuation in the rotational speed of the AC induction motor rotor (mainly because of motor slip with the fluctuation of mechanical loading), an undesirable phenomenon occurs: spectral smearing [47]. As result, the FFT components are poorly described, as Figure 12 indicates (a zoomed-in detail, in the area of peaks D1 and B2 as revealed in Figure 9).
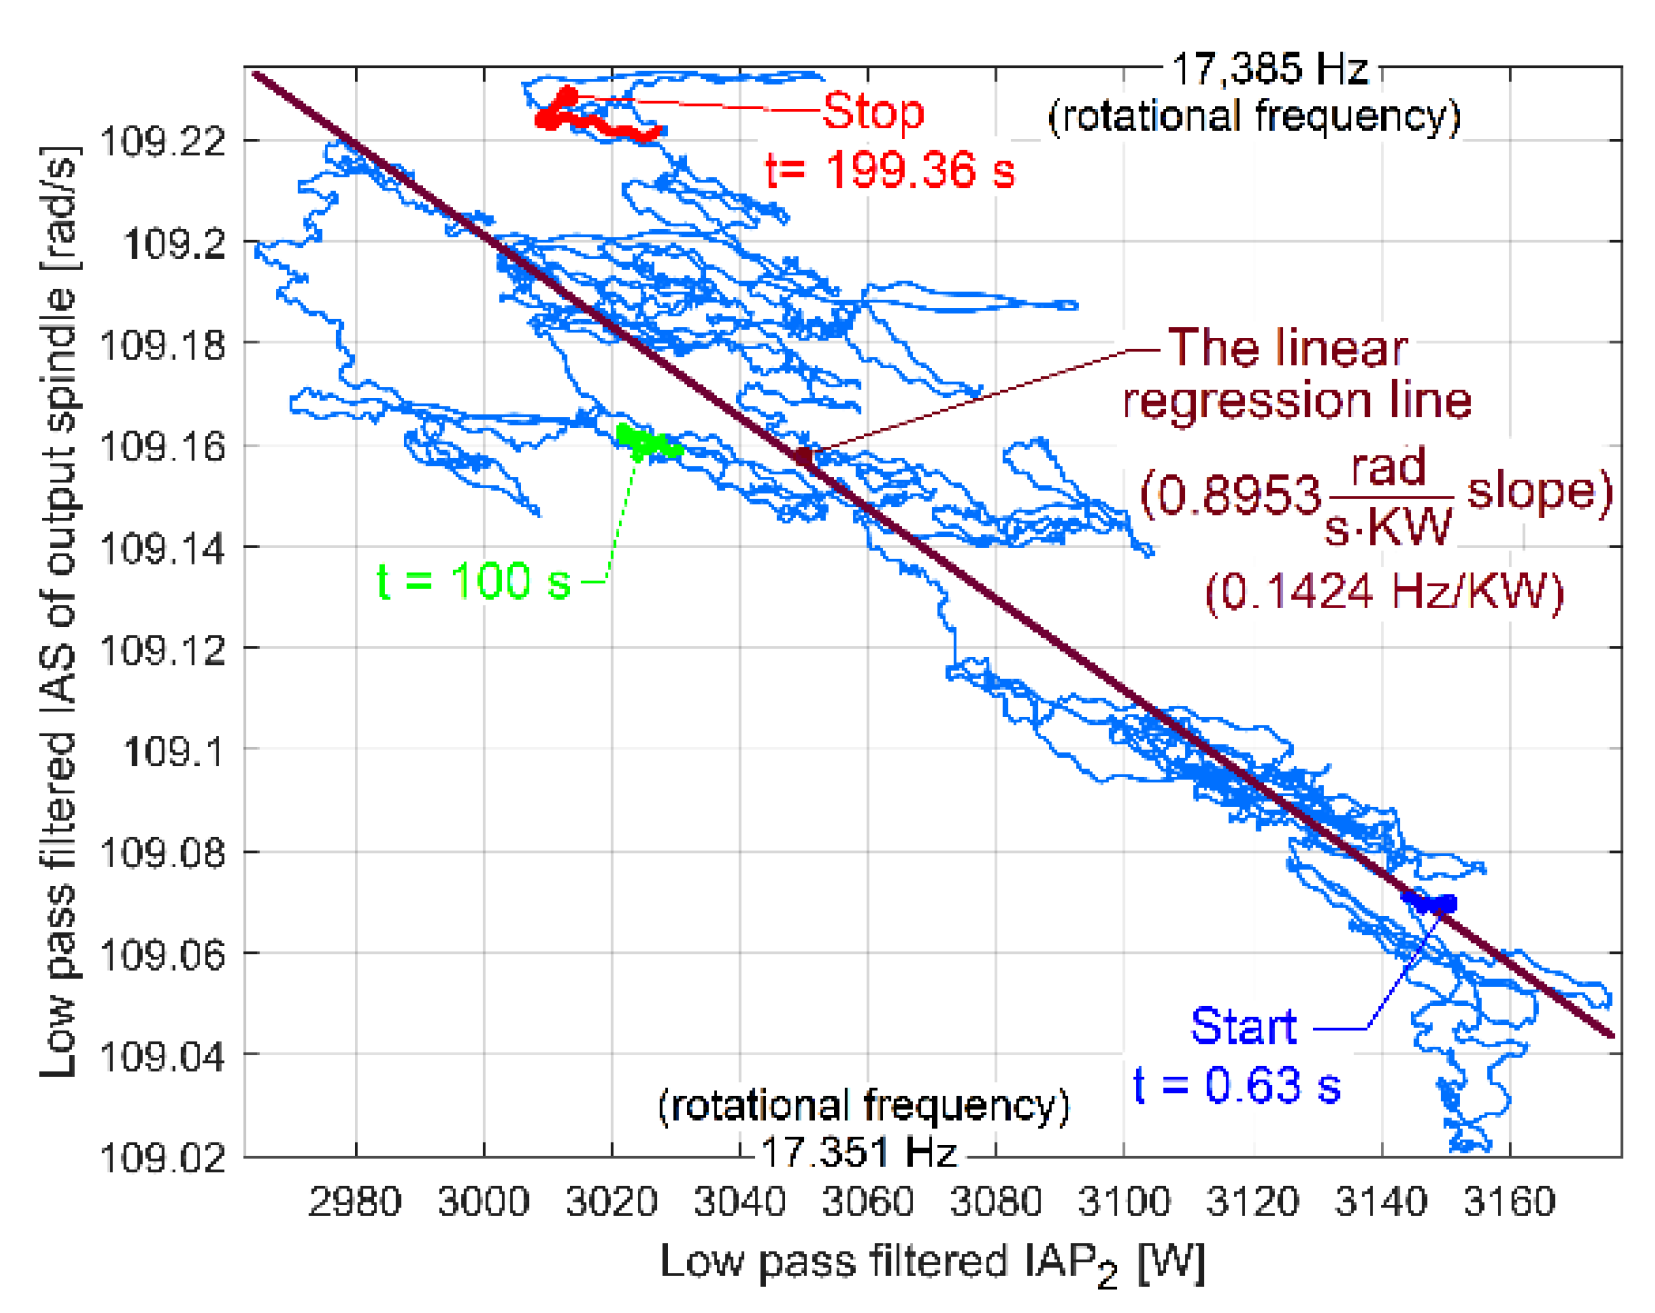
It is interesting for condition monitoring that the periodical phenomena earlier revealed in Figure 9 and Figure 10 are also mirrored in the FFT spectrum of the IAS measured at the spindle, as Figure 13 indicates. The IAS evolution also depends on mechanical loading, which shows another use for the AC induction motor as a sensor, as already revealed in a previous work [46]. The average value of the IAS of the spindle is 109.14 rad·s−1 (with 17.37 Hz average rotational frequency), the sampling frequency is 1737 s−1 and the number of samples is 173,700.
For condition monitoring purposes (and better results), it would be much better if the IAS sensor (IASS) were placed on the rotor of the AC induction motor (because normally the jaw chuck of the spindle should be permanently available to the work piece during the working process).
The FFT spectrum of the vibration signal VSS (from Figure 14, proportional with vibration velocity) delivered by the vibration sensor VS placed on the gearbox (Figure 1) describes the same periodical components already found before in the IP, IPF and IAS evolutions in frequency domains (Figure 9, Figure 10 and Figure 13).
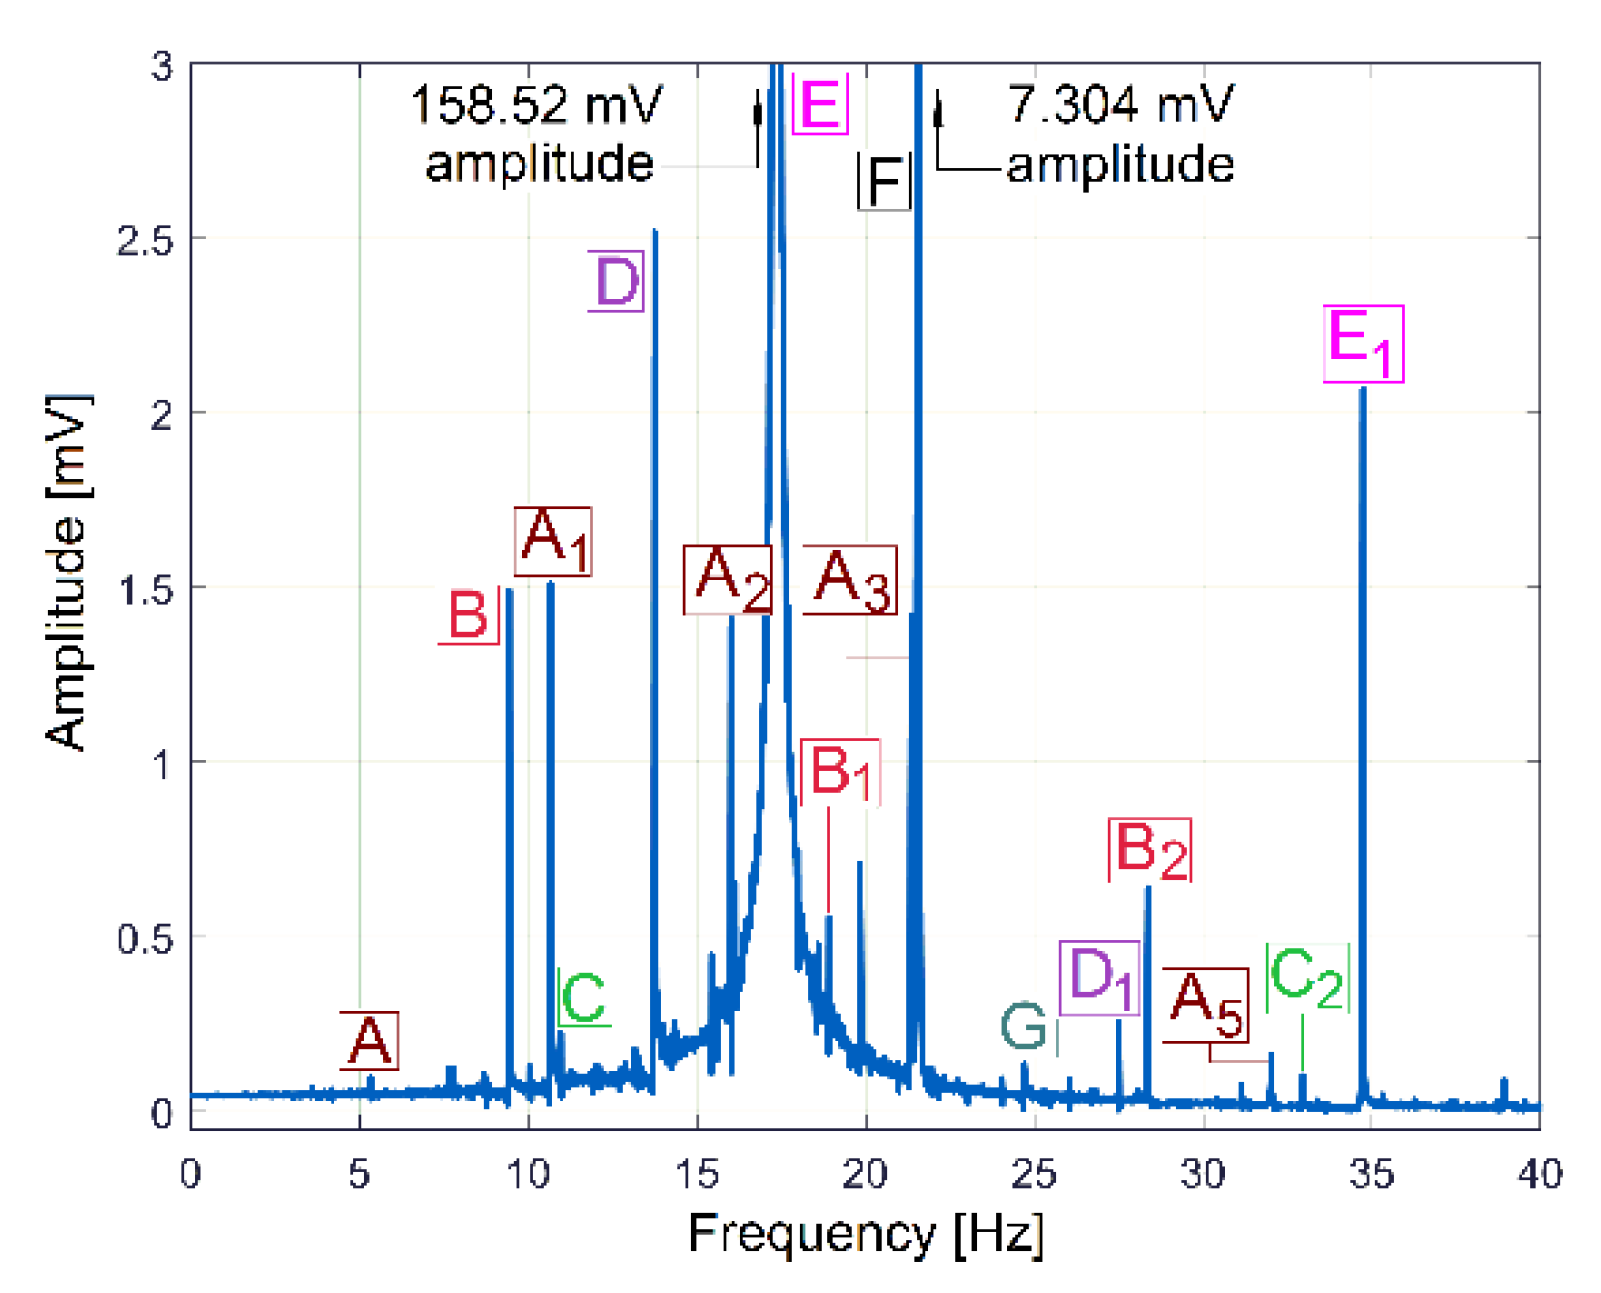
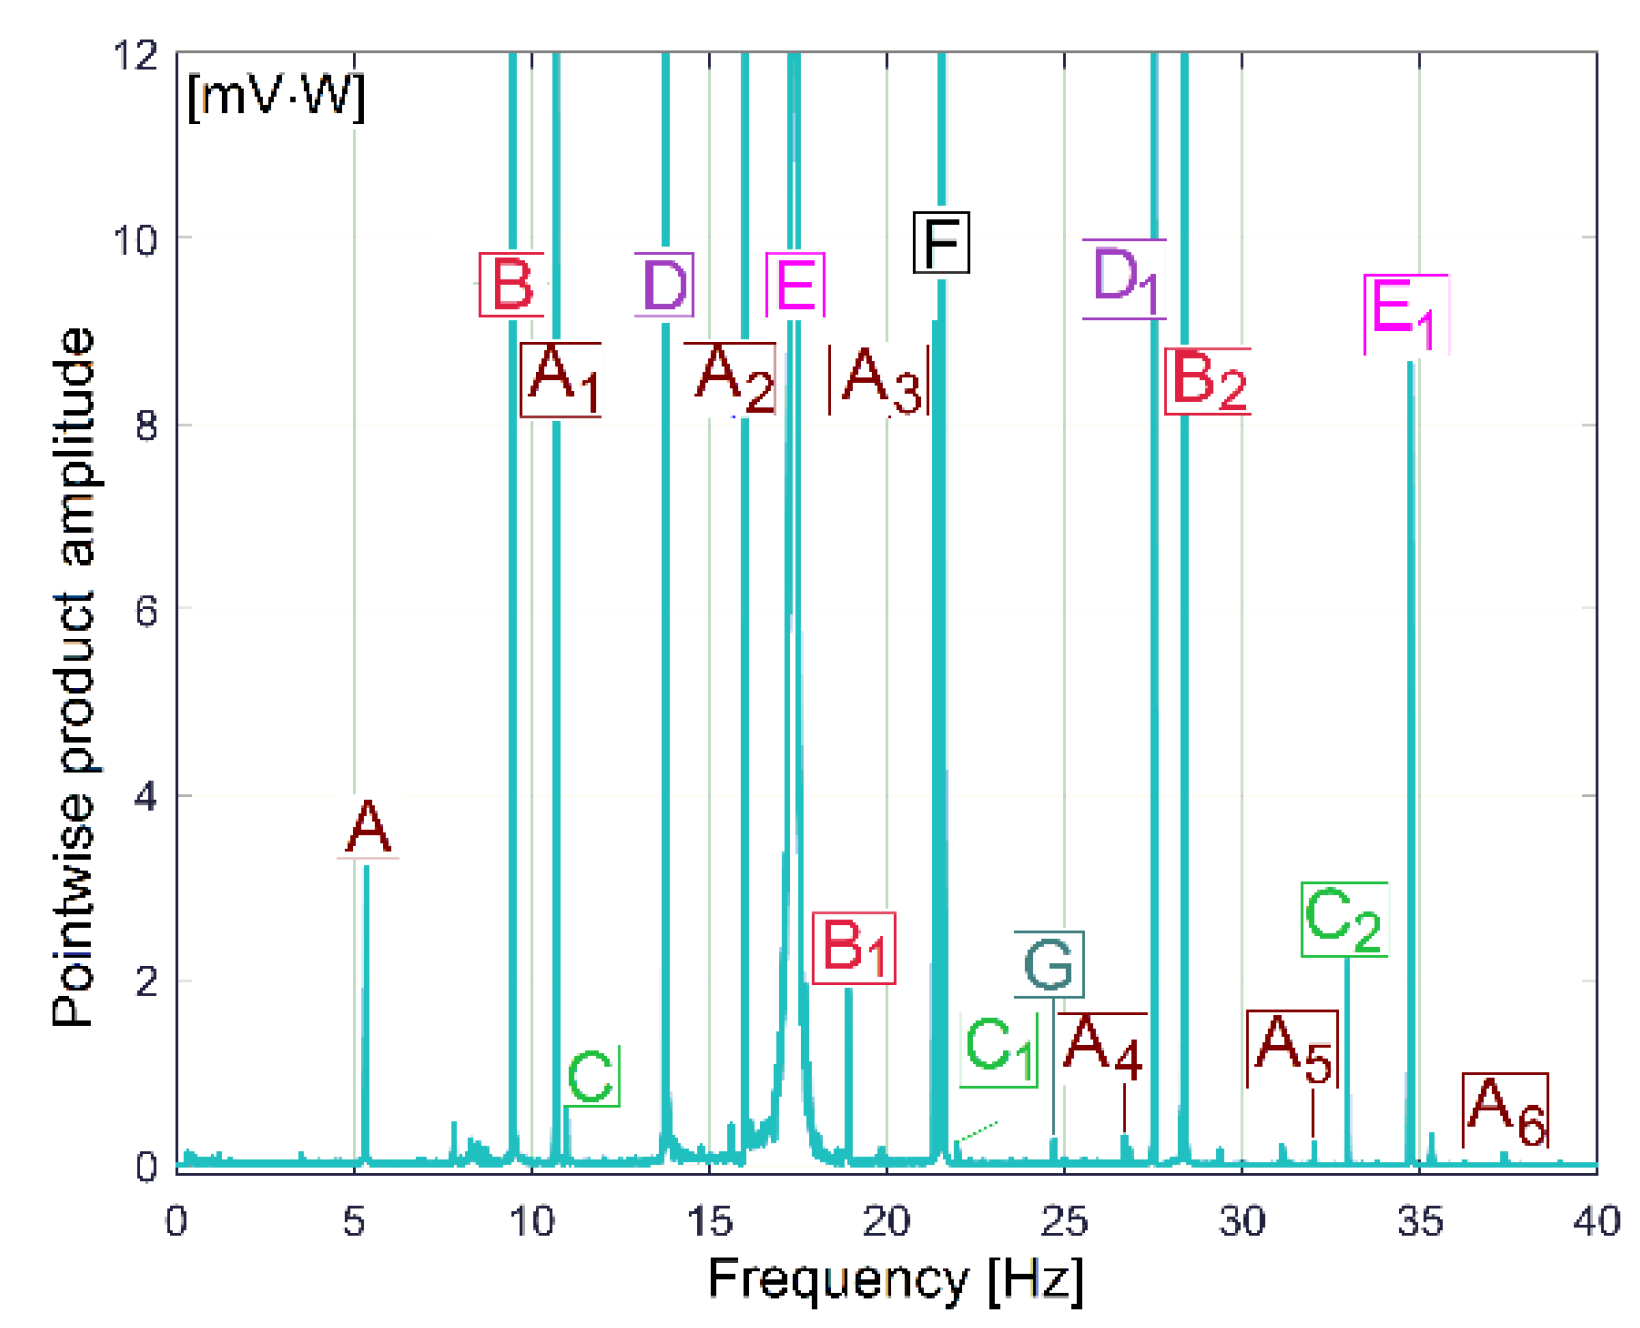
In Figure 14, the component E is dominant (as already was stated in Figure 3); it has the highest amplitude in the spectrum (158.52 mV, on the spindle rotational frequency of 17.37 Hz). In brief, this vibration component E is generated by shaft III and the output spindle rotation having unbalanced masses. It is strongly amplified by a mechanical resonance due to a low damped vibration mode of the entire lathe placed on its foundation (18.79 Hz frequency, 5.899 s−1 damping constant [48]). This issue will be supplementarily discussed later on. Apart from the comparison of the similarities between Figure 9 and Figure 14, giving two different ways to describe the behaviour of the same gearbox parts (with IP and VSS spectra), it is more appropriate to check these similarities using the pointwise product of FFT spectra for IP and VSS, as Figure 15 indicates. This is possible because the evolutions of IP and VSS are numerically described with the same sampling rate (Fs = 25,000 s−1) and the same number of samples (Ns = 2.5 Ms).
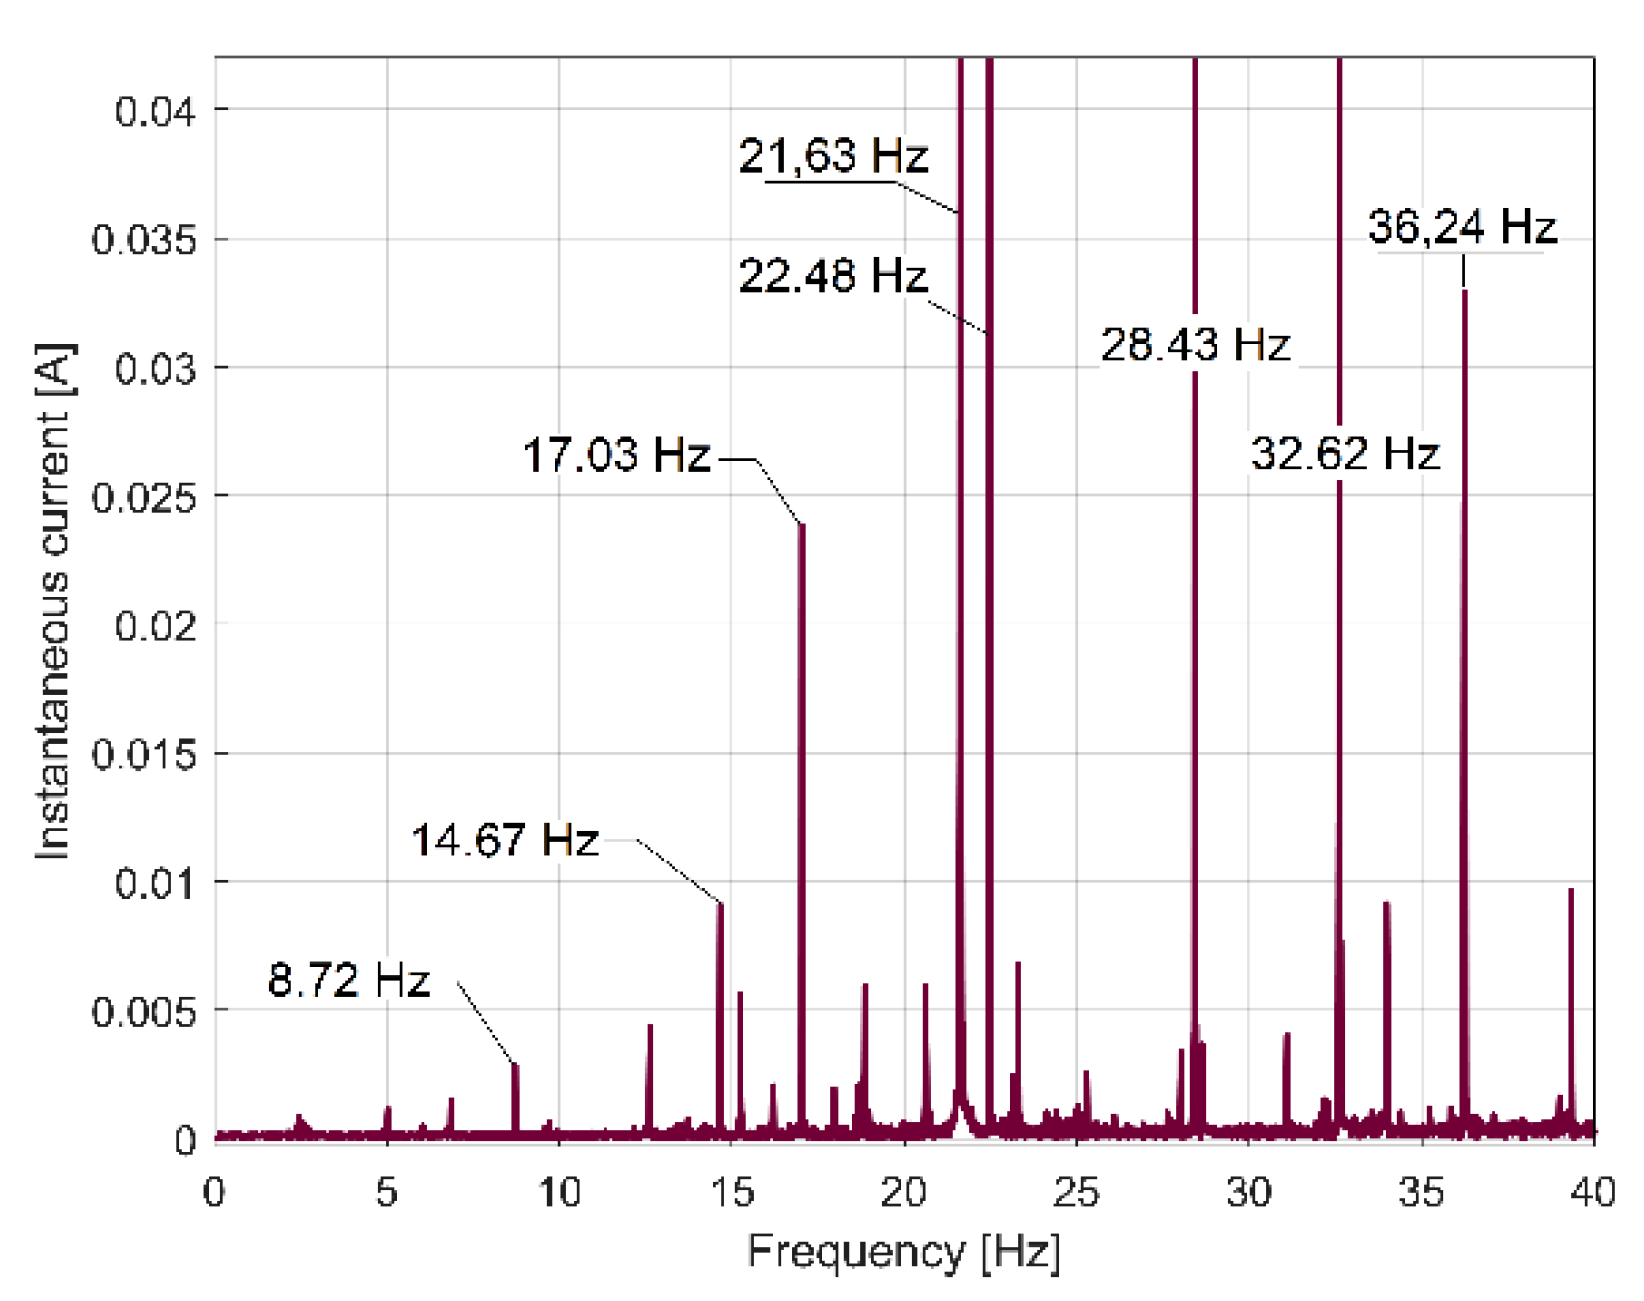
It astonishes us that, contrary to any expectations, there is not any similarity between the FFT spectra of IC (depicted in Figure 16) and IP (from Figure 9). It seems that the IC evolution is not suitable for condition monitoring, at least when using our method to obtain the FFT spectra.
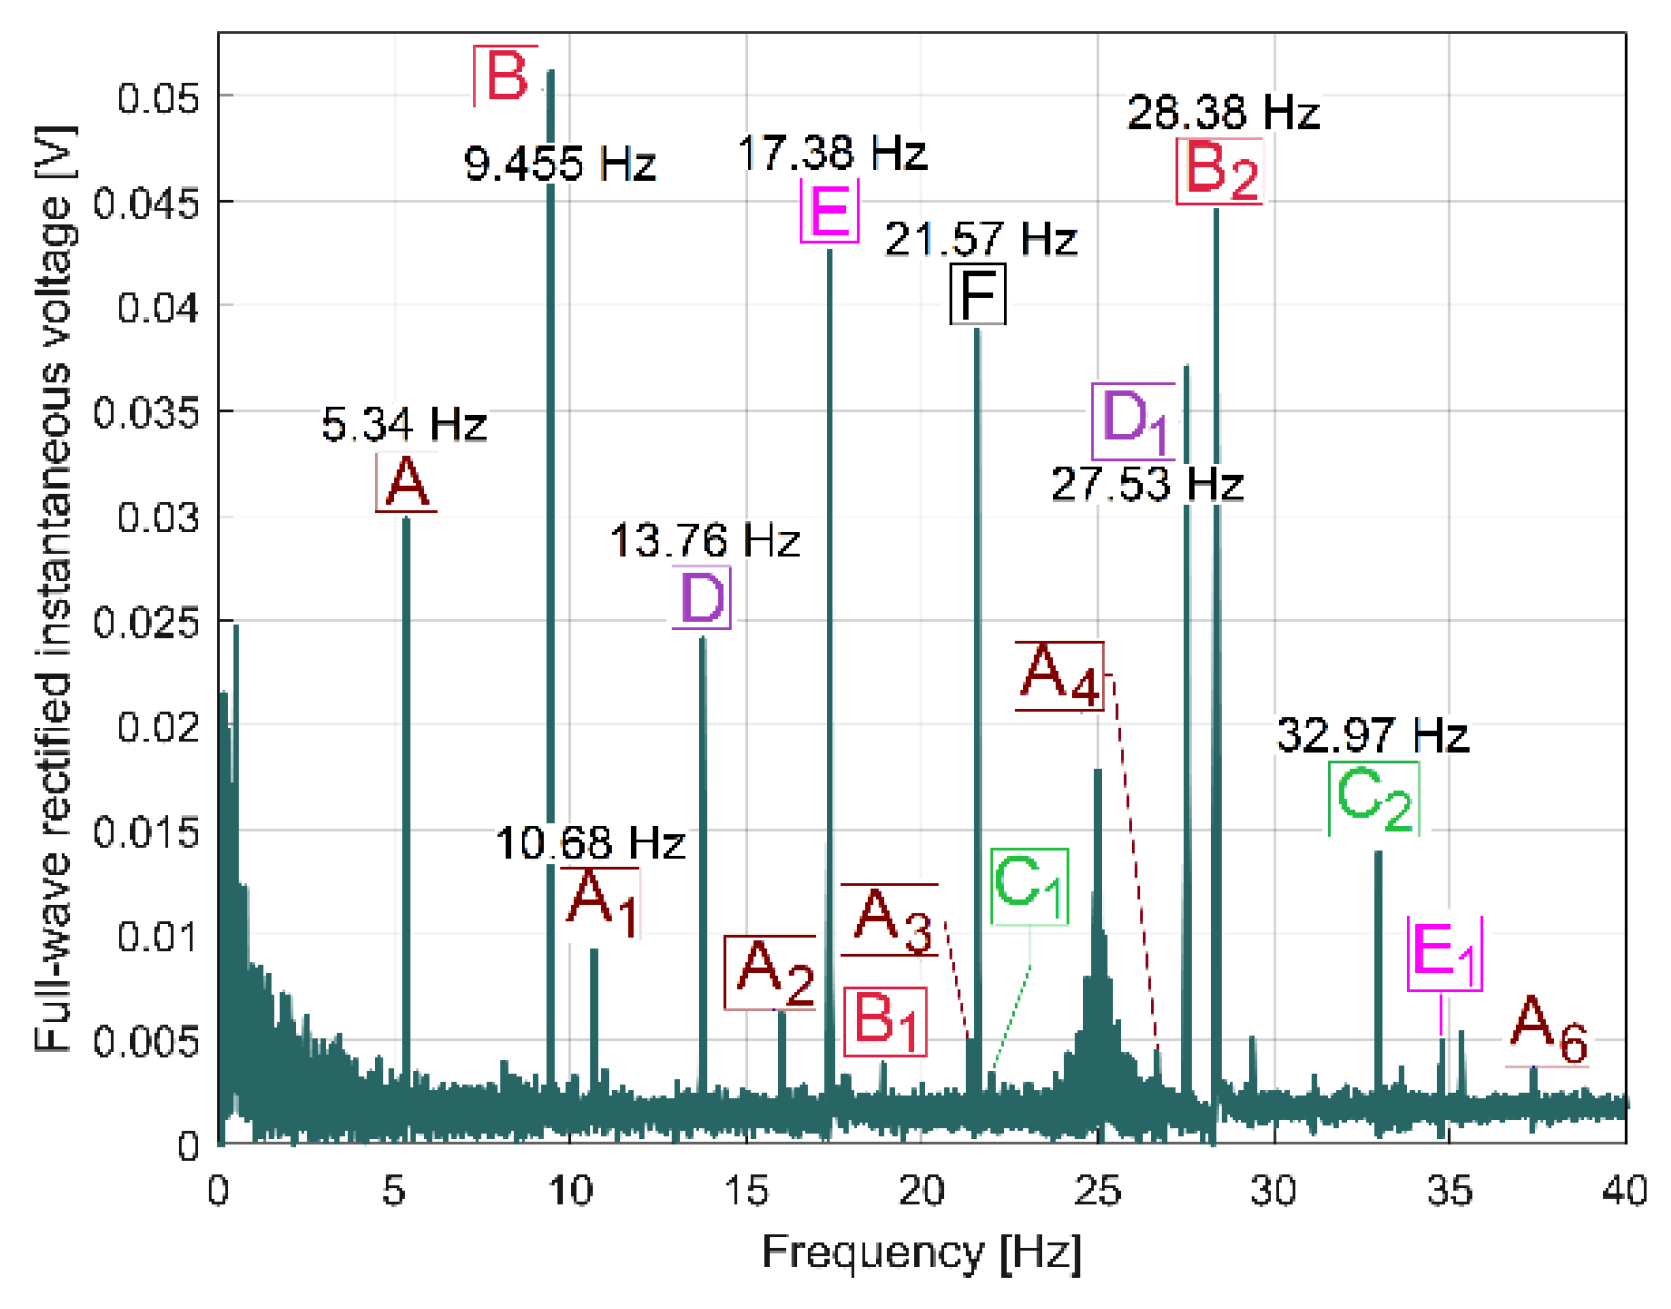
However, we discovered that if, instead of IC spectrum, the full-wave rectified instantaneous current (as RIC) spectrum is used, the result is totally changed, as Figure 17 indicates (the same magnitude was used for Figure 16 and Figure 17). Now, there are strong similarities between the FFT spectra of RIC and IP (Figure 9 and Figure 17 have almost the same components, which are placed at the same frequencies in spectra). We should mention that, while IC is described with iA[tk] samples, RIC is described with |iA[tk]| samples (as a modulus function applied to iA[tk] sample). It is obvious that RIC also provides useful information for condition monitoring, but probably no better than IP, mainly because IP (and its derivatives IAPA1 and IAPA2, as well) is more strongly related to mechanical loading than IC and RIC. It is known that IC and RIC are not able to describe a negative mechanical power flow delivered by a motor during a transient regime [1], when the AC motor works as a braking system.
A similar study was performed on IV, the second constituent of IP. Theoretically, IV should be permanently constant (as amplitude and frequency), indifferent to the IP absorbed by the AC induction motor. However, because each of the three wires used to supply the AC motor has a non-zero electrical resistivity, the variation of IC generates a variation of the voltage drop in these wires (due to the Ohm’s law), which implies the variation of IV measured at the input of the AC induction motor.
As expected (and similarly to the IC spectrum), the IV spectrum (depicted in Figure 18) does not have any similarities with the IP spectrum from Figure 9. However, if the IV evolution (described with uA[tk] samples) is replaced by the full-wave rectified instantaneous voltage (as RIV, described with |uA[tk]| samples), the spectrum of RIV (depicted in Figure 19) has strong similarities with the IP spectrum (and the RIC spectrum as well), as a comparison between Figure 9 and Figure 19 proves. This means that RIV also provides useful information for condition monitoring, but certainly no better than IP or RIC (due to an important noise in the spectrum).
For the time being, we do not have a feasible explanation for why the IC and IV spectra (generated by FFT in Matlab) are not relevant in condition monitoring, in comparison with the RIC and RIV spectra. However, we should mention that there are strong similarities between the IC and IV spectra, related to the frequency of some relevant components, as a comparison between Figure 16 and Figure 18 proves.
It is not surprising that the behaviour of many of the gearbox’s rotating parts is mirrored simultaneously, particularly in FFT spectra of the IP and VSS signals. As an example, any unbalanced rotating shaft inside the gearbox acts as a sinusoidal vibration exciter that moves the lathe periodically on its foundation (acting as an excited spring-mass-damper system). A fundamental on-shaft rotation frequency on the FFT spectrum of VSS occurs.
When we talk about the amplitudes of the vibratory motions generated by the unbalancing of shaft III and the output spindle, these amplitudes depend on the mass unbalanced, the almost identical rotation frequency (17.37 Hz) and the proximity to the mechanical resonance frequency of the lathe on its foundation (a 18.79 Hz frequency, with a damping constant of 5.899 s−1 [48]).
Obviously, the mechanical power necessary to supply this sinusoidal motion (as vibration excitation power, maximal at mechanical resonance) is delivered by the AC induction motor. This excitation power is a constituent of IP absorbed by the motor from the electrical supply system and is described as a peak in the IP FFT spectrum. As an example of gearbox failure, a bent shaft regularly needs a mechanical power to rotate it, such as drive power. Corresponding to the variable (periodical) part of this drive power, a fundamental on its rotation frequency and some harmonics on the IP FFT spectrum are generated. The rotation of this bent shaft generates a deformation of the gearbox housing, sometimes perceived as vibration by the vibration sensor (a fundamental on its rotation frequency and some harmonics on FFT spectrum of VSS are generated). A similar approach is available for many other anomalies involving the rotating parts inside the gearbox (e.g., bearing misalignment, gear run out, damaged belts, etc.).
Sometimes, the mechanical variable power necessary to rotate a bent shaft with a mechanical imbalance (e.g., shaft III or/and the output spindle, with the variable power depicted by peak E in Figure 9) has two cumulated constituents with the same (rotation) frequency, often with a phase shift between: one constituent is the periodical part of the drive power used to rotate the shaft if the imbalance is ignored; the other constituent is the vibration excitation power, used to supply only the vibration motion of the lathe on its foundation, excited by the mechanical imbalance of this rotary shaft.
A particular rotational property of shaft III and the output spindle, revealed in a previous work [48], is useful to highlight the existence of these two constituents in the evolution of IP (drive power and vibration excitation power): a beating phenomenon in the vibrations of the gearbox (together with the lathe on its foundation) with nodes and antinodes, as is experimentally described by the evolution of the VSS signal (curve 1 in Figure 20) with Ns = 5 Ms and Fs = 25,000 Hz during 200 s, with the gearbox running idle as previously.
This beating phenomenon (generated by vibration superposition with constructive and destructive interferences) occurs because there is a very small difference (less than 0.01 Hz) between the rotation frequencies (or IAS) of the output spindle and shaft III (due to a slight sliding of flat belt 2 on its pulleys) and due to a mechanical imbalance of shaft III and the output spindle. The amplitude of beating vibrations increases a lot because of a resonant amplification of the lathe suspension on its foundation, previously highlighted in [48]. Normally, we should observe two very close peaks on the FFT spectrum of VSS: a peak generated by shaft III and another peak generated by the output spindle. Nevertheless, because there is not a small enough frequency resolution in the FFT of VSS, and because there is a very small difference in the rotation frequency of the output spindle compared with that of shaft III, a single peak occurs in the VSS spectrum (as dominant peak E in Figure 14, having the frequency fE = 17.37 Hz).
The variation in time of the amplitude of the dominant peak E (and the relationship with the amplitude of the beating vibration phenomenon) should be experimentally revealed. This paper proposes an appropriate method, as described below.
It is expected that the FFT spectrum of a short movable sequence of VSS (as SMSVs, with Nss samples, and Nss << Ns) will reveal that the amplitude of peak E (the dominant component in VSS) is variable in time, with an evolution close to that of the amplitude of the beating vibration. On the FFT spectrum of each SMSVs having the average time tAEj, a value for the amplitude of peak E (as AEVs) is available. Any two successive SMSVs (eventually with an overlap between them) produce two successive samples, AEVs(tAEj) and AEVs(tAEj + 1).
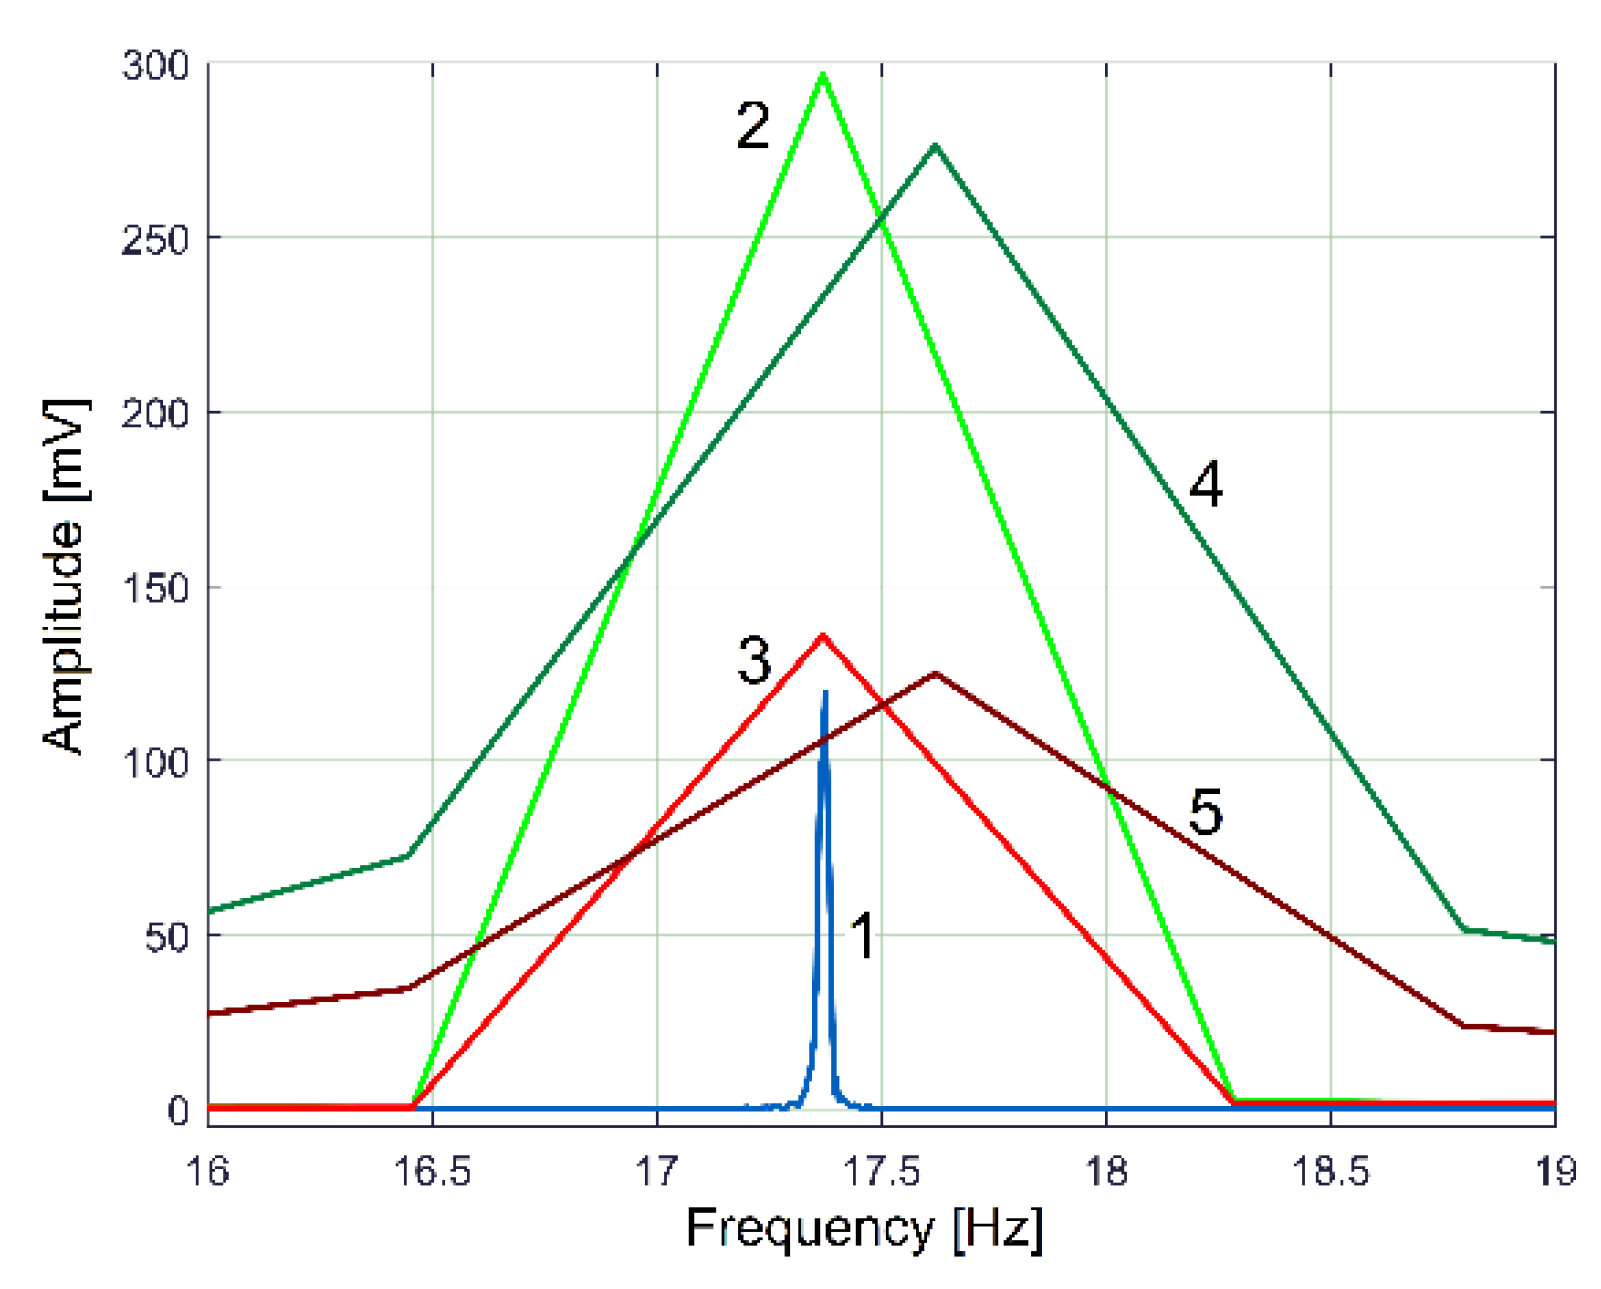
There is a major difficulty to this approach: the FFT frequency resolution of SMSVs is very small (Fs/Nss >> Fs/Ns). In order to detect exactly the (average) value of the amplitude of the peak E inside a SMSVs, it is mandatory to accomplish exactly the condition k·Fs/Nss = fE. In other words, the frequency k·Fs/Nss of the kth sample on the FFT spectrum of each SMSVs should have exactly the value fE, or should at least have the closest value possible of k·Fs/Nss relative to fE, taking into account the fact that k and Nss are positive integers. For fE = 17.37 Hz and Fs = 25,000 s−1, a computer-assisted trial algorithm produces the appropriate value of Nss = 27,346 (for k = 19), with k·Fs/Nss = 17.369999 Hz ≈ fE = 17.37 Hz.
In Figure 21, the advantages of this method of using the FFT spectrum of SMSVs are revealed.
Curve 1 depicts the peak E on the entire FFT spectrum of VSS, with Ns = 5 Ms. It describes the frequency very well but gives a bad description of amplitude (expected to be close to the average value of the amplitudes on curve 1, Figure 20). Curve 2 in Figure 21 depicts the peak E on the FFT spectrum of a single SMSVs placed in the area of the first antinode in Figure 20, while curve 3 in Figure 21 depicts the peak E on the FFT of a single SMSVs in the area of the second node in Figure 20 (both SMSVs with Nss = 27,346 samples for the best fulfilment of the previously defined condition k·Fs/Nss = fE). Despite a very small frequency resolution, as expected, there is a good description of the frequency and, very importantly, a good description of the amplitudes (compared with the amplitudes of the nodes and antinodes in Figure 20, curve 1). Using this SMSVs movably on the entire VSS signal (Ns = 5 MS, with 1000 samples of overlap between two successive SMSVs), the complete AEVs evolution is obtained and described with curve 2 in Figure 20, which uses 4946 samples. A computer program was developed in order to find the description of each AEVs(tAEj) sample on the AEVs evolution.
Two arguments explain why the AEVs evolution from curve 2 in Figure 20 is slightly different from the amplitude of VSS (of curve 1): firstly, each sample on AEVs is the average of an SMSVs; secondly, the VSS signal contains many other vibration components (some of them already revealed in Figure 14). A wrong value for Nss in SMSVs (e.g., Nss = 21,282) inaccurately describes the peak E in the FFT of SMSVs (in frequency and amplitude), as Figure 21 proves, with curve 4 for the amplitude in the first antinode and curve 5 for the amplitude in the second node. Consequently, the evolution of AEVs found using this wrong value of Nss (curve 3 in Figure 20) is not correctly described.
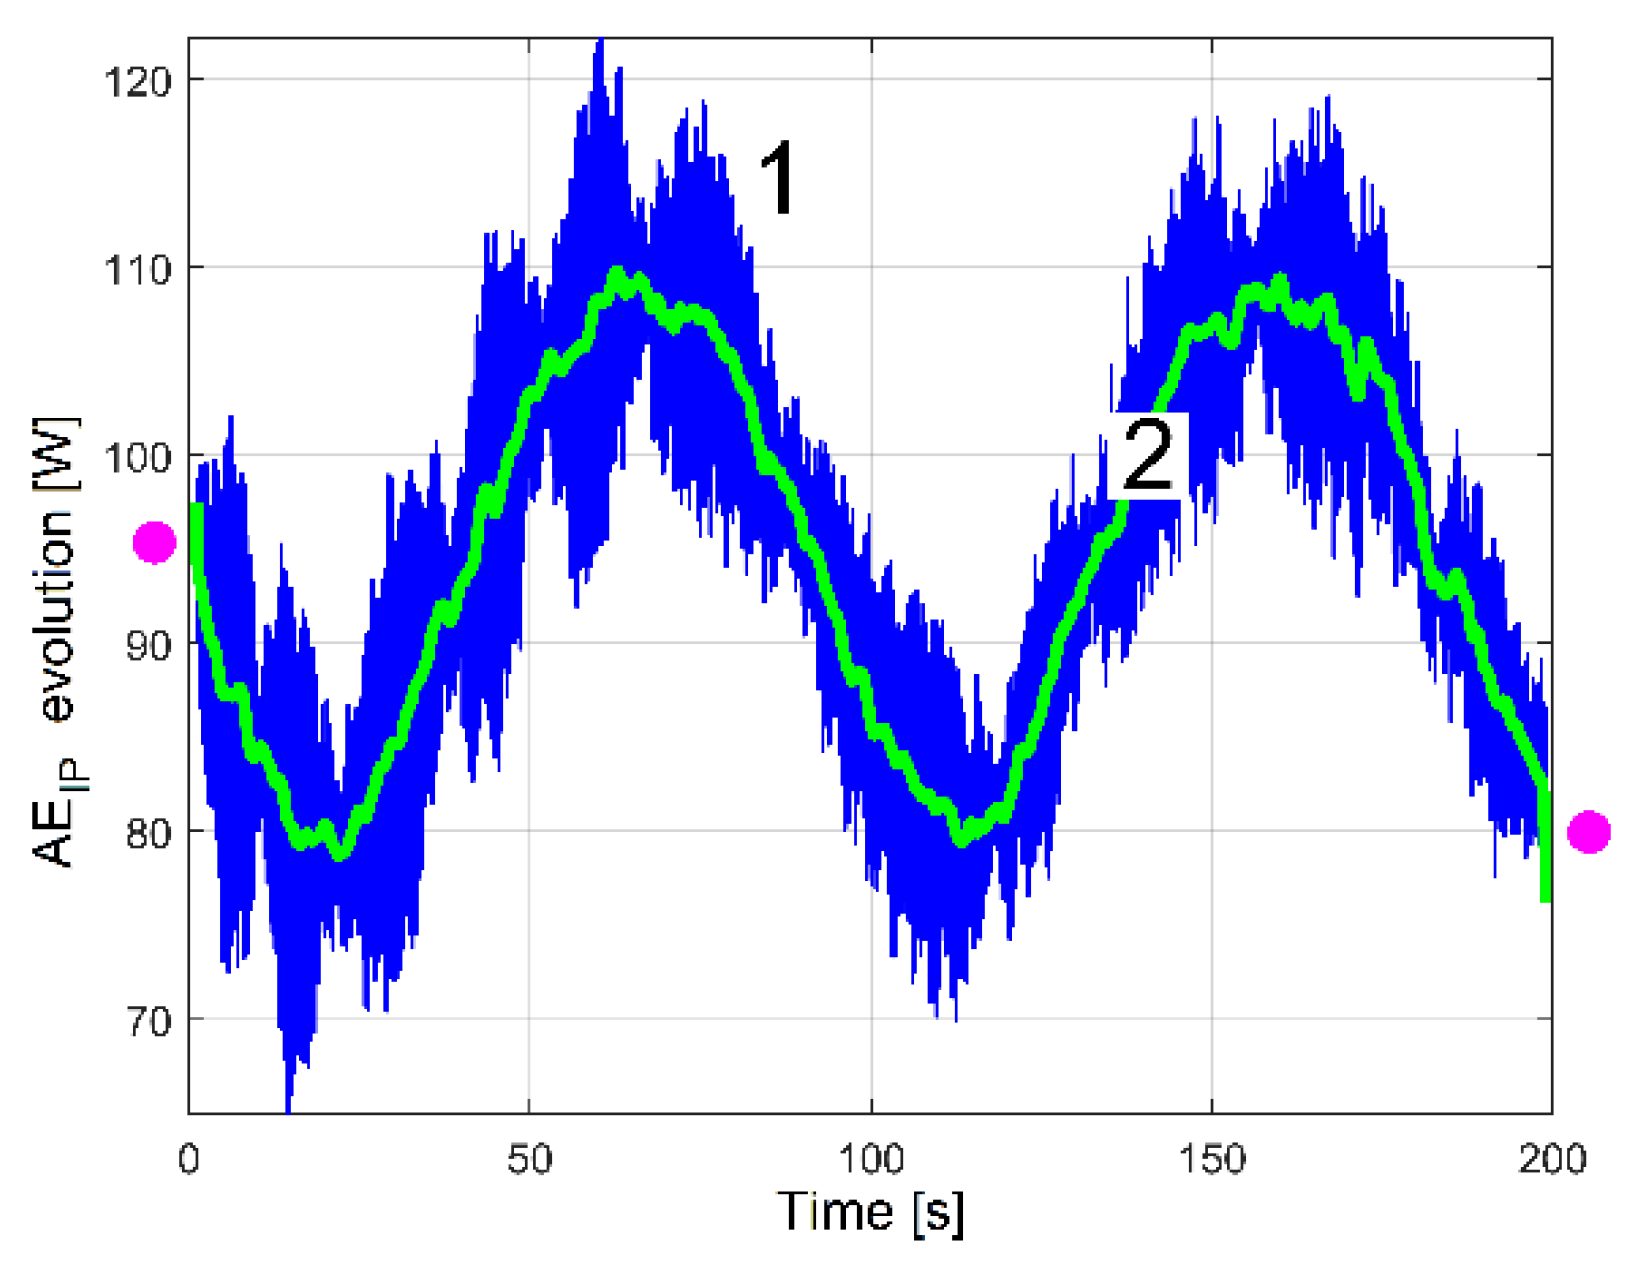
A hypothesis can be formulated: the beating phenomenon in the vibration should be mandatorily mechanically powered by the electrical power absorbed by the AC motor. A beating phenomenon generated by the superposition of two sinusoidal components of the IP having very close frequencies should take place (one component—having the frequency fEIII—related to shaft III’s imbalance and its rotational frequency, the other—having the frequency fES—related to the output spindle’s imbalance and its rotational frequency), both as mechanical power components used to excite these vibrations. The same type of evolution for amplitude of peak E (already revealed in the VSS evolution, curve 2 in Figure 20) should be observed in the IP evolution (as AEIP) during the same experiment previously conducted for VSS (Ns = 5 Ms and Fs = 25,000 Hz). Here, the same FFT analysis with short movable sequences of IP (as SMSIP, also with Nss = 27,346 samples and 1000 samples of overlap) was performed. The previously formulated hypothesis is fully confirmed in Figure 22.
It is obvious that AEIP (curve 1) has a noisy evolution. It is experimentally proved now that AEIP has relatively important variations of amplitude. In order to reduce the noise, this evolution from curve 1 can be low pass numerically filtered through the medium of three consecutive moving average filters (with 20, 10 and 5 samples in average), with the result depicted with curve 2 (as averaged AEIP, also having 4946 samples). A strong reduction of the noise can be obtained also (before filtering) if the number of samples from SMSIP is doubled, tripled, etc., keeping the same overlap.
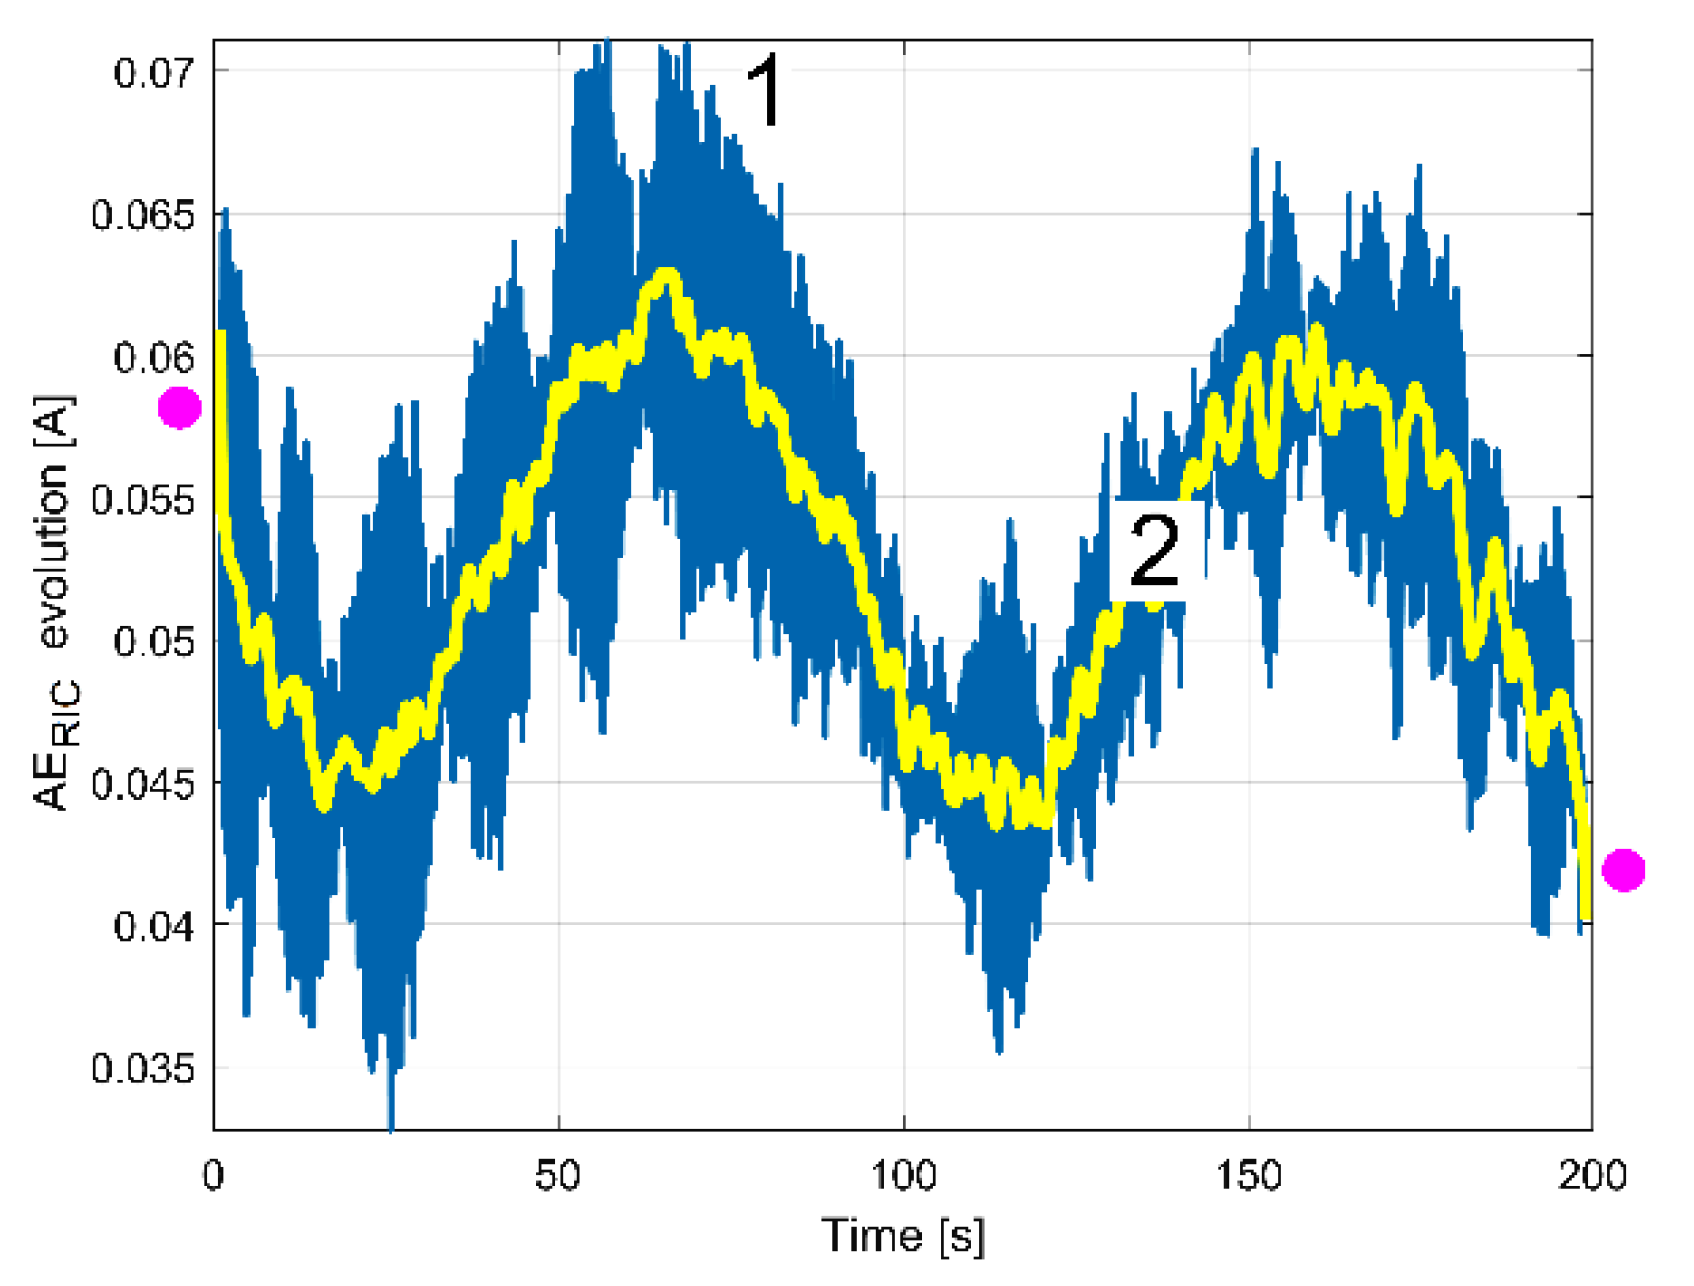
The FFT analysis of the IP evolution was repeated in exactly the same manner for the RIC evolution, in order to find out the evolution of the peak E amplitude in RIC (with a short movable sequence of RIC as SMSRIC, also with Nss = 27,346 samples and 1000 samples overlap). The results (as AERIC evolutions) are depicted in Figure 23. All the considerations and comments made in Figure 22 (e.g., the filtering of curve 1) are also applicable here. The similarities between curves 2 in Figure 22 and Figure 23 are obvious, despite the fact that curve 2 from Figure 23 (as averaged AERIC evolution) is more poorly defined.
In the start and in the end areas of Figure 22 and Figure 23 (marked with pink dots), a couple of distorted values generated by filtering (edge effect) should be ignored.
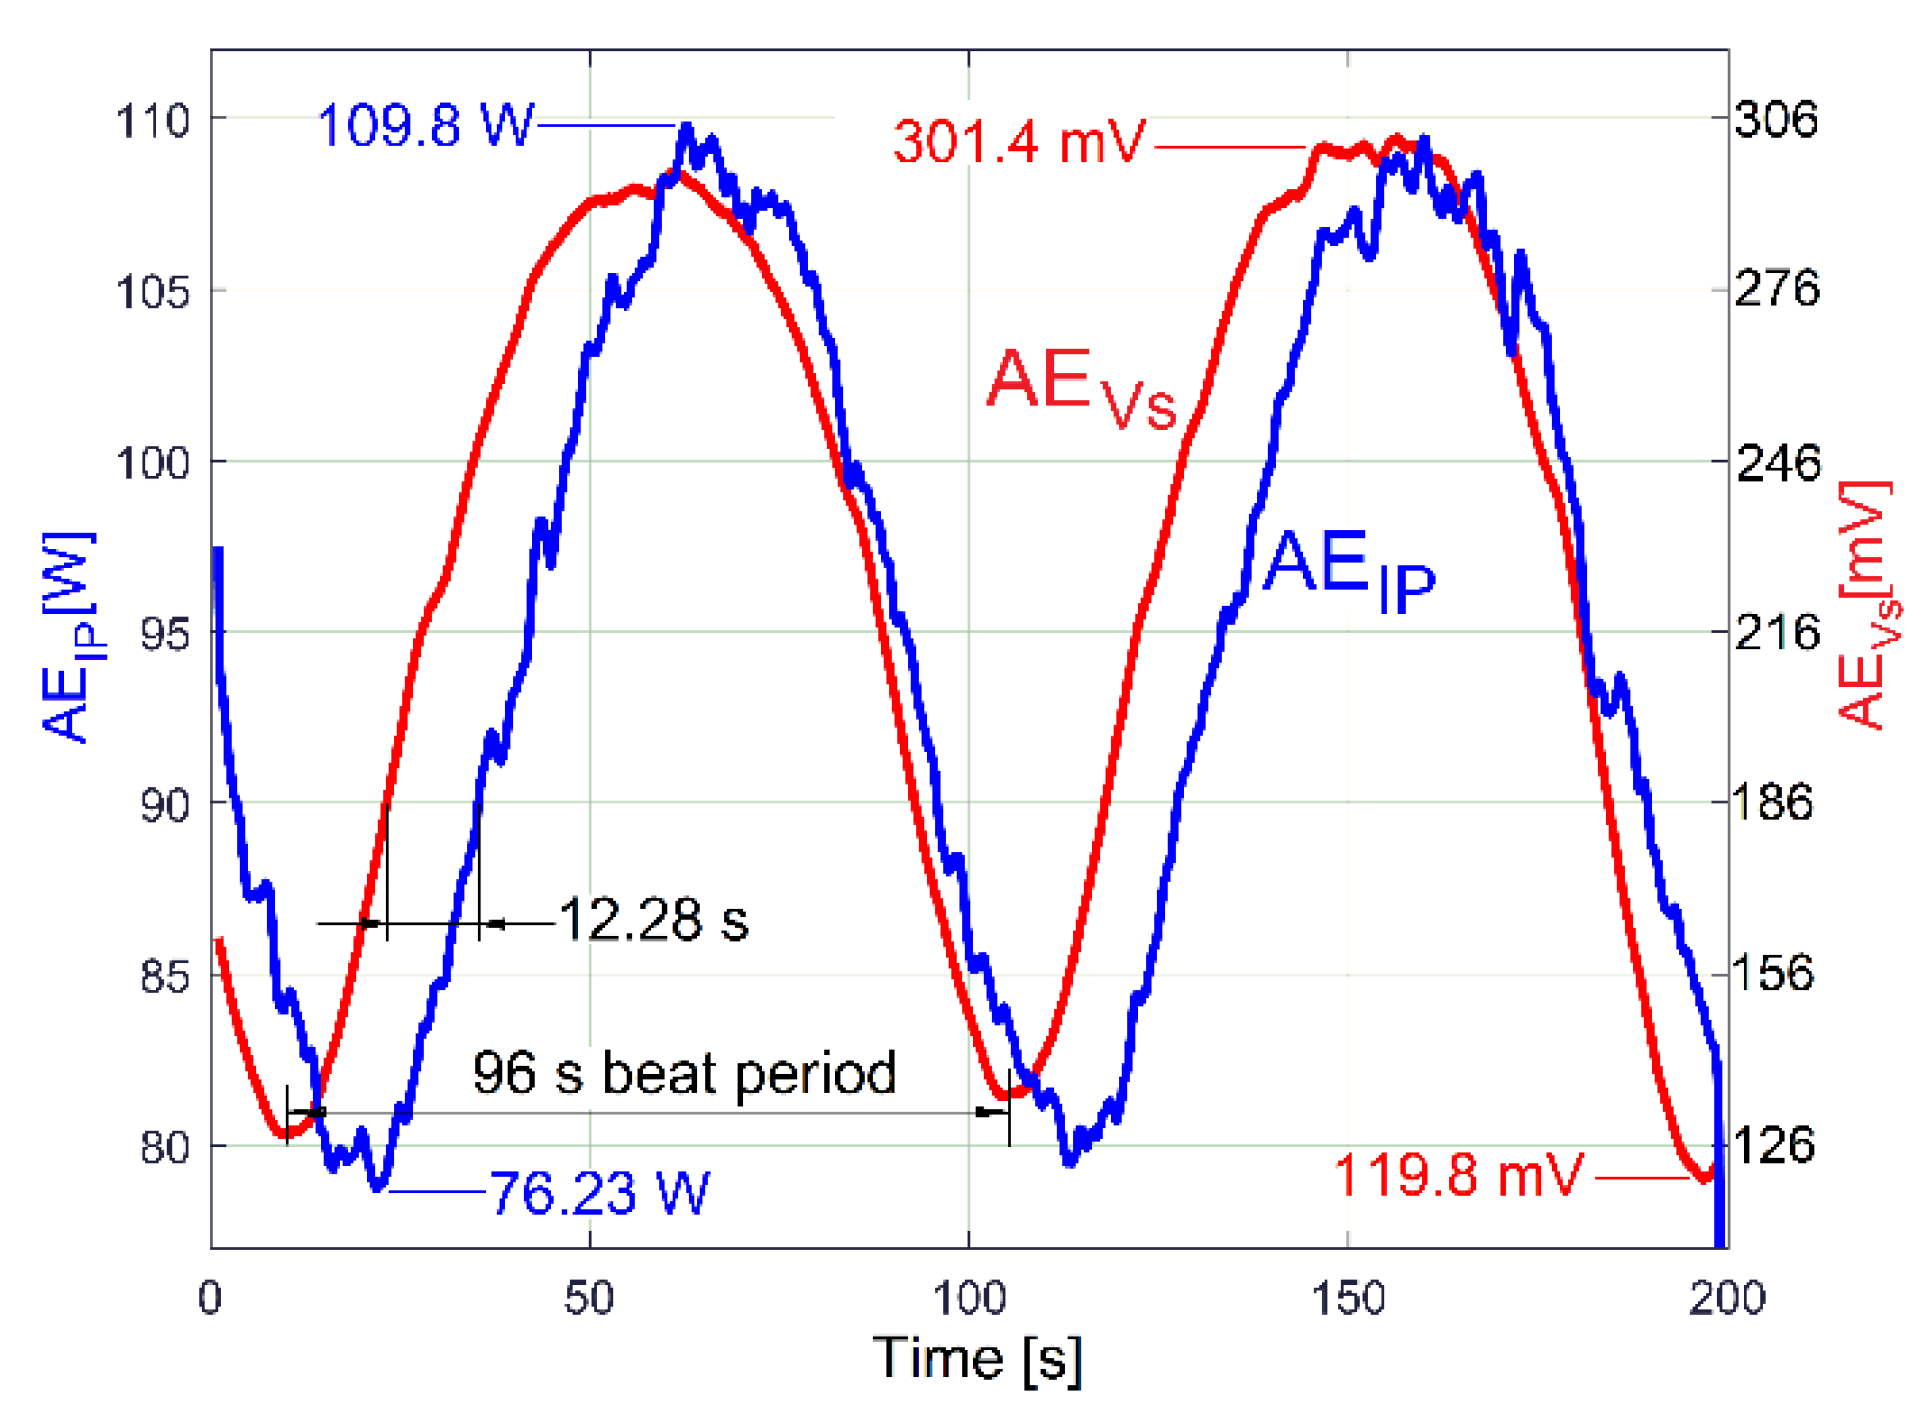
A better comparison between the averaged AEIP and AERIC evolutions is provided in Figure 24. Here, the averaged AERIC evolution was graphically fitted (related only by magnitude) against the averaged AEIP evolution in such a way as to highlighted that there is no time delay (or phase shift, either) between these evolutions. As expected, there is no shift of phase between the beating phenomena described with the AEIP or AERIC averaged evolutions (both describing the variable part of the mechanical loading).
It is obvious also that the averaged AEIP (curve 2 in Figure 22) and AEVs (curve 2 in Figure 20) have similar evolutions. The beating phenomenon in vibration is supplied by a beating phenomenon in IP (the AC motor supplies with mechanical power the forced vibrations). A better comparison between the averaged AEIP and AEVs evolutions is provided in Figure 25.
Here, similarly to the averaged AERIC from Figure 24, the AEVs evolution was graphically fitted (related only by magnitude) against the averaged AEIP evolution in such a way that only the time delay between them (and the phase shift, as well) is highlighted.
This phase shift proves that there are two variable IP components used by shaft III (having the same frequency fEIII): the fundamental of the variable part of the drive power (pvdpIII, used to rotate the shaft if the imbalance is ignored) and the excitation power (pepIII, used only to excite the gearbox due to shaft III imbalance during the rotary motion). Similarly, there are two IP components generated by the output spindle (having the same frequency fES): the fundamental of the variable part of drive power (pvdpS, used to rotate the output spindle if the imbalance is ignored) and the excitation power (pepS, used only to excite the gearbox due to spindle imbalance during the rotary motion). Generally, there is a shift of phase (unknown for the time being) between the pvdpIII and pepIII evolutions; also, there is a shift of phase (unknown) between the pvdpS and pepS evolutions. A first IP beating phenomenon (as IPvdp) takes place through the addition of the powers pvdpIII + pvdpS = pvdp (with pvdp having a variable amplitude and the frequency fE). A second IP beating phenomenon (as IPep) takes place through the addition of the powers pepIII + pepS = pep (with pep having a variable amplitude and the frequency fE). Generally, is expected that, for a certain IAS spindle, there is a constant shift of phase between pvdp and pep.
The IPep beating phenomenon supplies the vibration beating phenomenon, with no phase shift in between. The IPvdp and IPep beating phenomena defines (by interference) a third IP beating phenomenon (as IPE) by the addition of the powers pvdp + pep = pE, with the amplitude evolution already described in Figure 22 (curve 1). It has the averaged AEIP as its average amplitude evolution (curve 2 in Figure 22) and the frequency fE. Since the amplitude of pvdp is not zero, then pEpep. As a consequence, there is a time delay (shift of phase) between the averaged AEIP and AEVs, as Figure 25 clearly indicates. The time delay (shift of phase) between the averaged AEIP and AEVs evolutions can be changed if the amplitude of pvdp or pep (or both) is changed, because IPE depends on IPvdp and IPep (their sizes and shapes and the phase shift between them).
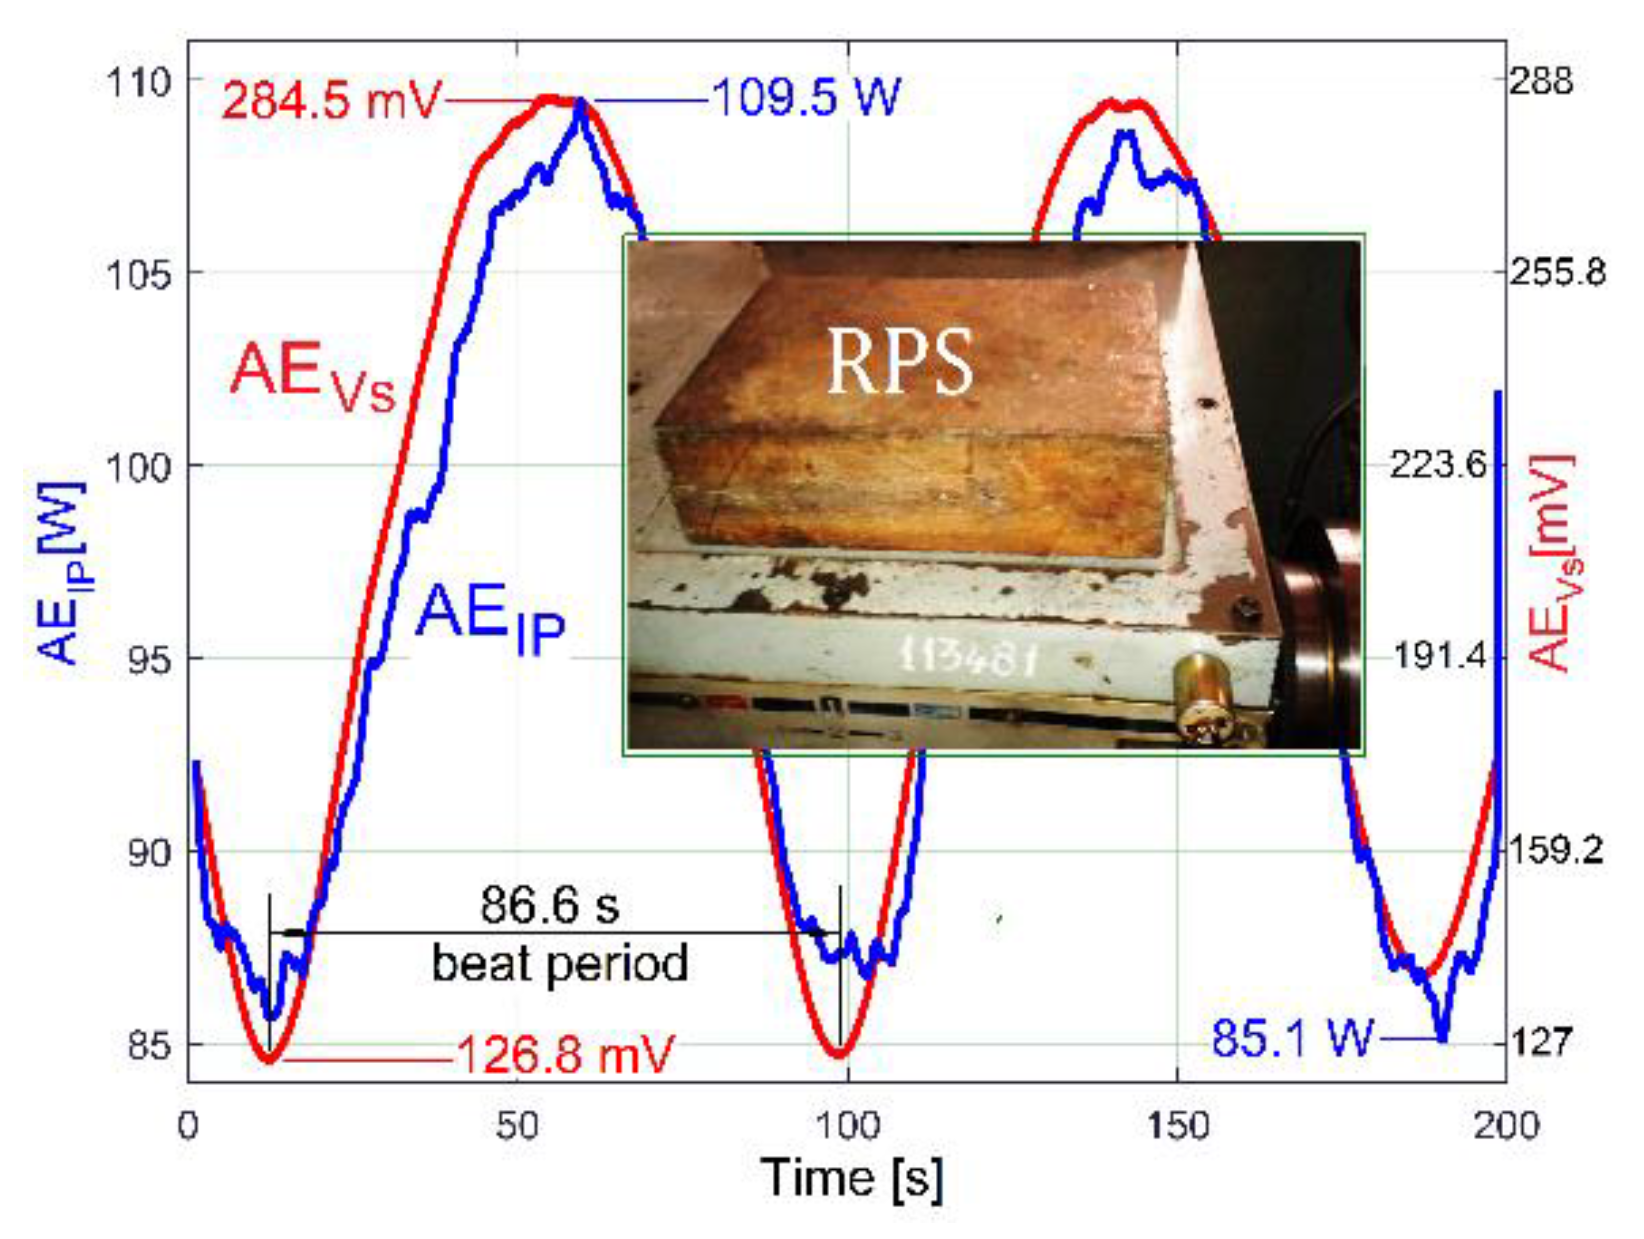
As a first example, the influence of pep on pE is indirectly proved by a new experiment in almost identical conditions (fE = 17.39 Hz and Nss = 29,471), with a 36.8 Kg additional mass (a rectangular parallelepiped made of steel, RPS) placed on the lathe gearbox (Figure 26).
The circumstances of the excited vibrations (of the lathe on its foundation) are changed: because of the additional mass, the resonant amplification diminishes, and the resonance frequency moves away from the excitation frequency. As Figure 26 proves, there are two major consequences: firstly, the time delay (shift of phase) between the averaged AEIP and AEVs evolutions decreases significantly; secondly, the peak-to-peak amplitude of pE decreases from 33.57 W in Figure 25 to 24.4 W here. During this new experiment, the ambient temperature is higher (approximately with 5 degrees Celsius), the sliding of flat belt 2 increases, the difference between the rotational frequencies of shaft III and the output spindle increases, and, consequently, the beat period decreases from 96 s (in Figure 25) to 86.6 s here in Figure 26.
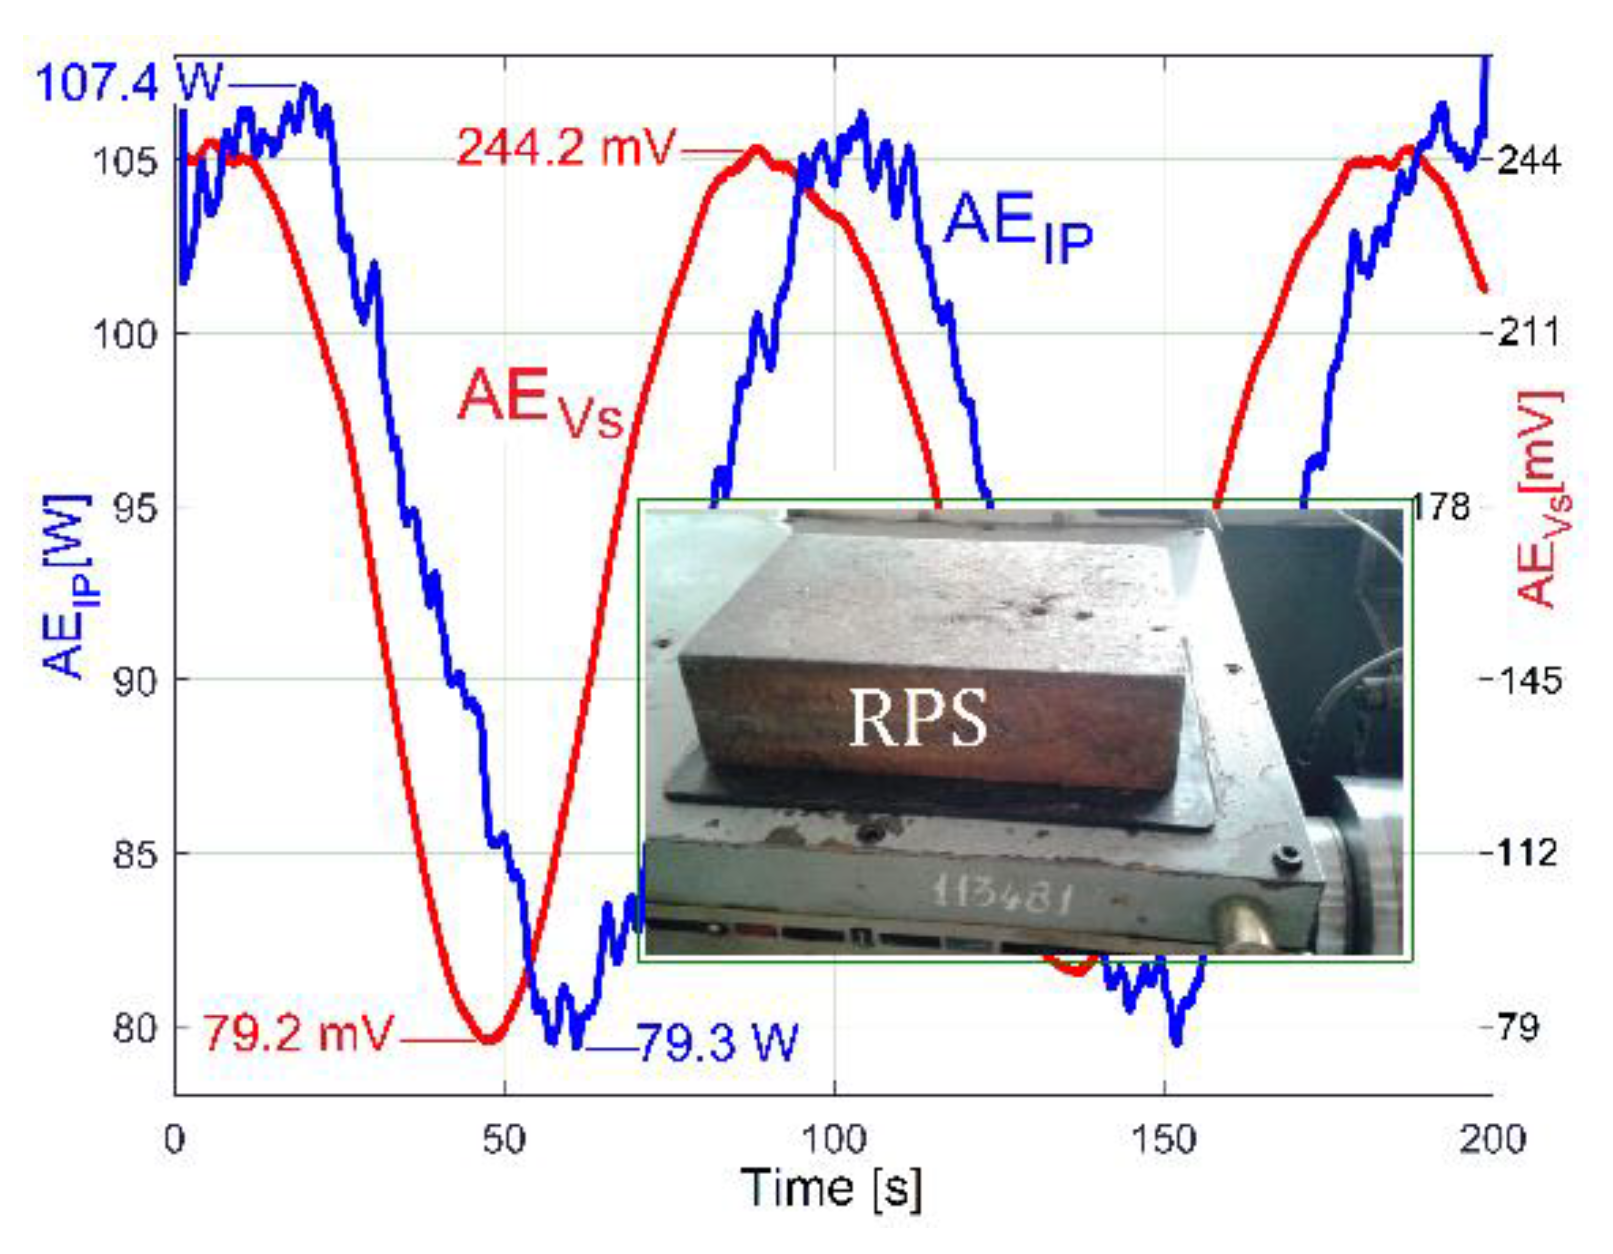
The experiment from Figure 26 was repeated in new conditions. This time, a sheet of rubber 6 mm in thickness was placed between the additional mass and the gearbox. As Figure 27 proves, there is a big change in the time delay between the averaged AEIP and AEVs evolutions and a noticeable change in the AEVs average values (from 205.65 mV in Figure 26 to 161.7 mV in Figure 27). The additional mass RPS and the sheet of rubber work together as a passive dynamic vibration damper (PDVD). The amplitude of the average vibration decreases because a part of the instantaneous power pep absorbed by the AC induction motor and converted in mechanical power (previously used to supply the gearbox vibration) is now absorbed by the PDVD and converted irreversibly into heat inside the rubber sheet (which also works as a damper).
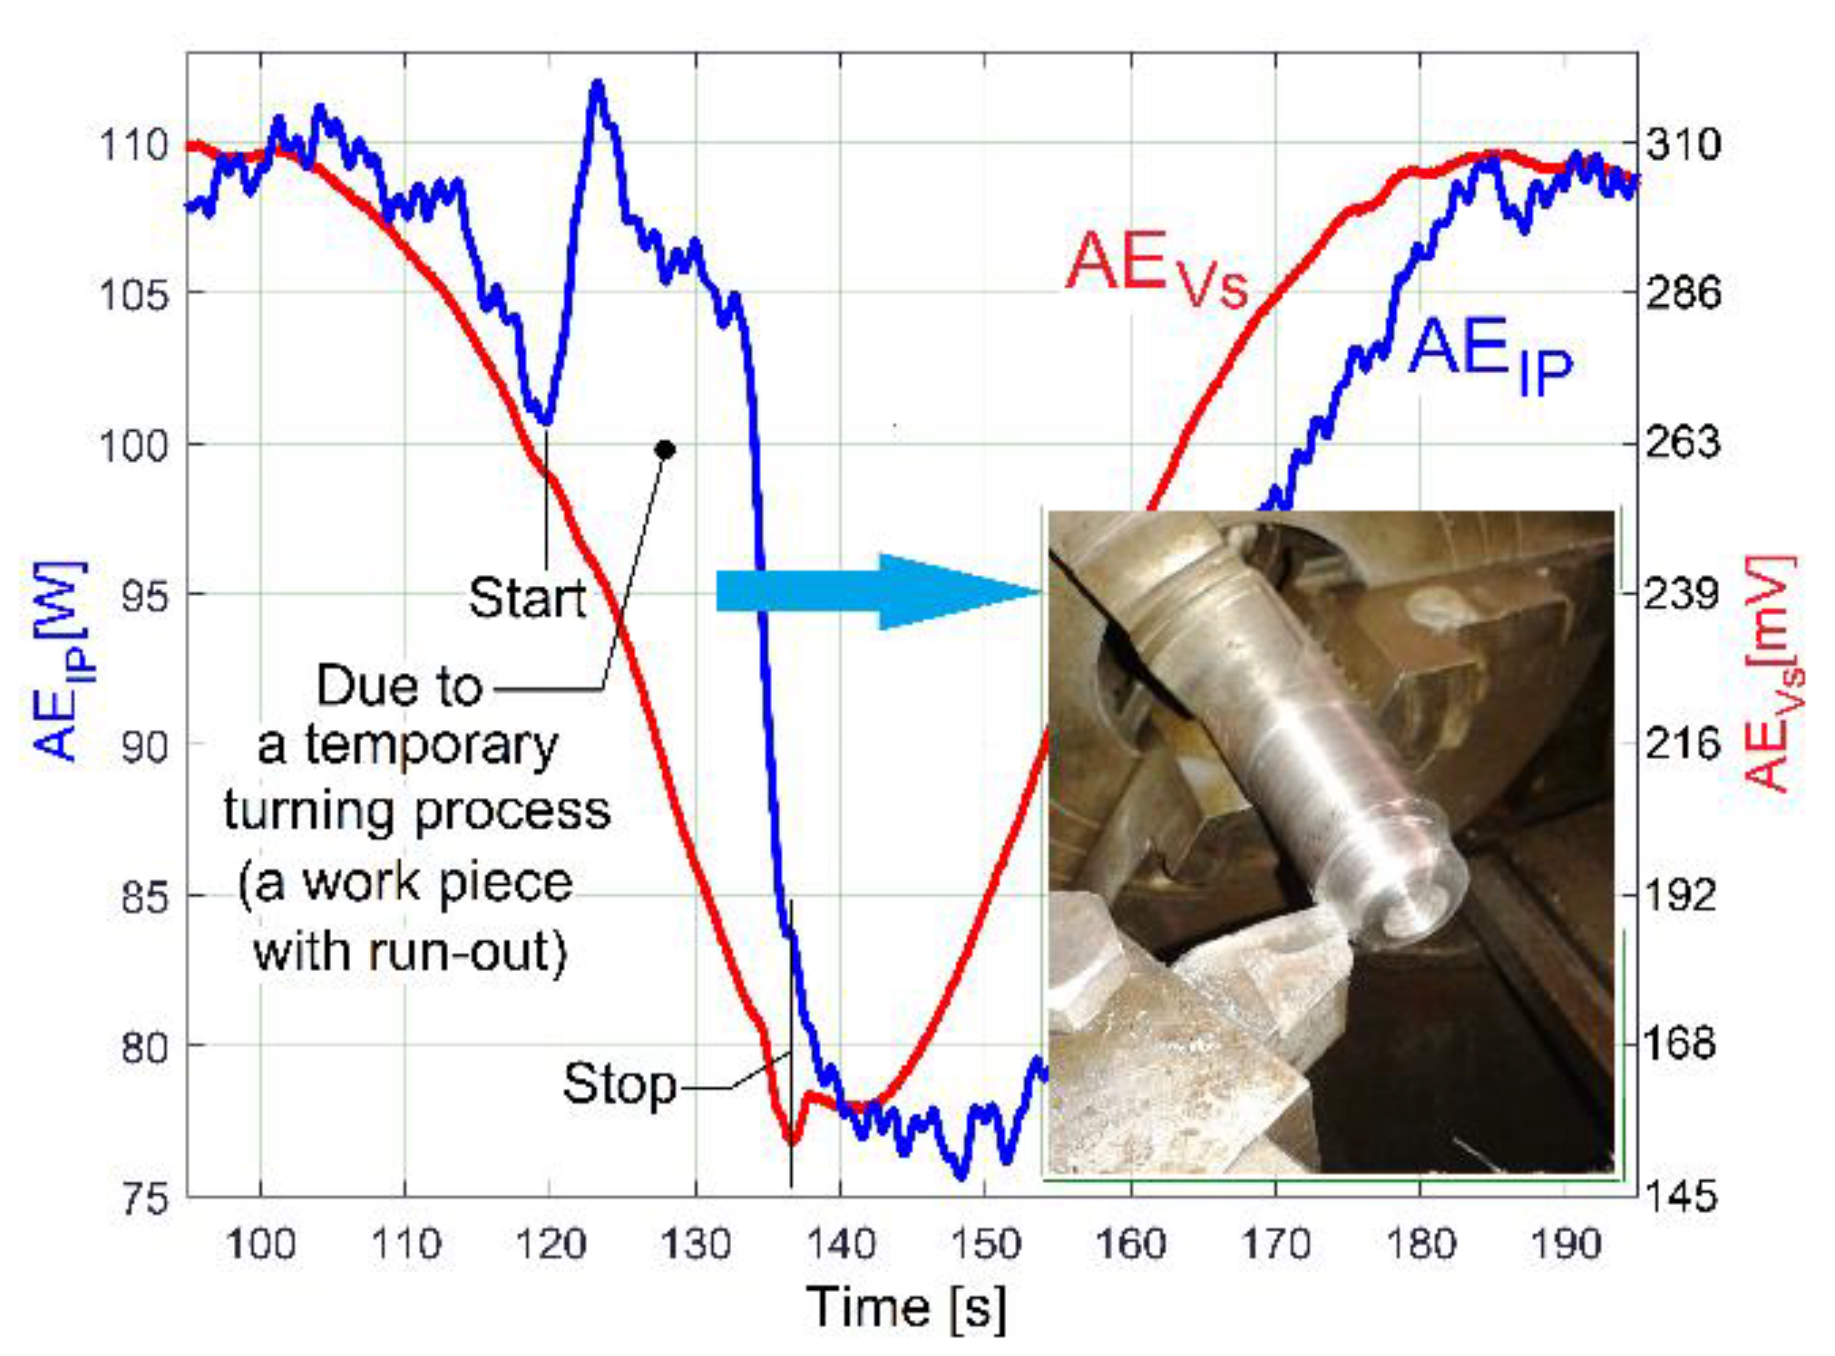
Under the same experimental conditions as in Figure 25, a short sequence (approximately 17 s in duration) of a longitudinal interrupted turning process with manual feed, on a steel work piece (30 mm diameter) with radial run out (3 mm, bigger than the depth of cut—1.5 mm), acts temporary as a periodical mechanical power consumption phenomenon at the output spindle (as an additional part of the variable drive power pvdpS). The influence of this sequence on pE and on the evolution of the averaged AEIP is clearly described in Figure 28, with a local increasing of the averaged AEIP and a shift of phase in comparison with the AEVs. The influence of this cutting process on the gearbox vibrations (more exactly on the AEVs) is null, as the action–reaction periodical cutting forces (against the work piece, respectively, against the cutting tool) cancel each other out. However, the AEVs decreases temporary when the cutting process ceases (because of the manual removal of the cutting tool from the process, some temporary damping is introduced).
The results and comments about Figure 25 and especially Figure 28 prove that some important phenomena involved in condition monitoring (e.g., related to a periodical mechanical loading) are not perceptible by a vibration sensor (however it may be useful for other phenomena). Also, it is highlighted here that there are two ways to describe a forced periodical vibration: directly, by using an appropriate vibration sensor, or indirectly, by measuring the mechanical power at vibration excitation source (here through the medium of the IP absorbed by the AC induction motor).
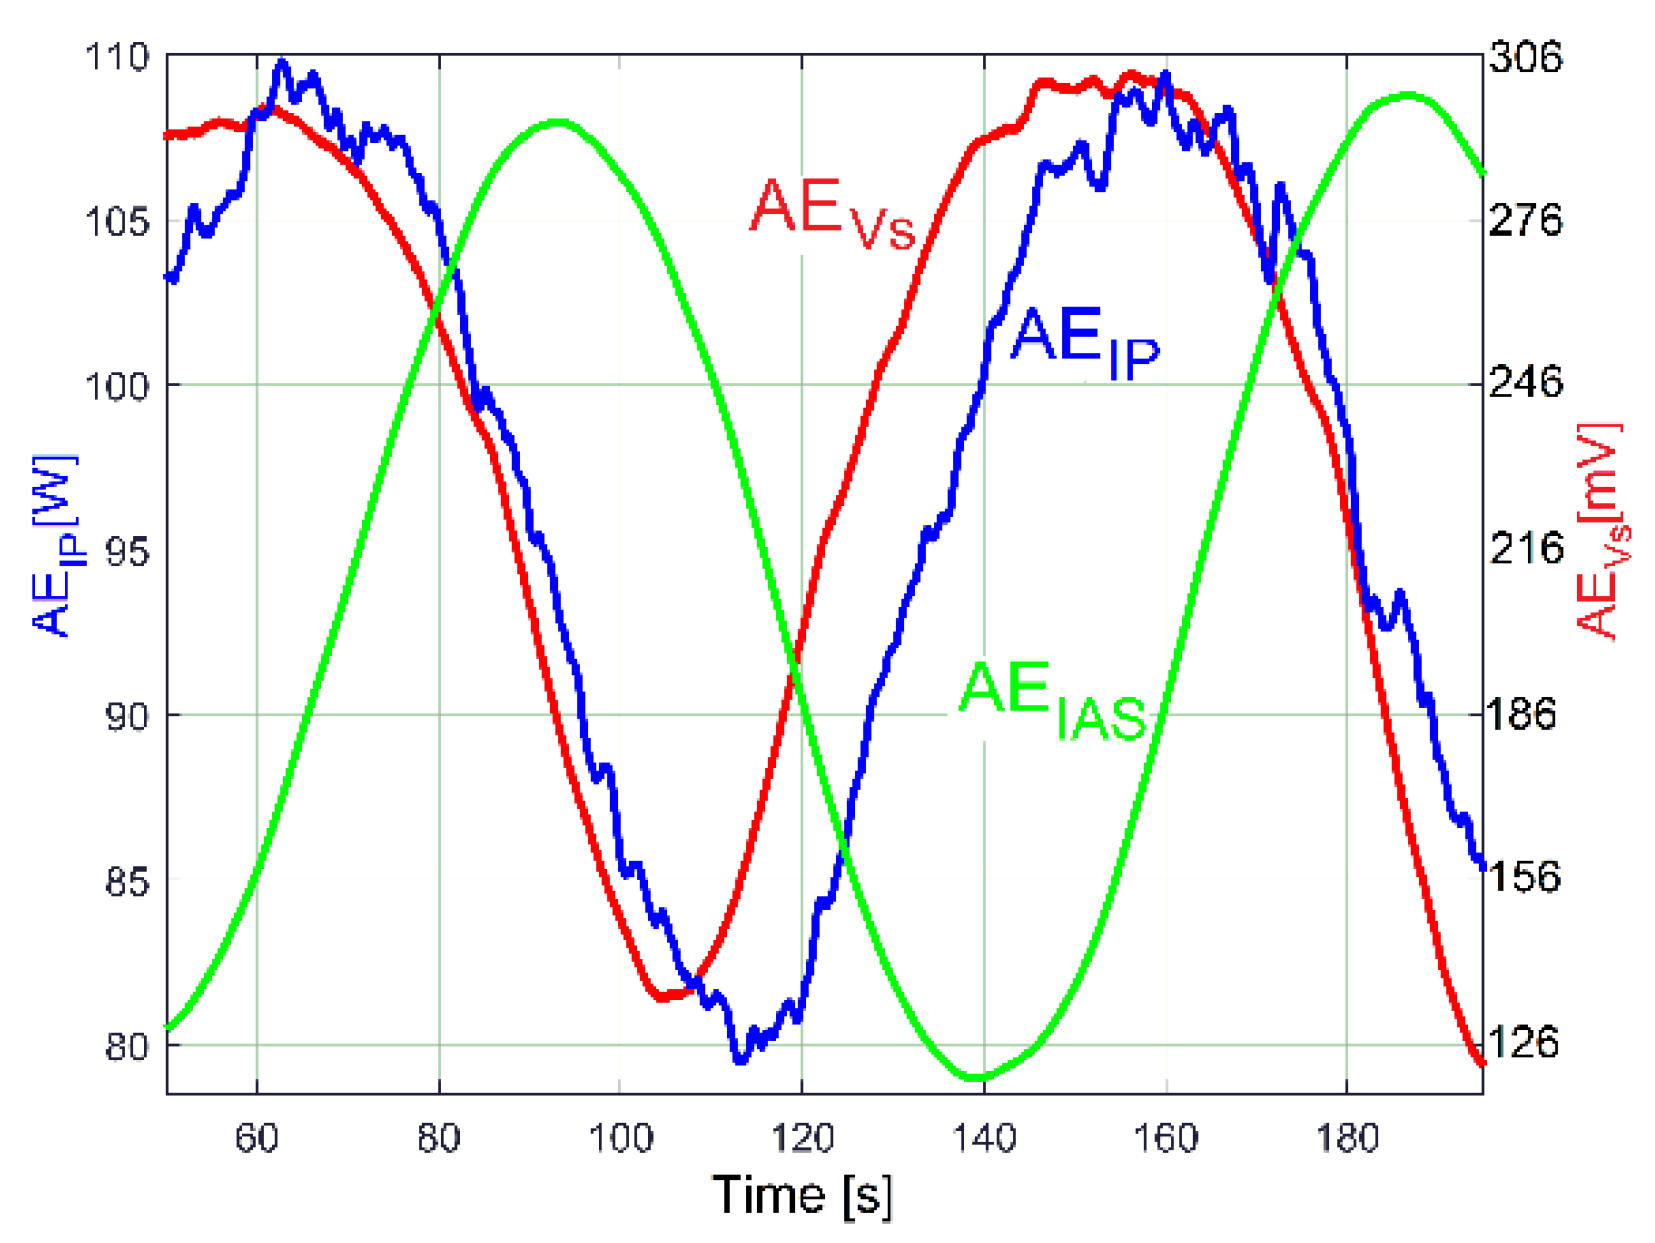
It is interesting that the beating phenomenon generated by shaft III and the spindle (previously illustrated in averaged AEIP and AEVs evolutions) is also mirrored in the evolution of the amplitude of the peak E on the FFT spectrum of the IAS (as AEIAS) evolution (Ns = 347,406 samples, Fs = 1737 s−1). This evolution was obtained by the same procedure of analysis on the FFT with short movable sequences of IAS signal (as SMSIAS with Nss = 2150). Figure 29 presents the AEIAS evolution (AEIP and AEVs, too) during the experiment already described in Figure 25.
Here, the AEIAS evolution has a peak-to-peak variation of 0.0393 rad/s and an average value of 0.601 rad/s. It would be assumed that there is not a significant phase shift between AEIAS and averaged AEIP, but this hypothesis is not confirmed by Figure 29. There is a shift of phase generated by the IAS sensor (a stepper motor working as a two-phase 50 pole AC generator [46]). A false periodical IAS component is generated by IASS due to the constructive inaccuracy (as measurement error, with the fundamental component having the frequency fES). An IAS beating phenomenon occurs, caused by the addition of three sinusoidal components: a sinusoidal component generated by shaft III with the frequency fEIII (a consequence of variable power pvdpIII + pepIII), a sinusoidal component generated by the output spindle with the frequency fES (a consequence of variable power pvdpS + pepS), and the fundamental of the IAS measurement error (also sinusoidal), with the frequency fES. If the angular position of the IASS rotor related to angular position of spindle is changed, then the phase shift between AEIAS and the averaged AEIP evolution must also change. This is proved by the evolutions from Figure 30 achieved in a new experiment, in similar conditions to those in Figure 29. Here, there is a 0.0326 rad/s peak-to-peak variation and a 1.148 rad/s average value of AEIAS, significantly bigger than before.
If the IASS rotor is attached to another shaft (e.g., shaft II, shaft I or the AC motor’s rotor), the measurement error induced by IASS (related to the negative influence on peak E’s amplitude on the FFT spectrum of IAS, in Figure 13) disappears, and the AEIAS and averaged AEIP evolutions should then be in phase.
For condition monitoring purposes concerning other parts of the gearbox (e.g., gears, bearings, etc.), the best approach is to use the entire FFT spectrum of IP (or RIC and eventually RIV as well), mainly in order to check the values and the evolutions of the amplitudes of high order harmonics of the fundamentals generated by the shafts where the gears and the bearings are placed.
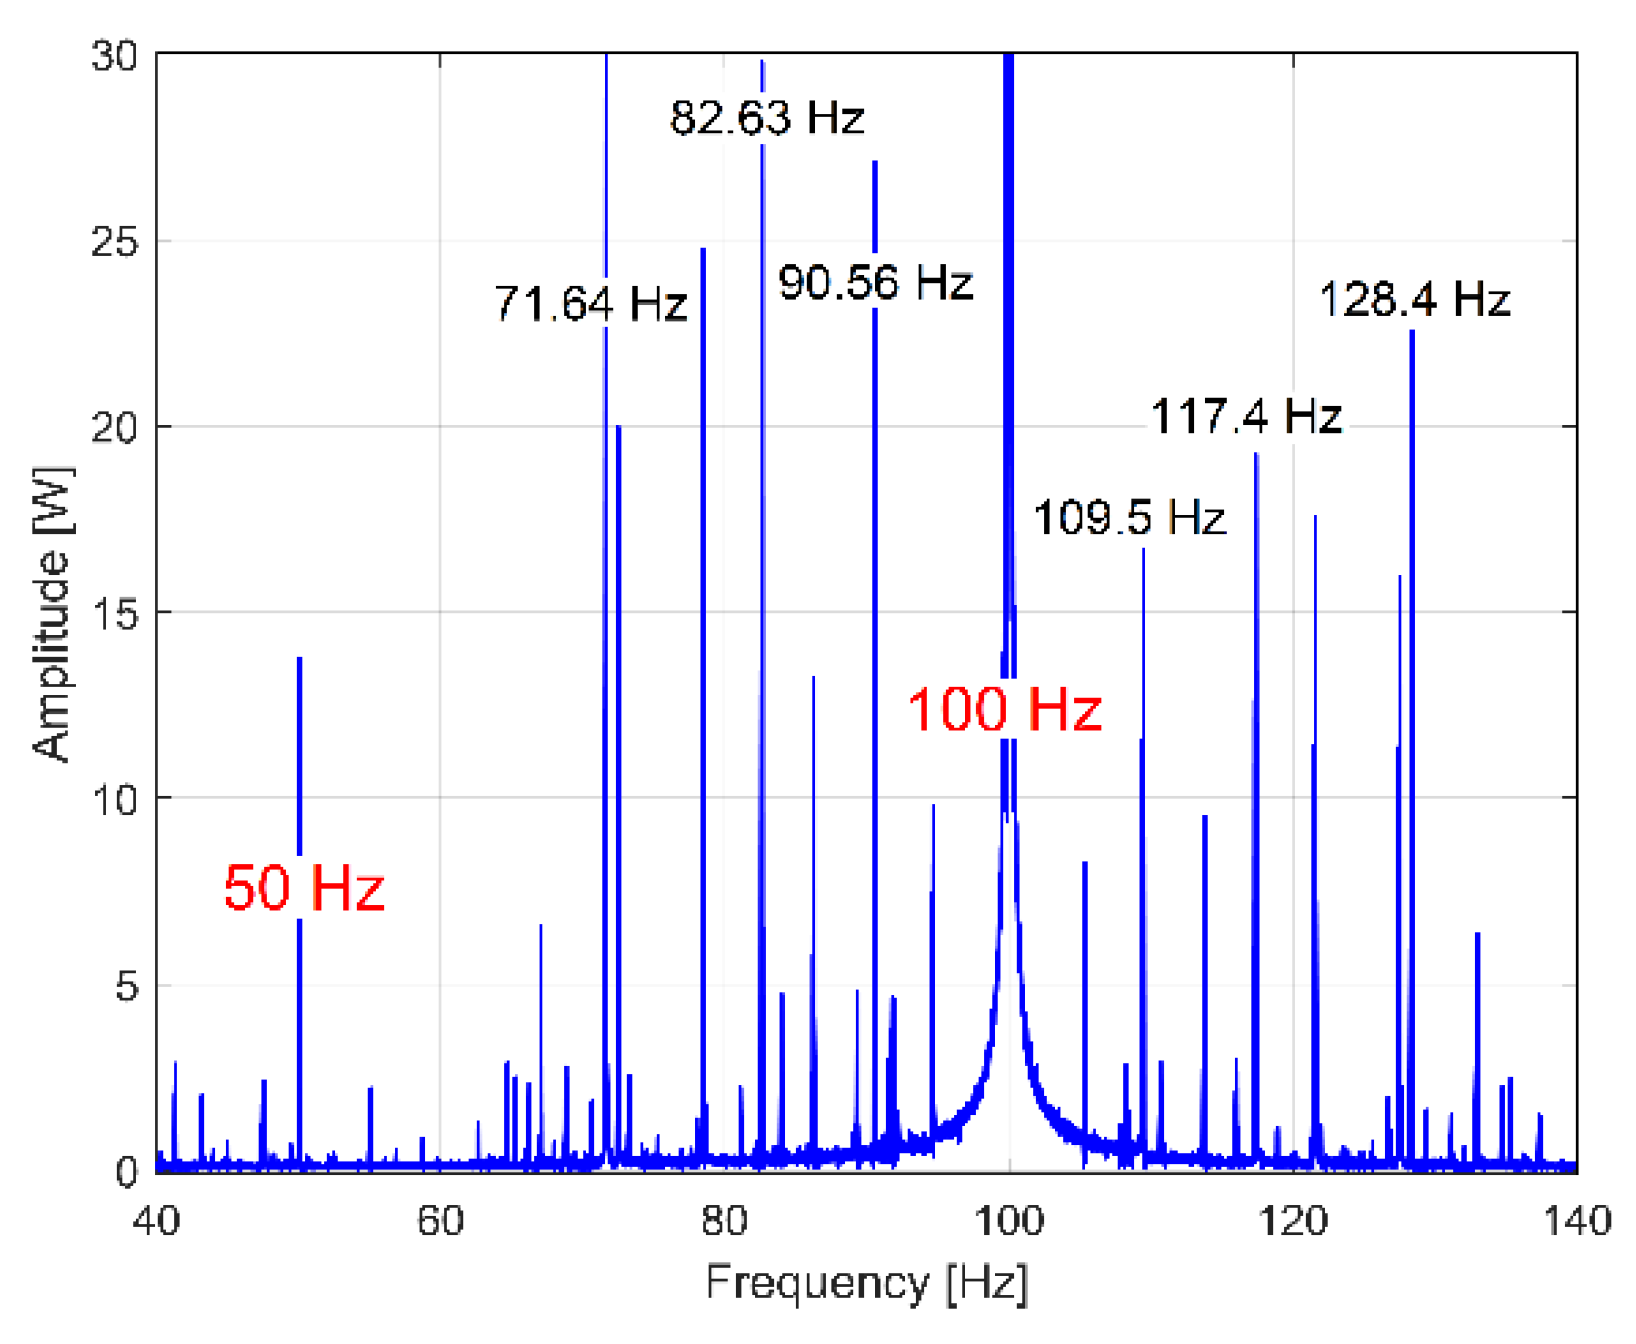
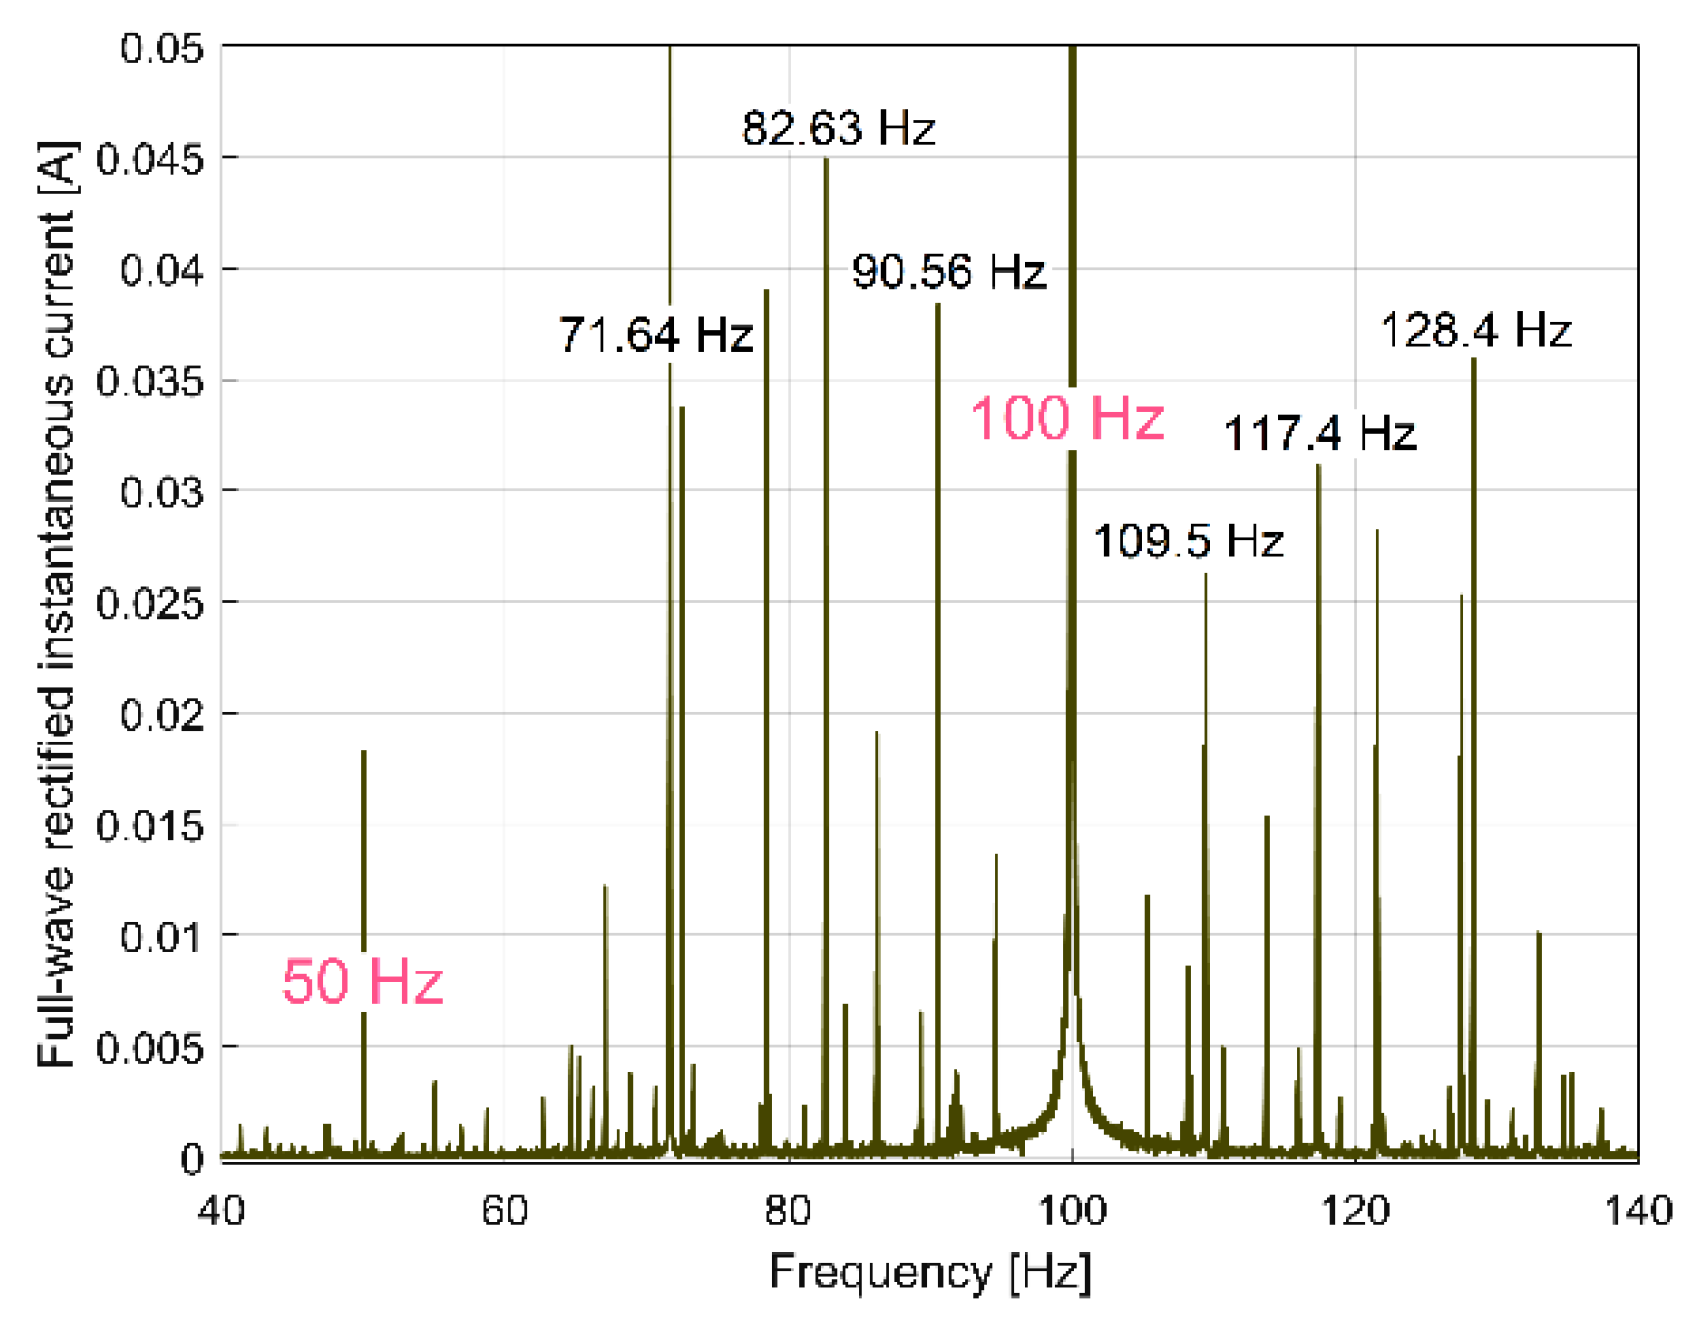
All of the harmonics of the fundamentals on 50 Hz and 100 Hz (electrically generated in the IP or RIC spectra) should be ignored. The availability of the FFT spectrum for this purpose is proved in Figure 31, which depicts a short sequence of the IP spectrum, and in Figure 32, which depicts a short sequence of the RIC spectrum. The same range of frequencies (40 ÷ 140 Hz, as example) is used for both spectra.
It is obvious that there are strong similarities between these IP and RIC spectra (at least related to the frequency of the spectral peaks). It is important to mention that some peaks in the IP and RIC spectra are related to the excited torsional vibration modes of the shafts and spindle, this being a challenge for a future study.
In contrast with IAP1, the IP (or RIC, RIV) spectrum does not (invariably) have an upper limit at 50 Hz. The value of the Nyquist frequency for the IP (or RIC, RIV) spectrum (12,500 Hz in Figure 31 and Figure 32) depends only on the value of the sampling frequency (25,000 s−1 here).
It is expected that many other gearbox condition monitoring techniques presently used in vibrations or instantaneous current analysis in the frequency domain are applicable to the IP (or RIC) evolutions.
For non-stationary processes (e.g., starting, stopping and the changing of spindle speed by changing the gearing diagram), or, eventually, for a catastrophic failure, the FFT analysis is useless (except probably the analysis with the FFT of short movable sequences). Nevertheless, these processes can be very well characterized using the evolution of the low pass filtered instantaneous average electrical power IAP1, as was proved in [1].

4.2. An Approach on IAP1 Signal Components Identification by Curve Fitting

The FFT spectrum of IP describes the frequency of each component well and the amplitude fairly well. A better approach to the study of the behaviour of the gearbox parts mirrored in the IP evolution is possible if a complete description of each variable IP component (as a sinusoidal evolution, with amplitude, frequency and phase at origin of time) is achieved by curve fitting (with the sum of sinusoids model) as a signal components identification procedure. For curve fitting, two options were explored, both having similar results: a method proposed by us (slower), and a method based on Curve Fitting Tool (faster), both conducted in Matlab.
However, at first glance, it is relatively difficult to identify the IP components, because the IP has a high Nyquist frequency and too many sinusoidal components (including the electrically generated dominant on 100 Hz and its harmonics). If we are interested only in the description of low frequency IP sinusoidal components (e.g., between 0 and 40 Hz, as previously), then it is better to use the curve fitting of the IAP1 evolution (the instantaneous active power absorbed by the AC motor, defined as being three times IAPA1), which has a Nyquist frequency of 50 Hz and a sampling frequency of Fs = 100 s−1. Of course, in the range of 0 ÷ 50 Hz, the IP and IAP1 have the same sinusoidal components. For an IAP1 sequence with a duration of 5 s (Ns = 500 samples), the curve fitting procedures allow the determination of at least 38 of the most significant sinusoidal components (some of them described in Table 2). At each step in the curve fitting method, a single sinusoidal component is identified (usually that with the highest amplitude) and mathematically removed from the IAP1 evolution.
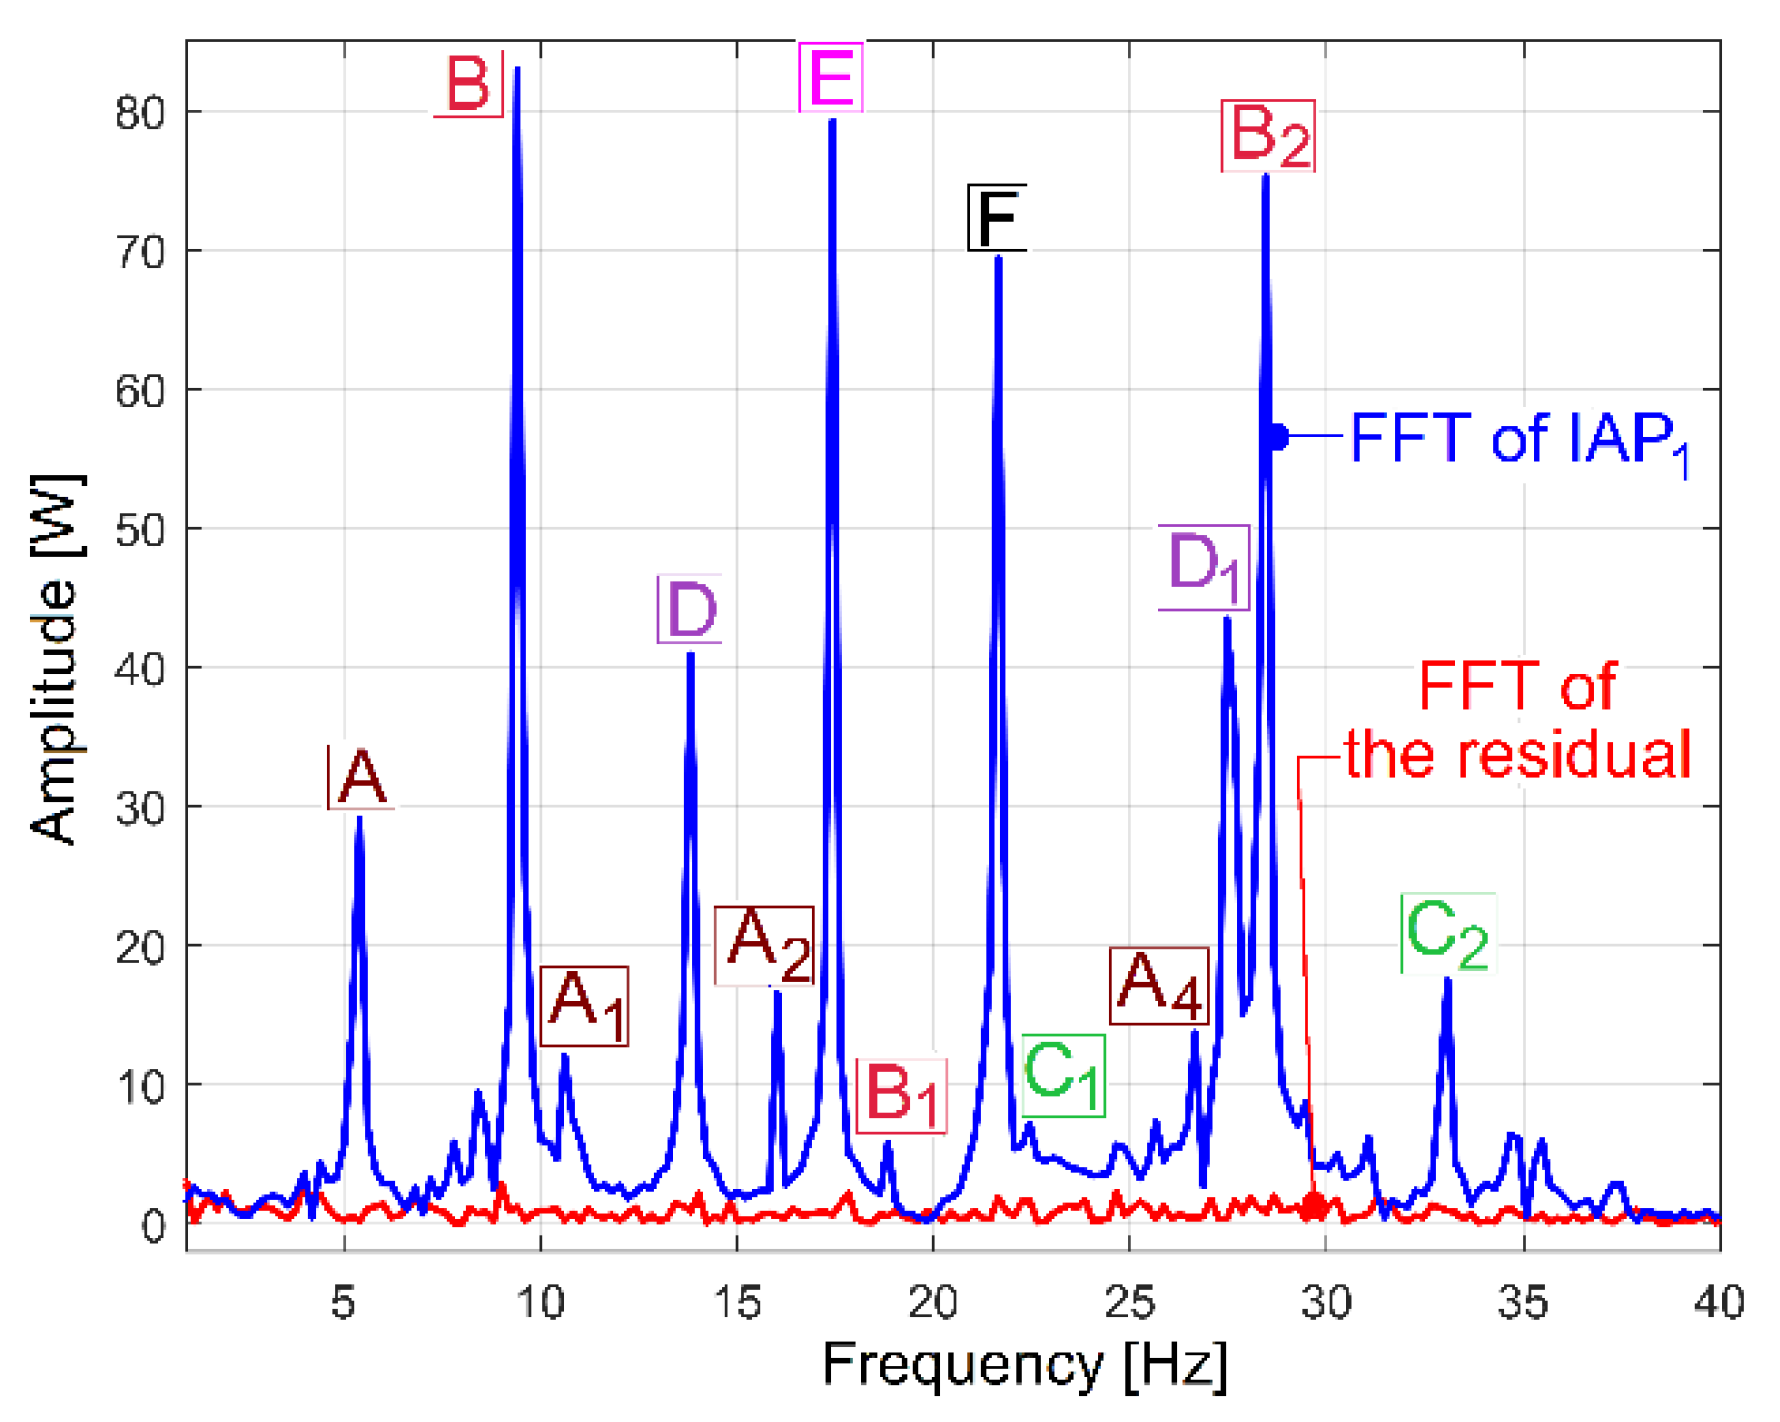
The first confirmation of the correctness of this identification is provided in Figure 33. Here, the blue evolution is the FFT spectrum of IAP1, while the red evolution is the FFT of the residual evolution after these identified 38 sinusoidal components were removed (mathematically subtracted) from IAP1. It is obvious that the FFT of the residual does not contain significant peaks anymore.
Because of a small resolution of the FFT for the IAP1 spectrum (only 0.2 Hz in Figure 33, by comparison with the resolution of 0.01 Hz for IP in Figure 9), some variable components in the IAP1 spectrum are hidden (e.g., C1, A3, A5, A6, E1). However, they are well revealed by curve fitting.
Table 2 presents the values of the amplitude and frequency of the 20 most significant sinusoidal components from IP (already revealed before in Table 1) and the values of amplitude, frequency and phase at origin of time for the same sinusoidal components, but as determined by curve fitting of IAP1.
The second confirmation of the correctness of the identification and description of low frequency IAP1 sinusoidal components by curve fitting is provided in Figure 34. Here, the experimental evolution in the time domain for the variable part of IAP1 is depicted (as a blue curve, a short sequence with duration of 1.5 s, with 150 samples, at the beginning of the sequence analysed by curve fitting), along with the evolution of the variable part of the power theoretically built by the mathematical addition of these 38 sine-identified components (the evolution depicted with a red curve). It is obvious that these two evolutions fit fairly well each other. The difference between these evolutions is described by quite a small residual (the experimental evolution minus the theoretical one) in Figure 34. The results from Figure 33 and Figure 34 (and Table 2 as well) are another argument that IP (IAP1) is a predominantly deterministic signal, well distinguished from the noise by a relatively small residual.
By mathematical addition of the sine components A (as fundamental) and A1 ÷ A6 (as harmonics) identified by curve fitting, it is possible to find the evolution of the variable part of IAP1 (or IP as well) generated by flat belt 1. Because, in Table 2, the frequencies fAi of the harmonics Ai (depicted in the 4th row, identified by curve fitting) are not perfectly related to the frequency fA of the fundamental (with the relationship fAi = (I + 1)·fA), mainly because of errors in curve fitting, it is more appropriate to approximate the value fA with an average value fAa calculated as described in Equation (4).
f A a = 1 7   ( f A + i = 1 6 f A i ( i + 1 ) )              
In this way, the frequencies of the harmonics are now approximated as fAai = (i + 1)fAa (e.g., fA = 5.336 Hz becomes fAa = 5.3336 Hz, fA1 = 10.664 Hz becomes fAa1 = 10.6672 Hz, … fA6 = 37.330 Hz becomes fAa6 = 37.3352 Hz).
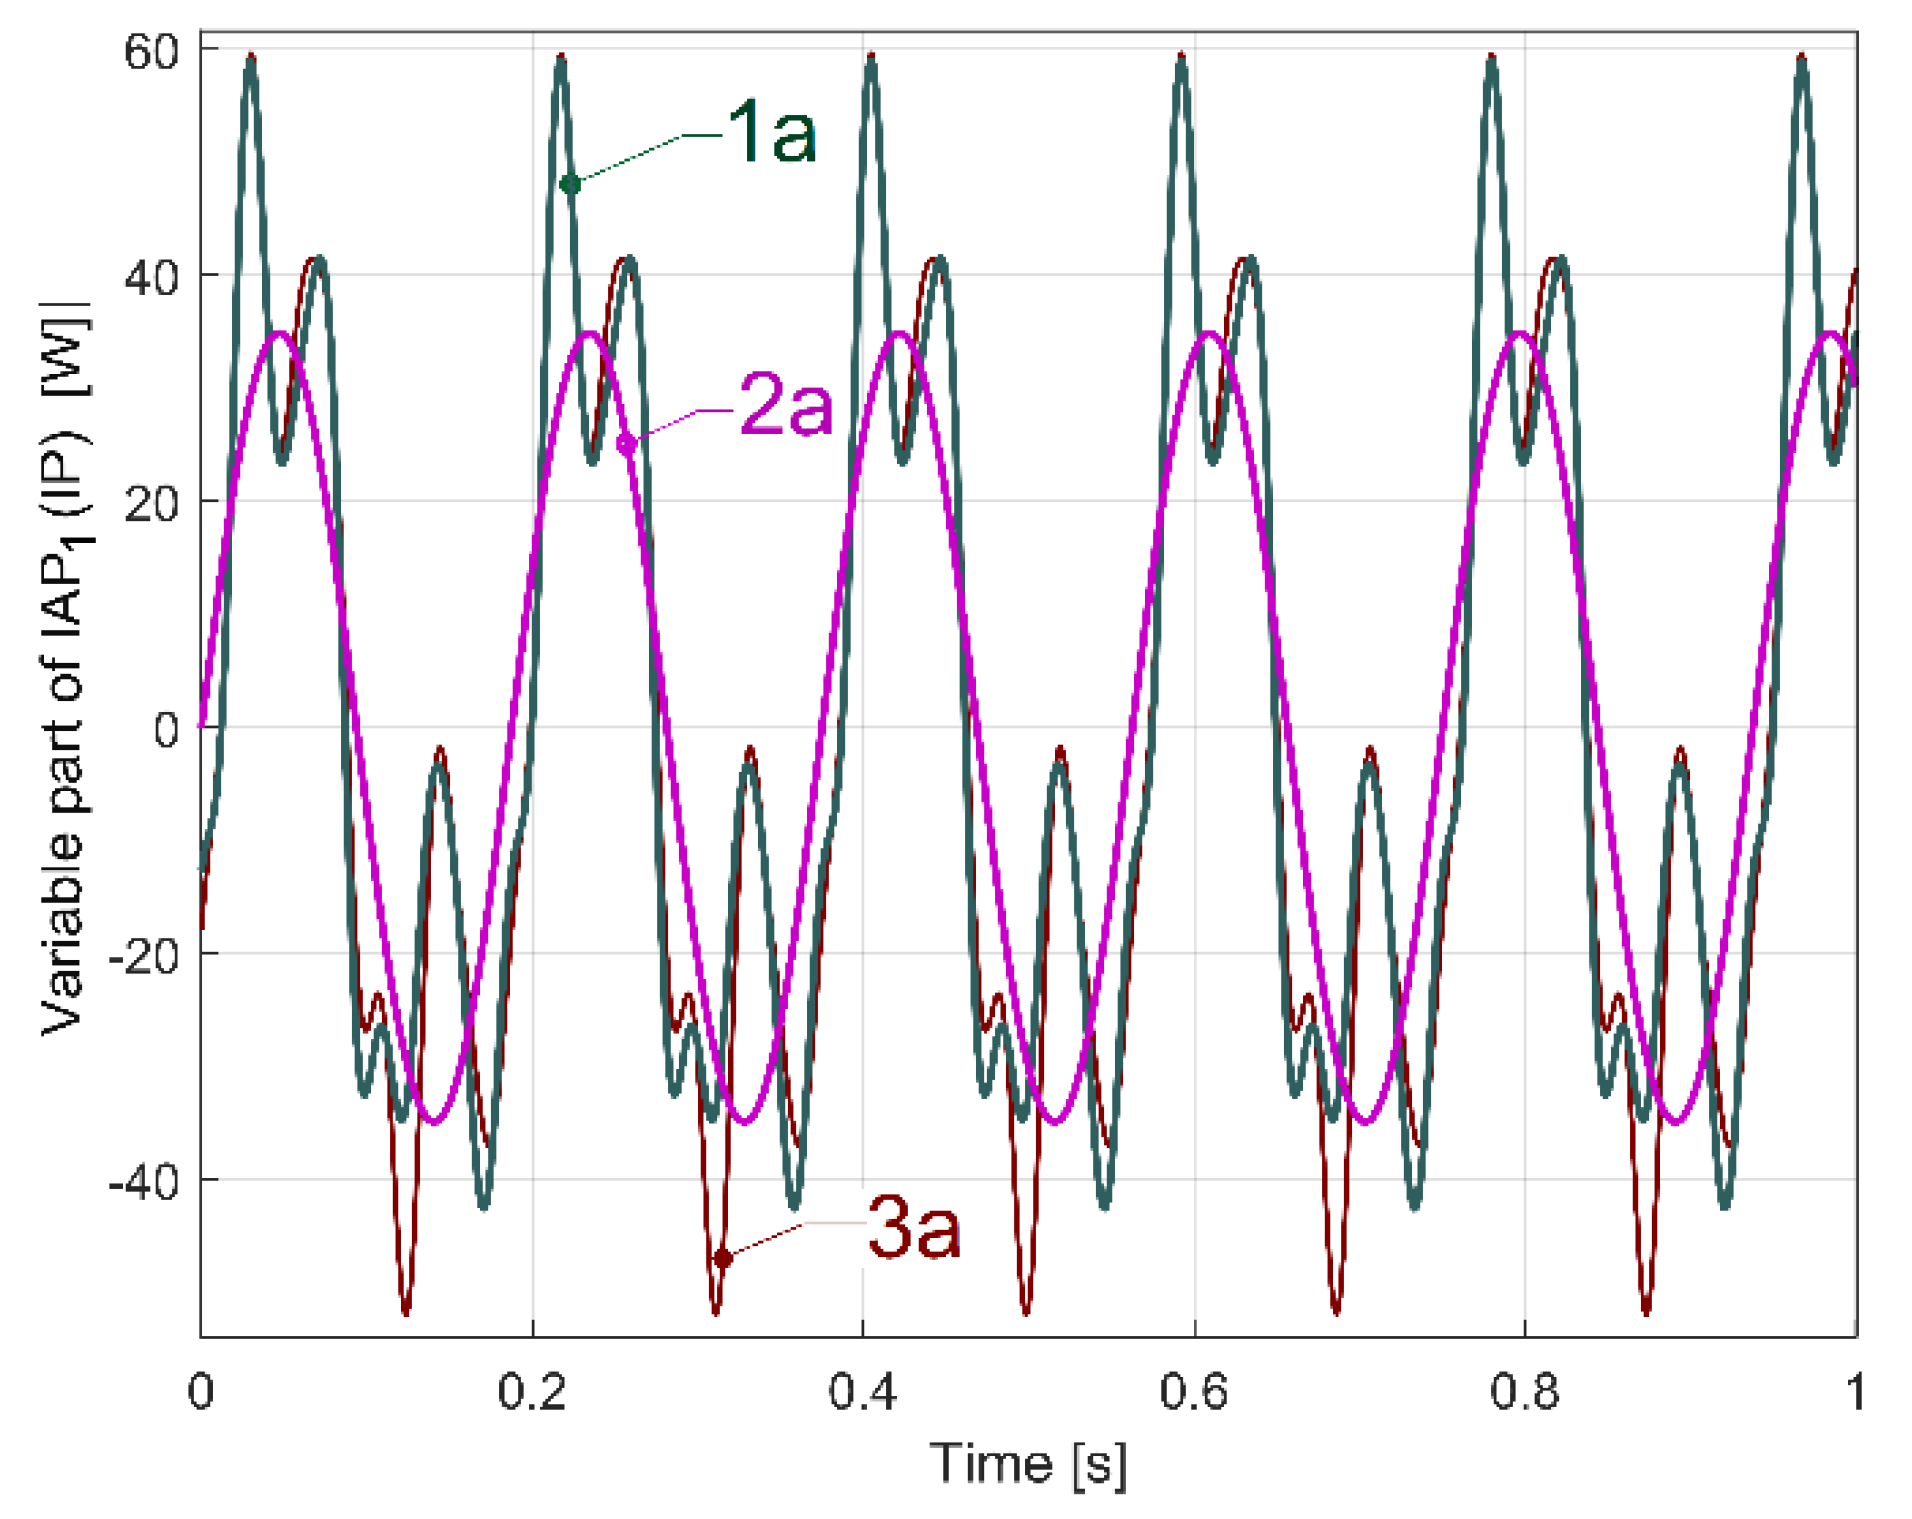
In such a way, a more accurate description of the evolution of the variable part of IAP1 (or IP as well) generated by flat belt 1 is possible, as curve 1a in Figure 35 indicates.
Here, curve 1a results from a mathematical addition of the sinusoidal components A, A1 ÷ A6 (having the frequencies fAa, fAai and the amplitudes indicated in Table 2) with a sampling frequency of 25,000 s−1, in a simulation during 1 s. Curve 2a in Figure 35 depicts the evolution of the fundamental A. The new origin of time for the curves 1a and 2a is considered to be at a zero-crossing moment (from negative to positive values) of the fundamental A. Before the addition of the sinusoidal components, all the phases at origin of time for components A, A1 ÷ A6 from Table 2 are recalculated relative to this new origin of time. Curve 3a describes in the same way the evolution of the variable part of IAP1 (IP) generated by the same flat belt 1 after 100 s of supplementary running in idle of the gearbox. It is obvious that there is quite a good similarity between the curves 1a and 3a, with some relatively minor changes, probably due to the rising temperature of the belt and pulleys.
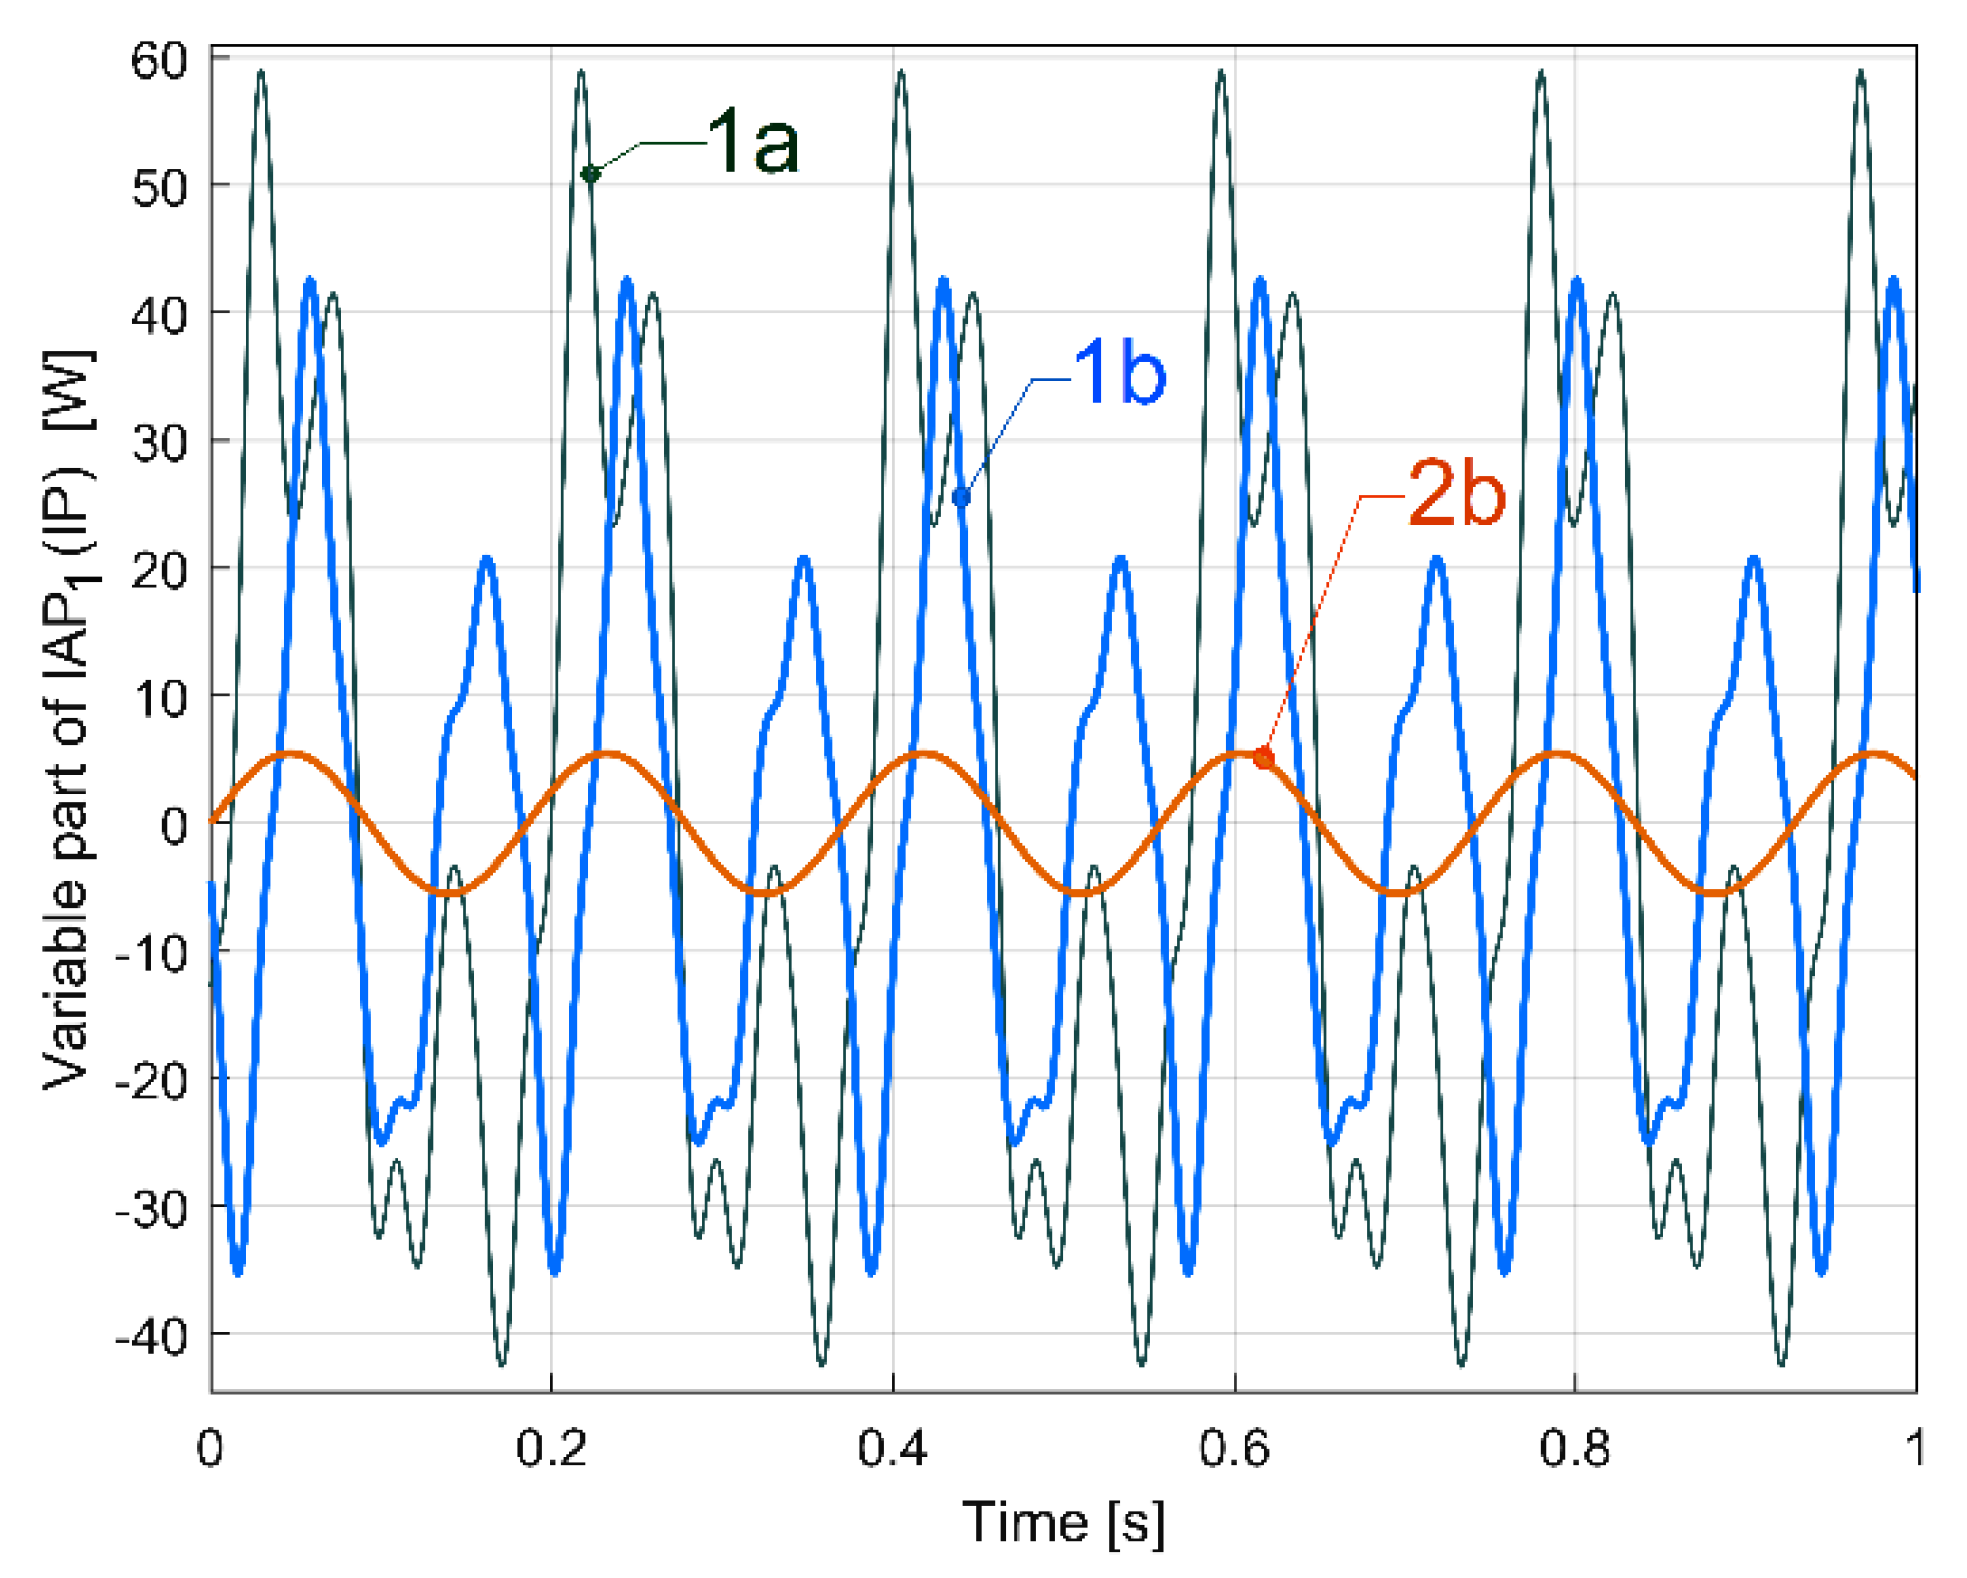
By comparison with the evolution depicted by curve 1a (from Figure 35), curve 1b in Figure 36 presents the description of flat belt 1’s influence on the variable part of IAP1 (or IP as well) if, in the gearing diagram (Figure 2), the electromagnetic clutch EMC3 is disengaged. Now, the rotation of shafts II and III and the output spindle are stopped, the AC motor drives only flat belt 1 and shaft I, and the average value of the IAP1 decreases from 3067 W (related to Figure 35) to 1021 W (related to Figure 36). Apart from changing the aspect of evolution (1b versus 1a), the amplitude of the fundamental (37.99 W on curve 2a) strongly decreases (only 5.5 W on curve 2b).
Here fA = 5.390 Hz and fAa = 5.388 Hz. In Figure 36, there is a small progressively decreasing time delay between the curves 1a and 1b because the value fAa is slightly different (5.336 Hz for curve 1a compared to 5.388 Hz for curve 1b). The decrease in the mechanical loading of the AC induction motor (due to the fact that the electromagnetic clutch EMC3 is disengaged) produces a slight increase in rotation speed, and the increase in the frequency fA (and fAa as well) is due to the decreasing motor slip.
We should mention that (with the electromagnetic clutch EMC3 disengaged) the dynamic model of the AC motor’s rotor, which is rotated by a rotary magnetic field, now has a torsional vibration mode of 10.785 Hz in frequency (with an 0.308 damping ratio). With fA1 = 10.77 Hz, there is a resonant amplification for the first harmonic A1 (having a 26.95 W amplitude). Because of structural damping, this resonant amplification strongly decreases when the entire gearing diagram is used (in Figure 35, on curve 1a, and in Table 2, the same first harmonic A1 has its amplitude diminished at 15.48 W).
Similarly, by the mathematical addition of sine components B, B1, B2 and B3 (having their description revealed by curve fitting, but with the frequency of harmonics fBai = (I + 1)·fBa and fBa = 9.4423 Hz calculated in the same way as in Equation (4)), it is possible to find the evolution of the variable part of IAP1 (or IP as well) generated by flat belt 2, as Figure 37 indicates (with the fundamental in red).
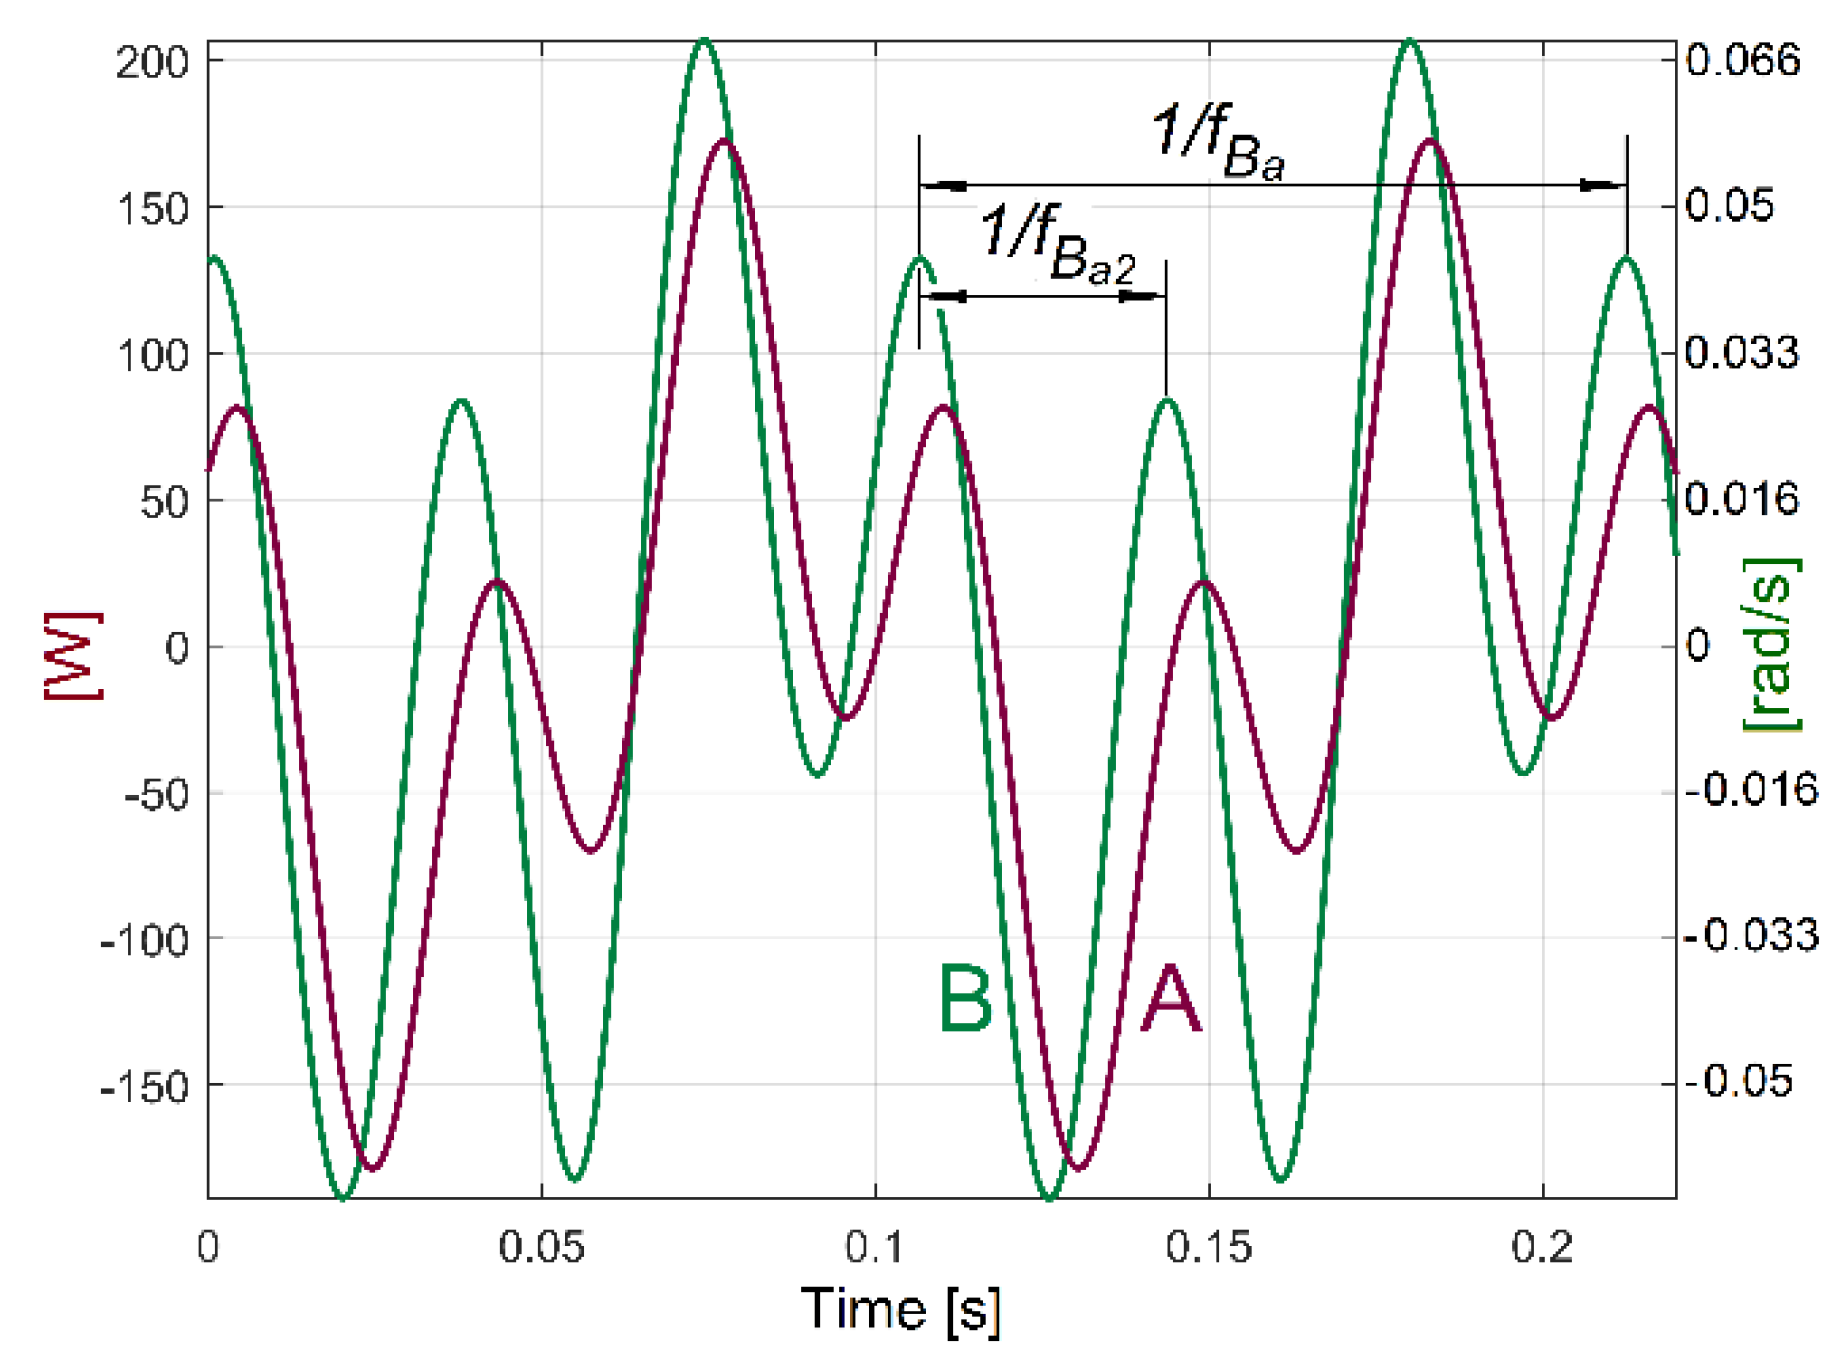
The analysis by curve fitting allows a comparative study of the variation produced by flat belt 2 on IAP1 (curve A in Figure 38, as a short sequence from Figure 37) and on IAS (curve B in Figure 38) during the same experiment. There is a difference of shapes and a shift of phase between the curves because IAP1 is measured on the AC motor (at the gearbox input), and IAS is measured at the output spindle (at the gearbox output). The gearbox introduces different attenuations (and different phase shifts) for the influence of flat belt 2 (on IAP1 and IAS) towards the AC motor and towards the output spindle.
The evolutions from Figure 35, Figure 36 and Figure 37 are useful in the condition monitoring of the flat belt transmissions (available for many other types of belts). There is a simple possible approach: if the peak-to-peak value of the IAP1 (IP) variable part generated by a belt (or the amplitude of the fundamental or some harmonics) exceeds an imposed limit, then the end of its proper working life has been reached. This is clearly proved by a new experiment. The headstock gearbox runs in idle in the configuration already depicted in Figure 2 and used in the previous experiments. This time, a damaged flat belt 1 (more than 40 years old) was used.
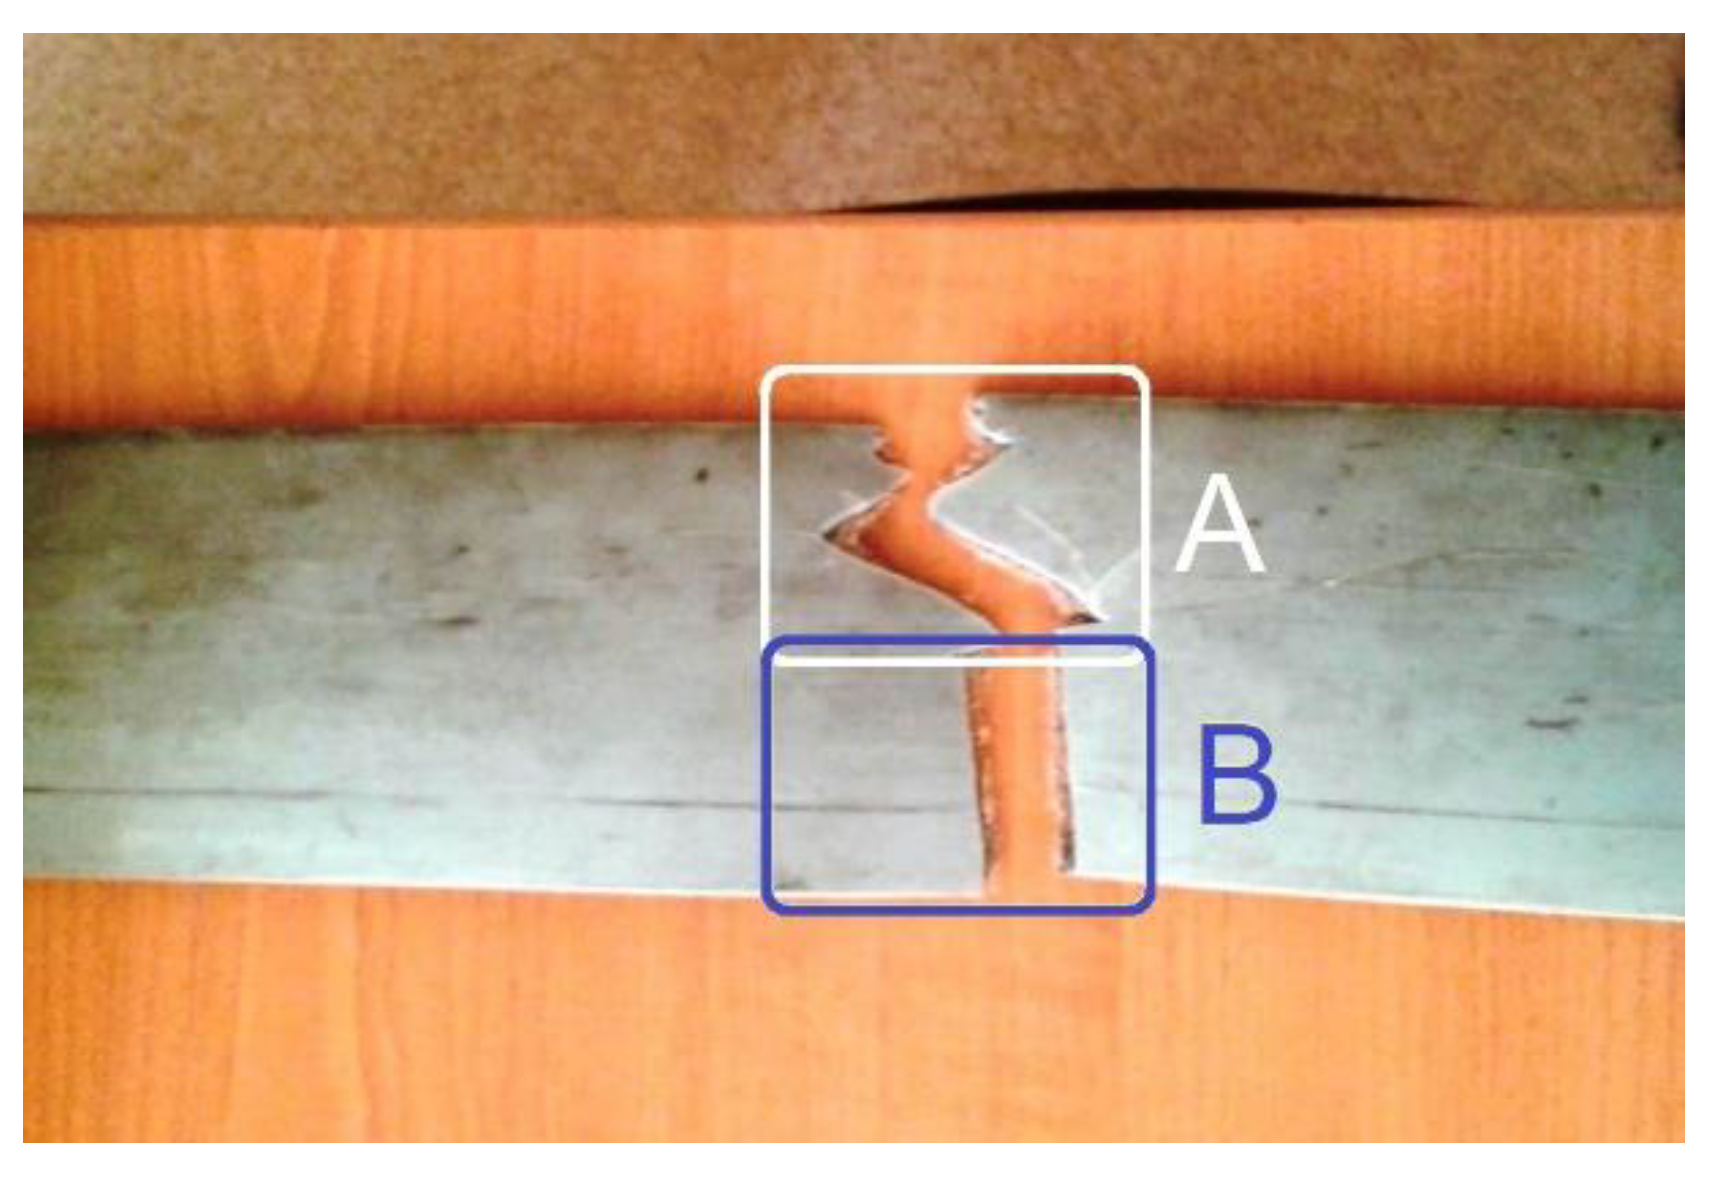
Figure 39 presents a partial view of this flat belt, finally broken during the experiments.
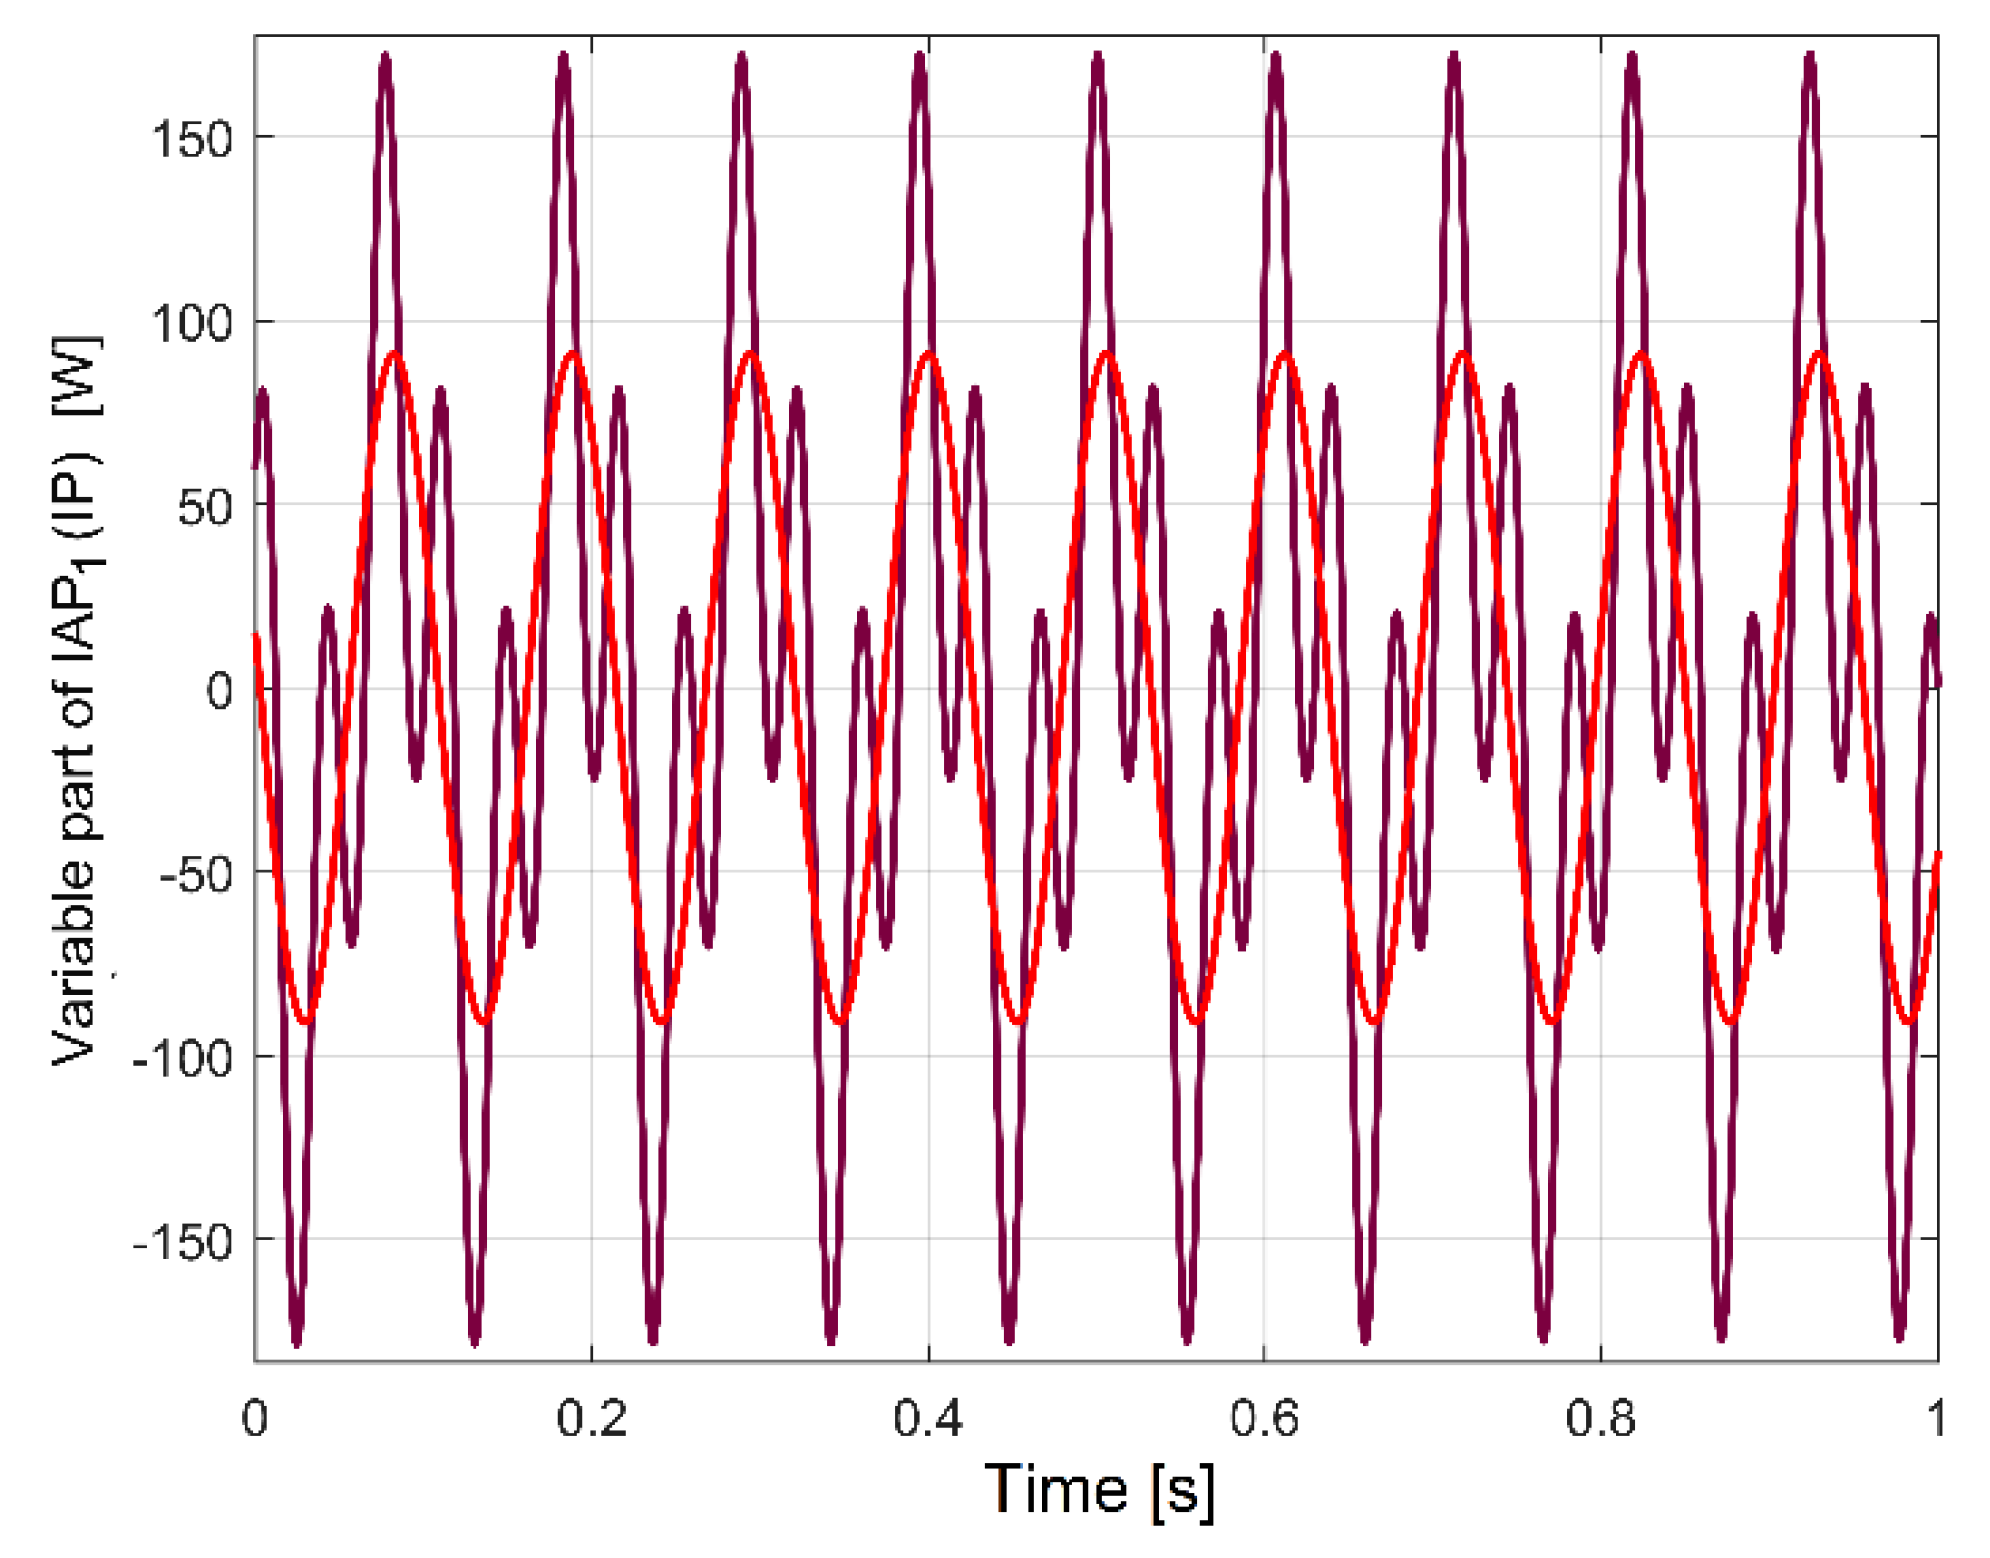
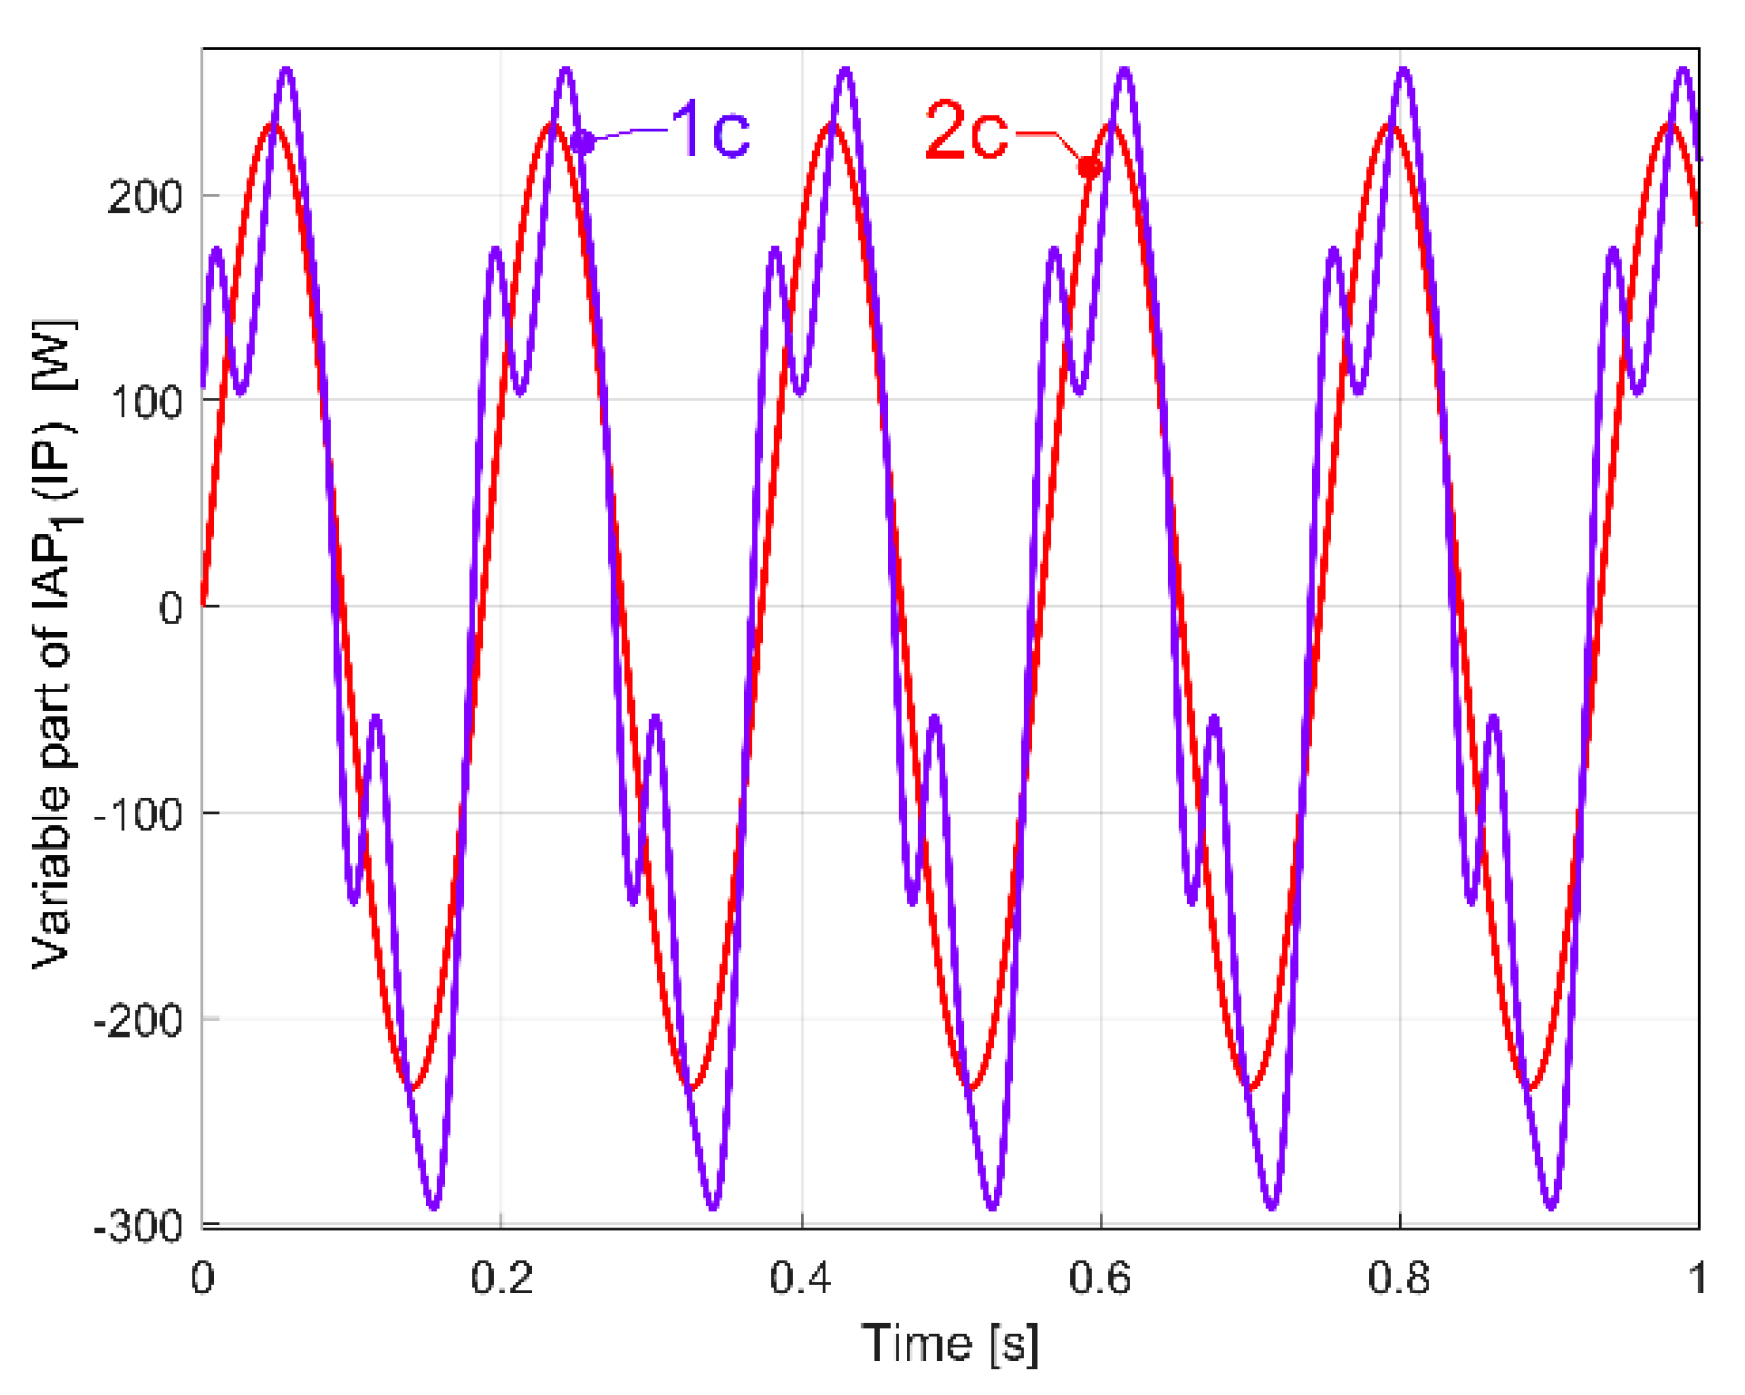
Firstly, the belt was partially broken only in area A, due to a mistake made when it was reinstalled on the pulleys. A severe decrease in the belt’s stiffness is produced in that area. For the time being, the belt is not yet broken in area B. The description of the variable part of IAP1 (IP) generated by this damaged flat belt was determined in a similar way to those depicted in Figure 35 (for curve 1a) and described with curve 1c in Figure 40.
Here, curve 2c describes the evolution of the fundamental. A comparison between Figure 35 and Figure 40 reveals a big increase in the peak-to-peak evolution of the variable part of IAP1 (IP) generated by the damaged belt compared with a regular one, and a big increasing in the amplitude of the fundamental (233.704 W here, in contrast with 37.99 W in Figure 35).
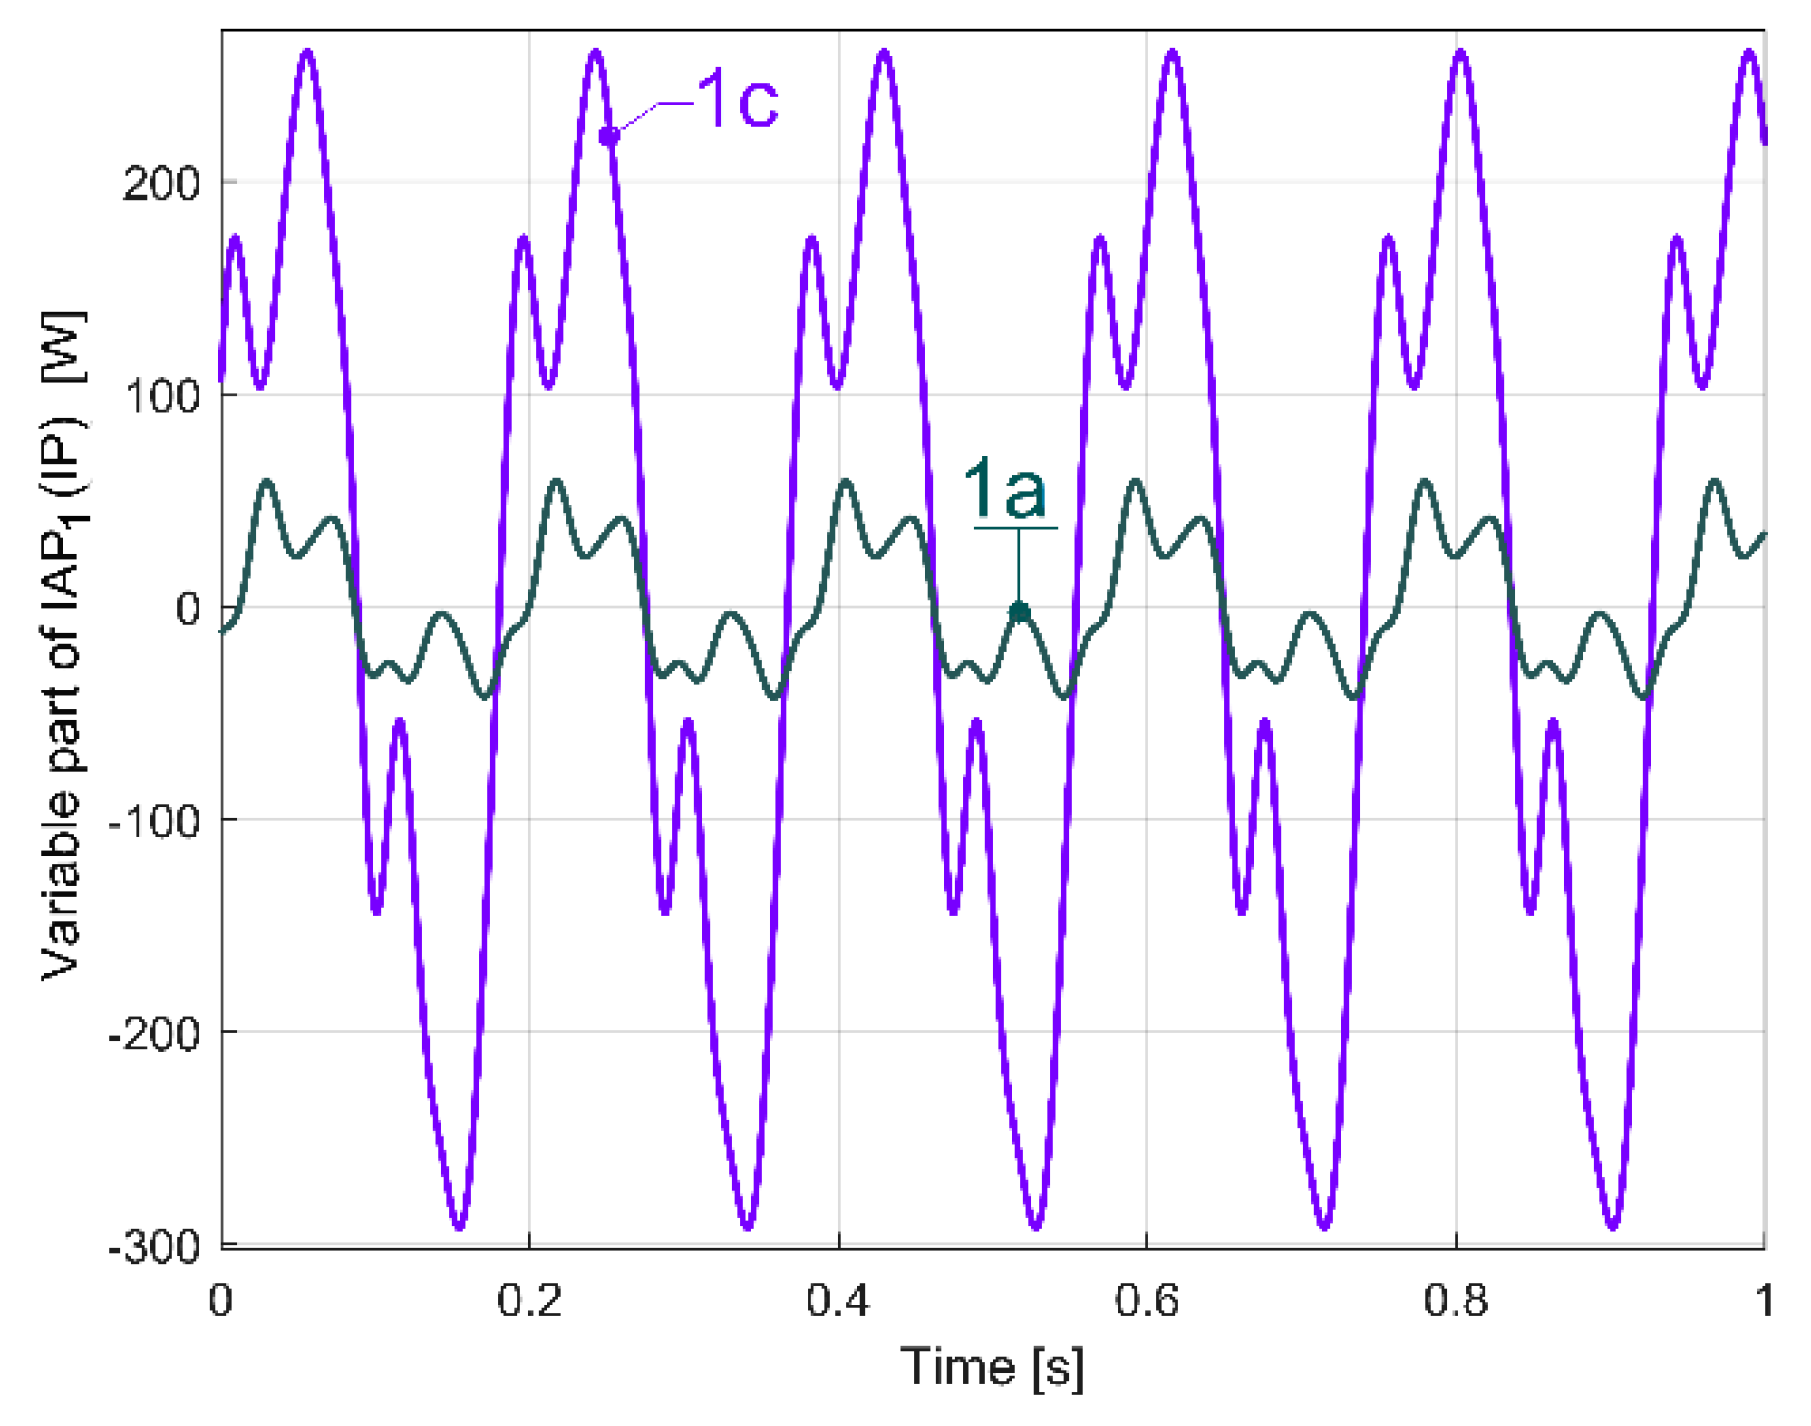
A better comparison between curve 1a (from Figure 35, which describes the behaviour of a regular flat belt) and curve 1c (from Figure 40, which describes the behaviour of a damaged flat belt) is allowed by Figure 41. The same magnitude was used for both curves.
It is obvious that damage to a flat belt can be detected a long time before a catastrophic failure. We should mention that this flat belt was completely broken much later in area B (Figure 39) during an experiment with an abnormally severe transient regime of gearbox acceleration.
We should highlight an important matter: the comparison between curves 1a and 3a in Figure 35, or between curves 1a and 1b in Figure 36, or between curves 1a and 1c in Figure 41 (each curve being the result of a different experiment) was possible (related to the phase relationships between the curves) firstly because each one has its origin on time strictly (recalculated) at a zero-crossing moment of its fundamental (curve 2a, 2b and 2c respectively) and secondly because the fundamentals have, with a good approximation, the same frequency.
This type of condition monitoring can be also applied for other types of drive belts (e.g., v-belts, in some preliminary experiments).
In the same way, it is possible to produce good descriptions of the behaviour of some other parts of the gearbox (especially the shafts) and to detect abnormal operating situations using mainly the variable parts of IAP1 (IP).
As a first example, the ordinates of some samples of the AEIP evolution from Figure 22 were recalculated by curve fitting (as AEPCF samples). Each AEPCF sample (described as a red rectangle in Figure 42, a completion of Figure 22) describes an average of the amplitude of peak E during 5 s of the evolution of IAP1, determined by curve fitting (the spectra of IP and IAP1 being identical). The fact that there is no perfect fit between the AEIAP1 samples and the average AEIP indicates once more that the IPE (or IAP1E as the variable part of IAP1 related to peak E) has a noisy evolution, partially because the frequency fE of the peak E on IAP1 (IP) is not strictly constant (another issue involved in condition monitoring). The average values of this frequency for each AEIAP1 sample (also a result of curve fitting process) are written in Figure 42.
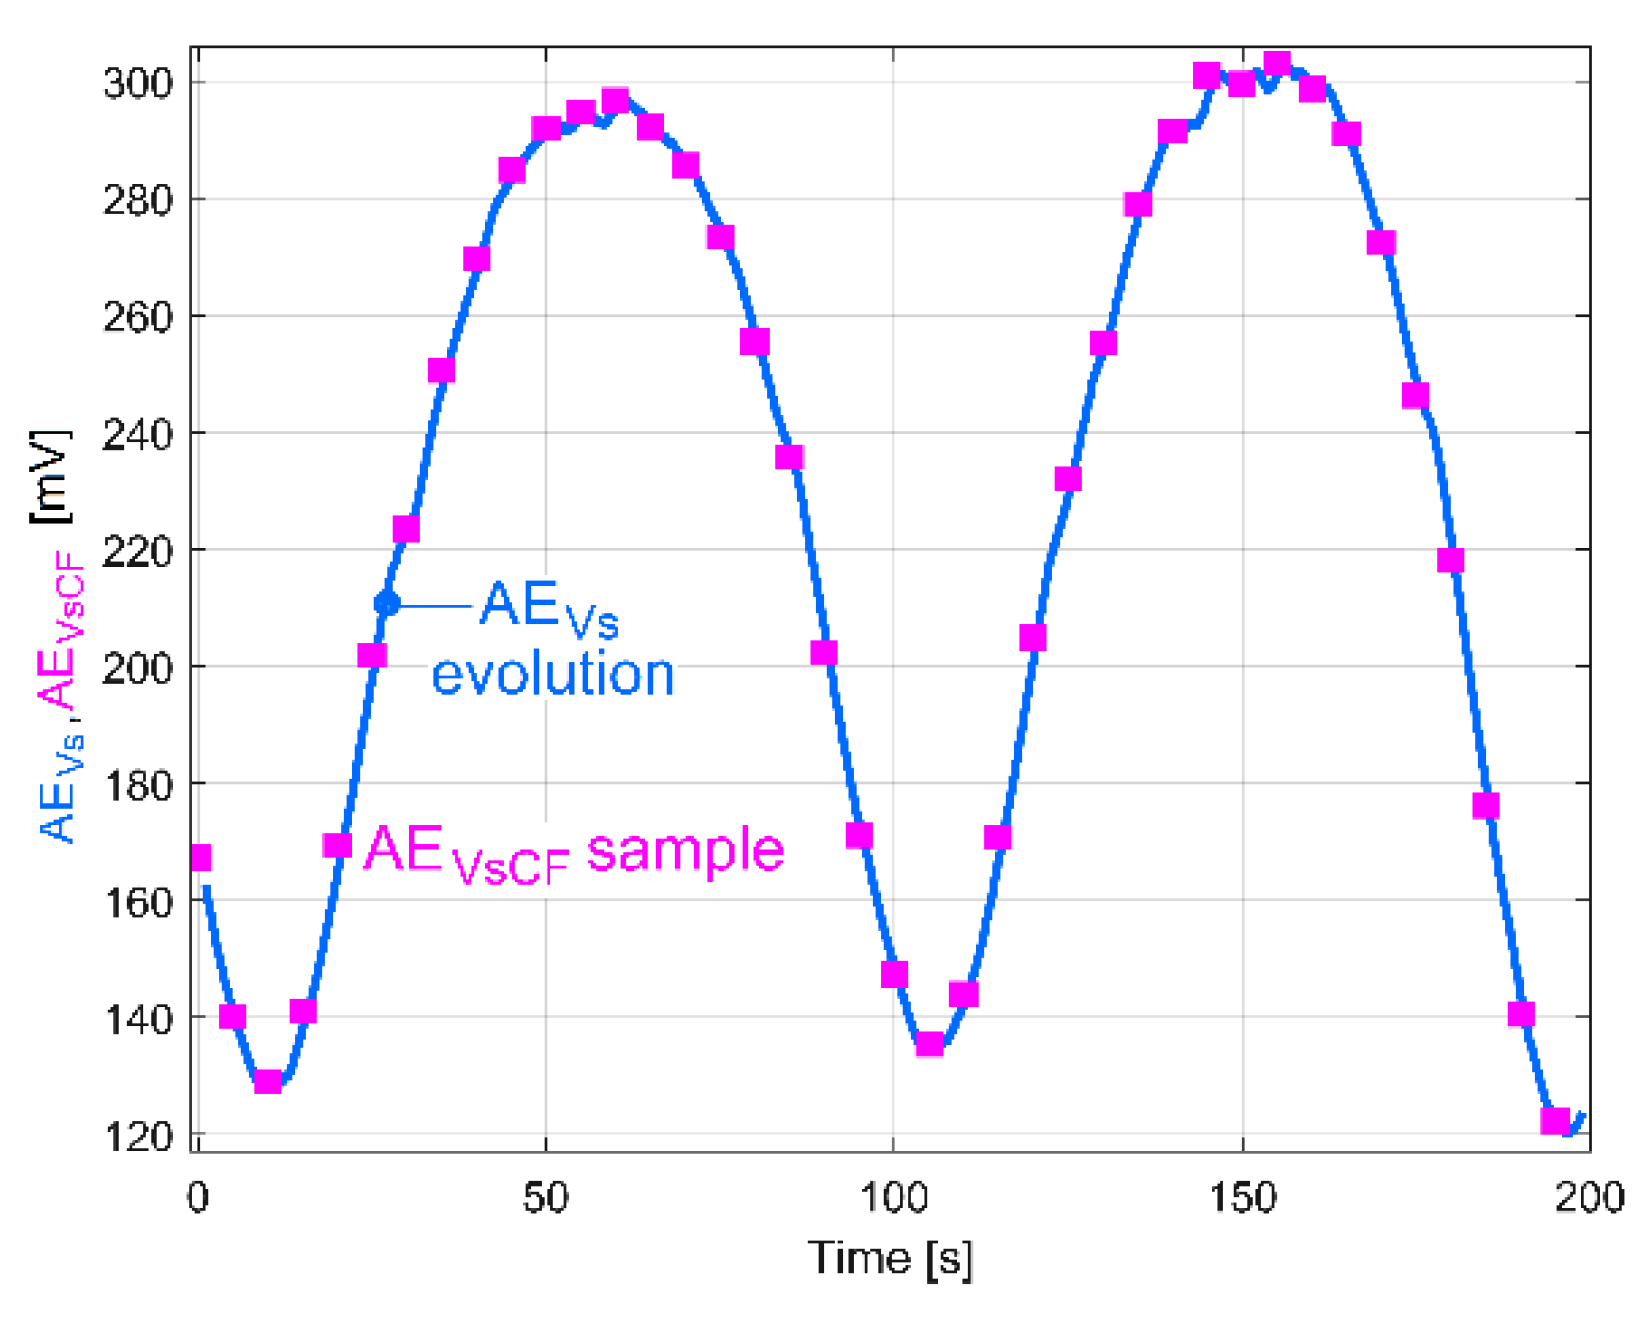
As a second example, the ordinates of some samples of the AEVs evolution (curve 2 from Figure 20, depicted in bright blue in Figure 43) were recalculated by curve fitting from the VSS signal (as AEVsCF samples).
Each of the 40 timewise equidistant AEVsCF samples (depicted as pink rectangles in Figure 43) describes an average of the local amplitude of peak E during 1 s of evolution of VSS, determined by curve fitting. This time, there is an almost perfect fit between the AEVs evolution and the AEVsCF samples (due to the fact that the component E is dominant in vibration). This means, first, that both methods for finding the amplitude of the peak E on VSS (the FFT spectra on short movable sequences SMSVs and the curve fit) work quite well. Secondly, this means that, in contrast to the AEIP (or AEPCF) evolution, the AEVs (and AEVsCF as well) evolution does not have a noisy evolution. In the amount of power used to rotate shaft III and the spindle (pE = pvdp + pep) the AEIP (noisy) evolution is strictly related to the power pE, while the AEVs (noiseless) evolution is strictly related to the power pep. It follows that the power pvdp also has a noisy evolution.
The determination of the mathematical description of the main signals components (sum of sinusoids model) by curve fitting can be successfully applied for condition monitoring purposes based on the gearbox vibration [49,50] (partially proved in Figure 43) or instantaneous angular speed evolutions (partially proved in Figure 38).
5. Discussion

This work reveals the behaviour of a three-phase AC asynchronous induction motor as a sensor of mechanical power useful for the condition monitoring of driven machines with the different mechanical parts inside having periodical rotary motions (with a constant rotation speed). An obvious argument justifies this approach: the mechanical power delivered by motor at the rotor is firmly mirrored in the input (active) electrical power absorbed from the supplying electrical network. Each rotary part inside the driven machine needs mechanical power to supply the motion in idle. When this motion has a constant speed, the variable part of this mechanical power is frequently periodical, described as a sum of sinusoidal components with a fundamental and some harmonics. This mechanical power is mirrored in the electrical power, and the mathematical descriptions of its components are detectable (by some computer-assisted procedures) and useful for the condition monitoring of that rotary part.
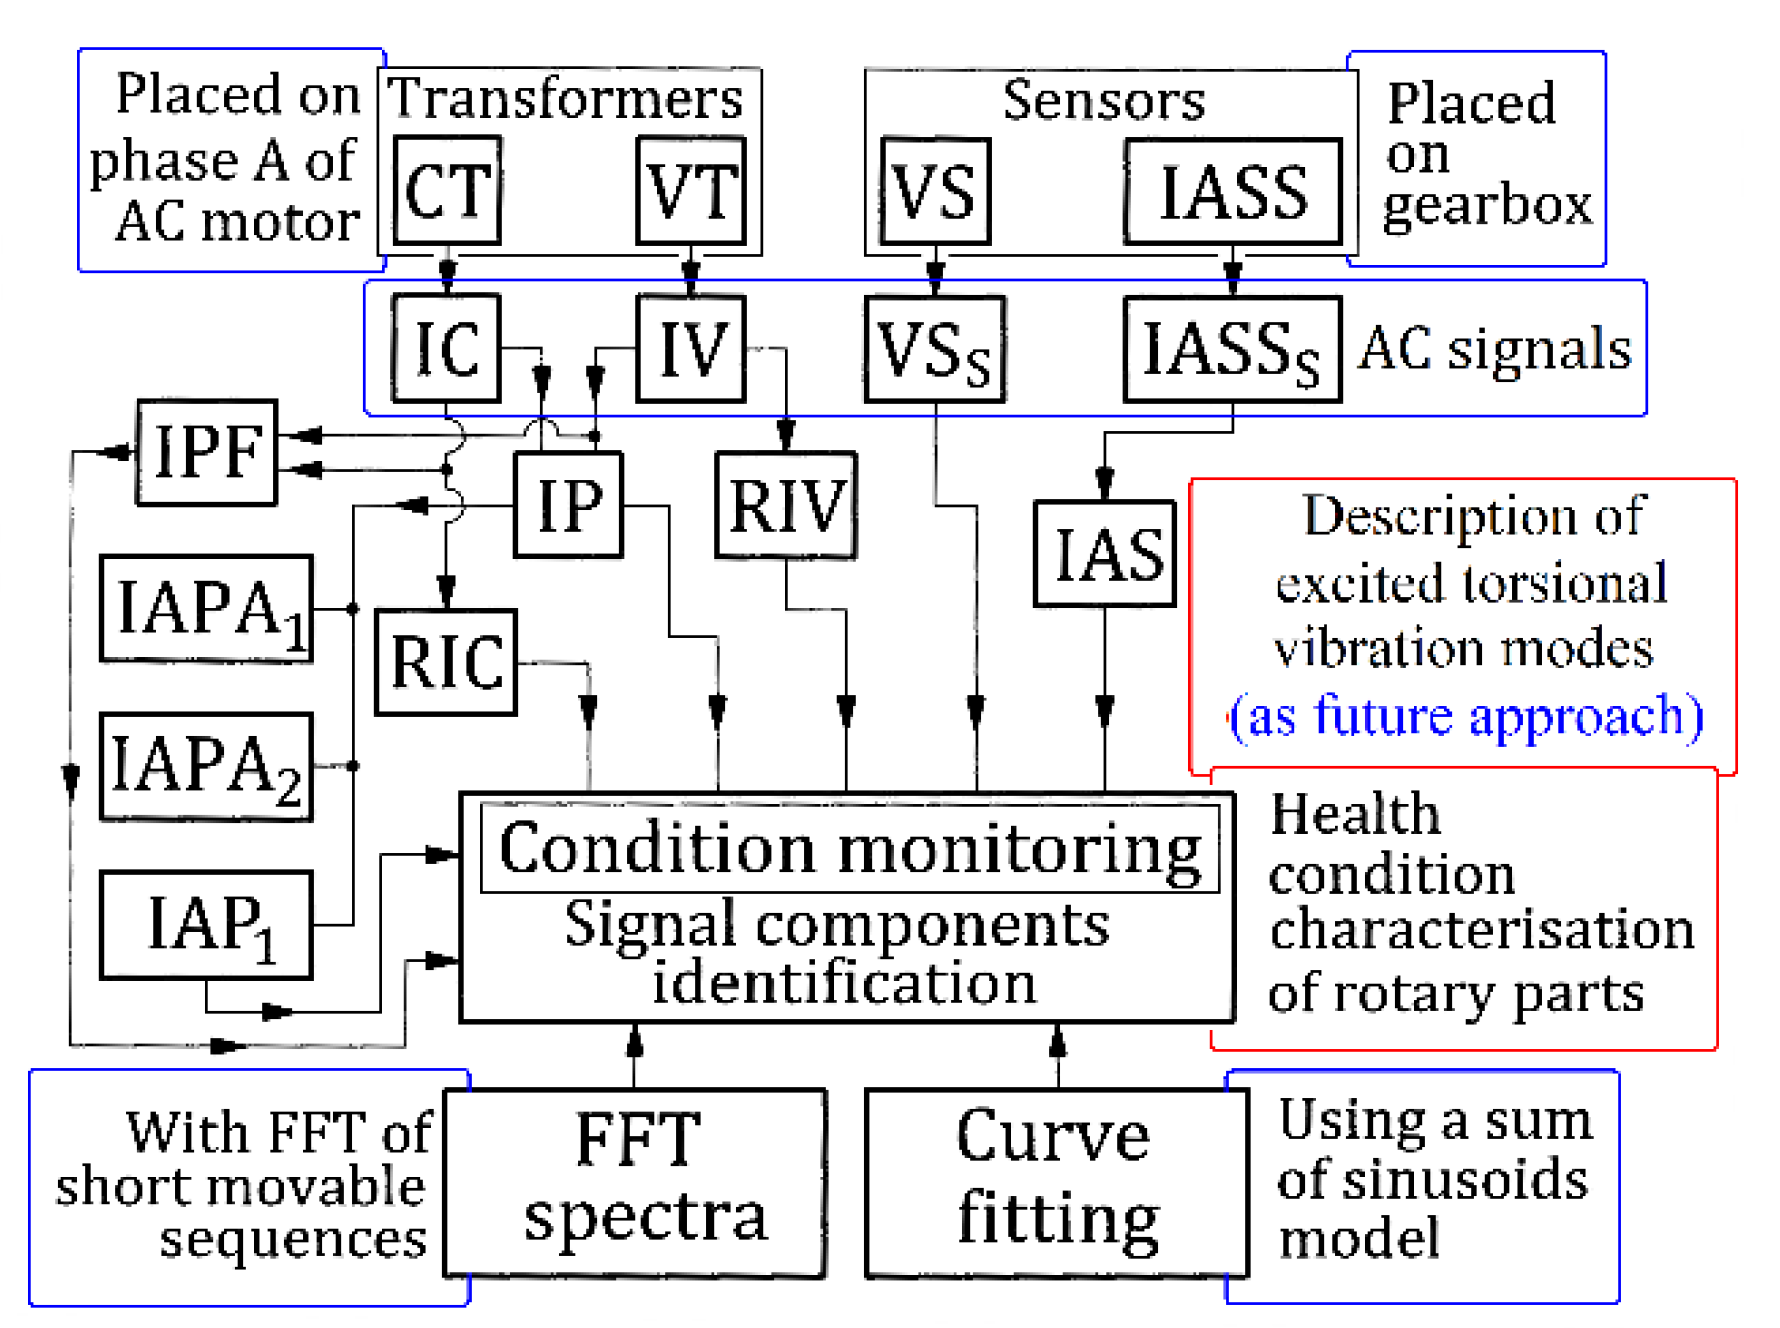
A particular rotary machine was considered here: a headstock lathe gearbox with shafts, belts, gears, bearings, etc., running idle with constant rotational speed. A simple computer-assisted experimental setup is used for data acquisition and signal processing. The block diagram from Figure 44 briefly depicts the main steps, flows, procedures and results in signal processing focused on the gearbox condition monitoring performed in this work.
The evolutions in time of the instantaneous voltage (IV) and the absorbed instantaneous current (IC) on a single phase acquired as AC signals (using a VT and a CT transformer) from the electrical input of the AC electrical motor (supplied directly with a three-phase four-wire system) are used for computer-assisted signal processing in order to achieve the descriptions of some constituents of electrical power: mainly, the instantaneous electrical power, instantaneous active electrical power and instantaneous power factor. This simple setup (possible to be greatly improved in the future by replacing the CT transformer with a current probe for an oscilloscope) has a big advantage: it can be very easily used for the electrical power monitoring of any other AC induction motor.
The AC signal delivered by a vibration sensor VS (as VSS) placed on the gearbox and the AC signal delivered by an instantaneous angular speed sensor IASS (as IASSS) placed on the output spindle are also used as alternative, comparative methods for condition monitoring. These four AC signals are acquired simultaneously in numerical format (using a numerical oscilloscope) with a high sampling rate and a high number of samples. This allows a high value for the Nyquist limit and a high resolution in frequency when the signals are described and analysed in the frequency domain for diagnostic purposes by the fast Fourier transform (FFT), a privileged topic in our work (mainly because the gearbox parts rotate with constant speed).
Using the IC and IV signals described in numerical format, a definition of the instantaneous electrical power (IP), two definitions of the instantaneous active electrical power (IAPA1 with low sampling frequency and IAPA2 with high sampling frequency) and a definition of the instantaneous power factor (IPF) were proposed and used in order to achieve the description of the evolution in the time and frequency domains (by FFT), using Matlab, for the main constituents of the electrical power absorbed by the AC induction motor.
First, a study on this gearbox establishes that, in a relative low area of frequencies, the spectra of IP, IAPA1 and IAPA2 are practically the same; however, the IP spectrum is preferred, mainly because IAPA1 has a low Nyquist limit at 50 Hz, and IAPA2 introduces some attenuations of the peak amplitudes at high frequencies (IAPA2 being the result of a low pass filtering of IP using a moving average filter). However, the IP spectrum has a relative important disadvantage: it contains high amplitude peaks, which describe mainly the harmonics of the fundamental on 100 Hz (electrically generated).
The resources of condition monitoring on this rotary machine running idle with a constant speed were particularly revealed in this work by the contents of FFT spectra in low area of frequencies (0 ÷ 40 Hz). The FFT spectrum of the IP (here with a 0.01 Hz frequency resolution) proves, firstly, that the IP can be approximated quite well as being a deterministic signal. Secondly, it was revealed that the IP spectral peaks describe the behaviour of some gearbox parts (belts, shafts and output spindle in a first approach). More precisely, they describe the average amplitudes of the components in a sum of sinusoids model for the variable part of the instantaneous electrical (or active) power absorbed by the AC motor and consumed to rotate the gearbox parts in idle. The amplitude of these peaks in the IP spectrum is an important feature involved in condition monitoring.
This work also proves that the FFT spectra of some other electrical parameters involved in the description of the electrical power flowing through the AC motor fully confirm the availability of the IP spectrum (all the peaks are described similarly on all spectra, at least related to frequencies). First is the FFT spectrum of IPF. Second (as a new proposal) is the FFT spectrum of full-wave rectified instantaneous current (RIC), a substitute for the FFT spectrum of IC (not relevant in our work), currently claimed to be used in the literature. Third (also as a new proposal) is the FFT spectrum of full-wave rectified instantaneous voltage (RIV), similarly a substitute for the FFT spectrum of IV. This last approach is not very relevant; the availability of RIV depends a lot on the voltage drop on the wires used to supply the AC motor, or on their electrical resistance. However, we consider that the FFT spectrum of IP is the best approach available to describe the condition of a driven rotary machine (as being more closely related to the variation of mechanical loading).
The availability of the FFT spectrum of IP was also fully confirmed by two supplementary spectra generated by the signals of other sensors placed on the gearbox: the spectrum of VSS and the spectrum of IAS during the same experiment. All the peaks are described similarly on all spectra, at least related to frequencies. For example, a spectrum generated by the pointwise multiplication (product) of the IP and VSS spectra fully confirms the similarities. The similarities between the IP and IAS spectra prove that there is a deterministic relationship between the mechanical loading and the angular speed of the motor: the speed decreases when the torque increases, and vice versa, due to the motor slip. The similarity between the IP and VSS spectra proves that many components of the forced vibration motion of the gearbox are powered by mechanical power delivered by the AC induction motor, especially those provided by mass imbalances of the rotating shafts.
This last similarity was supplementary investigated. It was proved that a low frequency (or high period: 96 s) beating phenomenon of vibration superposition in the gearbox (in the VSS signal) generated by the rotation with a mass imbalance and with almost the same speed of the output spindle and a shaft is powered by a beating phenomenon in the power from the periodical components inside the IP. A computer-aided method was proposed and developed in order to find the evolutions of the amplitude of the beating vibration and the amplitude of the beating power. First, the frequency of the beating phenomenon (the same in VSS and IP) was detected (17.37 Hz). The amplitude evolution of the peak at this frequency in the FFT spectra of a short movable sequence (with overlap) of the VSS and IP evolutions (having the same sampling frequency Fs) is the same as the amplitude of the beating phenomenon. The number of samples in the short movable sequences (Nss) is calculated in such a way that the kth sample in the FFT spectrum of the short movable sequence (having the frequency k·Fs/Nss) has the closest possible value to the frequency involved in the beating phenomenon. Each movable sequence produces a value of amplitude.
The shift of phase (time delay) between the beating phenomenon mirrored in instantaneous power and in vibration was also investigated with some supplementary experiments which modify this shift of phase by changing the vibration conditions of the gearbox or by introducing a supplementary periodical mechanical loading at the spindle (generated by a temporary interrupted cutting process). This work proves that this beating vibration phenomenon is well mirrored in the IAS and RIC evolutions, too. As an interesting achievement, this work proves that some important properties of the AC induction motor used as a sensor (related to a variable mechanical loading) are more relevant by comparison with the properties of a vibration sensor. However, it was indirectly proved that, because all periodical forced vibrations should be mechanically powered, there are two ways to describe these vibrations: using a vibration sensor or using the mechanical power measurement at the excitation source.
The FFT spectra of IP or RIC and eventually VSS in high frequency areas are available for the condition monitoring of other parts of the gearbox (e.g., gears, bearings). The IP or RIC evolutions in the time domain are also available for many other techniques of signal processing proposed in the literature for almost periodical signals.
This work also introduces a proposal for condition monitoring: the determination of a completely mathematical description of the main sinusoidal components (amplitude, frequency and phase at origin of time) inside the variable part of IAP1 (the instantaneous active power absorbed by the motor, three times bigger than IAPA1) by curve fitting (as a signal components identification procedure) based on the sum of sinusoids model, using two methods (both in Matlab) with similar results: a method proposed by us (slower) and the Curve Fitting Tool application (faster). The availability of these methods was experimentally proved firstly by comparison of the FFT spectra for a short experimental IAP1 sequence before and after the main sinusoidal components were removed and secondly by comparison in the time domain of this experimental sequence with the theoretical one built as a sum of the determined sinusoidal components.
This method allows an important approach to condition monitoring: it is possible to find the evolution in the time domain of the variable part of IAP1 (or IP) introduced by some mechanical parts inside the gearbox (as a sum of the detectable sinusoids with a fundamental and some harmonics) as a health condition characterization. In order to facilitate the comparison, related to the behaviour of a mechanical part in different circumstances, the origin of time of this variable part of IAP1 is placed in a zero-crossing moment of the fundamental, e.g., from negative to positive values.
As an example, the evolution of the periodical part of the power introduced by a regular flat belt placed at the gearbox input was described in different circumstances. Firstly, a quite good autocorrelation between two different sequences of these periodical parts of the variable power (5 s in duration each with a 100 s delay between) was proved. Secondly, the significant difference between the periodical parts of the power introduced by the same belt for two different gearing states of the gearbox was highlighted experimentally. Thirdly, a high difference was emphasised between the amplitude of the periodical parts of the power introduced by a seriously damaged belt compared with a regular one, using the same gearing state of the gearbox running idle.
The curve fitting method is appropriate also for describing the periodical components (as a sum of sinusoids) inside the vibration or instantaneous angular speed signals.
An essential observation can be made: if the average IAS in this stationary idling regime of the gearbox is not constant, then condition monitoring using both methods (based on FFT or curve fitting) is not conceivable, mainly because the variable part of IP, IAP1, IAS, VSS, RIC and IPF can no longer be described as a sum of sinusoids with constant frequencies. Two factors imply the variation of the IAS. Firstly, typically for AC asynchronous induction motors, the variation of the IAS is related to the slip of the motor due to the variation of mechanical power, indirectly measured here through the active electrical power. Secondly, this variation can be generated by the variation of the frequency of the electrical power supply system, because the synchronous speed of the motor depends on this frequency.
The dependence of the IAS on mechanical power is indirectly experimentally revealed as follows. During the experiments with the results depicted in Figure 22, two evolutions were also collected simultaneously: the low pass filtered evolution of the IAS at the output spindle (theoretically strictly related to the AC induction motor IAS due to the gearing diagram, Figure 2) and the low pass filtered AEP2. This AEP2 is the total active electrical power absorbed by motor, three times AEPA2, and theoretically proportional with the mechanical power delivered by motor. The dependence of this IAS on AEP2 is depicted in Figure 45. Here, the low pass filtered AEP2 decreases in time (and mechanical power, too) mainly because of gearbox heating. As a consequence, as the low pass filtered IAS increases, the motor slip decreases.
Contrary to any expectation, this dependence is not describable by a simple portion of curve (eventually reducible at a line), mainly because the IAS is not measured at the AC induction motor output rotor. In Figure 45, there are many irregular loops, probably because of the irregular slipping of the belts and clutch. However, an approximation of this evolution by a linear regression line reveals a very small negative slope (rate of IAS) of 0.8953 rad/(s·KW) or of 0.1424 Hz/KW as rotational frequency. This small value of the IAS slope (less than 0.2% in Figure 45) confirms that, with a good approximation, the IAS evolution (and the rotational frequency, as well) can be considered constant.
Figure 46 presents the evolution of the frequency of IV (filtered and unfiltered) during the same experiment. This IV frequency was accurately measured based on the same procedures used before for the IAS measurement [46] (the IASSS signal was replaced by the VTS signal). The unfiltered evolution of the IV frequency has a small peak-to-peak maximum variation of only 0.1262 Hz, and only 0.0583 Hz on low pass filtered evolution. Because the AC asynchronous induction motor has two magnetic poles, the peak-to-peak variation of its synchronous rotational frequency is 0.1262/2 = 0.0631 Hz (for IV unfiltered frequency evolution) and 0.0583/2 = 0.0291 Hz (for filtered evolution). In the worst possible scenario (the synchronous rotation frequency follows the IV unfiltered frequency evolution), the peak-to-peak variation of the rotation frequency is less than 0.26%. The influence of the IV frequency can be also neglected.
We should mention that the variation of the supplying frequency highlighted in Figure 46 exerts a (small) bad influence on the evolution of the filtered IAS, as already depicted in Figure 45. Nevertheless, if necessary, at least the curve fitting procedure can eliminate these small shortcomings by using short signal sequences for analysis. During these short sequences, the sum of sinusoids model for the signals IAP1, IAS, VSS, RIC and IPF can be considered viable.
This relatively small variation of the motor speed in stationary idle regimes due to the slip phenomenon is a big advantage, as it allows the condition monitoring of the driven machine as it is equipped, frequently, with an AC asynchronous induction drive motor, used as sensor. Otherwise, the use of a synchronous drive motor should be mandatory during condition monitoring procedures.

6. Conclusions and Future Work

Some important achievements in the condition monitoring of rotary machines driven by a three-phase AC asynchronous induction motor, running in idle with constant rotary speed, are revealed in this paper:
  • The AC induction motor used to drive a rotary machine works properly as a sensor of the variable (periodical) mechanical power phenomena involved in condition monitoring, through the absorbed electrical power.
  • The variable part of some different constituents of the electrical power is available for condition monitoring: e.g., instantaneous and active electrical power, the power factor.
  • The resources for condition monitoring using the full-wave rectified instantaneous current (RIC) and full-wave rectified instantaneous voltage (RIV) were revealed.
  • A very important feature of the electrical power constituents was highlighted: they have a preponderantly deterministic evolution, mathematically described as a sum of sinusoids with a low level of noise.
  • Two known signal processing methods were defined in order to find out the mathematical description of each significant term of this sum (with the values of amplitude, frequency and phase at origin of time), which are well related to the normal or abnormal behaviour of a rotary mechanical part through its rotation frequency.
  • The highlighting of the possibilities offered by these condition monitoring methods was accomplished through an experimental study of a beating phenomenon in instantaneous power and a flat belt behaviour.
  • Any type of gearbox failure which causes a variable (periodic) consumption of mechanical power during the idle running regime can be detected using condition monitoring based on an AC induction motor used as loading sensor, through the analysis of the absorbed electrical power and its components by FFT or curve fitting, if this variable consumption mirrored in the electrical power is bigger than the measurement noise. For example, in this paper, the behaviour of a damaged flat belt (in comparison with a regular one) was clearly revealed. Also, the behaviour of some shafts and the output spindle was described. However, we should mention that the gearbox moment of inertia works as a low pass mechanical filter. This makes the condition monitoring of relatively high frequency mechanical phenomena generated by rotary parts difficult.
  • The experimental approaches and their achievements were fully confirmed and validated by the evolutions of the vibration of the gearbox and the instantaneous angular speed of the output spindle.
The first challenge for a future work will be the optimisation of the IP (IAP1) signal analysis by computer aided curve fitting as a programmed procedure in Matlab, in order to drastically reduce its duration.
Future work will also focus on the condition monitoring of rotary machines and mechanical parts based on the exploitation of the IP (or RIC) resources at higher frequencies, useful for the condition monitoring of gears and bearings. The same resources will be used to detect and to describe the excited torsional vibration modes of shafts, because these vibrations (involved in gearbox dynamics) are also mechanically powered by the AC induction motor.
A computer-assisted method (by curve fitting) will be developed in order to automatically remove the electrically generated fundamentals (at the 50 and 100 Hz frequencies) and their harmonics from the IP (or RIC) evolution in the time domain. Secondly, an automatic procedure will be developed in order to detect the description of the variable part of the IP introduced by each mechanical part using a curve fitting procedure (as was previously performed for flat belt 1). Some other new possible features of the electrical power will be exploited: the description with a high sampling rate of the IPF evolution (bigger than 100 s−1), the use of instantaneous reactive power (IRP) in condition monitoring, based on a possible relationship of IRP with the periodically excited vibrations inside the driven rotary machines, as the literature suggests [51], etc.
A privileged topic in future research will be the exploitation as sensor of mechanical loading for an AC induction motor electrically supplied with an AC to AC converter.

Author Contributions

Conceptualization, methodology, software, supervision, writing—original draft, revise and editing, M.H.; investigations, validation, revise and editing, N.-E.B.; methodology, formal analysis, project administration, writing—original draft, resources, D.-F.C.; formal analysis, validation, software, writing—original draft, revise and editing, A.M.; methodology, formal analysis, investigations, C.-G.D.; investigations, software; writing—original draft, F.N.; investigations, validation, revise and editing, C.-G.M. All authors have read and agreed to the published version of the manuscript.

Funding

This research received no external funding.

Institutional Review Board Statement

Not applicable.

Informed Consent Statement

Not applicable.

Data Availability Statement

Not applicable.

Acknowledgments

This work was supported by “Gheorghe Asachi” Technical University of Iasi, Romania.

Conflicts of Interest

The authors declare no conflict of interest.

References

  1. Horodinca, M. The monitoring of transient regimes on machine tools based on speed, acceleration and active electric power absorbed by motors. In Proceedings of the ModTech International Conference—Modern Technologies in Industrial Engineering IV, Iasi, Romania, 15–18 June 2016; Volume 145, p. 022026. [Google Scholar]
  2. Chifan, F.; Luca, C.; Horodinca, M.; Dumitras, C.G. An Approach on a Transient Regime of a CNC Machining Center Spindle Drive System Using the Active Electrical Power Evolution. Recent 2019, 20, 99–106. [Google Scholar] [CrossRef]
  3. Ayari, A.; Mechergui, H.; Haddouk, A. Active power measurement comparison between analog and digital methods. In Proceedings of the 2013 International Conference on Electrical Engineering and Software Applications, Hammamet, Tunisia, 21–23 March 2013; pp. 1–6. [Google Scholar] [CrossRef]
  4. Bień, A.; Layer, E. Active power measurement based on digital processing of voltage and current signals. Tech. Trans. 2018, 6, 127–132. [Google Scholar]
  5. Liang, Y.C.; Wang, S.; Li, W.D.; Lua, X. Data-Driven Anomaly Diagnosis for Machining Processes. Engineering 2019, 5, 646–652. [Google Scholar] [CrossRef]
  6. Choi, W.H.; Kim, J.; Lee, J.Y. Development of Fault Diagnosis Models Based on Predicting Energy Consumption of a Machine Tool Spindle. Procedia Manuf. 2020, 51, 353–358. [Google Scholar] [CrossRef]
  7. Emec, S.; Krüger, J.; Seliger, G. Online fault-monitoring in machine tools based on energy consumption analysis and non-invasive data acquisition for improved resource-efficiency. Procedia CIRP 2016, 40, 236–243. [Google Scholar] [CrossRef] [Green Version]
  8. Miura, K.; Bergs, T. A Method of Cutting Power Monitoring for Feed Axes in Milling by Power Measurement Device. IFAC Pap. 2019, 52, 2461–2476. [Google Scholar] [CrossRef]
  9. Wirtz, A.; Meißner, M.; Wiederkehr, P.; Biermann, D.; Myrzik, J. Evaluation of cutting processes using geometric physically-based process simulation in view of the electric power consumption on machine tools. Procedia CIRP 2019, 79, 602–607. [Google Scholar] [CrossRef]
  10. Xu, G.; Chen, J.; Zhou, H.; Yang, J.; Hu, P.; Dai, W. Multi-objective feedrate optimization method of end milling using the internal data of the CNC system. Int. J. Adv. Manuf. Technol. 2019, 101, 715–731. [Google Scholar] [CrossRef]
  11. Moghaddas, A. Characterization of Thrust Force, Temperature, Chip Morphology and Power in Ultrasonic-assisted Drilling of Aluminium 6061. Int. J. Adv. Manuf. Technol. 2022, 118, 979–994. [Google Scholar] [CrossRef]
  12. Younas, M.; Jaffery, S.H.I.; Khan, A.; Khan, M. Development and analysis of tool wear and energy consumption maps for turning of titanium alloy (Ti6Al4V). J. Manuf. Process. 2021, 62, 613–622. [Google Scholar] [CrossRef]
  13. Hadi, M.A.; Brillinger, M.; Wuwer, M.; Schmid, J.; Trabesinger, S.; Jäger, M.; Haas, F. Sustainable peak power smoothing and energy-efficient machining process thorough analysis of high-frequency data. J. Clean. Prod. 2021, 318, 128548. [Google Scholar] [CrossRef]
  14. Goodall, P.; Pantazis, D.; West, A. A cyber physical system for tool condition monitoring using electrical power and a mechanistic model. Comput. Ind. 2020, 118, 103223. [Google Scholar] [CrossRef]
  15. Al-Sulaiman, F.A.; Baseer, M.A.; Sheikh, A.K. Use of electrical power for online monitoring of tool condition. J. Mater. Process. Technol. 2005, 166, 364–371. [Google Scholar] [CrossRef]
  16. Zhang, X.Y.; Lu, X.; Wang, S.; Wang, W.; Li, W.D. A multi-sensor based on line tool condition monitoring system for milling process. Procedia CIRP 2018, 72, 1136–1141. [Google Scholar] [CrossRef]
  17. Nath, C. Integrated Tool Condition Monitoring Systems and Their Applications: A Comprehensive Review. Procedia Manuf. 2020, 48, 852–863. [Google Scholar] [CrossRef]
  18. Rigacci, M.; Sato, R.; Shirase, K. Experimental evaluation of mechanical and electrical power consumption of feed drive systems driven by a ball-screw. Precis. Eng. 2020, 64, 280–287. [Google Scholar] [CrossRef]
  19. Kolar, M.; Vyroubal, J.; Smolik, J. Analytical approach to establishment of predictive models of power consumption of machine tools’ auxiliary units. J. Clean. Prod. 2016, 137, 361–369. [Google Scholar] [CrossRef]
  20. Lv, J.; Tang, R.; Tang, W.; Liu, Y.; Zhang, Y.; Jia, S. An investigation into reducing the spindle acceleration energy consumption of machine tools. J. Clean. Prod. 2017, 143, 794–803. [Google Scholar] [CrossRef] [Green Version]
  21. Granjon, P. Condition monitoring of motor-operated valves in nuclear power plants. In Proceedings of the Eighth International Conference on Condition Monitoring and Machinery Failure Prevention Technologies (CM/MFPT 2011), Cardiff, UK, 20–22 June 2011. [Google Scholar]
  22. Sihag, N.; Sangwan, K.S. A systematic literature review on machine tool energy consumption. J. Clean. Prod. 2020, 275, 123125. [Google Scholar] [CrossRef]
  23. Denkena, B.; Abele, E.; Brecher, C.; Dittrich, M.A.; Kara, S.; Mori, M. Energy efficient machine tools. CIRP Ann.-Manuf. Technol. 2020, 69, 646667. [Google Scholar] [CrossRef]
  24. Brillinger, M.; Wuwer, M.; Hadi, M.A.; Haas, F. Energy prediction for CNC machining with machine learning. CIRP J. Manuf. Sci. Technol. 2021, 35, 715–723. [Google Scholar] [CrossRef]
  25. Li, B.; Cao, H.; Hon, B.; Liu, L.; Gao, X. Exergy-based Energy Efficiency Evaluation Model for Machine Tools Considering Thermal Stability. Int. J. Precis. Eng. Manuf.-Green Technol. 2021, 8, 423–434. [Google Scholar] [CrossRef]
  26. Kang, H.; Lee, J.Y.; Lee, D.Y. An Integrated Energy Data Analytics Approach for Machine Tools. IEEE Access 2020, 8, 56124–56140. [Google Scholar] [CrossRef]
  27. Zhao, Z.; Li, L.; Wang, Y.; Sutherland, J. Impact of surface machining complexity on energy consumption and efficiency in CNC milling. Int. J. Adv. Manuf. Technol. 2019, 102, 2891–2905. [Google Scholar] [CrossRef]
  28. Fiebig, W.; Wrobel, J. Use Of Mechanical Resonance In Machines Drive Systems. In Proceedings of the 24th International Congress on Sound and Vibration, London, UK, 23–27 July 2017. [Google Scholar]
  29. Han, Q.; Ding, Z.; Xu, X.; Wang, T.; Chu, F. Stator current model for detecting rolling bearing faults in induction motors using magnetic equivalent circuits. Mech. Syst. Signal Process. 2019, 131, 554–575. [Google Scholar] [CrossRef]
  30. Han, Q.; Wang, T.; Ding, Z.; Xu, X.; Chu, F. Magnetic Equivalent Modeling of Stator Currents for Localized Fault Detection of Planetary Gearboxes Coupled to Electric Motors. IEEE Trans. Ind. Electron. 2021, 68, 2575–2586. [Google Scholar] [CrossRef]
  31. Jiang, Z.; Han, Q.; Xu, X. Fault Diagnosis of Planetary Gearbox Based on Motor Current Signal Analysis. Shock. Vib. 2020, 2020, 8854776. [Google Scholar] [CrossRef]
  32. Gao, A.; Feng, Z.; Liang, M. Permanent magnet synchronous generator stator current AM-FM model and joint signature analysis for planetary gearbox fault diagnosis. Mech. Syst. Signal Process. 2021, 149, 107331. [Google Scholar] [CrossRef]
  33. Zappalá, D.; Sarma, N.; Djurović, S.; Crabtree, C.J.; Mohammad, A.; Tavner, P.J. Electrical & mechanical diagnostic indicators of wind turbine induction generator rotor faults. Renew. Energy 2019, 131, 14–24. [Google Scholar]
  34. El Bouchikhi, E.H.; Choqueuse, V.; Benbouzid, M. Induction machine faults detection using stator current parametric spectral estimation. Mech. Syst. Signal Process. 2015, 52, 447–464. [Google Scholar] [CrossRef] [Green Version]
  35. Wu, H.; Wu, P.; Guo, J.; Zhou, S.; Wei, J. Current signal characteristics analysis of transmission system in high-speed train under abnormal vibration conditions. Veh. Syst. Dyn. 2022; early access. [Google Scholar] [CrossRef]
  36. Cablea, G.; Granjon, P.; Bérenguer, C. Three phase electrical signals analysis for mechanical faults monitoring in rotating machine systems. Mech. Syst. Signal Process. 2017, 92, 278–292. [Google Scholar] [CrossRef]
  37. Wang, B.; Wang, J.; Griffo, A. Stator turn fault detection by 2nd harmonic in instantaneous power for a triple redundant fault-tolerant PM drive. IEEE Trans. Ind. Electron. 2018, 65, 7279–7289. [Google Scholar] [CrossRef] [Green Version]
  38. Kucuker, A.; Bayrak, M. Detection of Mechanical Imbalances of Induction Motors with Instantaneous Power Signature Analysis. J. Electr. Eng. Technol. 2013, 8, 1116–1121. [Google Scholar] [CrossRef] [Green Version]
  39. Akar, M.; Gercekcioglu, H.S. Instantaneous power factor signature analysis for efficient fault diagnosis in inverter fed three phased induction motors. Int. J. Hydrog. Energy 2017, 42, 8338–8345. [Google Scholar] [CrossRef]
  40. Lia, S.; Luana, M.; Gana, D.; Wub, D. A model-based decoupling observer to locate forced oscillation sources in mechanical power. Electr. Power Energy Syst. 2018, 103, 127–135. [Google Scholar] [CrossRef]
  41. Fiebig, W.; Wróbel, J. Simulation of the energy flow at mechanical resonance. In Proceedings of the 22nd International Congress of Sound and Vibration, Florence, Italy, 12–16 July 2015. [Google Scholar]
  42. Horodinca, M.; Seghedin, N.E.; Carata, E.; Boca, M.; Filipoaia, C.; Chitariu, D. Dynamic Characterization of a Piezoelectric Actuated Cantilever Beam Using Energetic Parameters. Mech. Adv. Mater. Struct. 2014, 21, 154–164. [Google Scholar] [CrossRef]
  43. Horodinca, M. A study on actuation power flow produced in an active damping system. Mech. Syst. Signal Process. 2013, 39, 297–315. [Google Scholar] [CrossRef]
  44. Available online: https://www.picotech.com/oscilloscope/picoscope-4000-series (accessed on 2 December 2022).
  45. Available online: http://hgsindia.com/www.hgsproducts.nl/Pdf/196216HG-4%20V%201.1.pdf (accessed on 2 December 2022).
  46. Horodinca, M.; Ciurdea, I.; Chitariu, D.F.; Munteanu, A.; Boca, M. Some approaches on instantaneous angular speed measurement using a two-phase n poles AC generator as sensor. Measurement 2020, 157, 107636. [Google Scholar] [CrossRef]
  47. Choudhury, M.D.; Hong, L.; Dhupia, J.S. A Methodology to Handle Spectral Smearing in Gearboxes Using Adaptive Mode Decomposition and Dynamic Time Warping. IEEE Trans. Instrum. Meas. 2021, 70, 1–10. [Google Scholar] [CrossRef]
  48. Chitariu, D.F.; Negoescu, F.; Horodinca, M.; Dumitras, C.G.; Dogan, G.; Ilhan, M. An Experimental Approach on Beating in Vibration Due to Rotational Unbalance. Appl. Sci. 2020, 10, 6899. [Google Scholar] [CrossRef]
  49. Kumar, A.; Vashishtha, G.; Gandhi, C.P.; Zhou, Y.; Glowacz, A.; Xiang, J. Novel Convolutional Neural Network (NCNN) for the Diagnosis of Bearing Defects in Rotary Machinery. IEEE Trans. Instrum. Meas. 2020, 70, 1–10. [Google Scholar] [CrossRef]
  50. Kumar, A.; Gandhi, C.P.; Vashishtha, G.; Kundu, P.; Tang, H.; Glowacz, A.; Shukla, R.K.; Xiang, J. VMD based trigonometric entropy measure: A simple and effective tool for dynamic degradation monitoring of rolling element bearing. Meas. Sci. Technol. 2022, 33, 1221–1238. [Google Scholar] [CrossRef]
  51. Jiang, M.; Ma, H.; Zhang, Y.; Chen, X.; Zhao, X. Reactive power characteristics and vibration properties under SISC in synchronous condensers. Int. J. Electr. Power Energy Syst. 2021, 133, 107318. [Google Scholar] [CrossRef]
Figure 1. A description of the experimental setup.
Sensors 23 00488 g001
Figure 2. The gearing diagram of the lathe headstock gearbox used in experimental setup.
Sensors 23 00488 g002
Figure 3. A short sequence with the evolution of VTS, CTS signals (generated by VT and CT transformers) and VSS, IASSS signals (generated by VS and IASS sensors).
Sensors 23 00488 g003
Figure 4. A short sequence (0.1 s) with the evolutions of IPA, IAPA1, IAPA2 and APA with lathe headstock gearbox running idle.
Sensors 23 00488 g004
Figure 5. A short sequence (0 ÷ 55 Hz) with FFT spectra of IPA, IAPA1 and IAPA2 with headstock gearbox running idle.
Sensors 23 00488 g005
Figure 6. A zoomed-in detail of Figure 5 (in area A).
Sensors 23 00488 g006
Figure 7. The IPA, IAPA1, IAPA2 evolutions (not shifted) at first significant peak in Figure 6.
Sensors 23 00488 g007
Figure 8. A short sequence (50 ÷ 105 Hz) with FFT spectra of IPA, IAPA1 and IAPA2 with gearbox running idle.
Sensors 23 00488 g008
Figure 9. A short sequence of FFT spectrum of IP and the identification of the main components (fundamentals and harmonics) generated by some gearbox parts.
Sensors 23 00488 g009
Figure 10. A view of flat belt 1 placed on its pulleys.
Sensors 23 00488 g010
Figure 11. The behaviour of gearbox parts described in the FFT spectrum of IPF (for comparison with Figure 9).
Sensors 23 00488 g011
Figure 12. The influence of number of samples Ns on the quality of FFT spectra for IP.
Sensors 23 00488 g012
Figure 13. The behaviour of gearbox parts described in the FFT spectrum of IAS (for comparison with Figure 9).
Sensors 23 00488 g013
Figure 14. The behaviour of gearbox parts described in the FFT spectrum of vibration signal VSS (for comparison with Figure 9).
Sensors 23 00488 g014
Figure 15. A partial view on the pointwise multiplication (product) of IP and VSS spectra.
Sensors 23 00488 g015
Figure 16. A short sequence of FFT spectrum of IC.
Sensors 23 00488 g016
Figure 17. The behaviour of gearbox parts described in the FFT spectrum of RIC (for comparison with Figure 9).
Sensors 23 00488 g017
Figure 18. A short sequence of FFT spectrum of IV.
Sensors 23 00488 g018
Figure 19. The behaviour of gearbox parts described in the FFT spectrum of RIV (for comparison with Figure 9 and Figure 17).
Sensors 23 00488 g019
Figure 20. Beating phenomena in vibration signal VSS (1), with correct (curve 2) and wrong (curve 3) description of the evolution for the amplitude AEVs of the dominant component (E).
Sensors 23 00488 g020
Figure 21. A comparison of FFT spectra features for the peak E: on entire VSS (curve 1), using appropriate SMSVs size (curves 2, 3) and a wrong SMSVs size (curves 4, 5).
Sensors 23 00488 g021
Figure 22. The AEIP evolution during the experiment depicted in Figure 20, without filtering (curve 1) and low pass filtered (curve 2, as moving averaged AEIP). The pink dots marks some distorted data (due to filtering edge effects).
Sensors 23 00488 g022
Figure 23. The AERIC evolution during the experiment depicted in Figure 20, without filtering (curve 1) and low pass filtered (curve 2, as moving averaged AERIC). The pink dots marks some distorted data (due to filtering edge effects).
Sensors 23 00488 g023
Figure 24. The evolutions of averaged AEIP and AERIC related to the beating phenomenon.
Sensors 23 00488 g024
Figure 25. The evolutions of averaged AEIP and AEVs related with the beating phenomenon.
Sensors 23 00488 g025
Figure 26. The averaged AEIP and AEVs evolutions with an additional mass (RPS, 36.8 Kg) placed on gearbox.
Sensors 23 00488 g026
Figure 27. The averaged AEIP and AEVs evolutions with a rubber plate placed between the additional mass RPS and the gearbox.
Sensors 23 00488 g027
Figure 28. The influence of an interrupted longitudinal turning process on averaged AEIP evolution.
Sensors 23 00488 g028
Figure 29. The evolutions of AEIAS, averaged AEIP and AEVs (with large shift of phase between AEIAS and AEIP).
Sensors 23 00488 g029
Figure 30. The evolutions of AEIAS, averaged AEIP and AEVs (with small shift of phase between AEIAS and AEIP).
Sensors 23 00488 g030
Figure 31. A short sequence of the IP spectrum (40 ÷ 140 Hz).
Sensors 23 00488 g031
Figure 32. A short sequence of the RIC spectrum (40 ÷ 140 Hz).
Sensors 23 00488 g032
Figure 33. A comparison between the FFT of IAP1 and the FFT of the residual.
Sensors 23 00488 g033
Figure 34. A short experimental and built IAP1 evolution.
Sensors 23 00488 g034
Figure 35. The evolution of variable part of IAP1 (IP) generated by flat belt 1.
Sensors 23 00488 g035
Figure 36. A comparison of the evolution of variable parts of IAP1 (IP) generated by flat belt 1 in two different circumstances.
Sensors 23 00488 g036
Figure 37. The evolution of variable part of IAP1 (IP) generated by flat belt 2 (coloured in a shade of magenta). The red coloured evolution describes the fundamental B.
Sensors 23 00488 g037
Figure 38. A comparative evolution of the variable part generated by flat belt 2 in IAP1 (curve A) and in IAS (curve B).
Sensors 23 00488 g038
Figure 39. A view on a damaged flat belt 1.
Sensors 23 00488 g039
Figure 40. The evolution of variable part of IAP1 (IP) generated by a damaged flat belt 1 (with a severe tear in A, Figure 39).
Sensors 23 00488 g040
Figure 41. A comparison of variable parts of IAP1 (IP) generated by a damaged flat belt 1 (curve 1c) and a regular one (curve 1a).
Sensors 23 00488 g041
Figure 42. A completion of the Figure 22 with some equidistant timewise AEPCF samples (as red rectangles).
Sensors 23 00488 g042
Figure 43. The evolution of AEVs and some equidistant timewise AEVsCF samples (as pink rectangles).
Sensors 23 00488 g043
Figure 44. A block diagram related to signal processing for condition monitoring in this work.
Sensors 23 00488 g044
Figure 45. The low pass filtered IAS evolution (at the output spindle) depending on the low pass filtered AEP2 evolution.
Sensors 23 00488 g045
Figure 46. The evolution of frequency of instantaneous voltage on electrical supplying system depending by time.
Sensors 23 00488 g046
Table 1. The description of the major components from FFT spectrum of IP (Figure 9).
IP Spectrum ComponentFrequency
[Hz]
Amplitude
[W]
Describes the Behaviour of This Gearbox Part:
A (fundamental)fA= 5.3432.482Flat belt 1 (5 years old, depicted in Figure 10)
These components are involved in the description of flat belt 1 behaviour inside the first belt transmission.
Harmonics (H)A1fA1 = 10.6810.750
A2fA2 = 16.0113.400
A3fA3 = 21.356.390
A4fA4 = 26.697.348
A5fA5 = 32.021.483
A6fA6 = 37.364.168
BfB= 9.4585.016Flat belt 2 (more than 40 years old, partially depicted in the upper part of Figure 10)
These components are involved in the description of flat belt 2 behaviour inside the second belt transmission.
(H)B1fB1 = 18.904.138
B2fB2 = 28.3677.010
B3fB3 = 37.800.637
CfC= 10.982.585A v-belt used to drive a lubrication pump (depicted in lower part of Figure 10)
This pump (not highlighted in Figure 2) is driven by the same AC motor.
(H)C1fC1 = 21.973.937
C2fC2 = 32.9521.173
DfD= 13.7534.378The shaft II
825 rpm rotational speed (60·fD)
(H)D1fD1 = 27.5162.198
EfE= 17.3773.126Shaft III and the spindle
A study on this issue is presented below
1042.2 rpm rotational speed (60·fE)
(H)E1fE1 = 34.756.718
FfF= 21.5674.749The shaft I
1293.6 rpm rotational speed (60·fF)
GfG= 24.742.22AC motor shaft
1484.4 rpm rotational speed (60·fG)
Table 2. The description of some significant sinusoidal components from IP and IAP1.
Description of IP Sine Components from FFT Spectrum (from Table 1)Description of IAP1 sine Components Identified by Curve Fitting
Component
Label
Frequency
[Hz]
Amplitude
[W]
Frequency
[Hz]
Amplitude
[W]
Phase at Origin of Time
[rad]
A5.3432.4825.33634.88−0.3943
Harmonics (H)A110.6810.75010.66415.48−2.335
A216.0113.40015.99514.95−1.437
A321.356.39021.3105.5042.709
A426.697.34826.6749.1720.3216
A532.021.48332.0371.5770.4805
A637.364.16837.3304.1834.981
B9.4585.0169.445890.91−3.311
(H)B118.904.13818.8595.311.022
B228.3677.01028.34588.630.4546
B337.800.63737.7830.8331.5644
C10.982.58510.9811.836−4.022
(H)C121.973.93721.9794.901−1.341
C232.9521.17332.92920.822.14
D13.7534.37813.74746.19−1.677
(H)D127.5162.19827.50163.02−0.3428
E17.3773.12617.36384.081.524
(H)E134.756.71834.7119.7214.037
F21.5674.74921.54975.741.576
G24.752.2224.7483.5480.8004
Disclaimer/Publisher’s Note: The statements, opinions and data contained in all publications are solely those of the individual author(s) and contributor(s) and not of MDPI and/or the editor(s). MDPI and/or the editor(s) disclaim responsibility for any injury to people or property resulting from any ideas, methods, instructions or products referred to in the content.