
Refined Carbon Emission Measurement Based on NPP-VIIRS Nighttime Light Data: A Case Study of the Pearl River Delta Region, China


Abstract
:1. Introduction
2. Research Areas and Data Sources
2.1. Overview of the Study Area
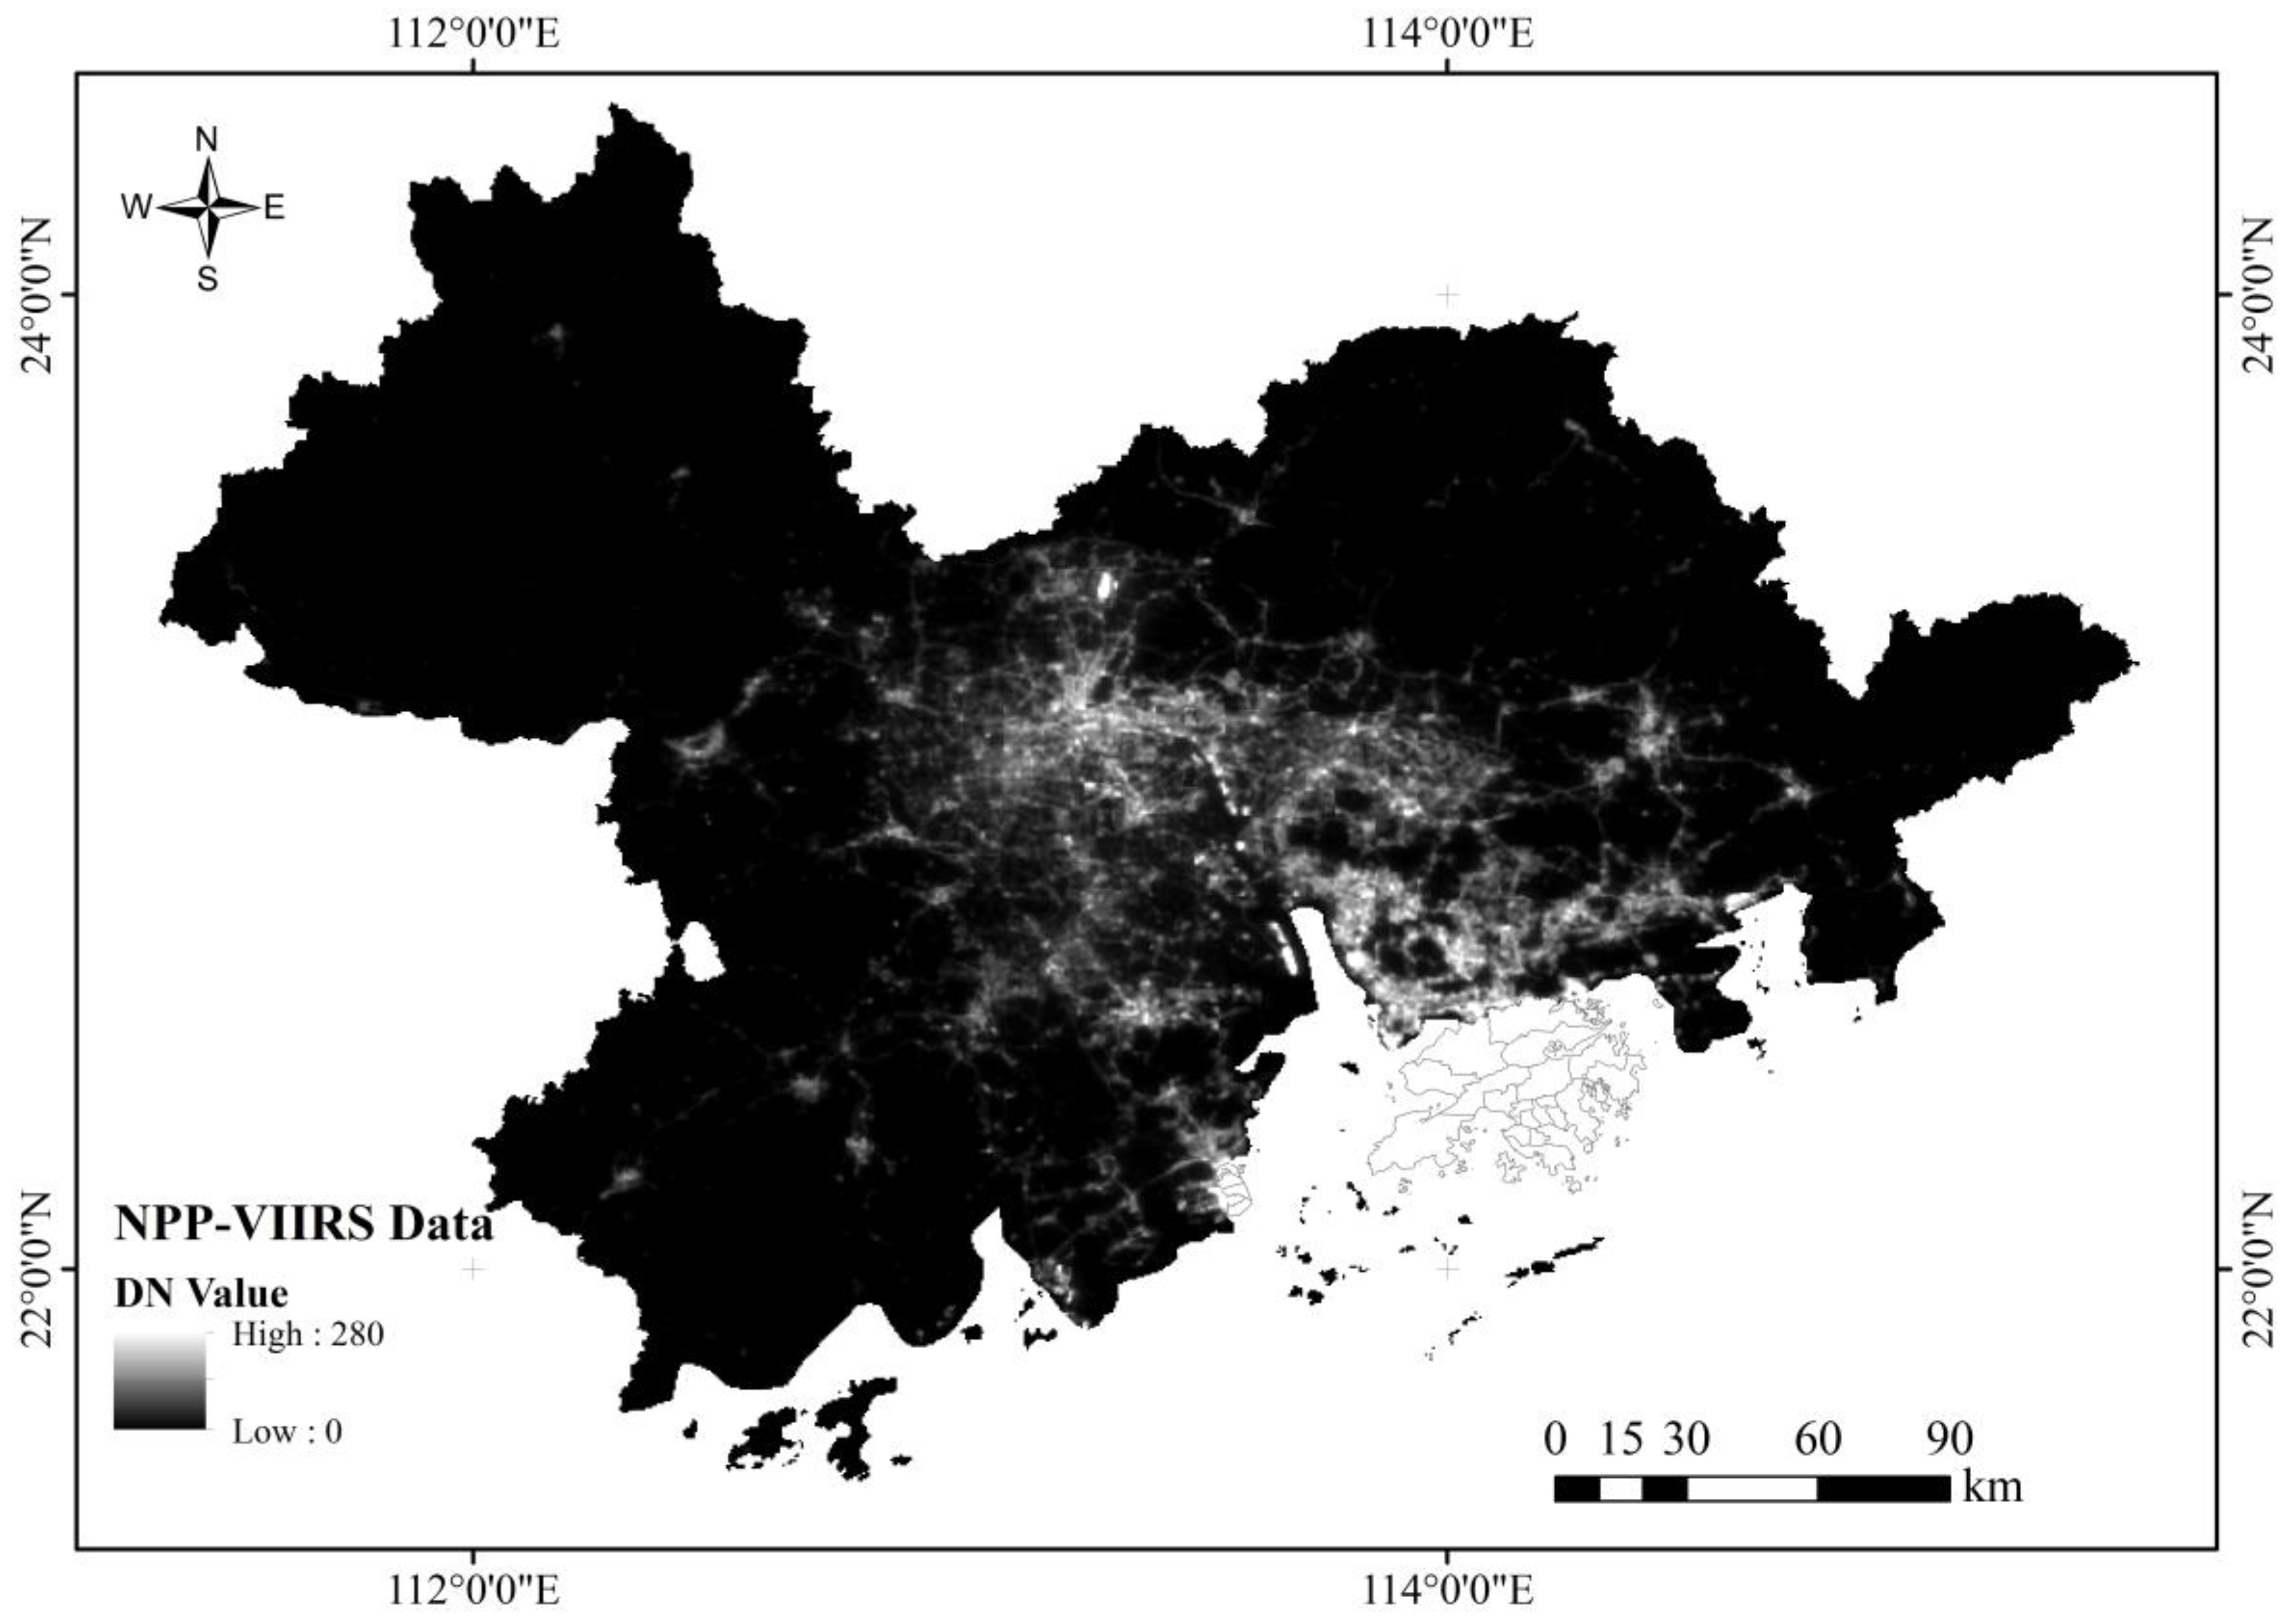
2.2. Data Source
3. Methods
3.1. Data Preprocessing
3.2. Construction of the Pixel-Scale Regression Model
3.2.1. Nighttime Light Index
3.2.2. Correlation Analysis and Stratified Random Sampling
3.3. Result Correction and Accuracy Test
4. Results
4.1. Construction of the Optimized CO2 Pixel-Scale Regression Model
4.2. Spatial Distribution Pattern of Pixel-Scale CO2 Emissions in the Pearl River Delta
5. Discussion
6. Conclusions
Author Contributions
Funding
Institutional Review Board Statement
Informed Consent Statement
Data Availability Statement
Acknowledgments
Conflicts of Interest
References
- Parry, M.L.; Canziani, O.; Palutikof, J.; Van der Linden, P.; Hanson, C. Climate Change 2007: Impacts, Adaptation and Vulnerability: Contribution of Working Group II to the Fourth Assessment Report of the Intergovernmental Panel on Climate Change; Cambridge University Press: New York, NY, USA; Cambridge, UK, 2007. [Google Scholar]
- Liu, W.; Zhan, J.; Wang, C.; Li, S.; Zhang, F. Environmentally sensitive productivity growth of industrial sectors in the Pearl River Delta. Resour. Conserv. Recycl. 2018, 139, 50–63. [Google Scholar] [CrossRef]
- Meng, X.; Han, J.; Huang, C. An Improved Vegetation Adjusted Nighttime Light Urban Index and Its Application in Quantifying Spatiotemporal Dynamics of Carbon Emissions in China. Remote Sens. 2017, 9, 829. [Google Scholar] [CrossRef] [Green Version]
- Shi, K.; Chen, Y.; Li, L.; Huang, C. Spatiotemporal variations of urban CO2 emissions in China: A multiscale perspective. Appl. Energy 2018, 211, 218–229. [Google Scholar] [CrossRef]
- Cheng, Y.; Zhao, L.; Wan, W.; Li, L.; Yu, T.; Gu, X. Extracting urban areas in China using DMSP/OLS nighttime light data integrated with biophysical composition information. J. Geogr. Sci. 2016, 26, 325–338. [Google Scholar] [CrossRef] [Green Version]
- Liu, X.; Ou, J.; Wang, S.; Li, X.; Yan, Y.; Jiao, L.; Liu, Y. Estimating spatiotemporal variations of city-level energy-related CO2 emissions: An improved disaggregating model based on vegetation adjusted nighttime light data. J. Clean. Prod. 2018, 177, 101–114. [Google Scholar] [CrossRef]
- Sun, X.; Zhang, H.; Ahmad, M.; Xue, C. Analysis of influencing factors of carbon emissions in resource-based cities in the Yellow River basin under carbon neutrality target. Environ. Sci. Pollut. Res. Int. 2021, 29, 23847–23860. [Google Scholar] [CrossRef]
- Yuan, X.; Sheng, X.; Chen, L.; Tang, Y.; Li, Y.; Jia, Y.; Qu, D.; Wang, Q.; Ma, Q.; Zuo, J. Carbon footprint and embodied carbon transfer at the provincial level of the Yellow River Basin. Sci. Total Environ. 2022, 803, 149993. [Google Scholar] [CrossRef]
- Chuai, X.; Huang, X.; Wang, W.; Wen, J.; Chen, Q.; Peng, J. Spatial econometric analysis of carbon emissions from energy consumption in China. J. Geogr. Sci. 2012, 22, 630–642. [Google Scholar] [CrossRef]
- Clarke-Sather, A.; Qu, J.; Wang, Q.; Zeng, J.; Li, Y. Carbon inequality at the sub-national scale: A case study of provincial-level inequality in CO2 emissions in China 1997–2007. Energy Policy 2011, 39, 5420–5428. [Google Scholar] [CrossRef]
- Long, Z.; Zhang, Z.; Liang, S.; Chen, X.; Ding, B.; Wang, B.; Chen, Y.; Sun, Y.; Li, S.; Yang, T. Spatially explicit carbon emissions at the county scale. Resour. Conserv. Recycl. 2021, 173, 105706. [Google Scholar] [CrossRef]
- Zhao, Y.; Nielsen, C.P.; McElroy, M.B. China’s CO2 emissions estimated from the bottom up: Recent trends, spatial distributions, and quantification of uncertainties. Atmos. Environ. 2012, 59, 214–223. [Google Scholar] [CrossRef]
- Doll, C.H.; Muller, J.; Elvidge, C.D. Night-time Imagery as a Tool for Global Mapping of Socioeconomic Parameters and Greenhouse Gas Emissions. AMBIO A J. Hum. Environ. 2000, 29, 157–162. [Google Scholar] [CrossRef]
- Elvidge, C.D.; Sutton, P.C.; Ghosh, T.; Tuttle, B.T.; Baugh, K.E.; Bhaduri, B.; Bright, E. A global poverty map derived from satellite data. Comput. Geosci. 2009, 35, 1652–1660. [Google Scholar] [CrossRef]
- Jiang, W.; He, G.; Long, T.; Guo, H.; Yin, R.; Leng, W.; Liu, H.; Wang, G. Potentiality of Using Luojia 1-01 Nighttime Light Imagery to Investigate Artificial Light Pollution. Sensors 2018, 18, 2900. [Google Scholar] [CrossRef] [PubMed] [Green Version]
- Zhang, G.; Guo, X.; Li, D.; Jiang, B. Evaluating the Potential of LJ1-01 Nighttime Light Data for Modeling Socio-Economic Parameters. Sensors 2019, 19, 1465. [Google Scholar] [CrossRef] [Green Version]
- Liu, H.; Luo, N.; Hu, C. Detection of County Economic Development Using LJ1-01 Nighttime Light Imagery: A Comparison with NPP-VIIRS Data. Sensors 2020, 20, 6633. [Google Scholar] [CrossRef] [PubMed]
- Chen, J.; Gao, M.; Cheng, S.; Hou, W.; Song, M.; Liu, X.; Liu, Y.; Shan, Y. County-level CO2 emissions and sequestration in China during 1997–2017. Sci. Data 2020, 7, 1–12. [Google Scholar] [CrossRef]
- Chen, Z.; Yu, B.; Hu, Y.; Huang, C.; Shi, K.; Wu, J. Estimating House Vacancy Rate in Metropolitan Areas Using NPP-VIIRS Nighttime Light Composite Data. IEEE J. Sel. Top. Appl. Earth Obs. Remote Sens. 2015, 8, 2188–2197. [Google Scholar] [CrossRef]
- Shi, K.; Chen, Y.; Yu, B.; Xu, T.; Chen, Z.; Liu, R.; Li, L.; Wu, J. Modeling spatiotemporal CO2 (carbon dioxide) emission dynamics in China from DMSP-OLS nighttime stable light data using panel data analysis. Appl. Energy 2016, 168, 523–533. [Google Scholar] [CrossRef]
- Wu, J.; Wang, Z.; Li, W.; Peng, J. Exploring factors affecting the relationship between light consumption and GDP based on DMSP/OLS nighttime satellite imagery. Remote Sens. Environ. 2013, 134, 111–119. [Google Scholar] [CrossRef]
- Yu, B.; Shu, S.; Liu, H.; Song, W.; Wu, J.; Wang, L.; Chen, Z. Object-based spatial cluster analysis of urban landscape pattern using nighttime light satellite images: A case study of China. Int. J. Geogr. Inf. Sci. 2014, 28, 2328–2355. [Google Scholar] [CrossRef]
- Lu, H.; Liu, G. Spatial effects of carbon dioxide emissions from residential energy consumption: A county-level study using enhanced nocturnal lighting. Appl. Energy 2014, 131, 297–306. [Google Scholar] [CrossRef]
- Wang, H.; Liu, G.; Shi, K. What Are the Driving Forces of Urban CO2 Emissions in China? A Refined Scale Analysis between National and Urban Agglomeration Levels. Int. J. Environ. Res. Public Health 2019, 16, 3692. [Google Scholar] [CrossRef] [PubMed] [Green Version]
- Wen, J.; Chuai, X.; Li, S.; Song, S.; Li, Y.; Wang, M.; Wu, S. Spatial Heterogeneity of the Carbon Emission Effect Resulting from Urban Expansion among Three Coastal Agglomerations in China. Sustainability 2019, 11, 4590. [Google Scholar] [CrossRef] [Green Version]
- Bennett, M.M.; Smith, L.C. Advances in using multitemporal night-time lights satellite imagery to detect, estimate, and monitor socioeconomic dynamics. Remote Sens. Environ. 2017, 192, 176–197. [Google Scholar] [CrossRef]
- Elvidge, C.; Ziskin, D.; Baugh, K.; Tuttle, B.; Ghosh, T.; Pack, D.; Erwin, E.; Zhizhin, M. A Fifteen Year Record of Global Natural Gas Flaring Derived from Satellite Data. Energies 2009, 2, 595–622. [Google Scholar] [CrossRef]
- Liu, Y.; Wang, Y.; Peng, J.; Du, Y.; Liu, X.; Li, S.; Zhang, D. Correlations between Urbanization and Vegetation Degradation across the World’s Metropolises Using DMSP/OLS Nighttime Light Data. Remote Sens. 2015, 7, 2067–2088. [Google Scholar] [CrossRef] [Green Version]
- Liu, Z.; He, C.; Zhang, Q.; Huang, Q.; Yang, Y. Extracting the dynamics of urban expansion in China using DMSP-OLS nighttime light data from 1992 to 2008. Landsc. Urban Plan. 2012, 106, 62–72. [Google Scholar] [CrossRef]
- Ma, T.; Zhou, C.; Pei, T.; Haynie, S.; Fan, J. Quantitative estimation of urbanization dynamics using time series of DMSP/OLS nighttime light data: A comparative case study from China’s cities. Remote Sens. Environ. 2012, 124, 99–107. [Google Scholar] [CrossRef]
- Meng, L.; Graus, W.; Worrell, E.; Huang, B. Estimating CO2 (carbon dioxide) emissions at urban scales by DMSP/OLS (Defense Meteorological Satellite Program’s Operational Linescan System) nighttime light imagery: Methodological challenges and a case study for China. Energy 2014, 71, 468–478. [Google Scholar] [CrossRef]
- Rayner, P.J.; Raupach, M.R.; Paget, M. Regional variations in spatial structure of nightlights, population density and fossil-fuel CO2 emissions. Energy Policy 2010, 38, 4756–4764. [Google Scholar]
- Wang, L.; Wang, S.; Zhou, Y.; Liu, W.; Hou, Y.; Zhu, J.; Wang, F. Mapping population density in China between 1990 and 2010 using remote sensing. Remote Sens. Environ. 2018, 210, 269–281. [Google Scholar] [CrossRef]
- Su, Y.; Chen, X.; Li, Y.; Liao, J.; Ye, Y.; Zhang, H.; Huang, N.; Kuang, Y. China’s 19-year city-level carbon emissions of energy consumptions, driving forces and regionalized mitigation guidelines. Renew. Sustain. Energy Rev. 2014, 35, 231–243. [Google Scholar] [CrossRef]
- Aliyu, G.; Luo, J.; Di, H.J.; Lindsey, S.; Liu, D.; Yuan, J.; Chen, Z.; Lin, Y.; He, T.; Zaman, M.; et al. Nitrous oxide emissions from China’s croplands based on regional and crop-specific emission factors deviate from IPCC 2006 estimates. Sci. Total Environ. 2019, 669, 547–558. [Google Scholar] [CrossRef] [PubMed]
- Schipper, L.; Murtishaw, S.; Khrushch, M.; Ting, M.; Karbuz, S.; Unander, F. Carbon emissions from manufacturing energy use in 13 IEA countries: Long-term trends through 1995. Energy Policy 2001, 29, 667–688. [Google Scholar] [CrossRef]
- Su, Y.; Chen, X.; Wang, C.; Zhang, H.; Liao, J.; Ye, Y.; Wang, C. A new method for extracting built-up urban areas using DMSP-OLS nighttime stable lights: A case study in the Pearl River Delta, southern China. GIScience Remote Sens. 2015, 52, 218–238. [Google Scholar] [CrossRef]


| TNL | ANL | |
|---|---|---|
| r (Pearson) | 0.950 | −0.039 |
| Significance | 0.000 | 0.787 |
| Model Summary | Parameter Estimated Value | ||||||
|---|---|---|---|---|---|---|---|
| Model | R2 | F | Significance | Constant | b1 | b2 | b3 |
| Linear | 0.909 | 380.551 | 0.000 | 647,055.855 | 334.133 | ||
| Logarithm | 0.596 | 56.157 | 0.000 | −56,557,734.916 | 6,748,511.249 | ||
| Quadratic | 0.911 | 189.890 | 0.000 | 192,425.593 | 374.718 | 0.000 | |
| Cubic | 0.919 | 136.401 | 0.000 | 1,479,980.790 | 171.999 | 0.006 | −3.293 × 10⁻⁸ |
| CO2 Emission Level | Area (m2) | Number of Pixels | Percentage (%) |
|---|---|---|---|
| High (>20,000 tons/ppx) | 156,500,000 | 626 | 0.28 |
| Medium (10,000–20,000 tons/ppx) | 336,250,000 | 1345 | 0.61 |
| Relatively Low (5000–10,000 tons/ppx) | 1,580,750,000 | 6323 | 2.85 |
| Low (2000–5000 tons/ppx) | 9,016,500,000 | 36,066 | 16.24 |
| Very Low (<2000 tons/ppx) | 44,434,250,000 | 177,737 | 80.02 |
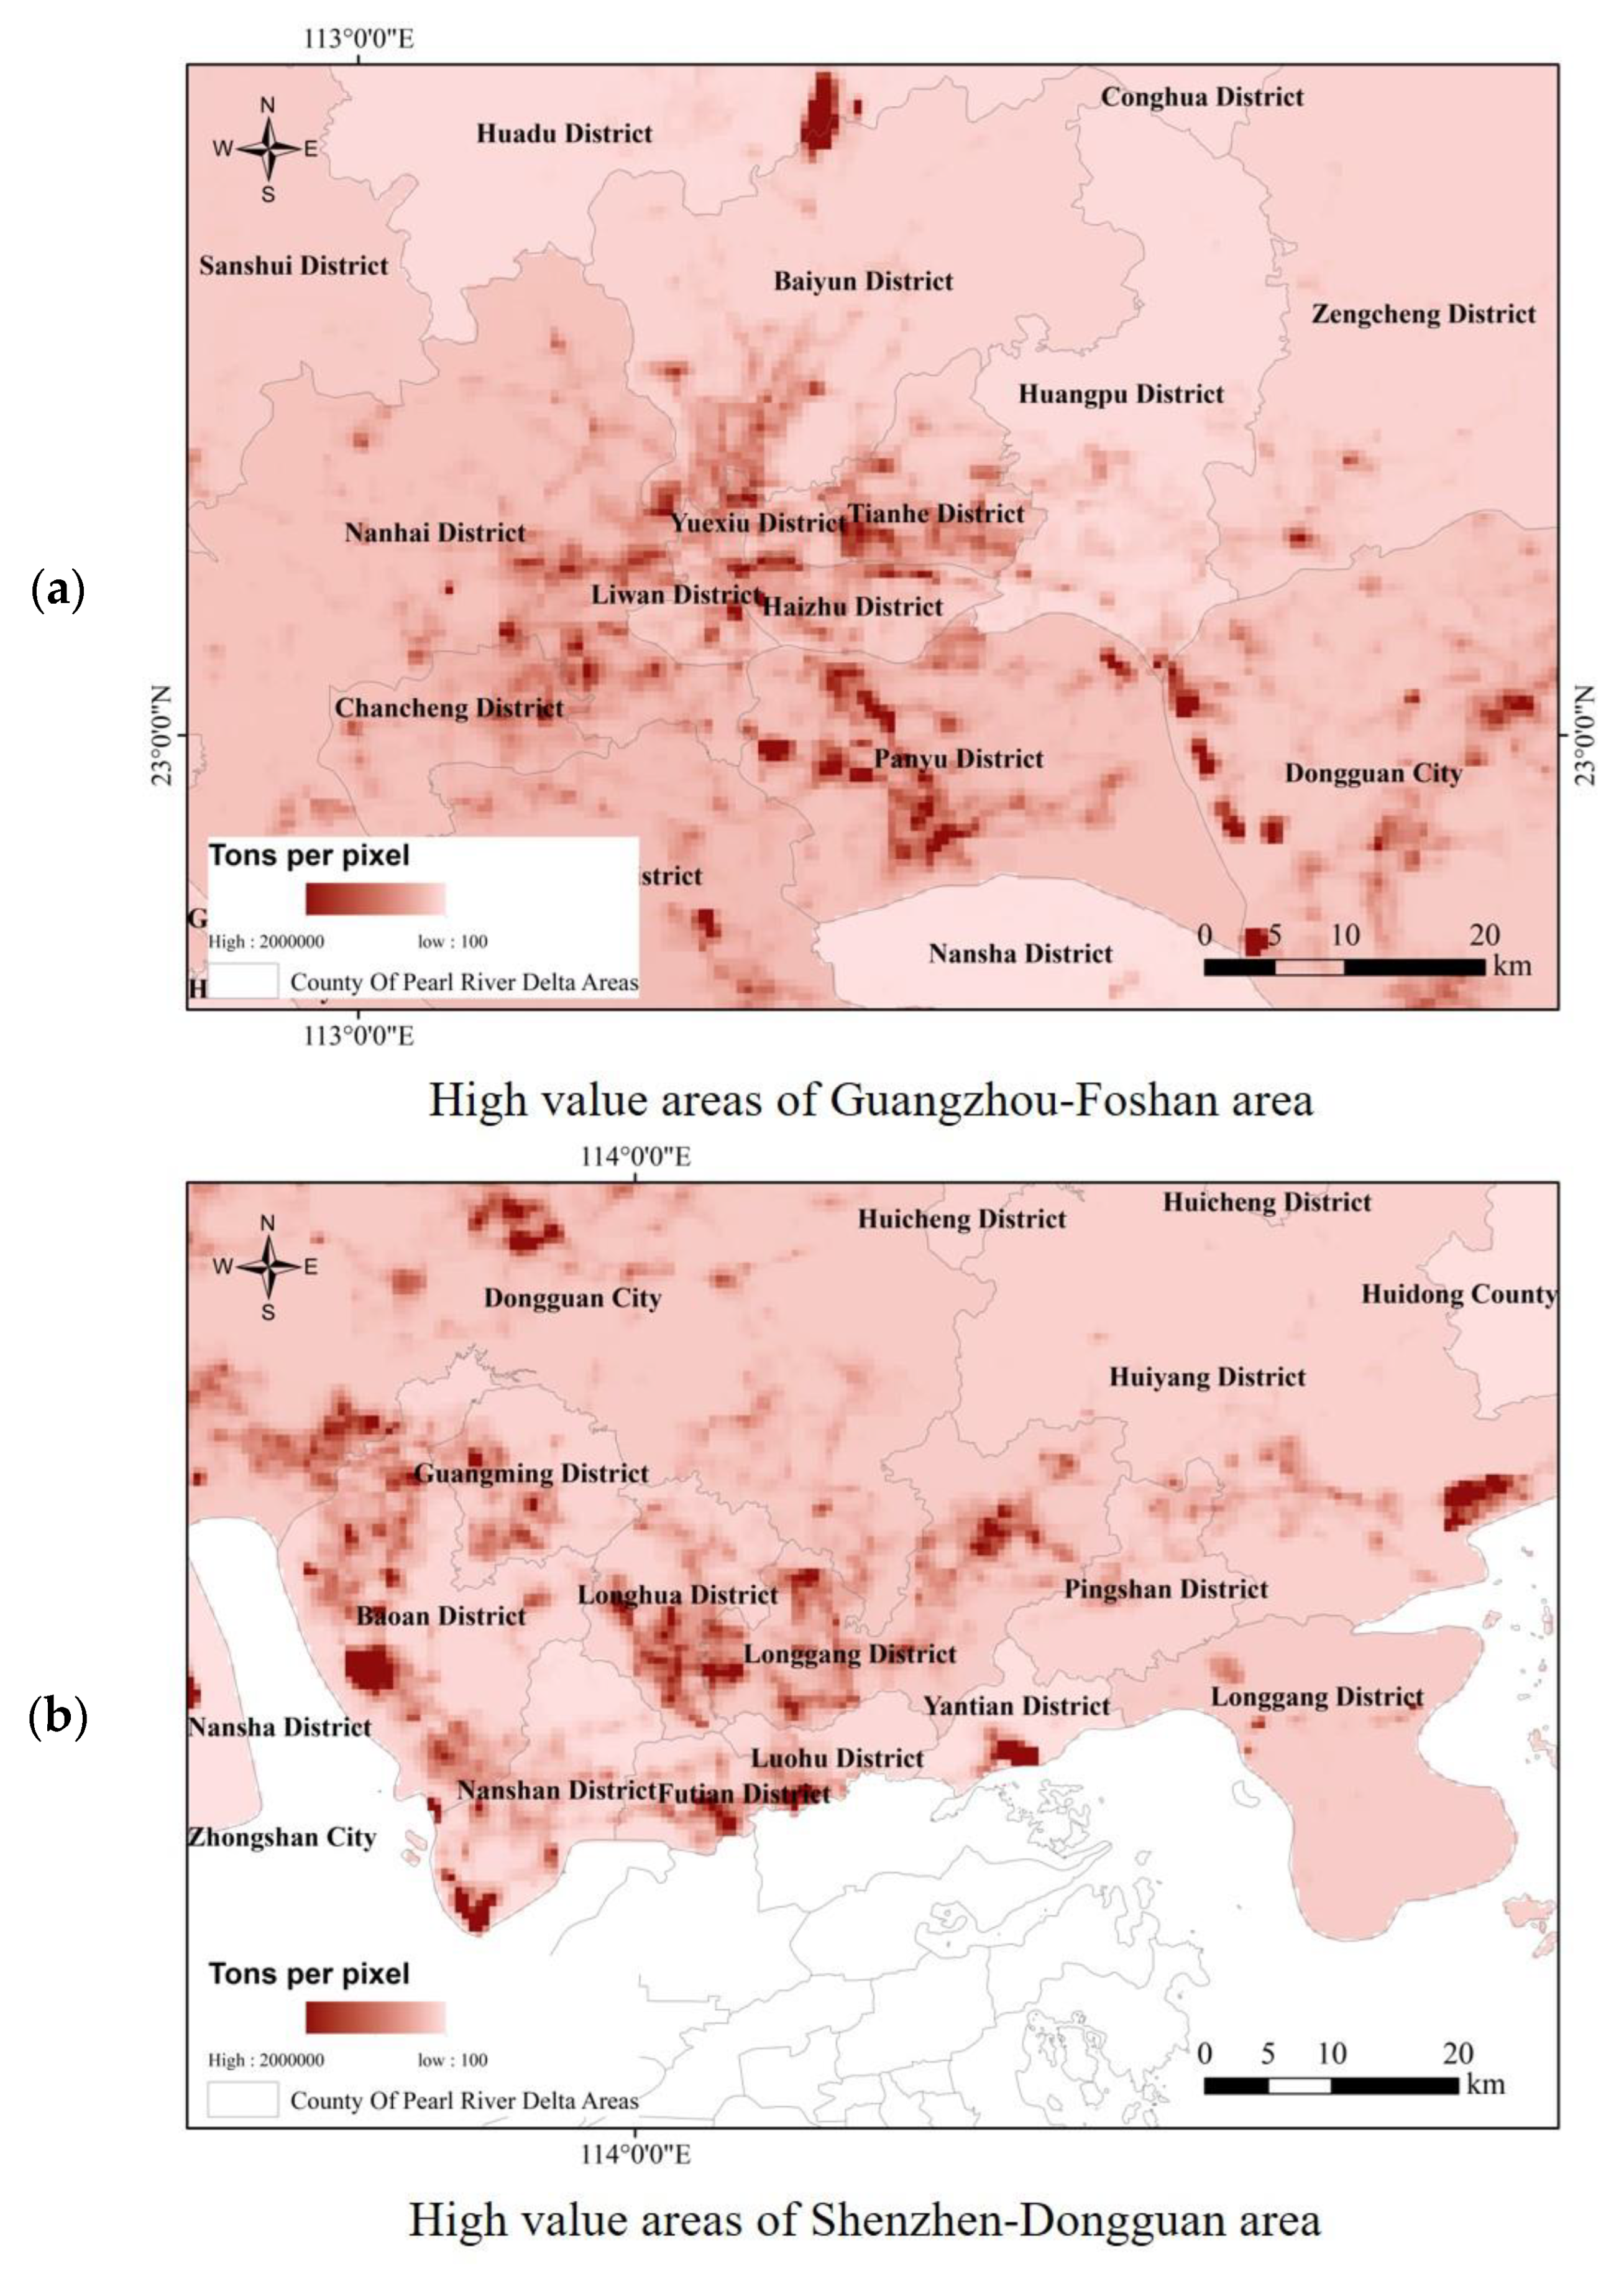
| CO2 Emission Level | Guangzhou–Foshan | Shenzhen–Dongguan | ||||
|---|---|---|---|---|---|---|
| Area (m2) | Number of Pixels | Percentage (%) | Area (m2) | Number of Pixels | Percentage (%) | |
| High (>20,000 tons/ppx) | 97,500 | 195 | 0.44 | 158,000 | 316 | 1.72 |
| Medium (10,000–20,000 tons/ppx) | 246,000 | 492 | 1.1 | 336,500 | 673 | 3.67 |
| Relatively Low (5000–10,000 tons/ppx) | 1,335,500 | 2671 | 5.98 | 1,329,500 | 2659 | 14.49 |
| Low (2000–5000 tons/ppx) | 6,574,000 | 13,148 | 29.42 | 6,002,000 | 12,004 | 65.42 |
| Very Low (<2000 tons/ppx) | 14,094,000 | 28,188 | 63.06 | 1,349,000 | 2698 | 14.7 |
Disclaimer/Publisher’s Note: The statements, opinions and data contained in all publications are solely those of the individual author(s) and contributor(s) and not of MDPI and/or the editor(s). MDPI and/or the editor(s) disclaim responsibility for any injury to people or property resulting from any ideas, methods, instructions or products referred to in the content. |
© 2022 by the authors. Licensee MDPI, Basel, Switzerland. This article is an open access article distributed under the terms and conditions of the Creative Commons Attribution (CC BY) license (https://creativecommons.org/licenses/by/4.0/).
Share and Cite
Yang, J.; Li, W.; Chen, J.; Sun, C. Refined Carbon Emission Measurement Based on NPP-VIIRS Nighttime Light Data: A Case Study of the Pearl River Delta Region, China. Sensors 2023, 23, 191. https://doi.org/10.3390/s23010191
Yang J, Li W, Chen J, Sun C. Refined Carbon Emission Measurement Based on NPP-VIIRS Nighttime Light Data: A Case Study of the Pearl River Delta Region, China. Sensors. 2023; 23(1):191. https://doi.org/10.3390/s23010191
Chicago/Turabian StyleYang, Jian, Weihong Li, Jieying Chen, and Caige Sun. 2023. "Refined Carbon Emission Measurement Based on NPP-VIIRS Nighttime Light Data: A Case Study of the Pearl River Delta Region, China" Sensors 23, no. 1: 191. https://doi.org/10.3390/s23010191
APA StyleYang, J., Li, W., Chen, J., & Sun, C. (2023). Refined Carbon Emission Measurement Based on NPP-VIIRS Nighttime Light Data: A Case Study of the Pearl River Delta Region, China. Sensors, 23(1), 191. https://doi.org/10.3390/s23010191