
Detection of Interlayered Illite/Smectite Clay Minerals with XRD, SEM Analyses and Reflectance Spectroscopy


 , ,
, ,  and
and 
Abstract
:1. Introduction
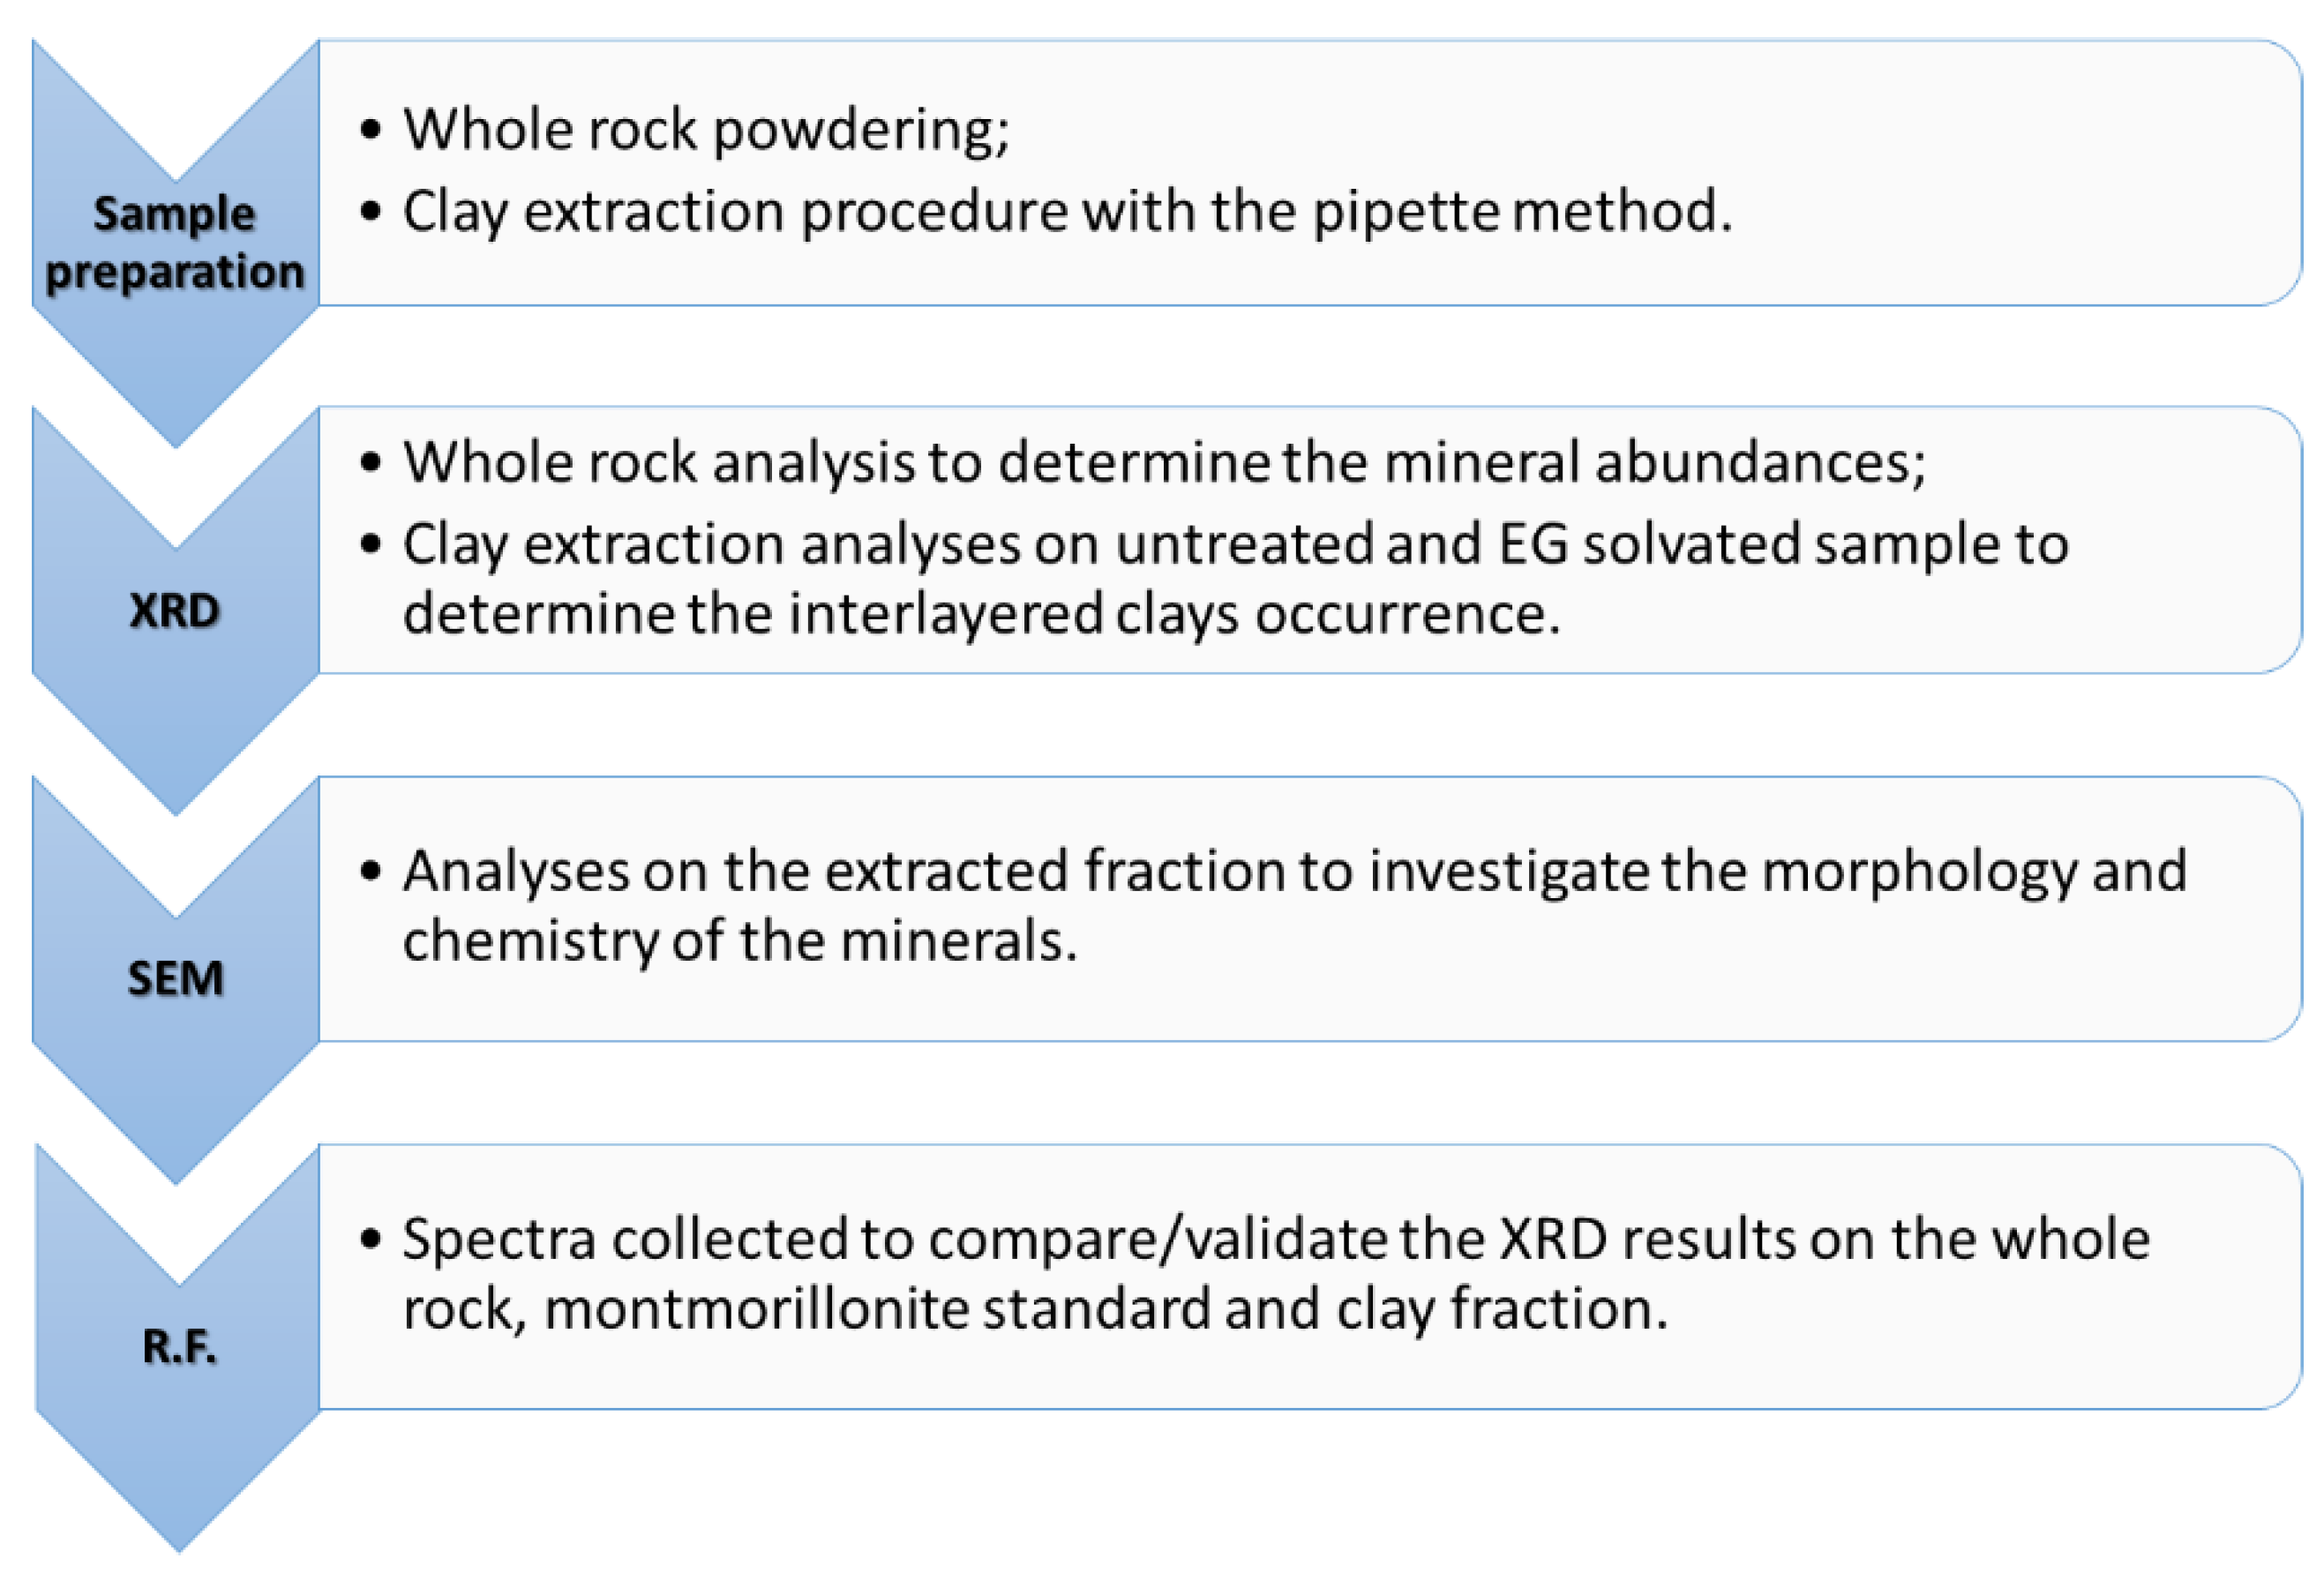
2. Methods
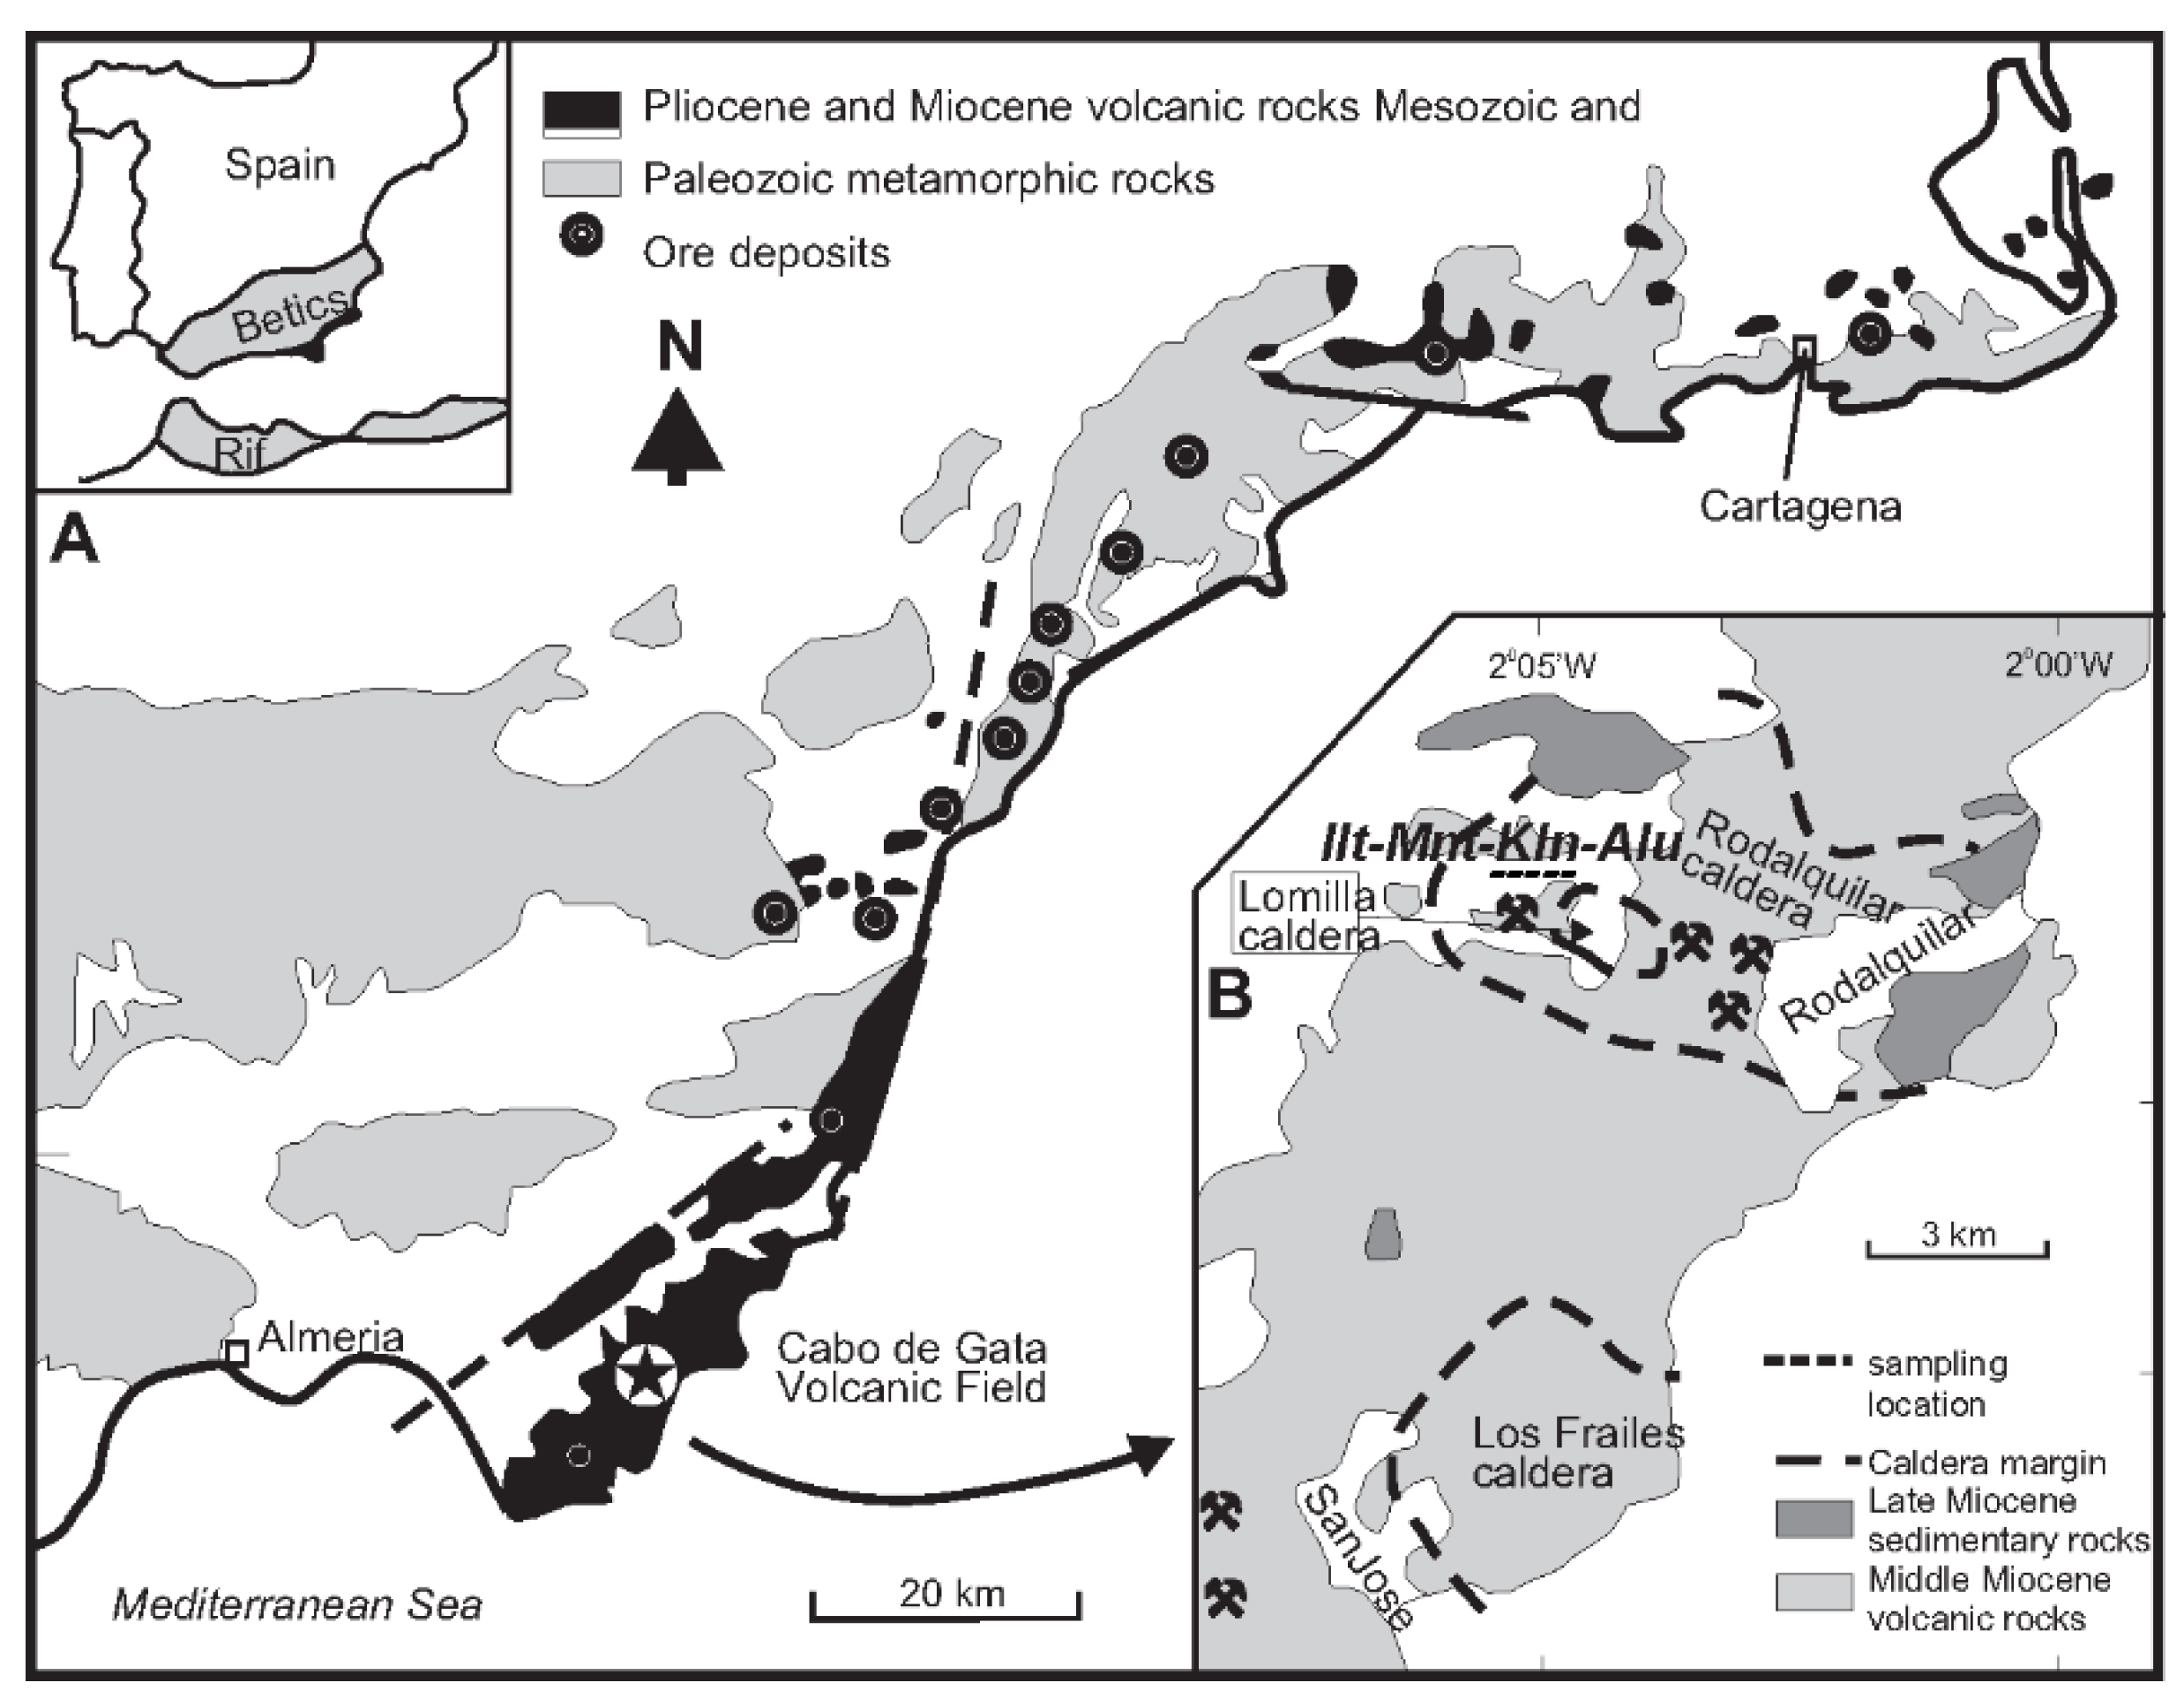
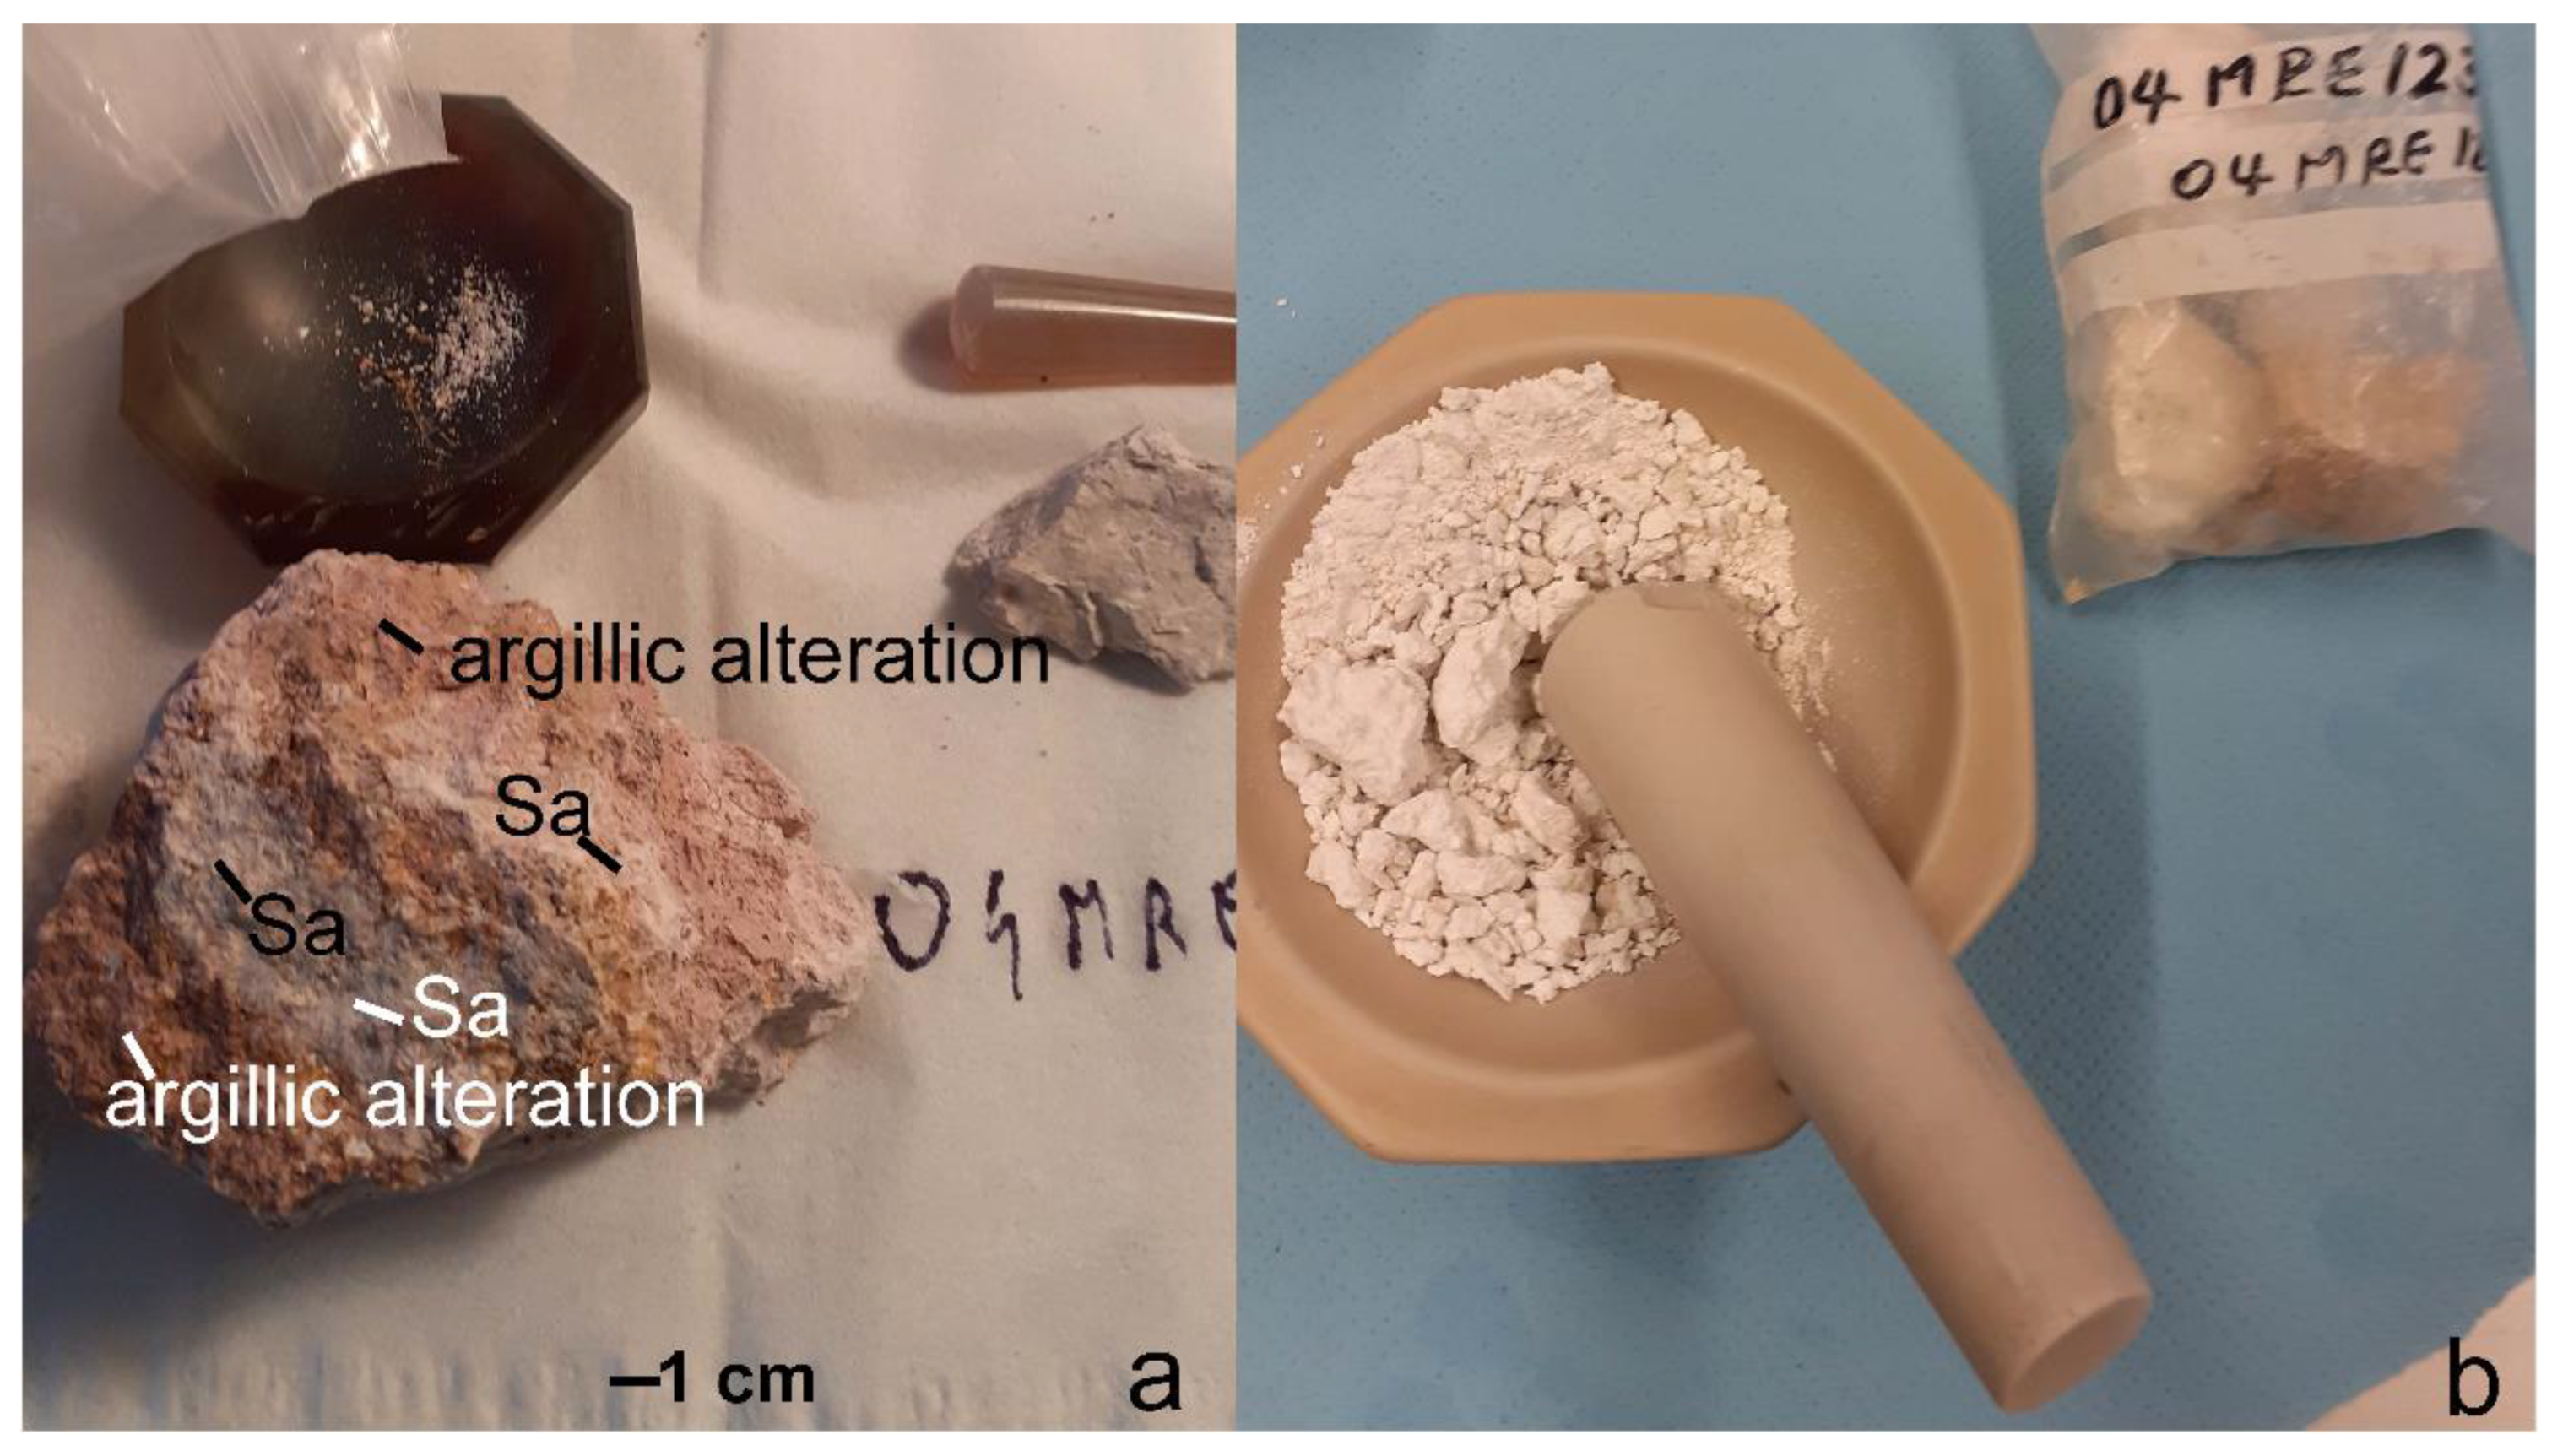
2.1. Provenance, Sample Description and Preparation
2.2. X-ray Diffraction (XRD)
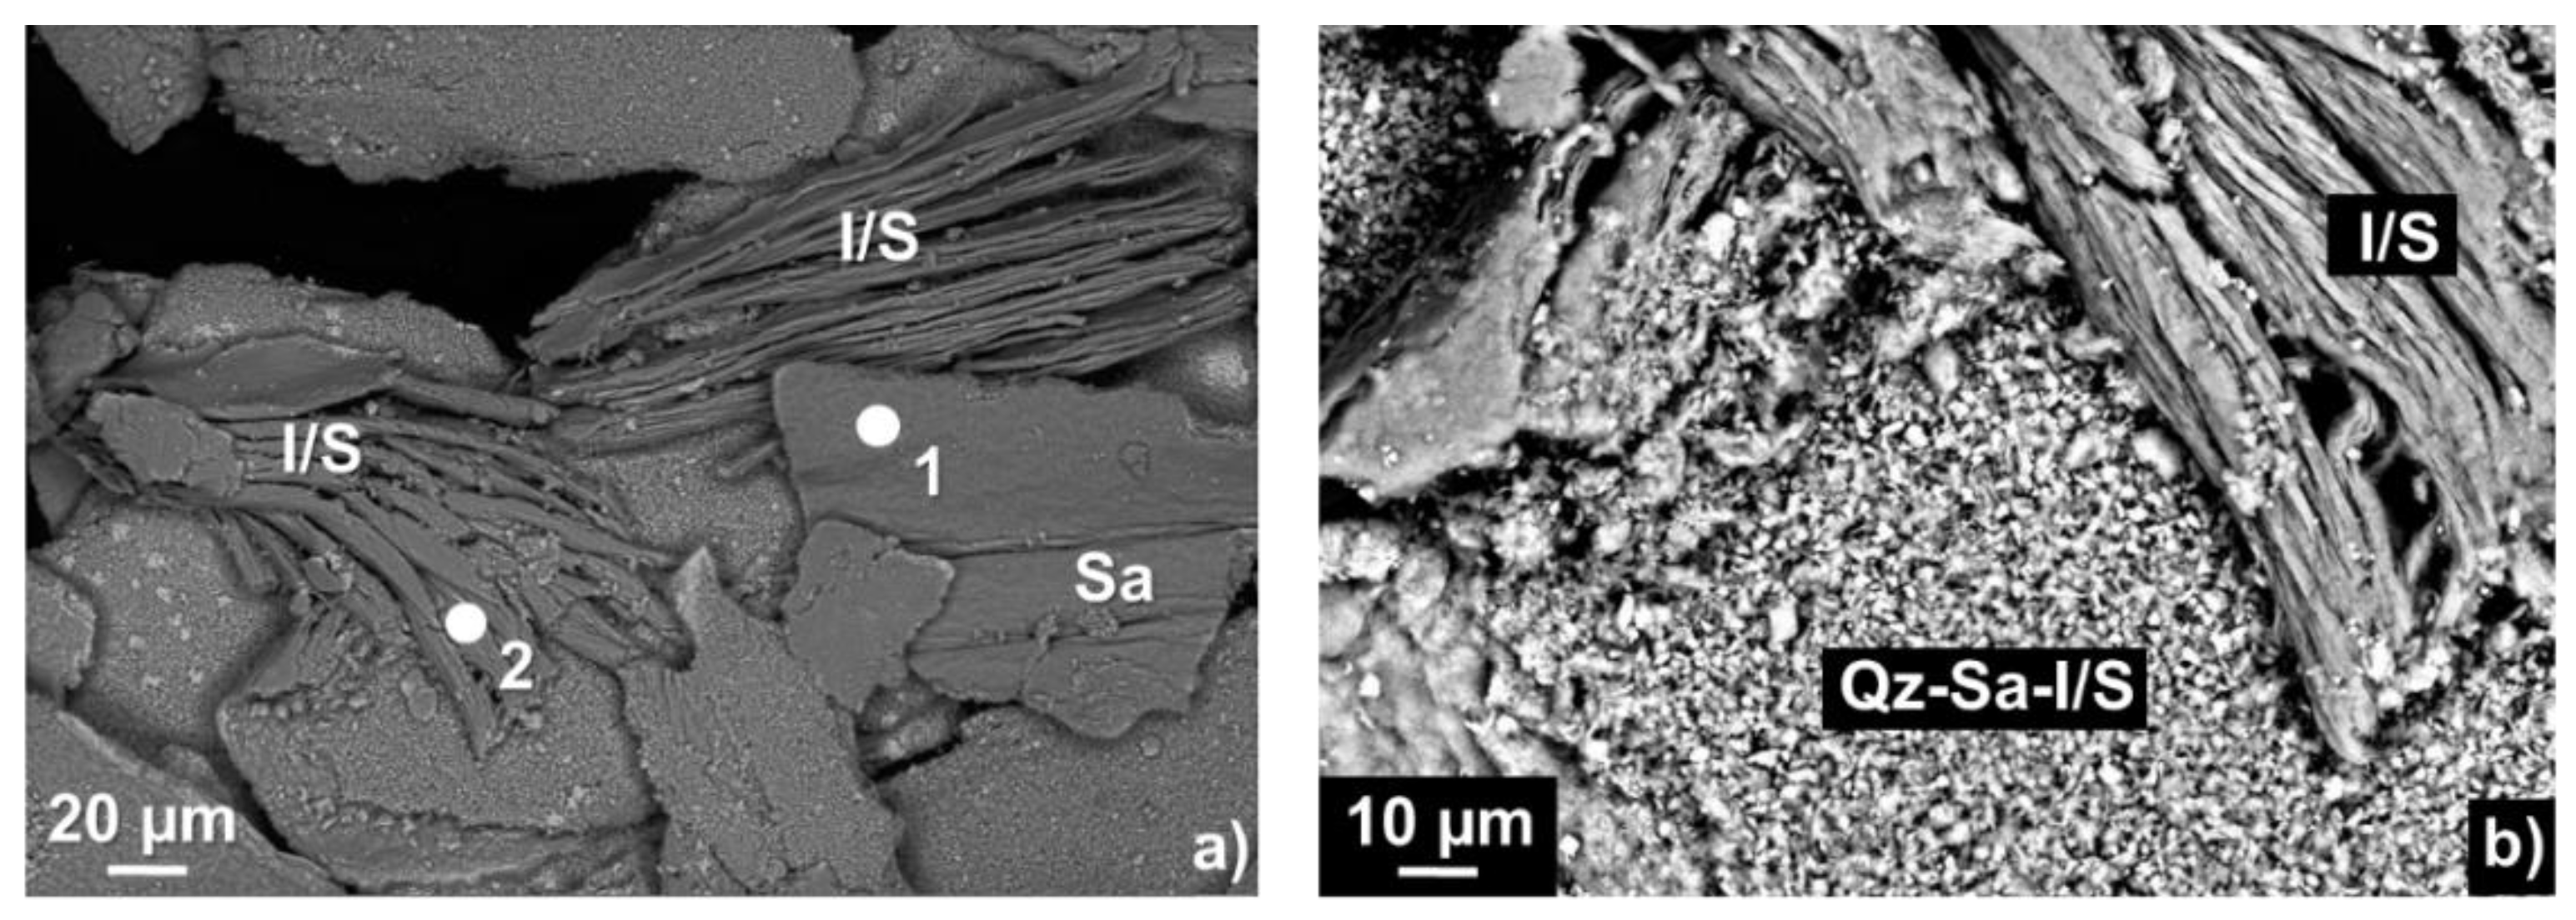
2.3. Scanning Electron Microscope (SEM)
2.4. Reflectance Spectroscopy
3. Results
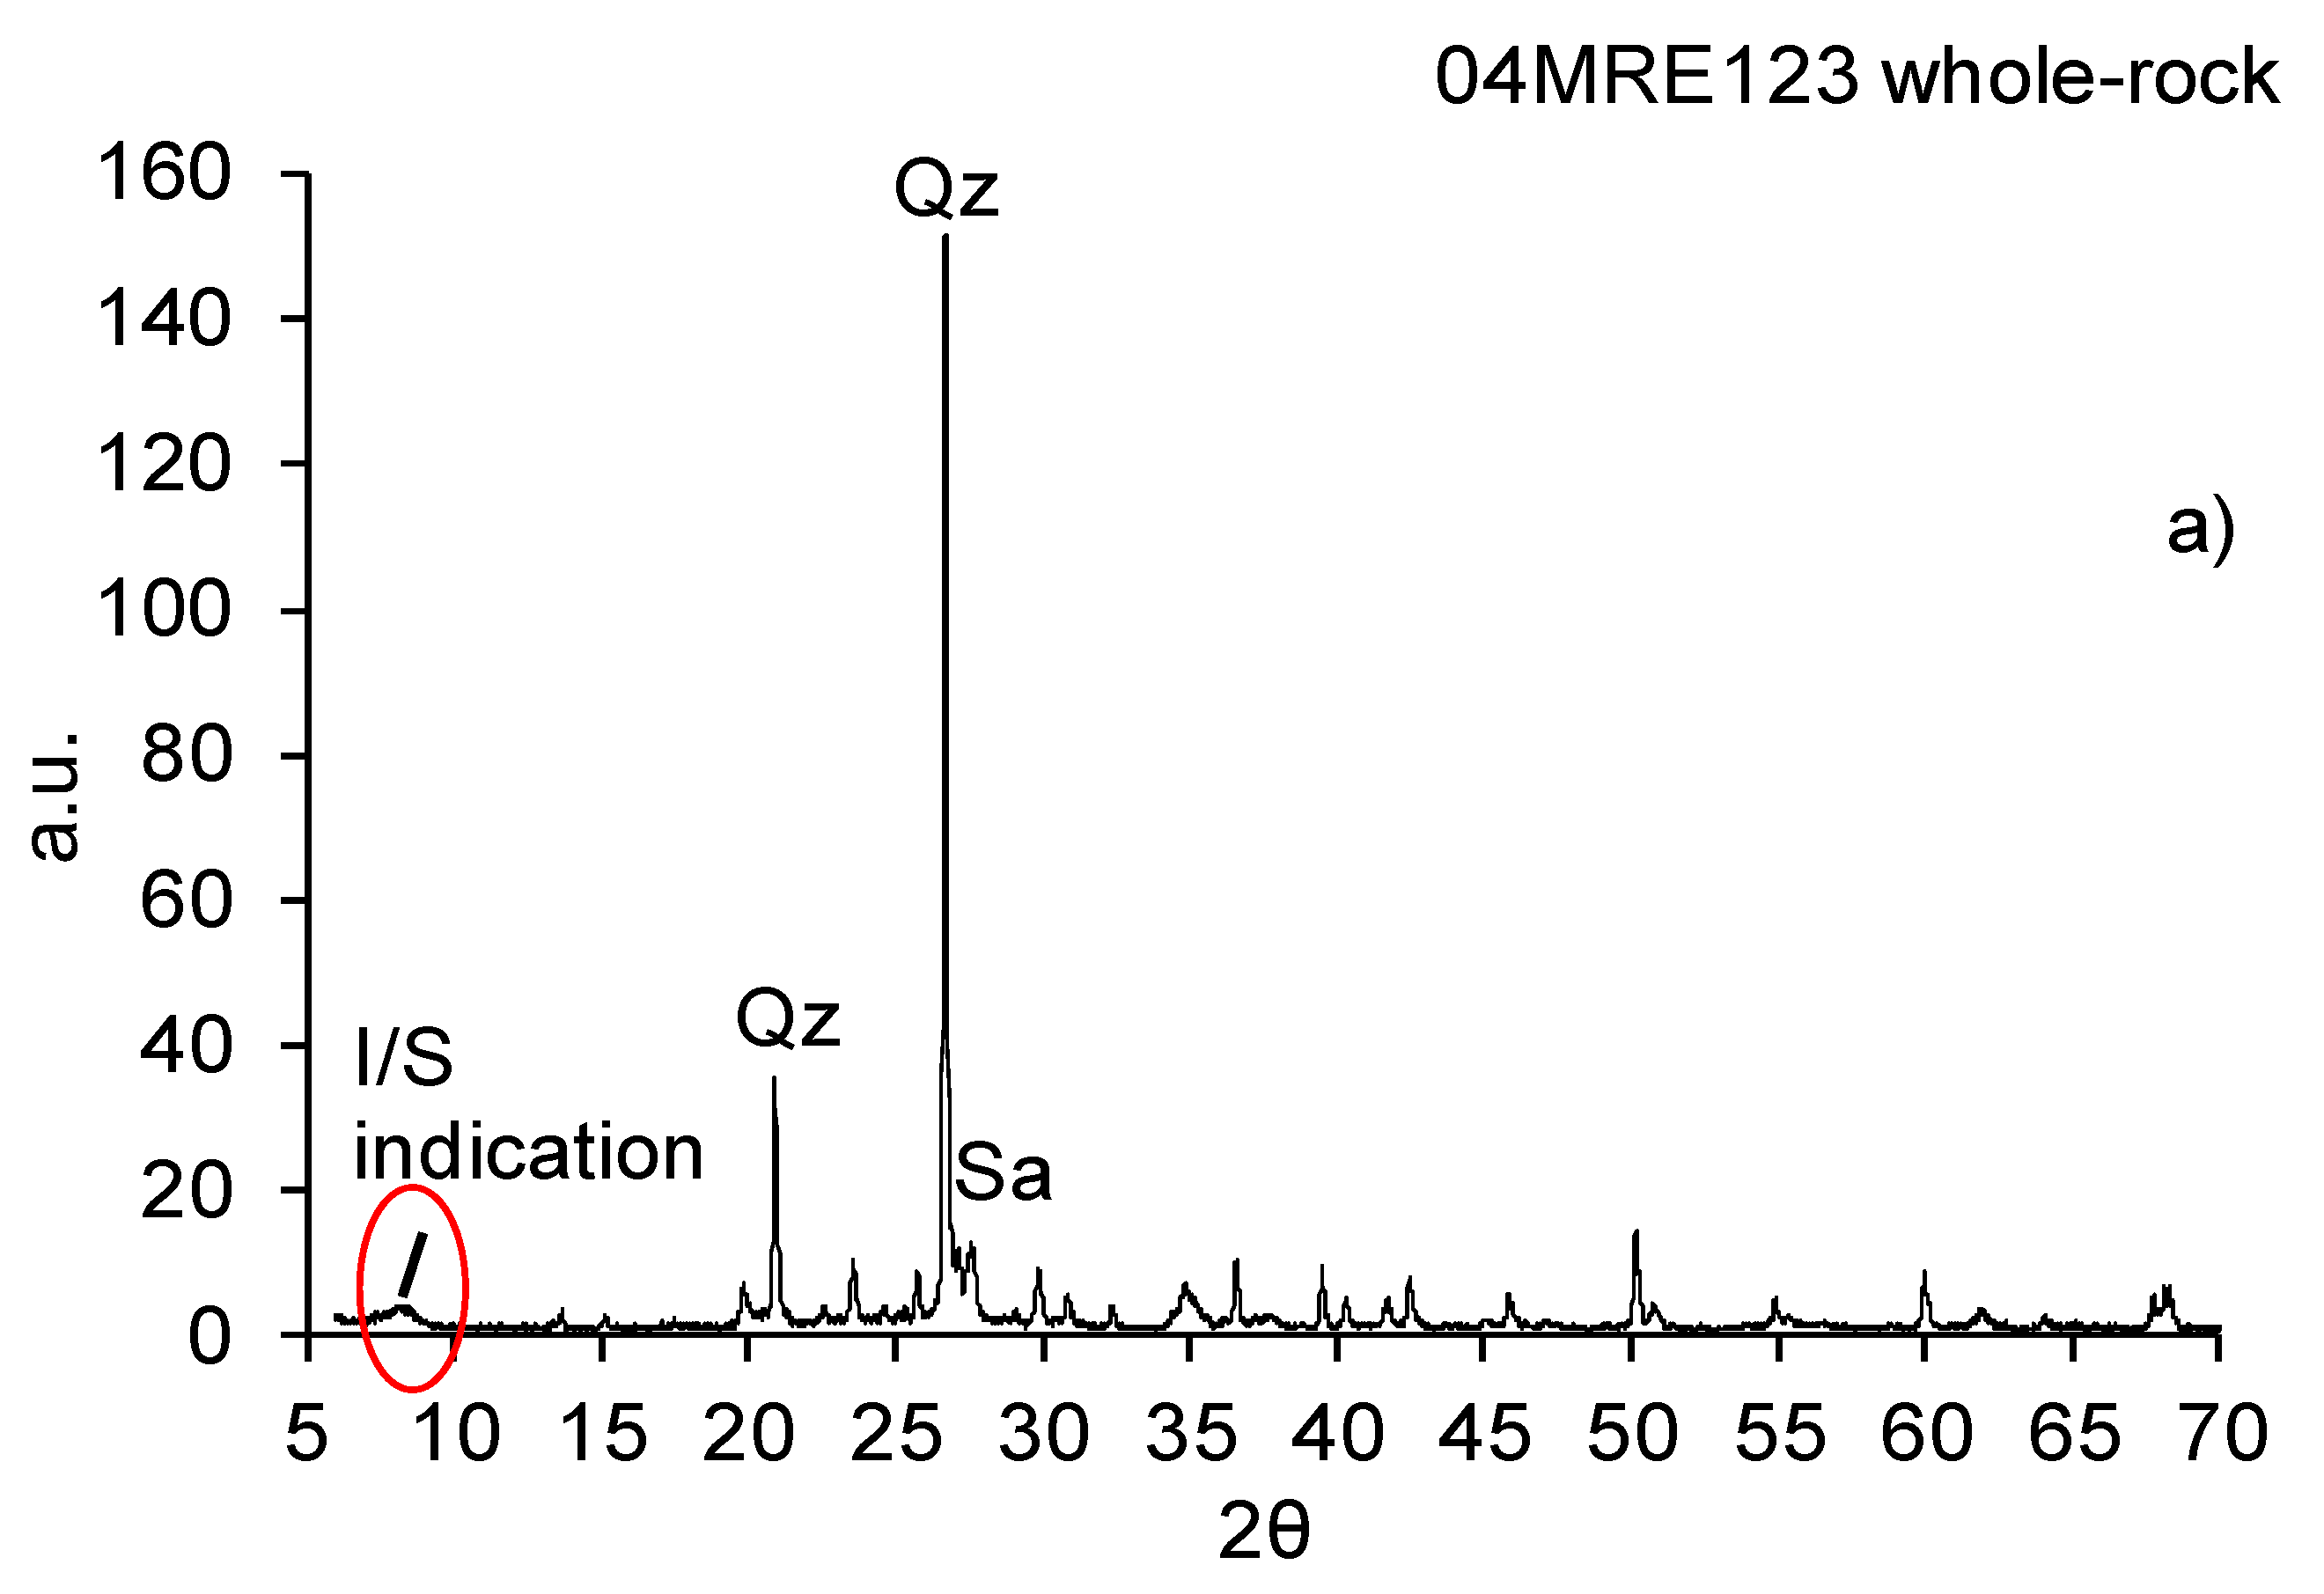
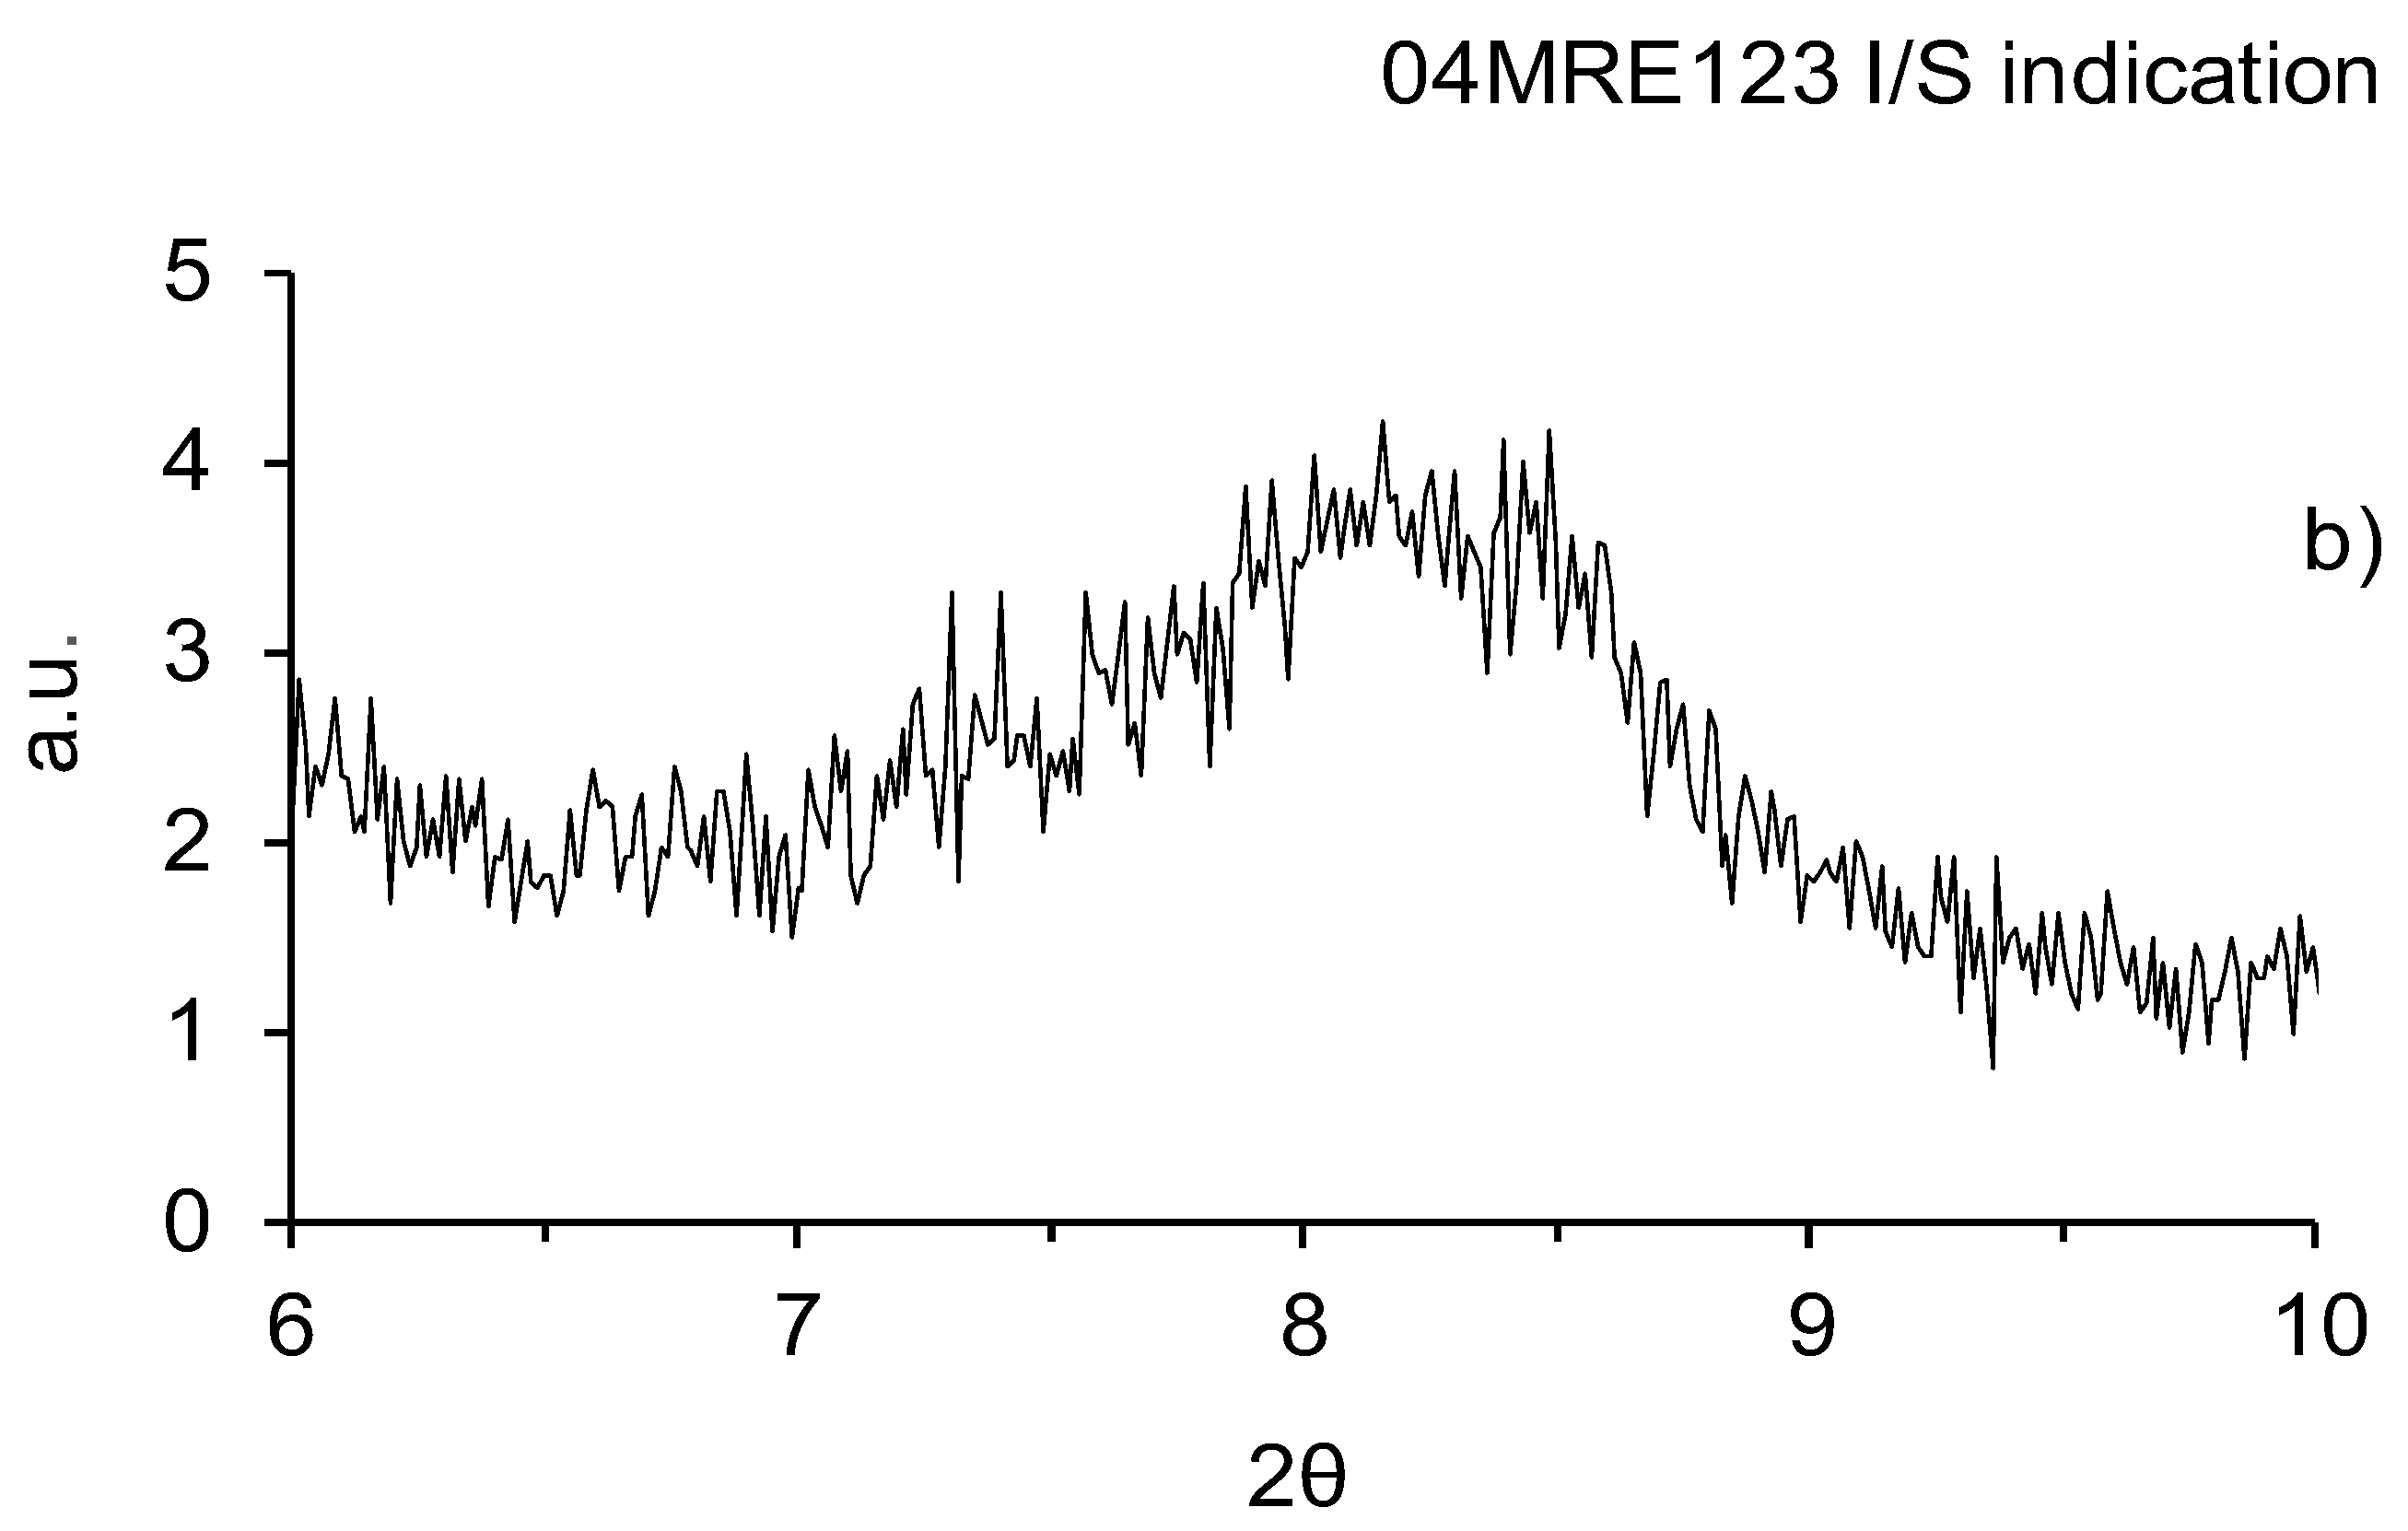
3.1. X-ray Diffraction Whole-Rock
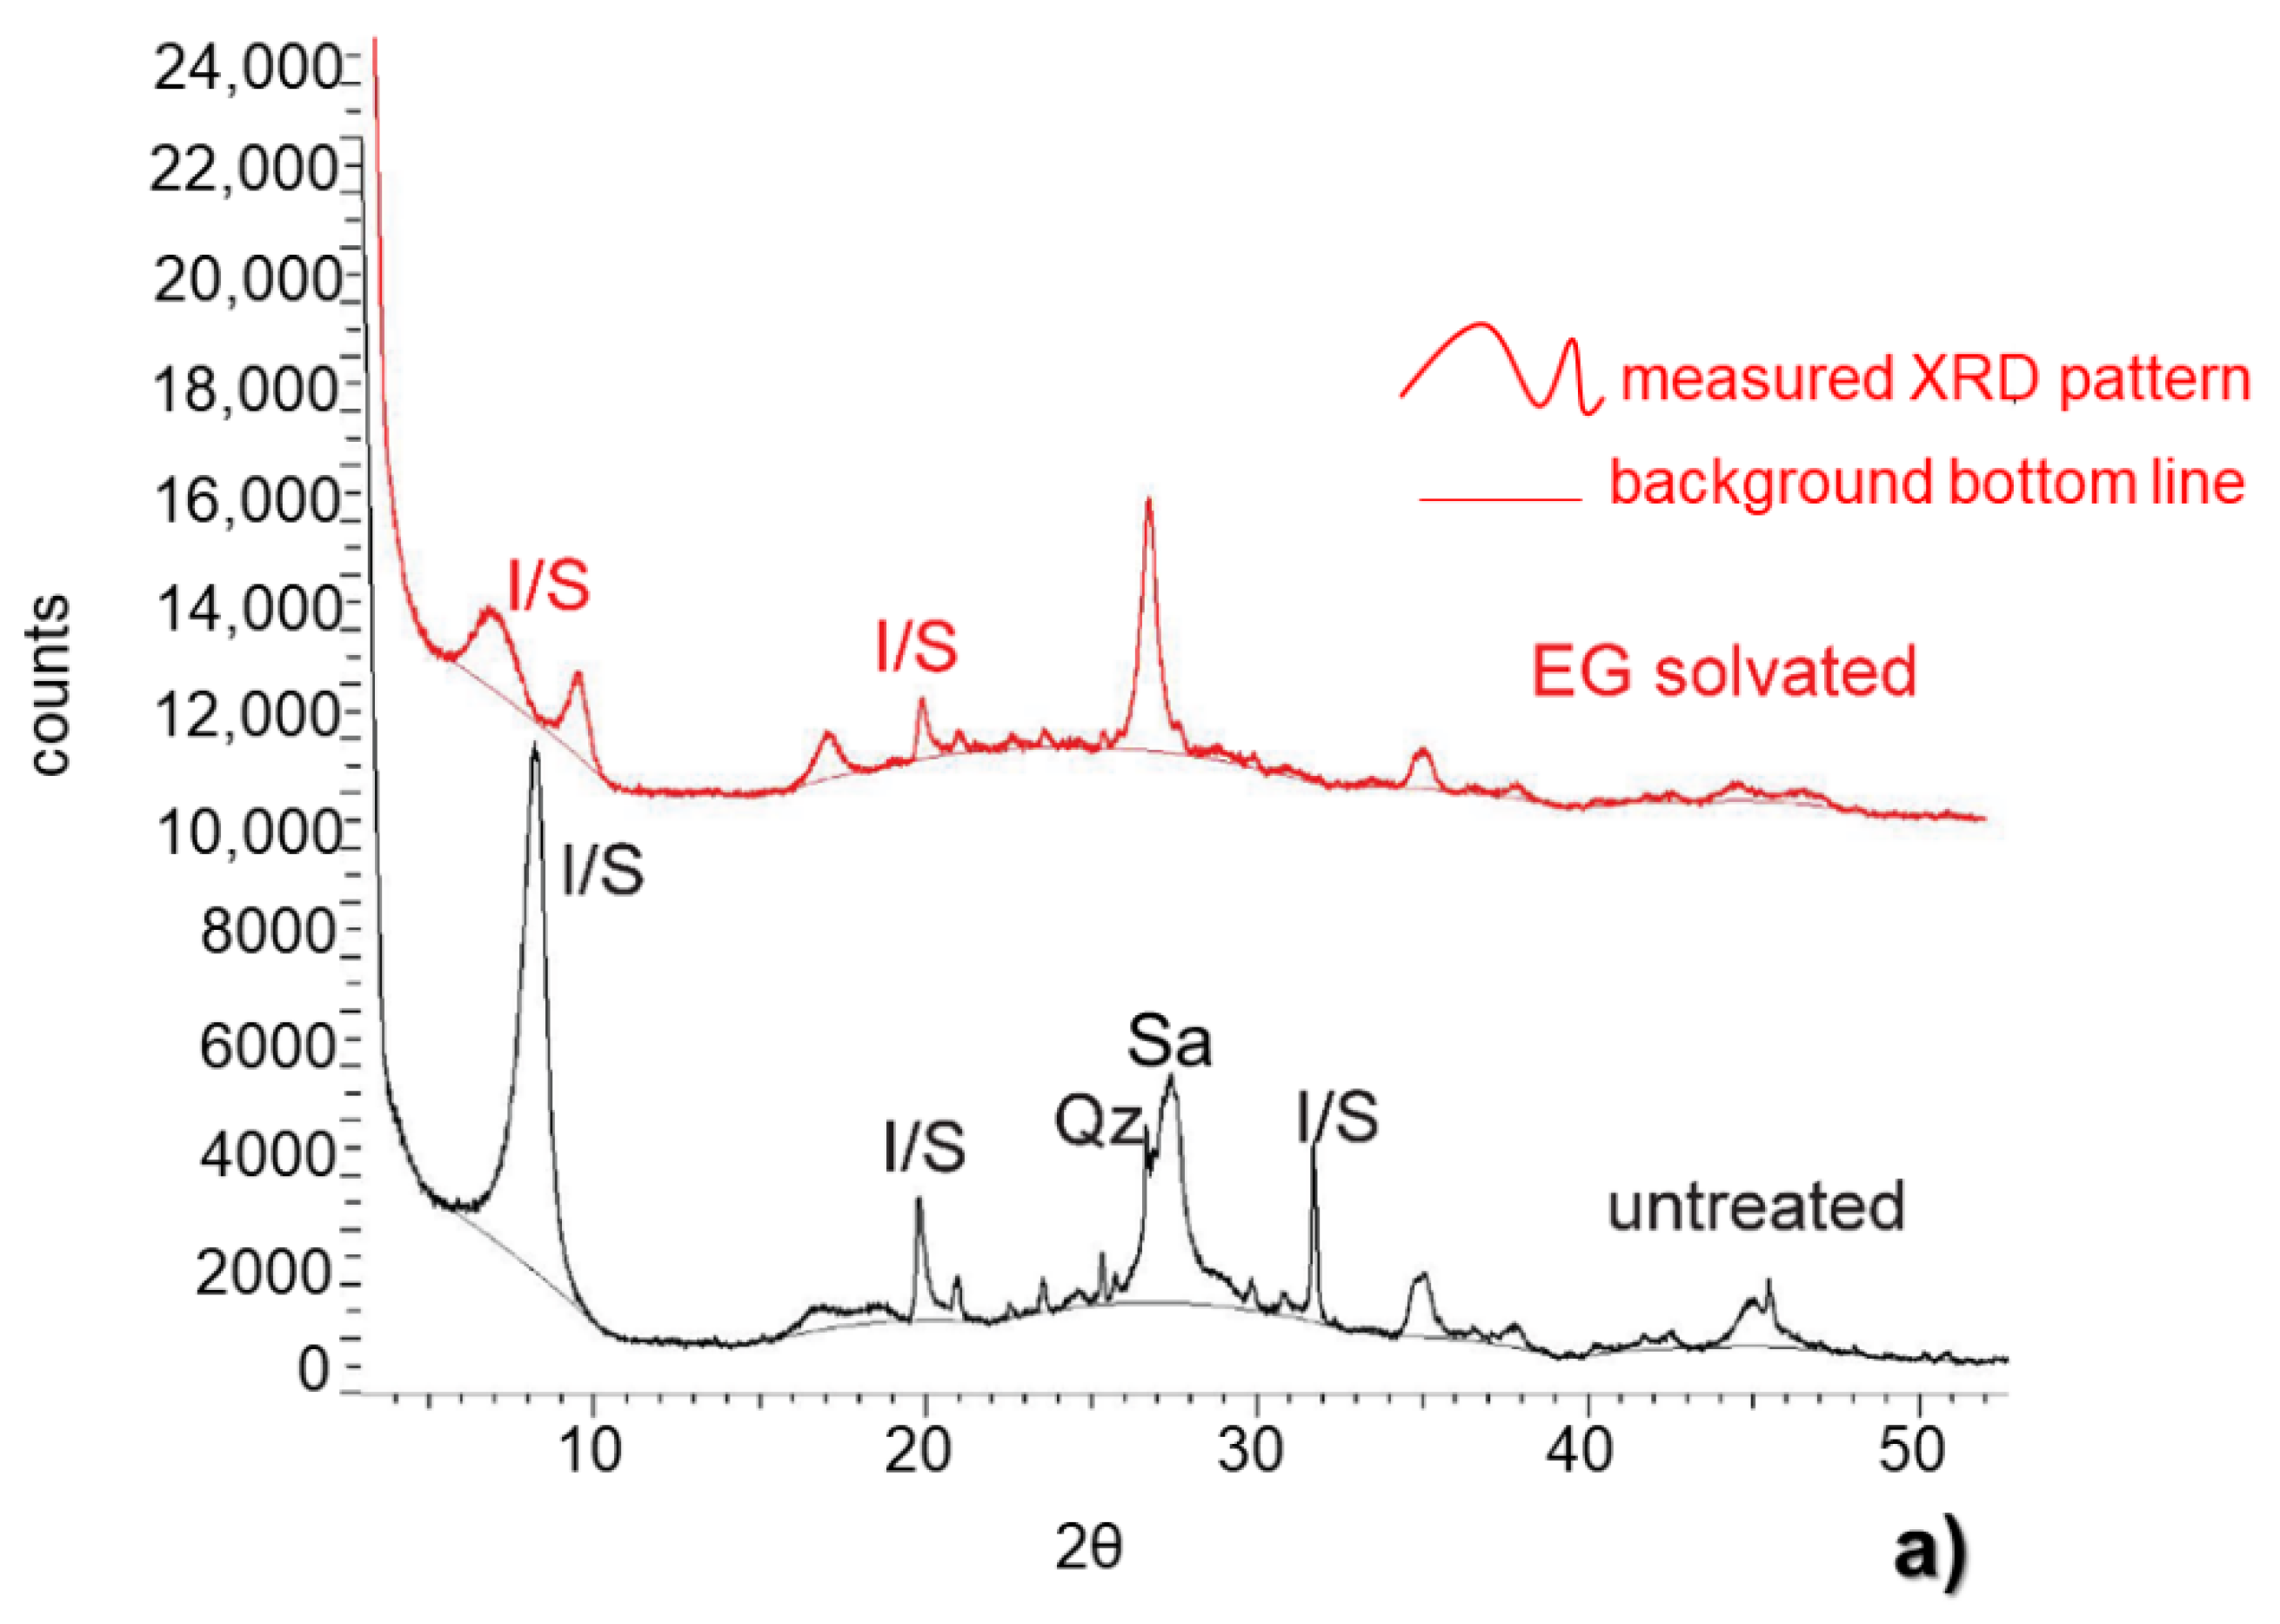
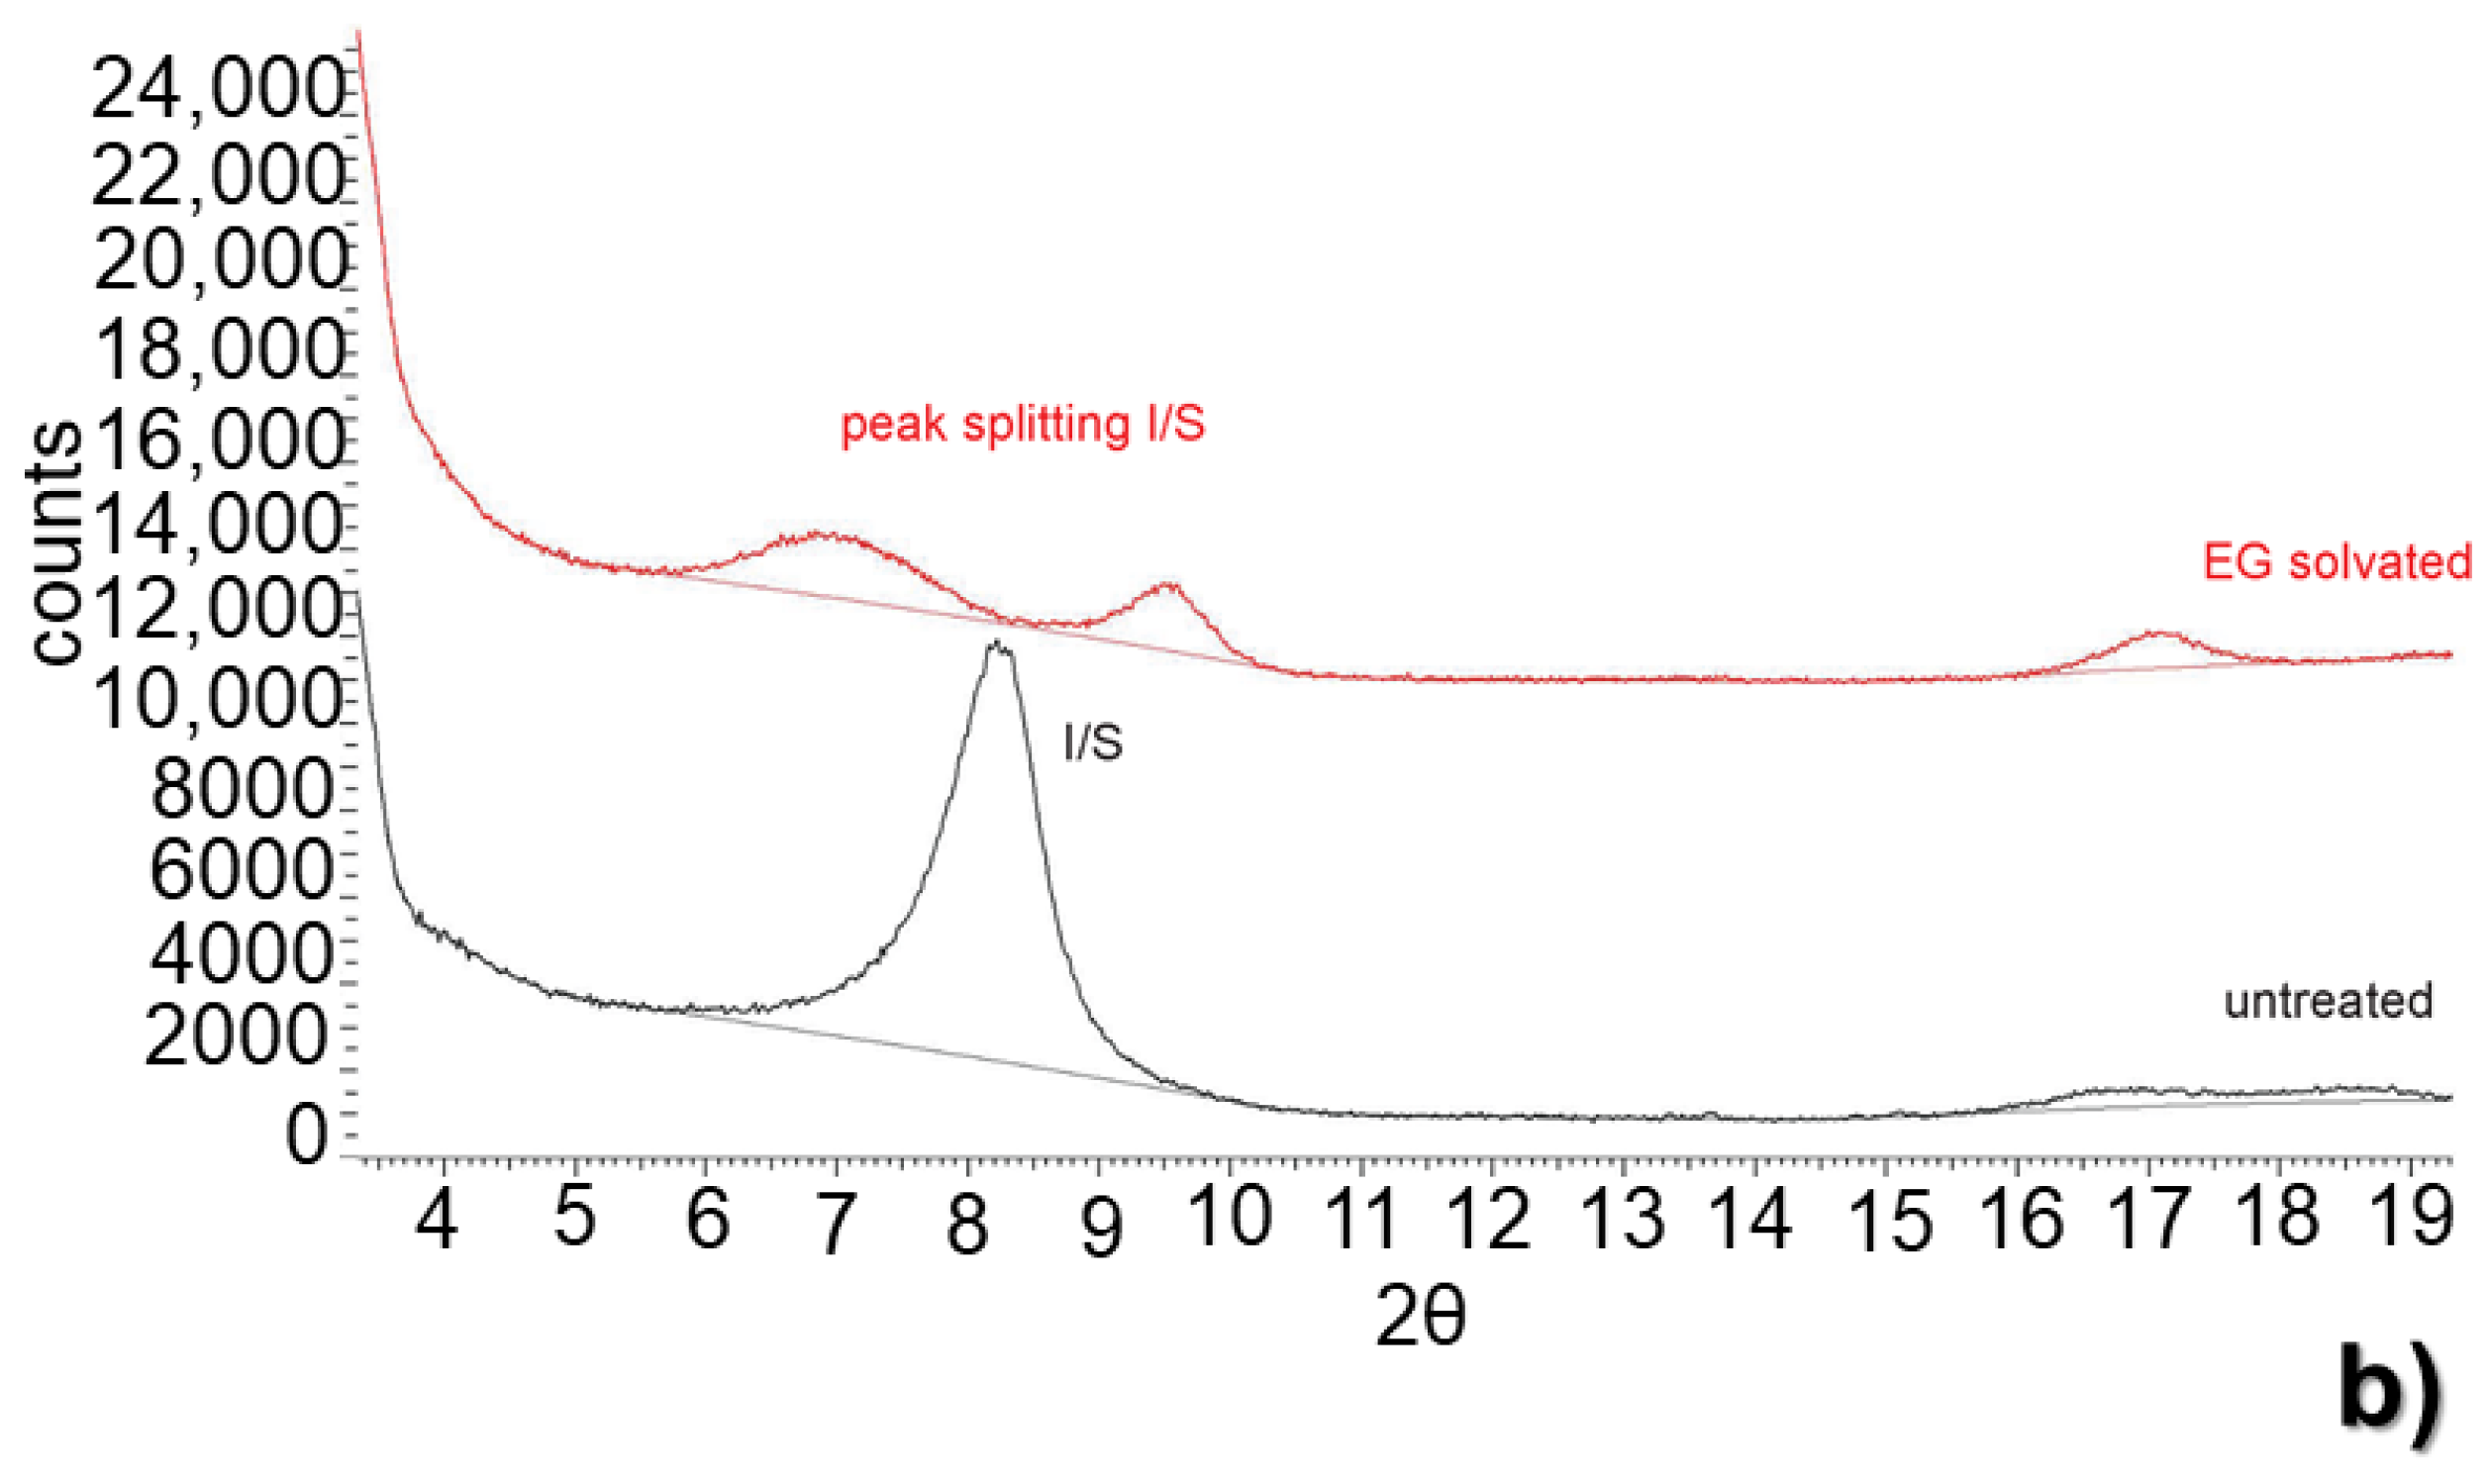
3.2. X-ray Diffraction Clay Fraction
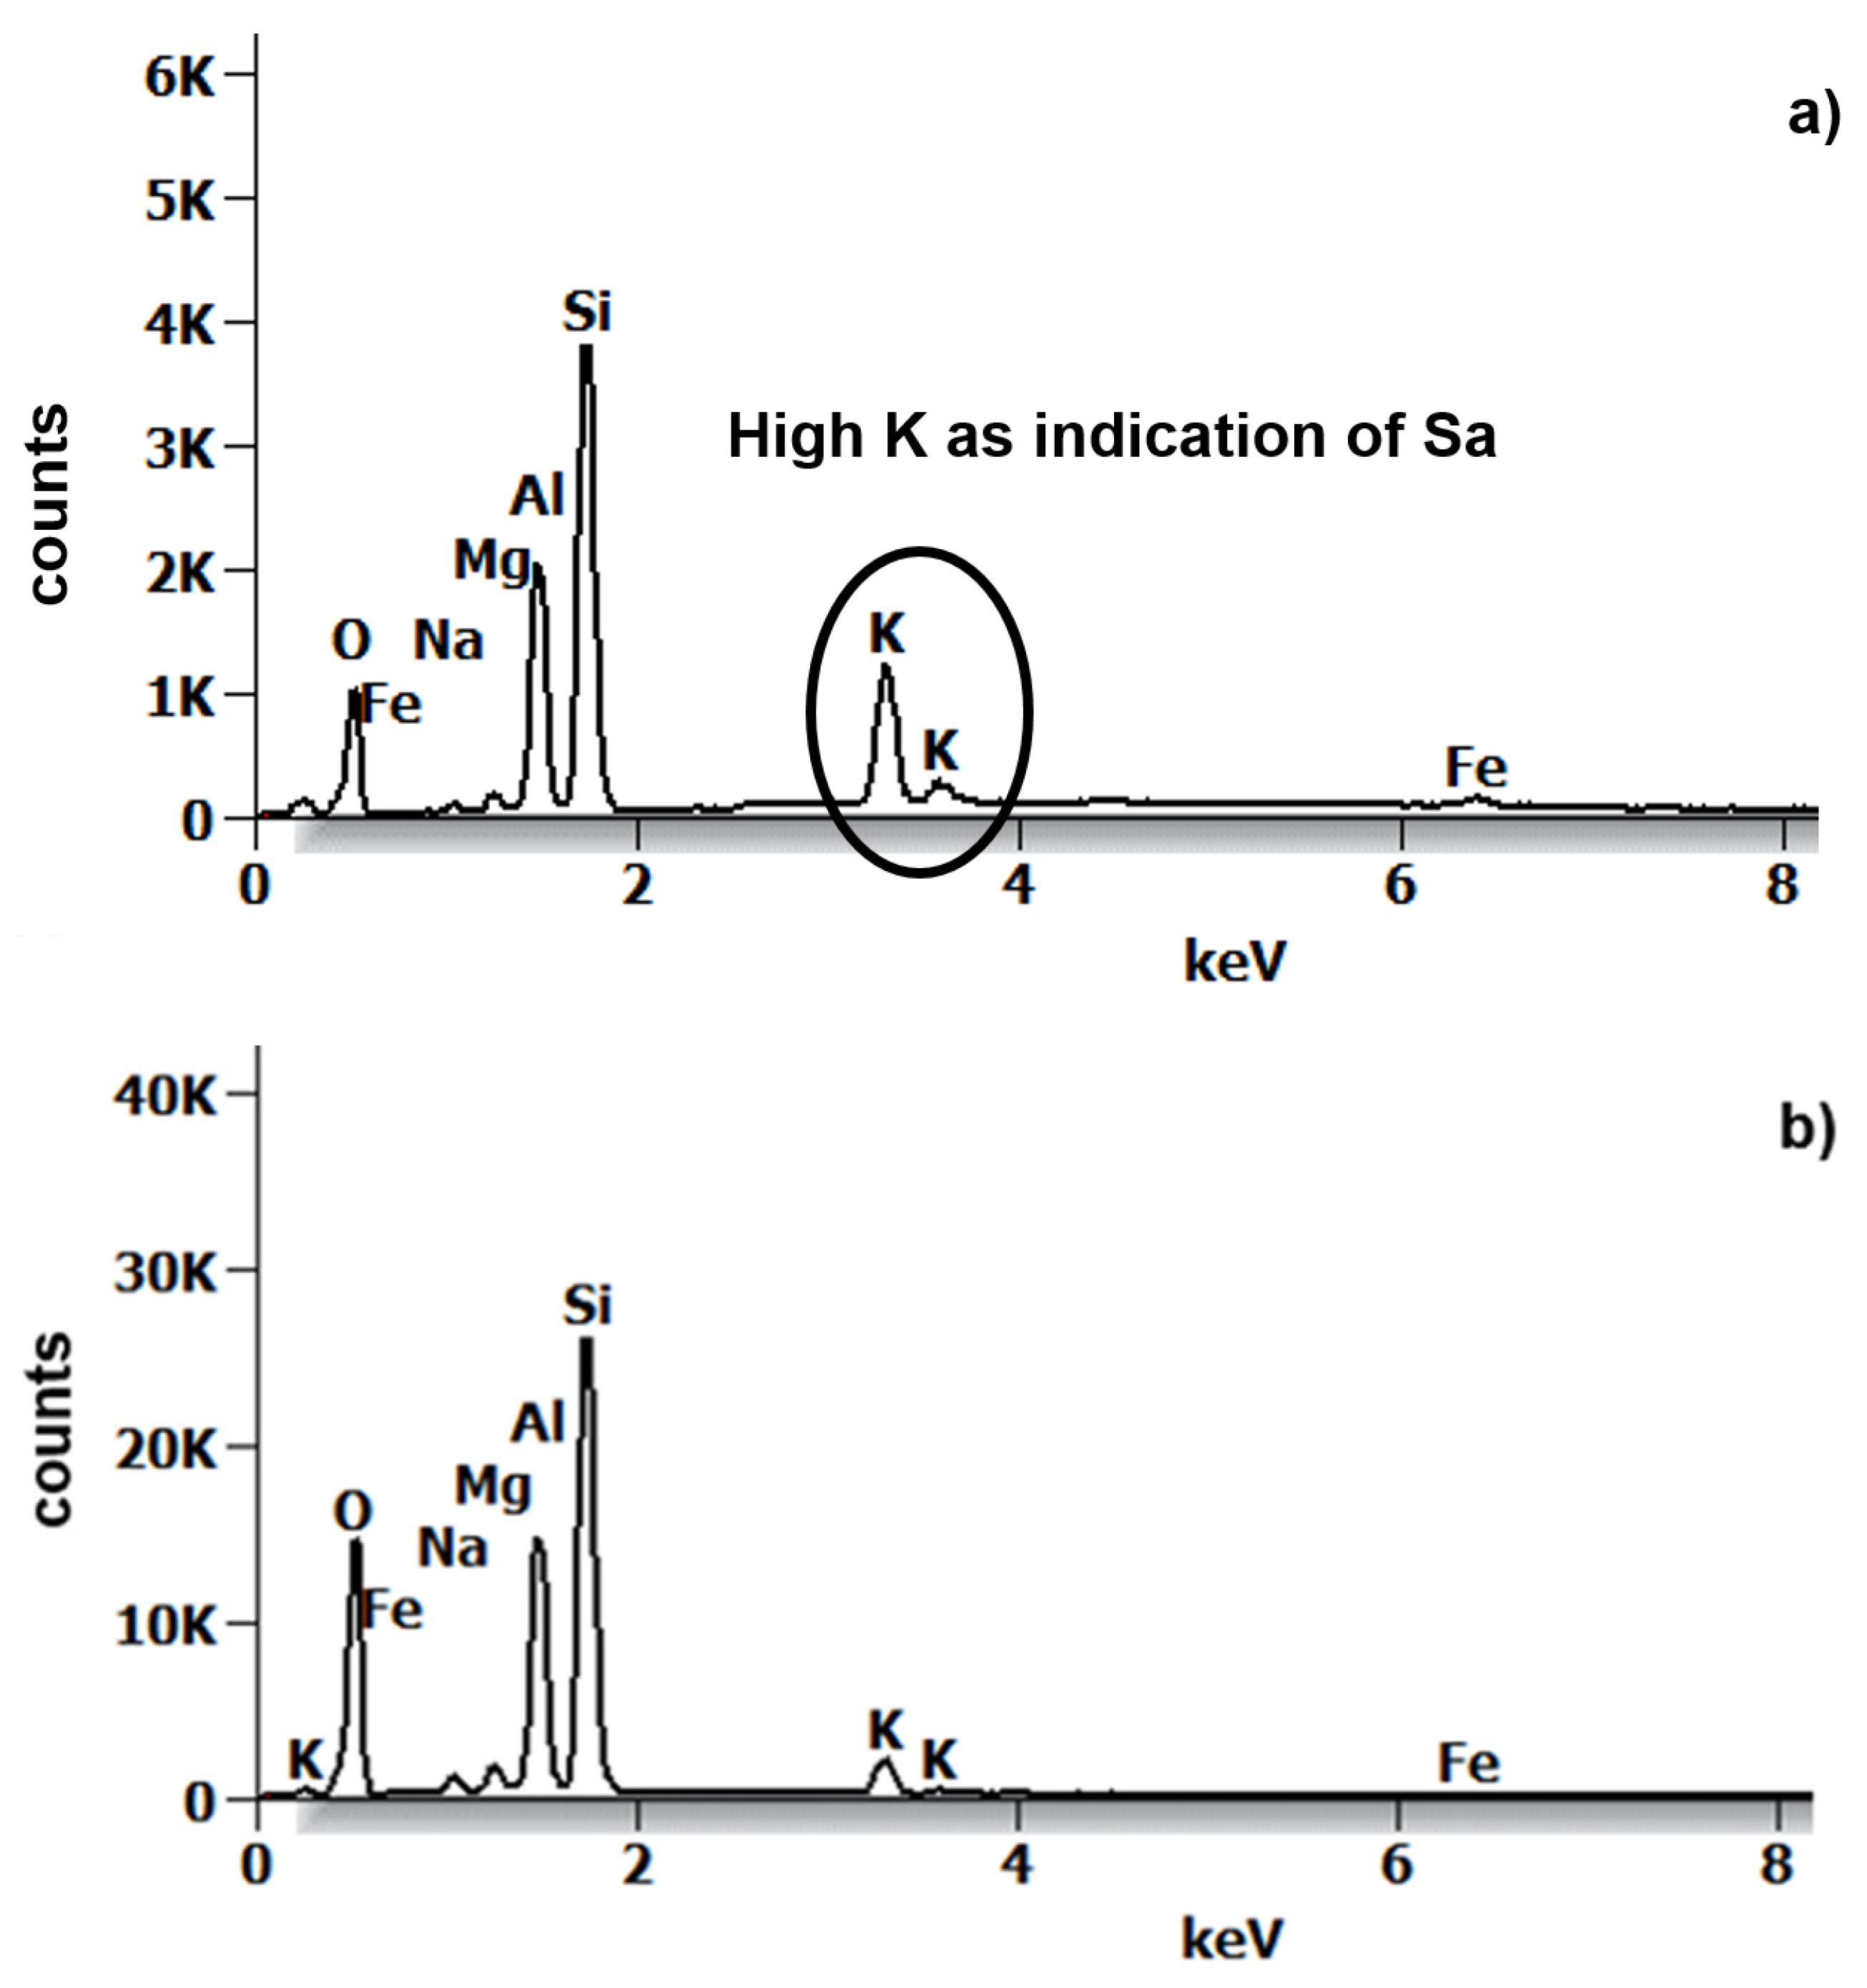
3.3. Scanned Electron Microscopy
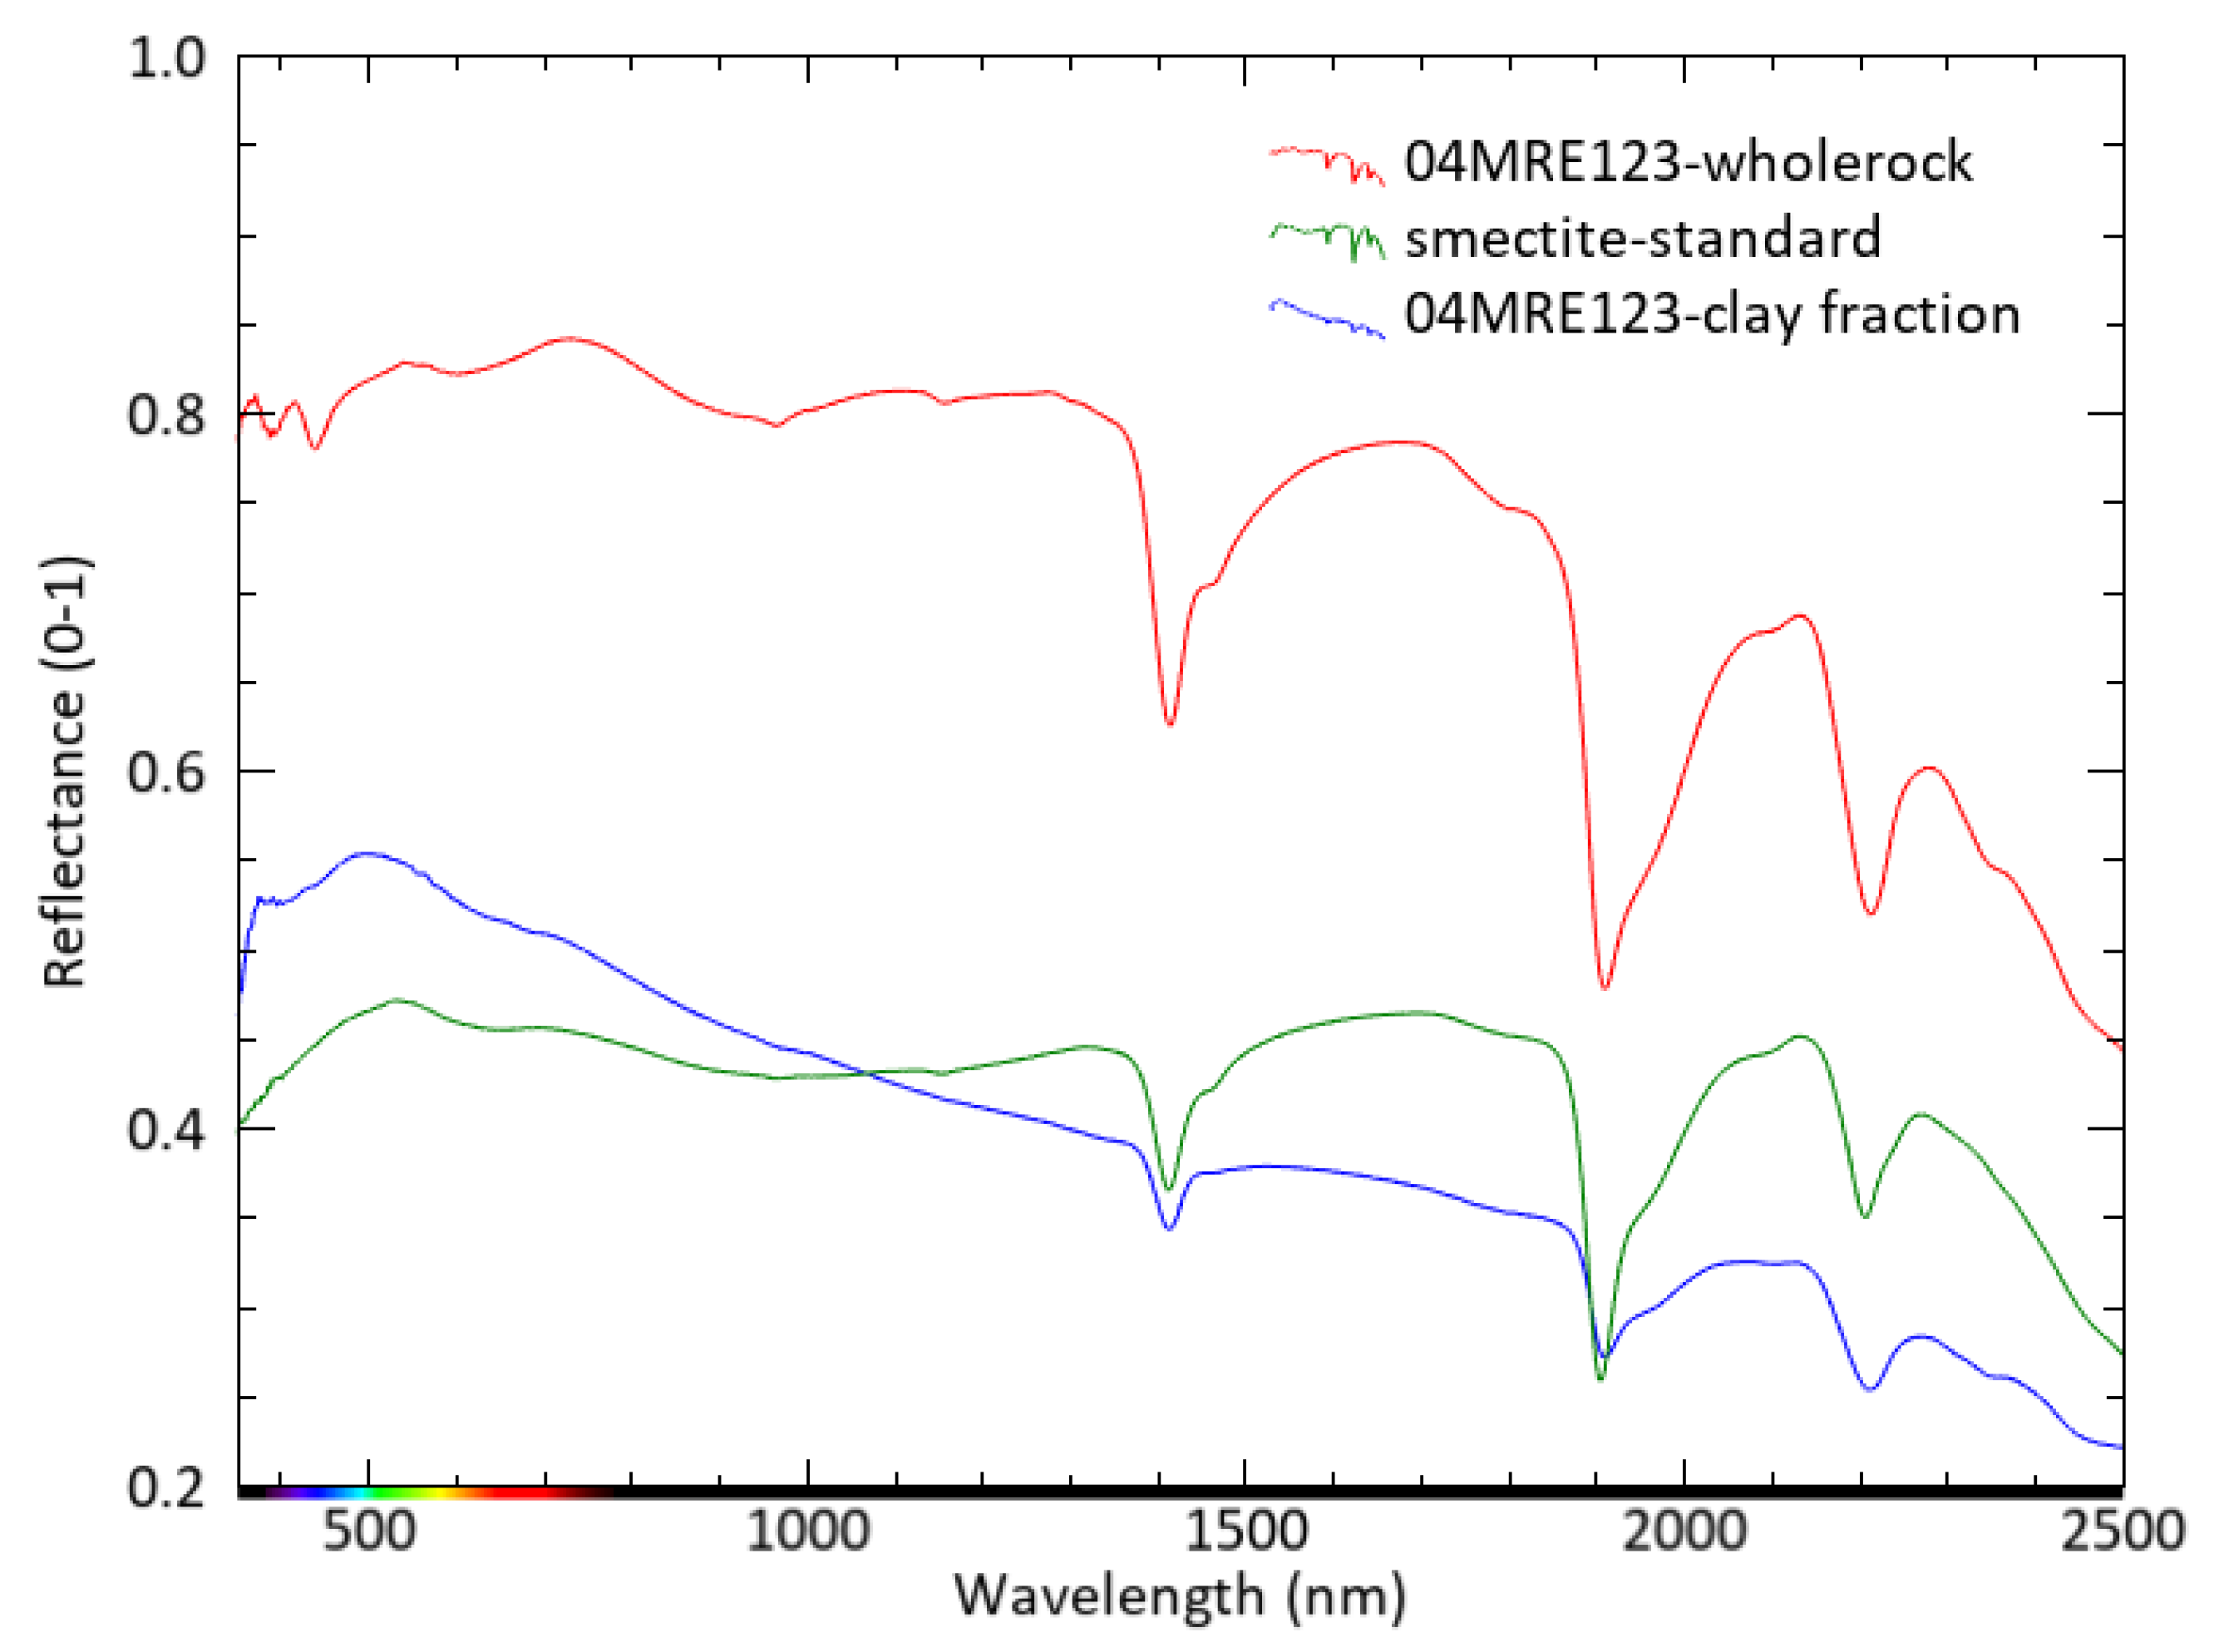
3.4. Reflectance Spectroscopy
4. Discussion: Interlayered Clays Detection with X-ray Diffraction, Scanning Electron Microscopy, Reflectance Spectroscopy or All?
5. Conclusions
Supplementary Materials
Author Contributions
Funding
Institutional Review Board Statement
Informed Consent Statement
Acknowledgments
Conflicts of Interest
References
- Wang, X.; Wang, H. Structural Analysis of Interstratified Illite-Smectite by the Rietveld Method. Crystals 2021, 11, 244. [Google Scholar] [CrossRef]
- Simpson, M.P.; Rae, A.J. Short-wave infrared (SWIR) reflectance spectrometric characterization of lays from geothermal systems of the Taupō Volcanic Zone, New Zealand/clays from geothermal systems of the Taupō Volcanic Zone, New Zealand. Geothermics 2018, 73, 74–90. [Google Scholar] [CrossRef]
- White, N.C.; Hedenquist, J.W. Epithermal Gold Deposits: Styles, Characteristics, and Exploration. SEG Newsl. 1995, 23, 1–9. [Google Scholar] [CrossRef]
- Dong, L.; Tong, X.; Ma, J. Quantitative Investigation of Tomographic Effects in Abnormal Regions of Complex Structures. J. Eng. 2021, 7, 1011–1022. [Google Scholar] [CrossRef]
- Zeng, L.; Yu, H.C.; Gao, Q.F.; Bian, H.B. Mechanical behavior and microstructural mechanism of improved disintegrated carbonaceous mudstone. J. Cent. South Univ. 2020, 27, 1992–2002. [Google Scholar] [CrossRef]
- Inoue, A.; Watanabe, T. Infra-red spectra of interstratified illite/smectite from hydrothermally altered tuffs (Shinzan, Japan) and diagenetic bentonites (Kinnekulle, Sweden). Clay Sci. 1989, 7, 263–275. [Google Scholar]
- Carillo-Rosúa, J.C.; Morales-Ruano, S.; Esteban-Arisbe, I.; Hach-Alí, P.L. Significance of phyllosilicate mineralogy and mineral chemistry in an epithermal environment. Insights from the Palai-Aslica Au-Cu deposit (Alméria, SE Spain). Clays Clay Miner. 2009, 57, 1–24. [Google Scholar] [CrossRef] [Green Version]
- McIntosh, J.A.; Tabor, N.J.; Rosenau, N.A. Mixed-Layer Illite-Smectite in Pennsylvanian-Aged Paleosols: Assessing Sources of Illitization in the Illinois Basin. Minerals 2021, 11, 108. [Google Scholar] [CrossRef]
- Blanc, P.; Gherardi, F.; Vieillard, P.; Marty, N.C.M.; Gailhanou, H.; Gaboreau, S.; Letat, B.; Geloni, C.; Gaucher, E.C.; Madé, B. Thermodynamics for clay minerals: Calculation tools and application to the case of illite/smectite interstratified minerals. J. Appl. Geochem. 2021, 130, 104986. [Google Scholar] [CrossRef]
- Maghsoudi Moud, F.; Deon, F.; van der Meijde, M.; van Ruitenbeek, F.; Hewson, R. Mineral Interpretation Discrepancies Identified between Infrared Reflectance Spectra and X-ray Diffractograms. Sensors 2021, 21, 6924. [Google Scholar] [CrossRef]
- Van der Meer, F.D.; van der Werff, H.M.A.; van Ruitenbeek, F.J.A.; Hecker, C.A.; Bakker, W.A.; Noomen, M.F.; van der Meijde, M.; John, E.; Carranza, M.; de Smeth, B.M.J.; et al. Multi- and hyperspectral geologic remote sensing: A review. Int. J. Appl. Earth Obs. Geoinf. 2012, 14, 112–128. [Google Scholar] [CrossRef]
- Whitney, D.L.; Evans, B.W. Abbreviations of names of rock forming minerals. Am. Min. 2010, 95, 185–187. [Google Scholar] [CrossRef]
- Arribas, A.; Cunningham, G.; Rytuba, J.J.; Rye, O.R.; Kelly, W.C.; Podwysocki, M.H.; McKee, E.H.; Tosdal, R.M. Geology, geochronology, fluid inclusions, and isotope geochemistry of the Rodalquilar gold alunite deposit, Spain. Econ. Geol. 1995, 4, 90795–90822. [Google Scholar] [CrossRef]
- García-Romero, E.; Manchado, E.M.; Suaréz, M.; García-Rivas, J. Spanish Bentonites: A Review and New Data on Their Geology, Mineralogy, and Crystal Chemistry Minerals. Minerals 2019, 9, 696. [Google Scholar] [CrossRef] [Green Version]
- Guatame-Garçia, A. Crystallinity Variations of Smectite-Illite and Kaolin Hydrothermal Alteration Minerals by Using SWIR Spectroscopy, a Study of the Rodalquilar Au-Deposit, SE Spain. Master’s Thesis, University of Twente Faculty of Geo-Information and Earth Observation (ITC), Enschede, The Netherlands, 2013. [Google Scholar]
- Coates, G.F.; Hulse, C.A. A comparison of four methods of size analysis of fine-grained sediments, New Zealand. Geol. Geophys. 1985, 28, 369–380. [Google Scholar] [CrossRef]
- Reynolds, R.C. Interstratified clay minerals. In Crystal Structures of Clay Minerals and Their X-ray Identification; Brindley, G.W., Brown, G., Eds.; Mineralogical Society: London, UK, 1984; pp. 249–303. [Google Scholar]
- Do Campo, M.; Bauluz, B.; Nieto, F.; del Papa, C.; Hongn, F. SEM and TEM evidence of mixed-layer illite-smectite formed by dissolution crystallization processes in continental Paleogene sequences in northwestern Argentina. Clay Miner. 2016, 51, 723–740. [Google Scholar] [CrossRef] [Green Version]
- Hunt, G.R.; Salisbury, J.W. Visible and Near-Infrared Spectra of Minerals and Rocks. I. Silicate Minerals. Mod. Geol. 1970, 1, 283–300. [Google Scholar]
- Bishop, J.L.; Lane, M.D.; Dyar, M.D.; Brown, A.J. Reflectance and emission spectroscopy study of four groups of phyllosilicates: Smectites, kaolinite-serpentines, chlorites and micas. Clay Miner. 2008, 43, 35–54. [Google Scholar] [CrossRef]
- Henley, R.W.; Ellis, A.J. Geothermal systems ancient and modern: A geochemical review. Earth Sci. Rev. 1983, 19, 1–50. [Google Scholar] [CrossRef]
- Reyes, A.G. Petrology of Philippine geothermal systems and the application of alteration mineralogy in their assessment. J. Volcanol. Geotherm. Res. 1990, 43, 279–309. [Google Scholar] [CrossRef]
- Koike, K.; Kouda, R. Recent trends of remote sensing technologies applied to metallic mineral and geothermal resources exploration. J. Min. Mater. Process. Inst. JPN 2016, 132, 96–113. [Google Scholar] [CrossRef] [Green Version]
- Maghsoudi Moud, F.; van Ruitenbeek, F.; Hewson, R.; van der Meijde, M. An Approach to Accuracy Assessment of ASTER Derived Mineral Maps. Remote Sens. 2021, 13, 2499. [Google Scholar] [CrossRef]
- Clark, N.C.; Roush, T. Reflectance spectroscopy: Quantitative analysis techniques for remote sensing applications. J. Geophys. Res. 1984, 89, 6329–6340. [Google Scholar] [CrossRef]

Publisher’s Note: MDPI stays neutral with regard to jurisdictional claims in published maps and institutional affiliations. |
© 2022 by the authors. Licensee MDPI, Basel, Switzerland. This article is an open access article distributed under the terms and conditions of the Creative Commons Attribution (CC BY) license (https://creativecommons.org/licenses/by/4.0/).
Share and Cite
Deon, F.; van Ruitenbeek, F.; van der Werff, H.; van der Meijde, M.; Marcatelli, C. Detection of Interlayered Illite/Smectite Clay Minerals with XRD, SEM Analyses and Reflectance Spectroscopy. Sensors 2022, 22, 3602. https://doi.org/10.3390/s22093602
Deon F, van Ruitenbeek F, van der Werff H, van der Meijde M, Marcatelli C. Detection of Interlayered Illite/Smectite Clay Minerals with XRD, SEM Analyses and Reflectance Spectroscopy. Sensors. 2022; 22(9):3602. https://doi.org/10.3390/s22093602
Chicago/Turabian StyleDeon, Fiorenza, Frank van Ruitenbeek, Harald van der Werff, Mark van der Meijde, and Camilla Marcatelli. 2022. "Detection of Interlayered Illite/Smectite Clay Minerals with XRD, SEM Analyses and Reflectance Spectroscopy" Sensors 22, no. 9: 3602. https://doi.org/10.3390/s22093602
APA StyleDeon, F., van Ruitenbeek, F., van der Werff, H., van der Meijde, M., & Marcatelli, C. (2022). Detection of Interlayered Illite/Smectite Clay Minerals with XRD, SEM Analyses and Reflectance Spectroscopy. Sensors, 22(9), 3602. https://doi.org/10.3390/s22093602